Introduction
This is a report for the insert benchmark with 20M docs and 1 client(s). It is generated by scripts (bash, awk, sed) and Tufte might not be impressed. An overview of the insert benchmark is here and a short update is here. Below, by DBMS, I mean DBMS+version.config. An example is my8020.c10b40 where my means MySQL, 8020 is version 8.0.20 and c10b40 is the name for the configuration file.
The test server is an Intel NUC with 4 cores, 16G RAM and a Samsung 970 EVO. More details are here. Clients and the DBMS share one server. The per-database configs are in the per-database subdirectories here.
The tested DBMS are:
- pg1211.cx5 - Postgres 12.11 and the cx5 config
- pg137.cx5 - Postgres 13.7 and the cx5 config
- pg143.cx5 - Postgres 14.3 and the cx5 config
- pg15b1.cx5 - Postgres 15beta1 and the cx5 config
- pg15b1p1.cx5 - Postgres 15beta1 and the cx5 config with these patches
- pg15b1p1r2.cx5 - Same as pg15b1p1.cx5, just repeated the test
Contents
- Summary
- l.i0: load without secondary indexes
- l.x: create secondary indexes
- l.i1: continue load after secondary indexes created
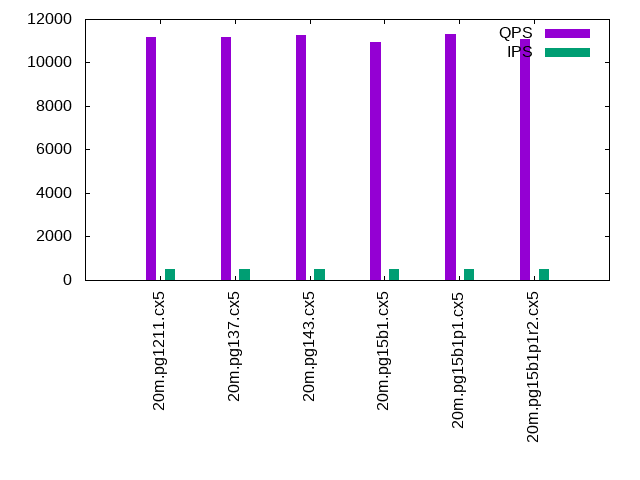
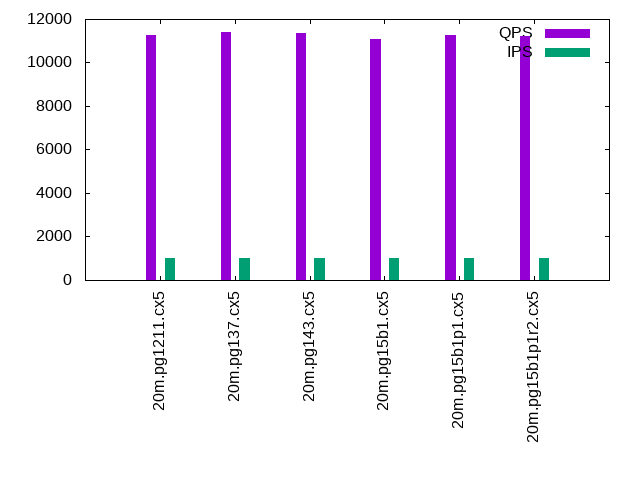
- q100.1: range queries with 100 insert/s per client
- q500.1: range queries with 500 insert/s per client
- q1000.1: range queries with 1000 insert/s per client
Summary
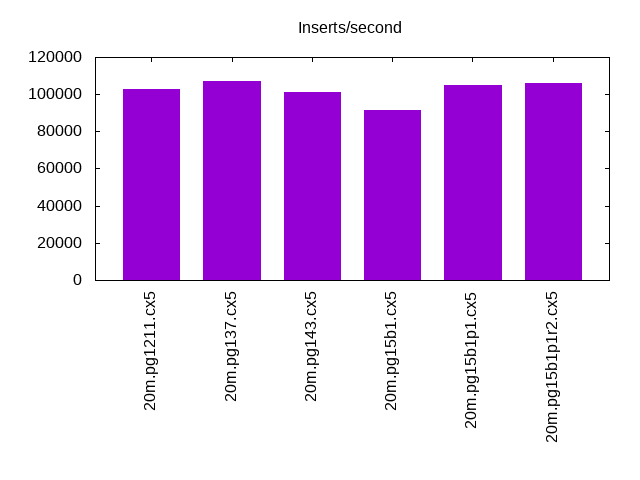
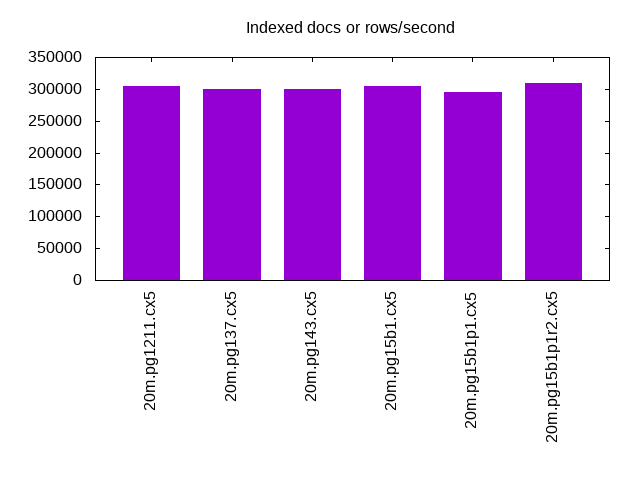
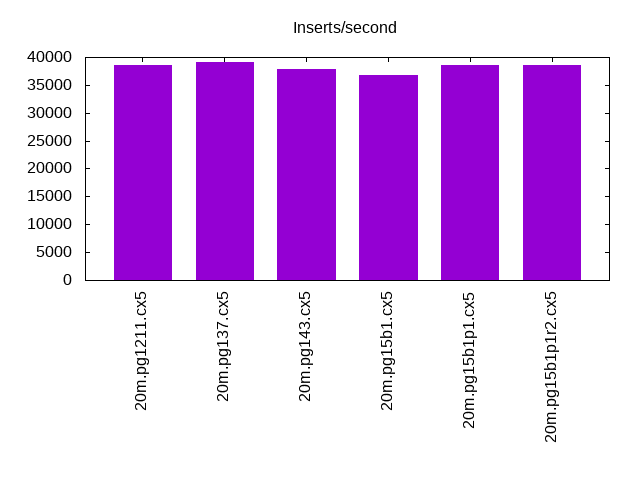
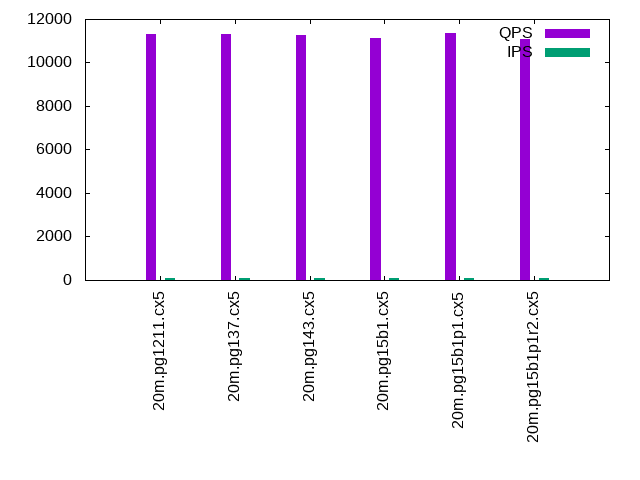
The numbers are inserts/s for l.i0 and l.i1, indexed docs (or rows) /s for l.x and queries/s for q*.2. The values are the average rate over the entire test for inserts (IPS) and queries (QPS). The range of values for IPS and QPS is split into 3 parts: bottom 25%, middle 50%, top 25%. Values in the bottom 25% have a red background, values in the top 25% have a green background and values in the middle have no color. A gray background is used for values that can be ignored because the DBMS did not sustain the target insert rate. Red backgrounds are not used when the minimum value is within 80% of the max value.
| dbms | l.i0 | l.x | l.i1 | q100.1 | q500.1 | q1000.1 |
|---|---|---|---|---|---|---|
| 20m.pg1211.cx5 | 102564 | 304545 | 38536 | 11317 | 11188 | 11260 |
| 20m.pg137.cx5 | 106952 | 300000 | 39139 | 11314 | 11194 | 11382 |
| 20m.pg143.cx5 | 101010 | 300000 | 37879 | 11248 | 11266 | 11337 |
| 20m.pg15b1.cx5 | 91743 | 304545 | 36697 | 11129 | 10942 | 11080 |
| 20m.pg15b1p1.cx5 | 104712 | 295588 | 38610 | 11334 | 11303 | 11245 |
| 20m.pg15b1p1r2.cx5 | 105820 | 309231 | 38610 | 11102 | 11094 | 11209 |
This lists the average rate of inserts/s for the tests that do inserts concurrent with queries. For such tests the query rate is listed in the table above. The read+write tests are setup so that the insert rate should match the target rate every second. Cells that are not at least 95% of the target have a red background to indicate a failure to satisfy the target.
| dbms | q100.1 | q500.1 | q1000.1 |
|---|---|---|---|
| pg1211.cx5 | 100 | 500 | 999 |
| pg137.cx5 | 100 | 499 | 999 |
| pg143.cx5 | 100 | 499 | 999 |
| pg15b1.cx5 | 100 | 499 | 999 |
| pg15b1p1.cx5 | 100 | 499 | 999 |
| pg15b1p1r2.cx5 | 100 | 500 | 999 |
| target | 100 | 500 | 1000 |
l.i0
l.i0: load without secondary indexes. Graphs for performance per 1-second interval are here.
Average throughput:
Insert response time histogram: each cell has the percentage of responses that take <= the time in the header and max is the max response time in seconds. For the max column values in the top 25% of the range have a red background and in the bottom 25% of the range have a green background. The red background is not used when the min value is within 80% of the max value.
| dbms | 256us | 1ms | 4ms | 16ms | 64ms | 256ms | 1s | 4s | 16s | gt | max |
|---|---|---|---|---|---|---|---|---|---|---|---|
| pg1211.cx5 | 94.278 | 5.721 | 0.002 | 0.005 | |||||||
| pg137.cx5 | 98.350 | 1.648 | 0.001 | 0.005 | |||||||
| pg143.cx5 | 81.094 | 18.905 | 0.001 | 0.007 | |||||||
| pg15b1.cx5 | 0.530 | 99.470 | 0.004 | ||||||||
| pg15b1p1.cx5 | 97.492 | 2.508 | 0.001 | 0.004 | |||||||
| pg15b1p1r2.cx5 | 97.969 | 2.030 | 0.001 | 0.004 |
Performance metrics for the DBMS listed above. Some are normalized by throughput, others are not. Legend for results is here.
ips	qps	rps	rmbps	wps	wmbps	rpq	rkbpq	wpi	wkbpi	csps	cpups	cspq	cpupq	dbgb1	dbgb2	rss	maxop	p50	p99	tag
102564	0	0	0.0	66.8	43.3	0.000	0.000	0.001	0.432	12489	42.5	0.122	17	1.9	5.2	0.0	0.005	103387	83309	20m.pg1211.cx5
106952	0	0	0.0	69.3	44.7	0.000	0.000	0.001	0.428	12935	43.5	0.121	16	1.9	5.2	0.0	0.005	107483	85507	20m.pg137.cx5
101010	0	0	0.0	67.3	43.4	0.000	0.000	0.001	0.439	12252	43.0	0.121	17	1.9	5.2	0.0	0.007	101092	94795	20m.pg143.cx5
91743	0	0	0.0	61.3	39.3	0.000	0.000	0.001	0.439	11049	41.8	0.120	18	1.9	5.2	0.0	0.004	92435	74619	20m.pg15b1.cx5
104712	0	0	0.0	67.4	43.5	0.000	0.000	0.001	0.426	12668	43.9	0.121	17	1.9	5.2	0.0	0.004	105185	85707	20m.pg15b1p1.cx5
105820	0	0	0.0	67.9	44.2	0.000	0.000	0.001	0.427	12762	44.1	0.121	17	1.9	5.2	0.0	0.004	105985	90814	20m.pg15b1p1r2.cx5
l.x
l.x: create secondary indexes.
Average throughput:
Performance metrics for the DBMS listed above. Some are normalized by throughput, others are not. Legend for results is here.
ips	qps	rps	rmbps	wps	wmbps	rpq	rkbpq	wpi	wkbpi	csps	cpups	cspq	cpupq	dbgb1	dbgb2	rss	maxop	p50	p99	tag
304545	0	0	0.0	68.2	71.2	0.000	0.000	0.000	0.240	2015	23.6	0.007	3	3.7	8.6	0.0	0.005	NA	NA	20m.pg1211.cx5
300000	0	0	0.0	64.5	66.3	0.000	0.000	0.000	0.226	1944	23.7	0.006	3	3.7	8.6	0.0	0.002	NA	NA	20m.pg137.cx5
300000	0	0	0.0	57.5	61.2	0.000	0.000	0.000	0.209	1909	23.4	0.006	3	3.7	8.6	0.0	0.002	NA	NA	20m.pg143.cx5
304545	0	0	0.0	67.3	71.5	0.000	0.000	0.000	0.240	2073	23.7	0.007	3	3.7	8.6	0.0	0.002	NA	NA	20m.pg15b1.cx5
295588	0	0	0.0	56.8	60.7	0.000	0.000	0.000	0.210	1932	23.4	0.007	3	3.7	8.6	0.0	0.002	NA	NA	20m.pg15b1p1.cx5
309231	0	0	0.0	75.1	78.2	0.000	0.000	0.000	0.259	2001	23.2	0.006	3	3.7	8.6	0.0	0.002	NA	NA	20m.pg15b1p1r2.cx5
l.i1
l.i1: continue load after secondary indexes created. Graphs for performance per 1-second interval are here.
Average throughput:
Insert response time histogram: each cell has the percentage of responses that take <= the time in the header and max is the max response time in seconds. For the max column values in the top 25% of the range have a red background and in the bottom 25% of the range have a green background. The red background is not used when the min value is within 80% of the max value.
| dbms | 256us | 1ms | 4ms | 16ms | 64ms | 256ms | 1s | 4s | 16s | gt | max |
|---|---|---|---|---|---|---|---|---|---|---|---|
| pg1211.cx5 | 99.852 | 0.121 | 0.024 | 0.003 | nonzero | 0.362 | |||||
| pg137.cx5 | 99.843 | 0.130 | 0.024 | 0.003 | nonzero | 0.412 | |||||
| pg143.cx5 | 99.851 | 0.121 | 0.027 | 0.001 | nonzero | 0.478 | |||||
| pg15b1.cx5 | 99.849 | 0.125 | 0.026 | 0.001 | 0.092 | ||||||
| pg15b1p1.cx5 | 99.855 | 0.117 | 0.027 | 0.002 | nonzero | 0.329 | |||||
| pg15b1p1r2.cx5 | 99.870 | 0.103 | 0.026 | 0.001 | 0.205 |
Performance metrics for the DBMS listed above. Some are normalized by throughput, others are not. Legend for results is here.
ips	qps	rps	rmbps	wps	wmbps	rpq	rkbpq	wpi	wkbpi	csps	cpups	cspq	cpupq	dbgb1	dbgb2	rss	maxop	p50	p99	tag
38536	0	0	0.0	196.5	65.7	0.000	0.000	0.005	1.746	9774	35.7	0.254	37	8.2	19.4	0.0	0.362	40069	10637	20m.pg1211.cx5
39139	0	0	0.0	202.1	68.1	0.000	0.000	0.005	1.783	9920	35.7	0.253	36	8.2	19.9	0.0	0.412	40506	9846	20m.pg137.cx5
37879	0	0	0.0	154.8	63.8	0.000	0.000	0.004	1.724	9567	35.8	0.253	38	8.2	20.8	0.0	0.478	39556	13981	20m.pg143.cx5
36697	0	0	0.0	172.6	63.7	0.000	0.000	0.005	1.778	9299	35.9	0.253	39	8.2	21.2	0.0	0.092	38058	13189	20m.pg15b1.cx5
38610	0	0	0.0	154.1	63.6	0.000	0.000	0.004	1.686	9733	36.4	0.252	38	8.2	20.6	0.2	0.329	40206	11935	20m.pg15b1p1.cx5
38610	0	0	0.0	152.4	63.2	0.000	0.000	0.004	1.675	9731	36.3	0.252	38	8.2	20.4	0.0	0.205	40207	10588	20m.pg15b1p1r2.cx5
q100.1
q100.1: range queries with 100 insert/s per client. Graphs for performance per 1-second interval are here.
Average throughput:
Query response time histogram: each cell has the percentage of responses that take <= the time in the header and max is the max response time in seconds. For max values in the top 25% of the range have a red background and in the bottom 25% of the range have a green background. The red background is not used when the min value is within 80% of the max value.
| dbms | 256us | 1ms | 4ms | 16ms | 64ms | 256ms | 1s | 4s | 16s | gt | max |
|---|---|---|---|---|---|---|---|---|---|---|---|
| pg1211.cx5 | 99.998 | 0.002 | 0.001 | nonzero | 0.006 | ||||||
| pg137.cx5 | 99.996 | 0.003 | 0.001 | nonzero | 0.006 | ||||||
| pg143.cx5 | 99.997 | 0.002 | 0.001 | nonzero | 0.007 | ||||||
| pg15b1.cx5 | 99.996 | 0.003 | 0.001 | 0.004 | |||||||
| pg15b1p1.cx5 | 99.997 | 0.002 | 0.001 | nonzero | 0.004 | ||||||
| pg15b1p1r2.cx5 | 99.997 | 0.002 | 0.001 | nonzero | 0.005 |
Insert response time histogram: each cell has the percentage of responses that take <= the time in the header and max is the max response time in seconds. For max values in the top 25% of the range have a red background and in the bottom 25% of the range have a green background. The red background is not used when the min value is within 80% of the max value.
| dbms | 256us | 1ms | 4ms | 16ms | 64ms | 256ms | 1s | 4s | 16s | gt | max |
|---|---|---|---|---|---|---|---|---|---|---|---|
| pg1211.cx5 | 99.993 | 0.007 | 0.005 | ||||||||
| pg137.cx5 | 99.993 | 0.007 | 0.005 | ||||||||
| pg143.cx5 | 99.993 | 0.007 | 0.005 | ||||||||
| pg15b1.cx5 | 99.965 | 0.035 | 0.006 | ||||||||
| pg15b1p1.cx5 | 99.958 | 0.042 | 0.006 | ||||||||
| pg15b1p1r2.cx5 | 99.958 | 0.042 | 0.006 |
Performance metrics for the DBMS listed above. Some are normalized by throughput, others are not. Legend for results is here.
ips	qps	rps	rmbps	wps	wmbps	rpq	rkbpq	wpi	wkbpi	csps	cpups	cspq	cpupq	dbgb1	dbgb2	rss	maxop	p50	p99	tag
100	11317	0	0.0	205.5	4.6	0.000	0.000	2.057	47.332	43496	28.0	3.843	99	8.3	10.3	0.0	0.006	11316	11176	20m.pg1211.cx5
100	11314	0	0.0	204.9	4.3	0.000	0.000	2.053	44.005	43493	28.1	3.844	99	8.3	10.2	0.0	0.006	11316	11188	20m.pg137.cx5
100	11248	0	0.0	197.0	4.4	0.000	0.000	1.972	44.712	43173	26.7	3.838	95	8.3	10.8	0.0	0.007	11252	11124	20m.pg143.cx5
100	11129	0	0.0	195.6	4.3	0.000	0.000	1.960	44.616	42698	26.6	3.837	96	8.3	10.8	0.0	0.004	11129	11012	20m.pg15b1.cx5
100	11334	0	0.0	197.9	4.4	0.000	0.000	1.983	44.693	43478	26.6	3.836	94	8.3	10.8	0.0	0.004	11332	11204	20m.pg15b1p1.cx5
100	11102	0	0.0	198.5	4.4	0.000	0.000	1.987	44.591	42582	26.7	3.836	96	8.3	10.8	0.0	0.005	11108	10980	20m.pg15b1p1r2.cx5
q500.1
q500.1: range queries with 500 insert/s per client. Graphs for performance per 1-second interval are here.
Average throughput:
Query response time histogram: each cell has the percentage of responses that take <= the time in the header and max is the max response time in seconds. For max values in the top 25% of the range have a red background and in the bottom 25% of the range have a green background. The red background is not used when the min value is within 80% of the max value.
| dbms | 256us | 1ms | 4ms | 16ms | 64ms | 256ms | 1s | 4s | 16s | gt | max |
|---|---|---|---|---|---|---|---|---|---|---|---|
| pg1211.cx5 | 99.984 | 0.011 | 0.005 | nonzero | 0.007 | ||||||
| pg137.cx5 | 99.984 | 0.011 | 0.005 | nonzero | 0.008 | ||||||
| pg143.cx5 | 99.980 | 0.014 | 0.006 | nonzero | 0.006 | ||||||
| pg15b1.cx5 | 99.979 | 0.015 | 0.006 | nonzero | 0.006 | ||||||
| pg15b1p1.cx5 | 99.981 | 0.014 | 0.006 | nonzero | 0.005 | ||||||
| pg15b1p1r2.cx5 | 99.980 | 0.015 | 0.006 | nonzero | 0.006 |
Insert response time histogram: each cell has the percentage of responses that take <= the time in the header and max is the max response time in seconds. For max values in the top 25% of the range have a red background and in the bottom 25% of the range have a green background. The red background is not used when the min value is within 80% of the max value.
| dbms | 256us | 1ms | 4ms | 16ms | 64ms | 256ms | 1s | 4s | 16s | gt | max |
|---|---|---|---|---|---|---|---|---|---|---|---|
| pg1211.cx5 | 99.992 | 0.008 | 0.010 | ||||||||
| pg137.cx5 | 99.994 | 0.006 | 0.009 | ||||||||
| pg143.cx5 | 99.976 | 0.024 | 0.015 | ||||||||
| pg15b1.cx5 | 99.982 | 0.018 | 0.011 | ||||||||
| pg15b1p1.cx5 | 99.965 | 0.035 | 0.008 | ||||||||
| pg15b1p1r2.cx5 | 99.975 | 0.025 | 0.009 |
Performance metrics for the DBMS listed above. Some are normalized by throughput, others are not. Legend for results is here.
ips	qps	rps	rmbps	wps	wmbps	rpq	rkbpq	wpi	wkbpi	csps	cpups	cspq	cpupq	dbgb1	dbgb2	rss	maxop	p50	p99	tag
500	11188	0	0.0	373.7	13.0	0.000	0.000	0.748	26.689	43112	28.6	3.853	102	9.7	12.7	0.0	0.007	11188	11044	20m.pg1211.cx5
499	11194	0	0.0	376.8	13.1	0.000	0.000	0.754	26.786	43141	28.6	3.854	102	9.7	12.8	0.0	0.008	11204	11044	20m.pg137.cx5
499	11266	0	0.0	376.0	12.4	0.000	0.000	0.753	25.408	43369	27.1	3.849	96	9.7	13.3	0.0	0.006	11268	11124	20m.pg143.cx5
499	10942	0	0.0	375.4	12.3	0.000	0.000	0.752	25.311	42102	27.2	3.848	99	9.7	13.3	0.0	0.006	10948	10820	20m.pg15b1.cx5
499	11303	0	0.0	375.9	12.4	0.000	0.000	0.753	25.398	43479	27.0	3.847	96	9.7	13.3	0.0	0.005	11301	11172	20m.pg15b1p1.cx5
500	11094	0	0.0	376.1	12.4	0.000	0.000	0.753	25.396	42675	27.0	3.847	97	9.7	13.3	0.0	0.006	11092	10972	20m.pg15b1p1r2.cx5
q1000.1
q1000.1: range queries with 1000 insert/s per client. Graphs for performance per 1-second interval are here.
Average throughput:
Query response time histogram: each cell has the percentage of responses that take <= the time in the header and max is the max response time in seconds. For max values in the top 25% of the range have a red background and in the bottom 25% of the range have a green background. The red background is not used when the min value is within 80% of the max value.
| dbms | 256us | 1ms | 4ms | 16ms | 64ms | 256ms | 1s | 4s | 16s | gt | max |
|---|---|---|---|---|---|---|---|---|---|---|---|
| pg1211.cx5 | 99.956 | 0.034 | 0.009 | nonzero | 0.007 | ||||||
| pg137.cx5 | 99.957 | 0.034 | 0.009 | nonzero | 0.008 | ||||||
| pg143.cx5 | 99.953 | 0.037 | 0.010 | nonzero | 0.006 | ||||||
| pg15b1.cx5 | 99.953 | 0.037 | 0.010 | nonzero | 0.006 | ||||||
| pg15b1p1.cx5 | 99.954 | 0.036 | 0.010 | nonzero | 0.007 | ||||||
| pg15b1p1r2.cx5 | 99.954 | 0.036 | 0.010 | nonzero | 0.015 |
Insert response time histogram: each cell has the percentage of responses that take <= the time in the header and max is the max response time in seconds. For max values in the top 25% of the range have a red background and in the bottom 25% of the range have a green background. The red background is not used when the min value is within 80% of the max value.
| dbms | 256us | 1ms | 4ms | 16ms | 64ms | 256ms | 1s | 4s | 16s | gt | max |
|---|---|---|---|---|---|---|---|---|---|---|---|
| pg1211.cx5 | 98.313 | 1.667 | 0.019 | 0.035 | |||||||
| pg137.cx5 | 98.281 | 1.699 | 0.019 | 0.035 | |||||||
| pg143.cx5 | 98.359 | 1.631 | 0.010 | 0.044 | |||||||
| pg15b1.cx5 | 98.369 | 1.620 | 0.011 | 0.036 | |||||||
| pg15b1p1.cx5 | 98.393 | 1.597 | 0.010 | 0.035 | |||||||
| pg15b1p1r2.cx5 | 98.381 | 1.610 | 0.009 | 0.035 |
Performance metrics for the DBMS listed above. Some are normalized by throughput, others are not. Legend for results is here.
ips	qps	rps	rmbps	wps	wmbps	rpq	rkbpq	wpi	wkbpi	csps	cpups	cspq	cpupq	dbgb1	dbgb2	rss	maxop	p50	p99	tag
999	11260	7	0.1	482.9	18.8	0.001	0.005	0.483	19.277	43532	29.0	3.866	103	12.0	15.8	0.0	0.007	11268	11108	20m.pg1211.cx5
999	11382	7	0.1	481.5	18.8	0.001	0.005	0.482	19.281	44015	29.1	3.867	102	12.0	15.8	0.0	0.008	11389	11220	20m.pg137.cx5
999	11337	6	0.1	512.5	17.5	0.001	0.005	0.513	17.935	43774	27.6	3.861	97	12.0	16.7	0.0	0.006	11347	11172	20m.pg143.cx5
999	11080	8	0.1	511.5	17.5	0.001	0.006	0.512	17.896	42752	27.6	3.858	100	12.0	16.7	0.0	0.006	11079	10922	20m.pg15b1.cx5
999	11245	6	0.1	512.0	17.5	0.001	0.005	0.513	17.935	43387	27.6	3.858	98	12.0	16.7	0.0	0.007	11252	11092	20m.pg15b1p1.cx5
999	11209	6	0.1	512.3	17.5	0.001	0.005	0.513	17.932	43241	27.6	3.858	98	12.0	16.7	0.0	0.015	11208	11060	20m.pg15b1p1r2.cx5
l.i0
l.i0: load without secondary indexes
Performance metrics for all DBMS, not just the ones listed above. Some are normalized by throughput, others are not. Legend for results is here.
ips	qps	rps	rmbps	wps	wmbps	rpq	rkbpq	wpi	wkbpi	csps	cpups	cspq	cpupq	dbgb1	dbgb2	rss	maxop	p50	p99	tag
102564	0	0	0.0	66.8	43.3	0.000	0.000	0.001	0.432	12489	42.5	0.122	17	1.9	5.2	0.0	0.005	103387	83309	20m.pg1211.cx5
106952	0	0	0.0	69.3	44.7	0.000	0.000	0.001	0.428	12935	43.5	0.121	16	1.9	5.2	0.0	0.005	107483	85507	20m.pg137.cx5
101010	0	0	0.0	67.3	43.4	0.000	0.000	0.001	0.439	12252	43.0	0.121	17	1.9	5.2	0.0	0.007	101092	94795	20m.pg143.cx5
91743	0	0	0.0	61.3	39.3	0.000	0.000	0.001	0.439	11049	41.8	0.120	18	1.9	5.2	0.0	0.004	92435	74619	20m.pg15b1.cx5
104712	0	0	0.0	67.4	43.5	0.000	0.000	0.001	0.426	12668	43.9	0.121	17	1.9	5.2	0.0	0.004	105185	85707	20m.pg15b1p1.cx5
105820	0	0	0.0	67.9	44.2	0.000	0.000	0.001	0.427	12762	44.1	0.121	17	1.9	5.2	0.0	0.004	105985	90814	20m.pg15b1p1r2.cx5
l.x
l.x: create secondary indexes
Performance metrics for all DBMS, not just the ones listed above. Some are normalized by throughput, others are not. Legend for results is here.
ips	qps	rps	rmbps	wps	wmbps	rpq	rkbpq	wpi	wkbpi	csps	cpups	cspq	cpupq	dbgb1	dbgb2	rss	maxop	p50	p99	tag
304545	0	0	0.0	68.2	71.2	0.000	0.000	0.000	0.240	2015	23.6	0.007	3	3.7	8.6	0.0	0.005	NA	NA	20m.pg1211.cx5
300000	0	0	0.0	64.5	66.3	0.000	0.000	0.000	0.226	1944	23.7	0.006	3	3.7	8.6	0.0	0.002	NA	NA	20m.pg137.cx5
300000	0	0	0.0	57.5	61.2	0.000	0.000	0.000	0.209	1909	23.4	0.006	3	3.7	8.6	0.0	0.002	NA	NA	20m.pg143.cx5
304545	0	0	0.0	67.3	71.5	0.000	0.000	0.000	0.240	2073	23.7	0.007	3	3.7	8.6	0.0	0.002	NA	NA	20m.pg15b1.cx5
295588	0	0	0.0	56.8	60.7	0.000	0.000	0.000	0.210	1932	23.4	0.007	3	3.7	8.6	0.0	0.002	NA	NA	20m.pg15b1p1.cx5
309231	0	0	0.0	75.1	78.2	0.000	0.000	0.000	0.259	2001	23.2	0.006	3	3.7	8.6	0.0	0.002	NA	NA	20m.pg15b1p1r2.cx5
l.i1
l.i1: continue load after secondary indexes created
Performance metrics for all DBMS, not just the ones listed above. Some are normalized by throughput, others are not. Legend for results is here.
ips	qps	rps	rmbps	wps	wmbps	rpq	rkbpq	wpi	wkbpi	csps	cpups	cspq	cpupq	dbgb1	dbgb2	rss	maxop	p50	p99	tag
38536	0	0	0.0	196.5	65.7	0.000	0.000	0.005	1.746	9774	35.7	0.254	37	8.2	19.4	0.0	0.362	40069	10637	20m.pg1211.cx5
39139	0	0	0.0	202.1	68.1	0.000	0.000	0.005	1.783	9920	35.7	0.253	36	8.2	19.9	0.0	0.412	40506	9846	20m.pg137.cx5
37879	0	0	0.0	154.8	63.8	0.000	0.000	0.004	1.724	9567	35.8	0.253	38	8.2	20.8	0.0	0.478	39556	13981	20m.pg143.cx5
36697	0	0	0.0	172.6	63.7	0.000	0.000	0.005	1.778	9299	35.9	0.253	39	8.2	21.2	0.0	0.092	38058	13189	20m.pg15b1.cx5
38610	0	0	0.0	154.1	63.6	0.000	0.000	0.004	1.686	9733	36.4	0.252	38	8.2	20.6	0.2	0.329	40206	11935	20m.pg15b1p1.cx5
38610	0	0	0.0	152.4	63.2	0.000	0.000	0.004	1.675	9731	36.3	0.252	38	8.2	20.4	0.0	0.205	40207	10588	20m.pg15b1p1r2.cx5
q100.1
q100.1: range queries with 100 insert/s per client
Performance metrics for all DBMS, not just the ones listed above. Some are normalized by throughput, others are not. Legend for results is here.
ips	qps	rps	rmbps	wps	wmbps	rpq	rkbpq	wpi	wkbpi	csps	cpups	cspq	cpupq	dbgb1	dbgb2	rss	maxop	p50	p99	tag
100	11317	0	0.0	205.5	4.6	0.000	0.000	2.057	47.332	43496	28.0	3.843	99	8.3	10.3	0.0	0.006	11316	11176	20m.pg1211.cx5
100	11314	0	0.0	204.9	4.3	0.000	0.000	2.053	44.005	43493	28.1	3.844	99	8.3	10.2	0.0	0.006	11316	11188	20m.pg137.cx5
100	11248	0	0.0	197.0	4.4	0.000	0.000	1.972	44.712	43173	26.7	3.838	95	8.3	10.8	0.0	0.007	11252	11124	20m.pg143.cx5
100	11129	0	0.0	195.6	4.3	0.000	0.000	1.960	44.616	42698	26.6	3.837	96	8.3	10.8	0.0	0.004	11129	11012	20m.pg15b1.cx5
100	11334	0	0.0	197.9	4.4	0.000	0.000	1.983	44.693	43478	26.6	3.836	94	8.3	10.8	0.0	0.004	11332	11204	20m.pg15b1p1.cx5
100	11102	0	0.0	198.5	4.4	0.000	0.000	1.987	44.591	42582	26.7	3.836	96	8.3	10.8	0.0	0.005	11108	10980	20m.pg15b1p1r2.cx5
q500.1
q500.1: range queries with 500 insert/s per client
Performance metrics for all DBMS, not just the ones listed above. Some are normalized by throughput, others are not. Legend for results is here.
ips	qps	rps	rmbps	wps	wmbps	rpq	rkbpq	wpi	wkbpi	csps	cpups	cspq	cpupq	dbgb1	dbgb2	rss	maxop	p50	p99	tag
500	11188	0	0.0	373.7	13.0	0.000	0.000	0.748	26.689	43112	28.6	3.853	102	9.7	12.7	0.0	0.007	11188	11044	20m.pg1211.cx5
499	11194	0	0.0	376.8	13.1	0.000	0.000	0.754	26.786	43141	28.6	3.854	102	9.7	12.8	0.0	0.008	11204	11044	20m.pg137.cx5
499	11266	0	0.0	376.0	12.4	0.000	0.000	0.753	25.408	43369	27.1	3.849	96	9.7	13.3	0.0	0.006	11268	11124	20m.pg143.cx5
499	10942	0	0.0	375.4	12.3	0.000	0.000	0.752	25.311	42102	27.2	3.848	99	9.7	13.3	0.0	0.006	10948	10820	20m.pg15b1.cx5
499	11303	0	0.0	375.9	12.4	0.000	0.000	0.753	25.398	43479	27.0	3.847	96	9.7	13.3	0.0	0.005	11301	11172	20m.pg15b1p1.cx5
500	11094	0	0.0	376.1	12.4	0.000	0.000	0.753	25.396	42675	27.0	3.847	97	9.7	13.3	0.0	0.006	11092	10972	20m.pg15b1p1r2.cx5
q1000.1
q1000.1: range queries with 1000 insert/s per client
Performance metrics for all DBMS, not just the ones listed above. Some are normalized by throughput, others are not. Legend for results is here.
ips	qps	rps	rmbps	wps	wmbps	rpq	rkbpq	wpi	wkbpi	csps	cpups	cspq	cpupq	dbgb1	dbgb2	rss	maxop	p50	p99	tag
999	11260	7	0.1	482.9	18.8	0.001	0.005	0.483	19.277	43532	29.0	3.866	103	12.0	15.8	0.0	0.007	11268	11108	20m.pg1211.cx5
999	11382	7	0.1	481.5	18.8	0.001	0.005	0.482	19.281	44015	29.1	3.867	102	12.0	15.8	0.0	0.008	11389	11220	20m.pg137.cx5
999	11337	6	0.1	512.5	17.5	0.001	0.005	0.513	17.935	43774	27.6	3.861	97	12.0	16.7	0.0	0.006	11347	11172	20m.pg143.cx5
999	11080	8	0.1	511.5	17.5	0.001	0.006	0.512	17.896	42752	27.6	3.858	100	12.0	16.7	0.0	0.006	11079	10922	20m.pg15b1.cx5
999	11245	6	0.1	512.0	17.5	0.001	0.005	0.513	17.935	43387	27.6	3.858	98	12.0	16.7	0.0	0.007	11252	11092	20m.pg15b1p1.cx5
999	11209	6	0.1	512.3	17.5	0.001	0.005	0.513	17.932	43241	27.6	3.858	98	12.0	16.7	0.0	0.015	11208	11060	20m.pg15b1p1r2.cx5
l.i0
- l.i0: load without secondary indexes
- Legend for results is here.
- Each entry lists the percentage of responses that fit in that bucket (slower than max time for previous bucket, faster than min time for next bucket).
Insert response time histogram
256us	1ms	4ms	16ms	64ms	256ms	1s	4s	16s	gt	max	tag
0.000	94.278	5.721	0.002	0.000	0.000	0.000	0.000	0.000	0.000	0.005	pg1211.cx5
0.000	98.350	1.648	0.001	0.000	0.000	0.000	0.000	0.000	0.000	0.005	pg137.cx5
0.000	81.094	18.905	0.001	0.000	0.000	0.000	0.000	0.000	0.000	0.007	pg143.cx5
0.000	0.530	99.470	0.000	0.000	0.000	0.000	0.000	0.000	0.000	0.004	pg15b1.cx5
0.000	97.492	2.508	0.001	0.000	0.000	0.000	0.000	0.000	0.000	0.004	pg15b1p1.cx5
0.000	97.969	2.030	0.001	0.000	0.000	0.000	0.000	0.000	0.000	0.004	pg15b1p1r2.cx5
l.x
- l.x: create secondary indexes
- Legend for results is here.
- Each entry lists the percentage of responses that fit in that bucket (slower than max time for previous bucket, faster than min time for next bucket).
TODO - determine whether there is data for create index response time
l.i1
- l.i1: continue load after secondary indexes created
- Legend for results is here.
- Each entry lists the percentage of responses that fit in that bucket (slower than max time for previous bucket, faster than min time for next bucket).
Insert response time histogram
256us	1ms	4ms	16ms	64ms	256ms	1s	4s	16s	gt	max	tag
0.000	0.000	99.852	0.121	0.024	0.003	nonzero	0.000	0.000	0.000	0.362	pg1211.cx5
0.000	0.000	99.843	0.130	0.024	0.003	nonzero	0.000	0.000	0.000	0.412	pg137.cx5
0.000	0.000	99.851	0.121	0.027	0.001	nonzero	0.000	0.000	0.000	0.478	pg143.cx5
0.000	0.000	99.849	0.125	0.026	0.001	0.000	0.000	0.000	0.000	0.092	pg15b1.cx5
0.000	0.000	99.855	0.117	0.027	0.002	nonzero	0.000	0.000	0.000	0.329	pg15b1p1.cx5
0.000	0.000	99.870	0.103	0.026	0.001	0.000	0.000	0.000	0.000	0.205	pg15b1p1r2.cx5
q100.1
- q100.1: range queries with 100 insert/s per client
- Legend for results is here.
- Each entry lists the percentage of responses that fit in that bucket (slower than max time for previous bucket, faster than min time for next bucket).
Query response time histogram
256us	1ms	4ms	16ms	64ms	256ms	1s	4s	16s	gt	max	tag
99.998	0.002	0.001	nonzero	0.000	0.000	0.000	0.000	0.000	0.000	0.006	pg1211.cx5
99.996	0.003	0.001	nonzero	0.000	0.000	0.000	0.000	0.000	0.000	0.006	pg137.cx5
99.997	0.002	0.001	nonzero	0.000	0.000	0.000	0.000	0.000	0.000	0.007	pg143.cx5
99.996	0.003	0.001	0.000	0.000	0.000	0.000	0.000	0.000	0.000	0.004	pg15b1.cx5
99.997	0.002	0.001	nonzero	0.000	0.000	0.000	0.000	0.000	0.000	0.004	pg15b1p1.cx5
99.997	0.002	0.001	nonzero	0.000	0.000	0.000	0.000	0.000	0.000	0.005	pg15b1p1r2.cx5
Insert response time histogram
256us	1ms	4ms	16ms	64ms	256ms	1s	4s	16s	gt	max	tag
0.000	0.000	99.993	0.007	0.000	0.000	0.000	0.000	0.000	0.000	0.005	pg1211.cx5
0.000	0.000	99.993	0.007	0.000	0.000	0.000	0.000	0.000	0.000	0.005	pg137.cx5
0.000	0.000	99.993	0.007	0.000	0.000	0.000	0.000	0.000	0.000	0.005	pg143.cx5
0.000	0.000	99.965	0.035	0.000	0.000	0.000	0.000	0.000	0.000	0.006	pg15b1.cx5
0.000	0.000	99.958	0.042	0.000	0.000	0.000	0.000	0.000	0.000	0.006	pg15b1p1.cx5
0.000	0.000	99.958	0.042	0.000	0.000	0.000	0.000	0.000	0.000	0.006	pg15b1p1r2.cx5
q500.1
- q500.1: range queries with 500 insert/s per client
- Legend for results is here.
- Each entry lists the percentage of responses that fit in that bucket (slower than max time for previous bucket, faster than min time for next bucket).
Query response time histogram
256us	1ms	4ms	16ms	64ms	256ms	1s	4s	16s	gt	max	tag
99.984	0.011	0.005	nonzero	0.000	0.000	0.000	0.000	0.000	0.000	0.007	pg1211.cx5
99.984	0.011	0.005	nonzero	0.000	0.000	0.000	0.000	0.000	0.000	0.008	pg137.cx5
99.980	0.014	0.006	nonzero	0.000	0.000	0.000	0.000	0.000	0.000	0.006	pg143.cx5
99.979	0.015	0.006	nonzero	0.000	0.000	0.000	0.000	0.000	0.000	0.006	pg15b1.cx5
99.981	0.014	0.006	nonzero	0.000	0.000	0.000	0.000	0.000	0.000	0.005	pg15b1p1.cx5
99.980	0.015	0.006	nonzero	0.000	0.000	0.000	0.000	0.000	0.000	0.006	pg15b1p1r2.cx5
Insert response time histogram
256us	1ms	4ms	16ms	64ms	256ms	1s	4s	16s	gt	max	tag
0.000	0.000	99.992	0.008	0.000	0.000	0.000	0.000	0.000	0.000	0.010	pg1211.cx5
0.000	0.000	99.994	0.006	0.000	0.000	0.000	0.000	0.000	0.000	0.009	pg137.cx5
0.000	0.000	99.976	0.024	0.000	0.000	0.000	0.000	0.000	0.000	0.015	pg143.cx5
0.000	0.000	99.982	0.018	0.000	0.000	0.000	0.000	0.000	0.000	0.011	pg15b1.cx5
0.000	0.000	99.965	0.035	0.000	0.000	0.000	0.000	0.000	0.000	0.008	pg15b1p1.cx5
0.000	0.000	99.975	0.025	0.000	0.000	0.000	0.000	0.000	0.000	0.009	pg15b1p1r2.cx5
q1000.1
- q1000.1: range queries with 1000 insert/s per client
- Legend for results is here.
- Each entry lists the percentage of responses that fit in that bucket (slower than max time for previous bucket, faster than min time for next bucket).
Query response time histogram
256us	1ms	4ms	16ms	64ms	256ms	1s	4s	16s	gt	max	tag
99.956	0.034	0.009	nonzero	0.000	0.000	0.000	0.000	0.000	0.000	0.007	pg1211.cx5
99.957	0.034	0.009	nonzero	0.000	0.000	0.000	0.000	0.000	0.000	0.008	pg137.cx5
99.953	0.037	0.010	nonzero	0.000	0.000	0.000	0.000	0.000	0.000	0.006	pg143.cx5
99.953	0.037	0.010	nonzero	0.000	0.000	0.000	0.000	0.000	0.000	0.006	pg15b1.cx5
99.954	0.036	0.010	nonzero	0.000	0.000	0.000	0.000	0.000	0.000	0.007	pg15b1p1.cx5
99.954	0.036	0.010	nonzero	0.000	0.000	0.000	0.000	0.000	0.000	0.015	pg15b1p1r2.cx5
Insert response time histogram
256us	1ms	4ms	16ms	64ms	256ms	1s	4s	16s	gt	max	tag
0.000	0.000	98.313	1.667	0.019	0.000	0.000	0.000	0.000	0.000	0.035	pg1211.cx5
0.000	0.000	98.281	1.699	0.019	0.000	0.000	0.000	0.000	0.000	0.035	pg137.cx5
0.000	0.000	98.359	1.631	0.010	0.000	0.000	0.000	0.000	0.000	0.044	pg143.cx5
0.000	0.000	98.369	1.620	0.011	0.000	0.000	0.000	0.000	0.000	0.036	pg15b1.cx5
0.000	0.000	98.393	1.597	0.010	0.000	0.000	0.000	0.000	0.000	0.035	pg15b1p1.cx5
0.000	0.000	98.381	1.610	0.009	0.000	0.000	0.000	0.000	0.000	0.035	pg15b1p1r2.cx5