Introduction
This is a report for the insert benchmark with 500M docs and 1 client(s). It is generated by scripts (bash, awk, sed) and Tufte might not be impressed. An overview of the insert benchmark is here and a short update is here. Below, by DBMS, I mean DBMS+version.config. An example is my8020.c10b40 where my means MySQL, 8020 is version 8.0.20 and c10b40 is the name for the configuration file.
The test server is an Intel NUC with 4 cores, 16G RAM and a Samsung 970 EVO. More details are here. Clients and the DBMS share one server. The per-database configs are in the per-database subdirectories here.
The tested DBMS are:
- pg140.cx5 - Postgres 14.0 and the cx5 config
- pg141.cx5 - Postgres 14.1 and the cx5 config
- pg142.cx5 - Postgres 14.2 and the cx5 config
- pg143.cx5 - Postgres 14.3 and the cx5 config
Contents
- Summary
- l.i0: load without secondary indexes
- l.x: create secondary indexes
- l.i1: continue load after secondary indexes created
- q100.1: range queries with 100 insert/s per client
- q500.1: range queries with 500 insert/s per client
- q1000.1: range queries with 1000 insert/s per client
Summary
The numbers are inserts/s for l.i0 and l.i1, indexed docs (or rows) /s for l.x and queries/s for q*.2. The values are the average rate over the entire test for inserts (IPS) and queries (QPS). The range of values for IPS and QPS is split into 3 parts: bottom 25%, middle 50%, top 25%. Values in the bottom 25% have a red background, values in the top 25% have a green background and values in the middle have no color. A gray background is used for values that can be ignored because the DBMS did not sustain the target insert rate. Red backgrounds are not used when the minimum value is within 80% of the max value.
| dbms | l.i0 | l.x | l.i1 | q100.1 | q500.1 | q1000.1 |
|---|---|---|---|---|---|---|
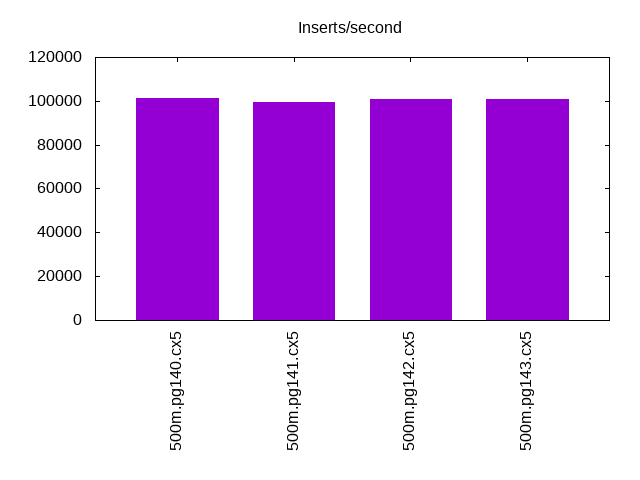
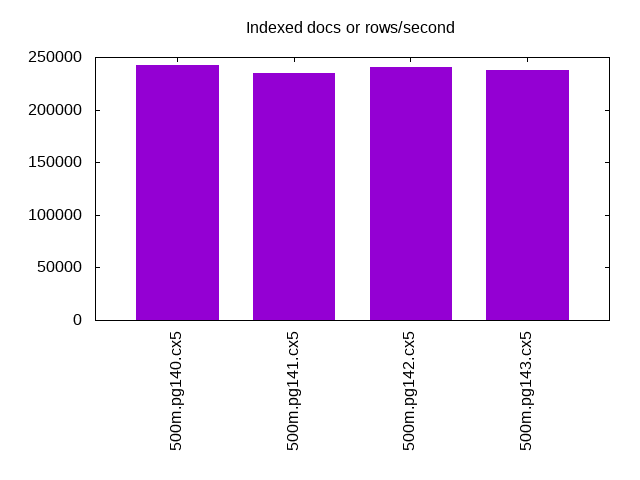
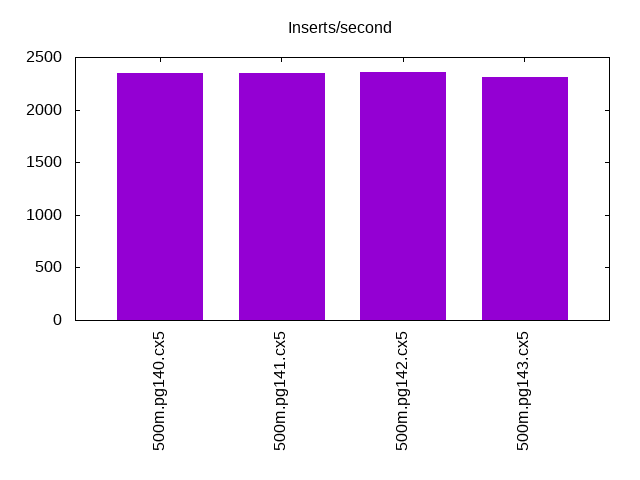
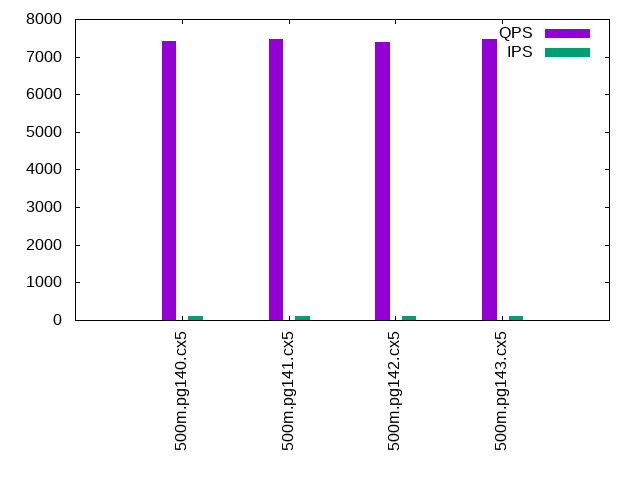
| 500m.pg140.cx5 | 101112 | 242062 | 2351 | 7417 | 7404 | 7301 |
| 500m.pg141.cx5 | 99641 | 234789 | 2344 | 7477 | 7466 | 7382 |
| 500m.pg142.cx5 | 100888 | 240433 | 2358 | 7380 | 7410 | 7291 |
| 500m.pg143.cx5 | 100867 | 237239 | 2308 | 7465 | 7425 | 7342 |
This lists the average rate of inserts/s for the tests that do inserts concurrent with queries. For such tests the query rate is listed in the table above. The read+write tests are setup so that the insert rate should match the target rate every second. Cells that are not at least 95% of the target have a red background to indicate a failure to satisfy the target.
| dbms | q100.1 | q500.1 | q1000.1 |
|---|---|---|---|
| pg140.cx5 | 100 | 500 | 999 |
| pg141.cx5 | 100 | 500 | 999 |
| pg142.cx5 | 100 | 499 | 999 |
| pg143.cx5 | 100 | 500 | 999 |
| target | 100 | 500 | 1000 |
l.i0
l.i0: load without secondary indexes. Graphs for performance per 1-second interval are here.
Average throughput:
Insert response time histogram: each cell has the percentage of responses that take <= the time in the header and max is the max response time in seconds. For the max column values in the top 25% of the range have a red background and in the bottom 25% of the range have a green background. The red background is not used when the min value is within 80% of the max value.
| dbms | 256us | 1ms | 4ms | 16ms | 64ms | 256ms | 1s | 4s | 16s | gt | max |
|---|---|---|---|---|---|---|---|---|---|---|---|
| pg140.cx5 | 85.981 | 14.016 | 0.002 | 0.001 | nonzero | 0.209 | |||||
| pg141.cx5 | 74.540 | 25.456 | 0.003 | 0.001 | nonzero | 0.160 | |||||
| pg142.cx5 | 83.726 | 16.271 | 0.002 | 0.001 | nonzero | 0.233 | |||||
| pg143.cx5 | 83.055 | 16.941 | 0.003 | 0.001 | nonzero | 0.239 |
Performance metrics for the DBMS listed above. Some are normalized by throughput, others are not. Legend for results is here.
ips	qps	rps	rmbps	wps	wmbps	rpq	rkbpq	wpi	wkbpi	csps	cpups	cspq	cpupq	dbgb1	dbgb2	rss	maxop	p50	p99	tag
101112	0	41	0.3	145.0	47.3	0.000	0.003	0.001	0.479	12138	43.0	0.120	17	47.8	62.9	0.0	0.209	101489	95695	500m.pg140.cx5
99641	0	40	0.3	142.2	46.8	0.000	0.003	0.001	0.481	11969	44.3	0.120	18	47.8	63.9	0.0	0.160	100026	93936	500m.pg141.cx5
100888	0	41	0.3	144.6	47.2	0.000	0.003	0.001	0.479	12106	43.1	0.120	17	47.8	63.0	0.0	0.233	101288	96328	500m.pg142.cx5
100867	0	37	0.4	139.1	46.5	0.000	0.004	0.001	0.472	12091	43.2	0.120	17	47.8	63.5	5.4	0.239	101289	95298	500m.pg143.cx5
l.x
l.x: create secondary indexes.
Average throughput:
Performance metrics for the DBMS listed above. Some are normalized by throughput, others are not. Legend for results is here.
ips	qps	rps	rmbps	wps	wmbps	rpq	rkbpq	wpi	wkbpi	csps	cpups	cspq	cpupq	dbgb1	dbgb2	rss	maxop	p50	p99	tag
242062	0	593	73.4	197.1	75.8	0.002	0.311	0.001	0.321	540	23.1	0.002	4	91.9	108.2	0.0	0.003	NA	NA	500m.pg140.cx5
234789	0	576	71.5	189.4	73.3	0.002	0.312	0.001	0.320	528	23.0	0.002	4	91.9	109.3	0.0	0.003	NA	NA	500m.pg141.cx5
240433	0	589	72.9	195.4	75.1	0.002	0.310	0.001	0.320	540	23.1	0.002	4	91.9	108.3	0.0	0.004	NA	NA	500m.pg142.cx5
237239	0	579	72.0	203.0	78.2	0.002	0.311	0.001	0.338	602	22.9	0.003	4	91.9	110.4	0.0	0.003	NA	NA	500m.pg143.cx5
l.i1
l.i1: continue load after secondary indexes created. Graphs for performance per 1-second interval are here.
Average throughput:
Insert response time histogram: each cell has the percentage of responses that take <= the time in the header and max is the max response time in seconds. For the max column values in the top 25% of the range have a red background and in the bottom 25% of the range have a green background. The red background is not used when the min value is within 80% of the max value.
| dbms | 256us | 1ms | 4ms | 16ms | 64ms | 256ms | 1s | 4s | 16s | gt | max |
|---|---|---|---|---|---|---|---|---|---|---|---|
| pg140.cx5 | 23.378 | 76.550 | 0.072 | 0.001 | 0.354 | ||||||
| pg141.cx5 | 21.577 | 78.333 | 0.089 | 0.003 | 0.385 | ||||||
| pg142.cx5 | 23.186 | 76.711 | 0.103 | 0.001 | 0.380 | ||||||
| pg143.cx5 | 21.258 | 78.626 | 0.114 | 0.002 | 0.377 |
Performance metrics for the DBMS listed above. Some are normalized by throughput, others are not. Legend for results is here.
ips	qps	rps	rmbps	wps	wmbps	rpq	rkbpq	wpi	wkbpi	csps	cpups	cspq	cpupq	dbgb1	dbgb2	rss	maxop	p50	p99	tag
2351	0	3159	25.3	4001.3	63.3	1.344	11.014	1.702	27.560	7281	20.8	3.097	354	93.6	112.8	0.0	0.354	2349	1298	500m.pg140.cx5
2344	0	3156	25.3	3990.5	62.9	1.346	11.037	1.702	27.471	7246	20.7	3.091	353	93.6	112.3	0.0	0.385	2347	1348	500m.pg141.cx5
2358	0	3168	25.4	4013.7	63.4	1.344	11.015	1.702	27.532	7278	20.8	3.087	353	93.6	112.5	0.0	0.380	2349	1298	500m.pg142.cx5
2308	0	3113	24.9	3947.4	64.9	1.349	11.057	1.710	28.794	7175	20.8	3.109	361	93.6	113.2	0.0	0.377	2347	1298	500m.pg143.cx5
q100.1
q100.1: range queries with 100 insert/s per client. Graphs for performance per 1-second interval are here.
Average throughput:
Query response time histogram: each cell has the percentage of responses that take <= the time in the header and max is the max response time in seconds. For max values in the top 25% of the range have a red background and in the bottom 25% of the range have a green background. The red background is not used when the min value is within 80% of the max value.
| dbms | 256us | 1ms | 4ms | 16ms | 64ms | 256ms | 1s | 4s | 16s | gt | max |
|---|---|---|---|---|---|---|---|---|---|---|---|
| pg140.cx5 | 99.802 | 0.194 | 0.003 | nonzero | nonzero | 0.044 | |||||
| pg141.cx5 | 99.795 | 0.201 | 0.003 | 0.001 | nonzero | nonzero | nonzero | 0.322 | |||
| pg142.cx5 | 99.793 | 0.204 | 0.003 | nonzero | nonzero | 0.052 | |||||
| pg143.cx5 | 99.825 | 0.172 | 0.003 | nonzero | nonzero | 0.046 |
Insert response time histogram: each cell has the percentage of responses that take <= the time in the header and max is the max response time in seconds. For max values in the top 25% of the range have a red background and in the bottom 25% of the range have a green background. The red background is not used when the min value is within 80% of the max value.
| dbms | 256us | 1ms | 4ms | 16ms | 64ms | 256ms | 1s | 4s | 16s | gt | max |
|---|---|---|---|---|---|---|---|---|---|---|---|
| pg140.cx5 | 96.472 | 3.521 | 0.007 | 0.192 | |||||||
| pg141.cx5 | 96.847 | 3.132 | 0.014 | 0.007 | 0.433 | ||||||
| pg142.cx5 | 96.208 | 3.792 | 0.031 | ||||||||
| pg143.cx5 | 96.861 | 3.132 | 0.007 | 0.095 |
Performance metrics for the DBMS listed above. Some are normalized by throughput, others are not. Legend for results is here.
ips	qps	rps	rmbps	wps	wmbps	rpq	rkbpq	wpi	wkbpi	csps	cpups	cspq	cpupq	dbgb1	dbgb2	rss	maxop	p50	p99	tag
100	7417	136	1.1	318.0	4.6	0.018	0.151	3.183	47.351	28801	26.2	3.883	141	93.7	98.9	0.0	0.044	7448	6217	500m.pg140.cx5
100	7477	136	1.1	320.0	4.6	0.018	0.150	3.204	47.605	29025	26.3	3.882	141	93.7	98.5	0.0	0.322	7512	6057	500m.pg141.cx5
100	7380	136	1.1	317.9	4.6	0.018	0.152	3.185	47.319	28657	26.3	3.883	143	93.7	99.1	0.0	0.052	7401	6425	500m.pg142.cx5
100	7465	137	1.1	335.7	4.8	0.018	0.151	3.360	48.811	28979	26.3	3.882	141	93.7	98.5	0.0	0.046	7496	6297	500m.pg143.cx5
q500.1
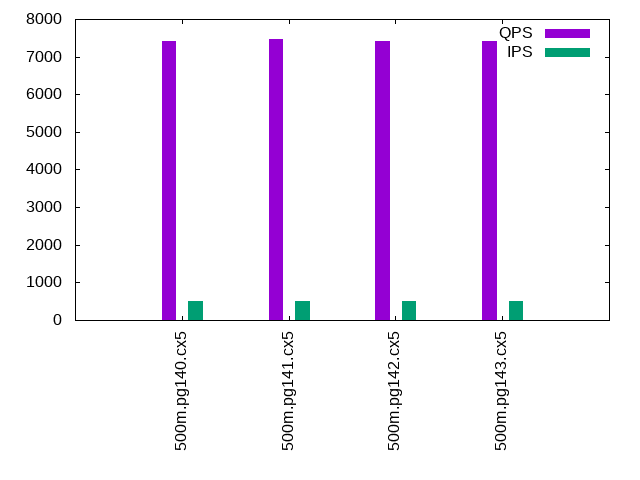
q500.1: range queries with 500 insert/s per client. Graphs for performance per 1-second interval are here.
Average throughput:
Query response time histogram: each cell has the percentage of responses that take <= the time in the header and max is the max response time in seconds. For max values in the top 25% of the range have a red background and in the bottom 25% of the range have a green background. The red background is not used when the min value is within 80% of the max value.
| dbms | 256us | 1ms | 4ms | 16ms | 64ms | 256ms | 1s | 4s | 16s | gt | max |
|---|---|---|---|---|---|---|---|---|---|---|---|
| pg140.cx5 | 99.862 | 0.136 | 0.002 | nonzero | 0.007 | ||||||
| pg141.cx5 | 99.862 | 0.136 | 0.002 | nonzero | 0.005 | ||||||
| pg142.cx5 | 99.858 | 0.140 | 0.002 | nonzero | 0.007 | ||||||
| pg143.cx5 | 99.861 | 0.137 | 0.002 | nonzero | 0.005 |
Insert response time histogram: each cell has the percentage of responses that take <= the time in the header and max is the max response time in seconds. For max values in the top 25% of the range have a red background and in the bottom 25% of the range have a green background. The red background is not used when the min value is within 80% of the max value.
| dbms | 256us | 1ms | 4ms | 16ms | 64ms | 256ms | 1s | 4s | 16s | gt | max |
|---|---|---|---|---|---|---|---|---|---|---|---|
| pg140.cx5 | 90.769 | 9.226 | 0.004 | 0.088 | |||||||
| pg141.cx5 | 90.275 | 9.719 | 0.006 | 0.080 | |||||||
| pg142.cx5 | 90.883 | 9.111 | 0.004 | 0.001 | 0.311 | ||||||
| pg143.cx5 | 89.878 | 10.114 | 0.008 | 0.113 |
Performance metrics for the DBMS listed above. Some are normalized by throughput, others are not. Legend for results is here.
ips	qps	rps	rmbps	wps	wmbps	rpq	rkbpq	wpi	wkbpi	csps	cpups	cspq	cpupq	dbgb1	dbgb2	rss	maxop	p50	p99	tag
500	7404	658	5.2	1020.2	17.9	0.089	0.723	2.043	36.667	29888	27.2	4.037	147	94.6	99.7	0.0	0.007	7400	7256	500m.pg140.cx5
500	7466	658	5.2	1018.6	17.8	0.088	0.717	2.039	36.483	30112	27.2	4.034	146	94.6	99.7	0.0	0.005	7464	7320	500m.pg141.cx5
499	7410	658	5.2	1021.2	17.9	0.089	0.723	2.045	36.763	29919	27.1	4.038	146	94.6	99.7	0.0	0.007	7416	7258	500m.pg142.cx5
500	7425	658	5.2	1018.5	17.8	0.089	0.721	2.039	36.461	29974	27.4	4.037	148	94.6	99.7	0.0	0.005	7432	7272	500m.pg143.cx5
q1000.1
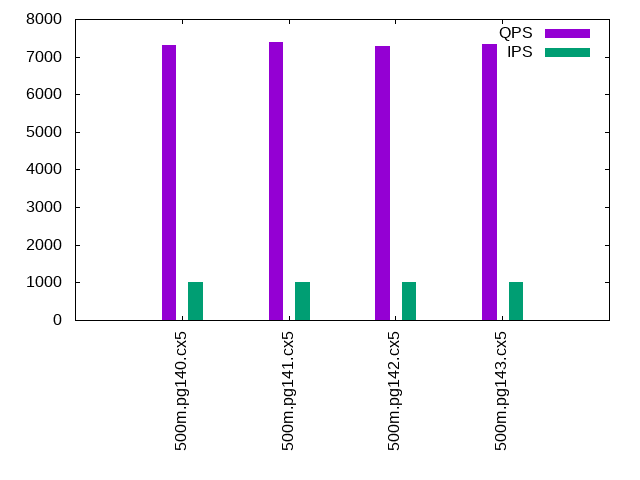
q1000.1: range queries with 1000 insert/s per client. Graphs for performance per 1-second interval are here.
Average throughput:
Query response time histogram: each cell has the percentage of responses that take <= the time in the header and max is the max response time in seconds. For max values in the top 25% of the range have a red background and in the bottom 25% of the range have a green background. The red background is not used when the min value is within 80% of the max value.
| dbms | 256us | 1ms | 4ms | 16ms | 64ms | 256ms | 1s | 4s | 16s | gt | max |
|---|---|---|---|---|---|---|---|---|---|---|---|
| pg140.cx5 | 99.731 | 0.266 | 0.003 | nonzero | nonzero | 0.059 | |||||
| pg141.cx5 | 99.730 | 0.266 | 0.003 | nonzero | 0.008 | ||||||
| pg142.cx5 | 99.719 | 0.278 | 0.003 | nonzero | nonzero | 0.017 | |||||
| pg143.cx5 | 99.716 | 0.281 | 0.003 | nonzero | 0.007 |
Insert response time histogram: each cell has the percentage of responses that take <= the time in the header and max is the max response time in seconds. For max values in the top 25% of the range have a red background and in the bottom 25% of the range have a green background. The red background is not used when the min value is within 80% of the max value.
| dbms | 256us | 1ms | 4ms | 16ms | 64ms | 256ms | 1s | 4s | 16s | gt | max |
|---|---|---|---|---|---|---|---|---|---|---|---|
| pg140.cx5 | 83.374 | 16.601 | 0.024 | 0.002 | 0.458 | ||||||
| pg141.cx5 | 83.106 | 16.863 | 0.030 | 0.001 | 0.316 | ||||||
| pg142.cx5 | 83.401 | 16.581 | 0.017 | 0.083 | |||||||
| pg143.cx5 | 83.035 | 16.935 | 0.027 | 0.003 | 0.513 |
Performance metrics for the DBMS listed above. Some are normalized by throughput, others are not. Legend for results is here.
ips	qps	rps	rmbps	wps	wmbps	rpq	rkbpq	wpi	wkbpi	csps	cpups	cspq	cpupq	dbgb1	dbgb2	rss	maxop	p50	p99	tag
999	7301	1294	10.3	1737.5	31.6	0.177	1.451	1.739	32.371	30903	28.4	4.233	156	95.5	104.5	0.0	0.059	7304	7144	500m.pg140.cx5
999	7382	1294	10.3	1737.1	31.6	0.175	1.435	1.739	32.400	31206	28.3	4.227	153	95.5	104.5	0.0	0.008	7384	7224	500m.pg141.cx5
999	7291	1294	10.3	1736.8	31.6	0.178	1.454	1.738	32.347	30879	28.4	4.235	156	95.5	104.5	0.0	0.017	7288	7112	500m.pg142.cx5
999	7342	1294	10.3	1736.7	31.6	0.176	1.443	1.738	32.419	31068	28.5	4.232	155	95.5	104.5	0.0	0.007	7352	7176	500m.pg143.cx5
l.i0
l.i0: load without secondary indexes
Performance metrics for all DBMS, not just the ones listed above. Some are normalized by throughput, others are not. Legend for results is here.
ips	qps	rps	rmbps	wps	wmbps	rpq	rkbpq	wpi	wkbpi	csps	cpups	cspq	cpupq	dbgb1	dbgb2	rss	maxop	p50	p99	tag
101112	0	41	0.3	145.0	47.3	0.000	0.003	0.001	0.479	12138	43.0	0.120	17	47.8	62.9	0.0	0.209	101489	95695	500m.pg140.cx5
99641	0	40	0.3	142.2	46.8	0.000	0.003	0.001	0.481	11969	44.3	0.120	18	47.8	63.9	0.0	0.160	100026	93936	500m.pg141.cx5
100888	0	41	0.3	144.6	47.2	0.000	0.003	0.001	0.479	12106	43.1	0.120	17	47.8	63.0	0.0	0.233	101288	96328	500m.pg142.cx5
100867	0	37	0.4	139.1	46.5	0.000	0.004	0.001	0.472	12091	43.2	0.120	17	47.8	63.5	5.4	0.239	101289	95298	500m.pg143.cx5
l.x
l.x: create secondary indexes
Performance metrics for all DBMS, not just the ones listed above. Some are normalized by throughput, others are not. Legend for results is here.
ips	qps	rps	rmbps	wps	wmbps	rpq	rkbpq	wpi	wkbpi	csps	cpups	cspq	cpupq	dbgb1	dbgb2	rss	maxop	p50	p99	tag
242062	0	593	73.4	197.1	75.8	0.002	0.311	0.001	0.321	540	23.1	0.002	4	91.9	108.2	0.0	0.003	NA	NA	500m.pg140.cx5
234789	0	576	71.5	189.4	73.3	0.002	0.312	0.001	0.320	528	23.0	0.002	4	91.9	109.3	0.0	0.003	NA	NA	500m.pg141.cx5
240433	0	589	72.9	195.4	75.1	0.002	0.310	0.001	0.320	540	23.1	0.002	4	91.9	108.3	0.0	0.004	NA	NA	500m.pg142.cx5
237239	0	579	72.0	203.0	78.2	0.002	0.311	0.001	0.338	602	22.9	0.003	4	91.9	110.4	0.0	0.003	NA	NA	500m.pg143.cx5
l.i1
l.i1: continue load after secondary indexes created
Performance metrics for all DBMS, not just the ones listed above. Some are normalized by throughput, others are not. Legend for results is here.
ips	qps	rps	rmbps	wps	wmbps	rpq	rkbpq	wpi	wkbpi	csps	cpups	cspq	cpupq	dbgb1	dbgb2	rss	maxop	p50	p99	tag
2351	0	3159	25.3	4001.3	63.3	1.344	11.014	1.702	27.560	7281	20.8	3.097	354	93.6	112.8	0.0	0.354	2349	1298	500m.pg140.cx5
2344	0	3156	25.3	3990.5	62.9	1.346	11.037	1.702	27.471	7246	20.7	3.091	353	93.6	112.3	0.0	0.385	2347	1348	500m.pg141.cx5
2358	0	3168	25.4	4013.7	63.4	1.344	11.015	1.702	27.532	7278	20.8	3.087	353	93.6	112.5	0.0	0.380	2349	1298	500m.pg142.cx5
2308	0	3113	24.9	3947.4	64.9	1.349	11.057	1.710	28.794	7175	20.8	3.109	361	93.6	113.2	0.0	0.377	2347	1298	500m.pg143.cx5
q100.1
q100.1: range queries with 100 insert/s per client
Performance metrics for all DBMS, not just the ones listed above. Some are normalized by throughput, others are not. Legend for results is here.
ips	qps	rps	rmbps	wps	wmbps	rpq	rkbpq	wpi	wkbpi	csps	cpups	cspq	cpupq	dbgb1	dbgb2	rss	maxop	p50	p99	tag
100	7417	136	1.1	318.0	4.6	0.018	0.151	3.183	47.351	28801	26.2	3.883	141	93.7	98.9	0.0	0.044	7448	6217	500m.pg140.cx5
100	7477	136	1.1	320.0	4.6	0.018	0.150	3.204	47.605	29025	26.3	3.882	141	93.7	98.5	0.0	0.322	7512	6057	500m.pg141.cx5
100	7380	136	1.1	317.9	4.6	0.018	0.152	3.185	47.319	28657	26.3	3.883	143	93.7	99.1	0.0	0.052	7401	6425	500m.pg142.cx5
100	7465	137	1.1	335.7	4.8	0.018	0.151	3.360	48.811	28979	26.3	3.882	141	93.7	98.5	0.0	0.046	7496	6297	500m.pg143.cx5
q500.1
q500.1: range queries with 500 insert/s per client
Performance metrics for all DBMS, not just the ones listed above. Some are normalized by throughput, others are not. Legend for results is here.
ips	qps	rps	rmbps	wps	wmbps	rpq	rkbpq	wpi	wkbpi	csps	cpups	cspq	cpupq	dbgb1	dbgb2	rss	maxop	p50	p99	tag
500	7404	658	5.2	1020.2	17.9	0.089	0.723	2.043	36.667	29888	27.2	4.037	147	94.6	99.7	0.0	0.007	7400	7256	500m.pg140.cx5
500	7466	658	5.2	1018.6	17.8	0.088	0.717	2.039	36.483	30112	27.2	4.034	146	94.6	99.7	0.0	0.005	7464	7320	500m.pg141.cx5
499	7410	658	5.2	1021.2	17.9	0.089	0.723	2.045	36.763	29919	27.1	4.038	146	94.6	99.7	0.0	0.007	7416	7258	500m.pg142.cx5
500	7425	658	5.2	1018.5	17.8	0.089	0.721	2.039	36.461	29974	27.4	4.037	148	94.6	99.7	0.0	0.005	7432	7272	500m.pg143.cx5
q1000.1
q1000.1: range queries with 1000 insert/s per client
Performance metrics for all DBMS, not just the ones listed above. Some are normalized by throughput, others are not. Legend for results is here.
ips	qps	rps	rmbps	wps	wmbps	rpq	rkbpq	wpi	wkbpi	csps	cpups	cspq	cpupq	dbgb1	dbgb2	rss	maxop	p50	p99	tag
999	7301	1294	10.3	1737.5	31.6	0.177	1.451	1.739	32.371	30903	28.4	4.233	156	95.5	104.5	0.0	0.059	7304	7144	500m.pg140.cx5
999	7382	1294	10.3	1737.1	31.6	0.175	1.435	1.739	32.400	31206	28.3	4.227	153	95.5	104.5	0.0	0.008	7384	7224	500m.pg141.cx5
999	7291	1294	10.3	1736.8	31.6	0.178	1.454	1.738	32.347	30879	28.4	4.235	156	95.5	104.5	0.0	0.017	7288	7112	500m.pg142.cx5
999	7342	1294	10.3	1736.7	31.6	0.176	1.443	1.738	32.419	31068	28.5	4.232	155	95.5	104.5	0.0	0.007	7352	7176	500m.pg143.cx5
l.i0
- l.i0: load without secondary indexes
- Legend for results is here.
- Each entry lists the percentage of responses that fit in that bucket (slower than max time for previous bucket, faster than min time for next bucket).
Insert response time histogram
256us	1ms	4ms	16ms	64ms	256ms	1s	4s	16s	gt	max	tag
0.000	85.981	14.016	0.002	0.001	nonzero	0.000	0.000	0.000	0.000	0.209	pg140.cx5
0.000	74.540	25.456	0.003	0.001	nonzero	0.000	0.000	0.000	0.000	0.160	pg141.cx5
0.000	83.726	16.271	0.002	0.001	nonzero	0.000	0.000	0.000	0.000	0.233	pg142.cx5
0.000	83.055	16.941	0.003	0.001	nonzero	0.000	0.000	0.000	0.000	0.239	pg143.cx5
l.x
- l.x: create secondary indexes
- Legend for results is here.
- Each entry lists the percentage of responses that fit in that bucket (slower than max time for previous bucket, faster than min time for next bucket).
TODO - determine whether there is data for create index response time
l.i1
- l.i1: continue load after secondary indexes created
- Legend for results is here.
- Each entry lists the percentage of responses that fit in that bucket (slower than max time for previous bucket, faster than min time for next bucket).
Insert response time histogram
256us	1ms	4ms	16ms	64ms	256ms	1s	4s	16s	gt	max	tag
0.000	0.000	0.000	23.378	76.550	0.072	0.001	0.000	0.000	0.000	0.354	pg140.cx5
0.000	0.000	0.000	21.577	78.333	0.089	0.003	0.000	0.000	0.000	0.385	pg141.cx5
0.000	0.000	0.000	23.186	76.711	0.103	0.001	0.000	0.000	0.000	0.380	pg142.cx5
0.000	0.000	0.000	21.258	78.626	0.114	0.002	0.000	0.000	0.000	0.377	pg143.cx5
q100.1
- q100.1: range queries with 100 insert/s per client
- Legend for results is here.
- Each entry lists the percentage of responses that fit in that bucket (slower than max time for previous bucket, faster than min time for next bucket).
Query response time histogram
256us	1ms	4ms	16ms	64ms	256ms	1s	4s	16s	gt	max	tag
99.802	0.194	0.003	nonzero	nonzero	0.000	0.000	0.000	0.000	0.000	0.044	pg140.cx5
99.795	0.201	0.003	0.001	nonzero	nonzero	nonzero	0.000	0.000	0.000	0.322	pg141.cx5
99.793	0.204	0.003	nonzero	nonzero	0.000	0.000	0.000	0.000	0.000	0.052	pg142.cx5
99.825	0.172	0.003	nonzero	nonzero	0.000	0.000	0.000	0.000	0.000	0.046	pg143.cx5
Insert response time histogram
256us	1ms	4ms	16ms	64ms	256ms	1s	4s	16s	gt	max	tag
0.000	0.000	0.000	96.472	3.521	0.007	0.000	0.000	0.000	0.000	0.192	pg140.cx5
0.000	0.000	0.000	96.847	3.132	0.014	0.007	0.000	0.000	0.000	0.433	pg141.cx5
0.000	0.000	0.000	96.208	3.792	0.000	0.000	0.000	0.000	0.000	0.031	pg142.cx5
0.000	0.000	0.000	96.861	3.132	0.007	0.000	0.000	0.000	0.000	0.095	pg143.cx5
q500.1
- q500.1: range queries with 500 insert/s per client
- Legend for results is here.
- Each entry lists the percentage of responses that fit in that bucket (slower than max time for previous bucket, faster than min time for next bucket).
Query response time histogram
256us	1ms	4ms	16ms	64ms	256ms	1s	4s	16s	gt	max	tag
99.862	0.136	0.002	nonzero	0.000	0.000	0.000	0.000	0.000	0.000	0.007	pg140.cx5
99.862	0.136	0.002	nonzero	0.000	0.000	0.000	0.000	0.000	0.000	0.005	pg141.cx5
99.858	0.140	0.002	nonzero	0.000	0.000	0.000	0.000	0.000	0.000	0.007	pg142.cx5
99.861	0.137	0.002	nonzero	0.000	0.000	0.000	0.000	0.000	0.000	0.005	pg143.cx5
Insert response time histogram
256us	1ms	4ms	16ms	64ms	256ms	1s	4s	16s	gt	max	tag
0.000	0.000	0.000	90.769	9.226	0.004	0.000	0.000	0.000	0.000	0.088	pg140.cx5
0.000	0.000	0.000	90.275	9.719	0.006	0.000	0.000	0.000	0.000	0.080	pg141.cx5
0.000	0.000	0.000	90.883	9.111	0.004	0.001	0.000	0.000	0.000	0.311	pg142.cx5
0.000	0.000	0.000	89.878	10.114	0.008	0.000	0.000	0.000	0.000	0.113	pg143.cx5
q1000.1
- q1000.1: range queries with 1000 insert/s per client
- Legend for results is here.
- Each entry lists the percentage of responses that fit in that bucket (slower than max time for previous bucket, faster than min time for next bucket).
Query response time histogram
256us	1ms	4ms	16ms	64ms	256ms	1s	4s	16s	gt	max	tag
99.731	0.266	0.003	nonzero	nonzero	0.000	0.000	0.000	0.000	0.000	0.059	pg140.cx5
99.730	0.266	0.003	nonzero	0.000	0.000	0.000	0.000	0.000	0.000	0.008	pg141.cx5
99.719	0.278	0.003	nonzero	nonzero	0.000	0.000	0.000	0.000	0.000	0.017	pg142.cx5
99.716	0.281	0.003	nonzero	0.000	0.000	0.000	0.000	0.000	0.000	0.007	pg143.cx5
Insert response time histogram
256us	1ms	4ms	16ms	64ms	256ms	1s	4s	16s	gt	max	tag
0.000	0.000	0.000	83.374	16.601	0.024	0.002	0.000	0.000	0.000	0.458	pg140.cx5
0.000	0.000	0.000	83.106	16.863	0.030	0.001	0.000	0.000	0.000	0.316	pg141.cx5
0.000	0.000	0.000	83.401	16.581	0.017	0.000	0.000	0.000	0.000	0.083	pg142.cx5
0.000	0.000	0.000	83.035	16.935	0.027	0.003	0.000	0.000	0.000	0.513	pg143.cx5