Introduction
This is a report for the insert benchmark with 500M docs and 1 client(s). It is generated by scripts (bash, awk, sed) and Tufte might not be impressed. An overview of the insert benchmark is here and a short update is here. Below, by DBMS, I mean DBMS+version.config. An example is my8020.c10b40 where my means MySQL, 8020 is version 8.0.20 and c10b40 is the name for the configuration file.
The test server is an Intel NUC with 4 cores, 16G RAM and a Samsung 970 EVO. More details are here. Clients and the DBMS share one server. The per-database configs are in the per-database subdirectories here.
The tested DBMS are:
- pg1211.cx5 - Postgres 12.11 and the cx5 config
- pg137.cx5 - Postgres 13.7 and the cx5 config
- pg143.cx5 - Postgres 14.3 and the cx5 config
- pg15b1.cx5 - Postgres 15beta1 and the cx5 config
Contents
- Summary
- l.i0: load without secondary indexes
- l.x: create secondary indexes
- l.i1: continue load after secondary indexes created
- q100.1: range queries with 100 insert/s per client
- q500.1: range queries with 500 insert/s per client
- q1000.1: range queries with 1000 insert/s per client
Summary
The numbers are inserts/s for l.i0 and l.i1, indexed docs (or rows) /s for l.x and queries/s for q*.2. The values are the average rate over the entire test for inserts (IPS) and queries (QPS). The range of values for IPS and QPS is split into 3 parts: bottom 25%, middle 50%, top 25%. Values in the bottom 25% have a red background, values in the top 25% have a green background and values in the middle have no color. A gray background is used for values that can be ignored because the DBMS did not sustain the target insert rate. Red backgrounds are not used when the minimum value is within 80% of the max value.
| dbms | l.i0 | l.x | l.i1 | q100.1 | q500.1 | q1000.1 |
|---|---|---|---|---|---|---|
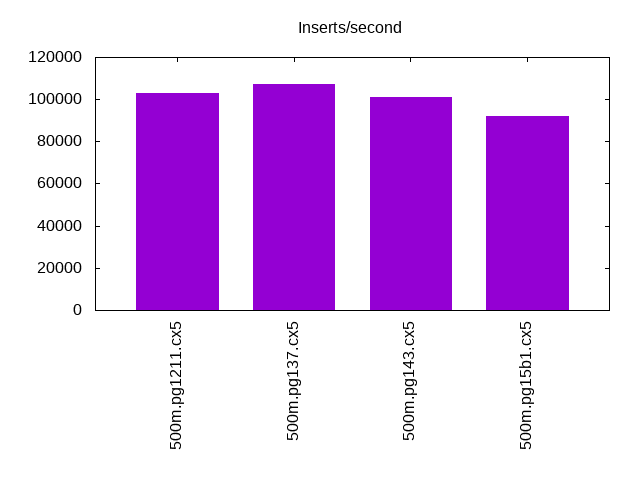
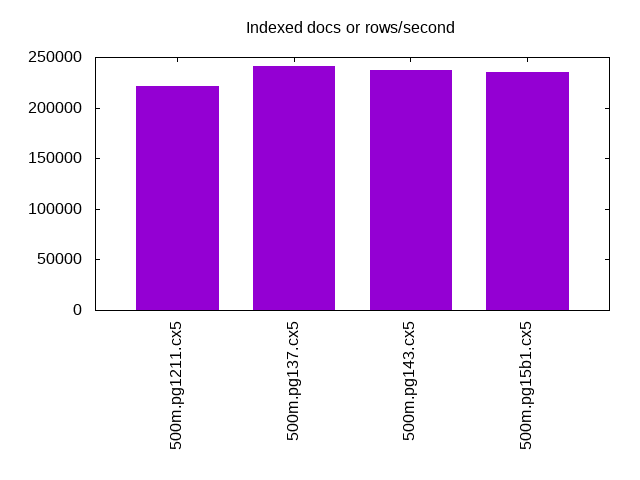
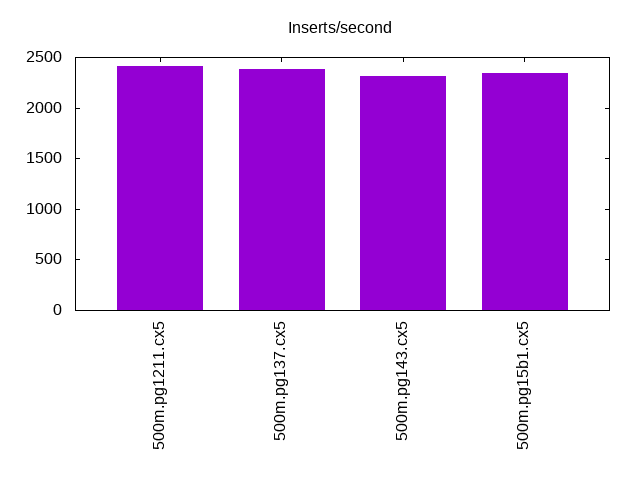
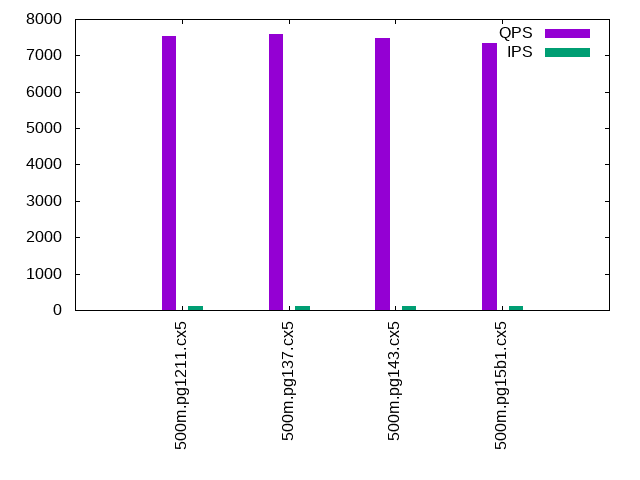
| 500m.pg1211.cx5 | 102796 | 221283 | 2407 | 7540 | 7541 | 7440 |
| 500m.pg137.cx5 | 107296 | 241361 | 2379 | 7587 | 7574 | 7512 |
| 500m.pg143.cx5 | 100867 | 237239 | 2308 | 7465 | 7425 | 7342 |
| 500m.pg15b1.cx5 | 91929 | 234899 | 2344 | 7344 | 7289 | 7180 |
This lists the average rate of inserts/s for the tests that do inserts concurrent with queries. For such tests the query rate is listed in the table above. The read+write tests are setup so that the insert rate should match the target rate every second. Cells that are not at least 95% of the target have a red background to indicate a failure to satisfy the target.
| dbms | q100.1 | q500.1 | q1000.1 |
|---|---|---|---|
| pg1211.cx5 | 100 | 500 | 999 |
| pg137.cx5 | 100 | 500 | 999 |
| pg143.cx5 | 100 | 500 | 999 |
| pg15b1.cx5 | 100 | 499 | 999 |
| target | 100 | 500 | 1000 |
l.i0
l.i0: load without secondary indexes. Graphs for performance per 1-second interval are here.
Average throughput:
Insert response time histogram: each cell has the percentage of responses that take <= the time in the header and max is the max response time in seconds. For the max column values in the top 25% of the range have a red background and in the bottom 25% of the range have a green background. The red background is not used when the min value is within 80% of the max value.
| dbms | 256us | 1ms | 4ms | 16ms | 64ms | 256ms | 1s | 4s | 16s | gt | max |
|---|---|---|---|---|---|---|---|---|---|---|---|
| pg1211.cx5 | 92.857 | 7.140 | 0.002 | 0.001 | nonzero | 0.146 | |||||
| pg137.cx5 | 96.923 | 3.073 | 0.003 | 0.001 | nonzero | 0.127 | |||||
| pg143.cx5 | 83.055 | 16.941 | 0.003 | 0.001 | nonzero | 0.239 | |||||
| pg15b1.cx5 | 1.142 | 98.852 | 0.005 | 0.001 | nonzero | nonzero | 0.432 |
Performance metrics for the DBMS listed above. Some are normalized by throughput, others are not. Legend for results is here.
ips	qps	rps	rmbps	wps	wmbps	rpq	rkbpq	wpi	wkbpi	csps	cpups	cspq	cpupq	dbgb1	dbgb2	rss	maxop	p50	p99	tag
102796	0	44	0.3	195.8	39.6	0.000	0.003	0.002	0.395	12269	42.1	0.119	16	47.8	55.8	0.0	0.146	102887	98592	500m.pg1211.cx5
107296	0	38	0.3	160.6	51.4	0.000	0.003	0.001	0.490	12894	43.5	0.120	16	47.8	62.9	0.0	0.127	107883	98795	500m.pg137.cx5
100867	0	37	0.4	139.1	46.5	0.000	0.004	0.001	0.472	12091	43.2	0.120	17	47.8	63.5	5.4	0.239	101289	95298	500m.pg143.cx5
91929	0	34	0.3	130.7	43.3	0.000	0.003	0.001	0.482	11057	42.5	0.120	18	47.8	63.4	0.0	0.432	92199	86408	500m.pg15b1.cx5
l.x
l.x: create secondary indexes.
Average throughput:
Performance metrics for the DBMS listed above. Some are normalized by throughput, others are not. Legend for results is here.
ips	qps	rps	rmbps	wps	wmbps	rpq	rkbpq	wpi	wkbpi	csps	cpups	cspq	cpupq	dbgb1	dbgb2	rss	maxop	p50	p99	tag
221283	0	570	69.2	473.0	102.2	0.003	0.320	0.002	0.473	918	22.7	0.004	4	91.9	111.5	0.0	0.003	NA	NA	500m.pg1211.cx5
241361	0	591	73.5	198.0	77.1	0.002	0.312	0.001	0.327	522	23.1	0.002	4	91.9	106.1	0.0	0.006	NA	NA	500m.pg137.cx5
237239	0	579	72.0	203.0	78.2	0.002	0.311	0.001	0.338	602	22.9	0.003	4	91.9	110.4	0.0	0.003	NA	NA	500m.pg143.cx5
234899	0	648	80.4	214.0	83.6	0.003	0.351	0.001	0.365	572	22.8	0.002	4	91.9	107.5	0.0	0.003	NA	NA	500m.pg15b1.cx5
l.i1
l.i1: continue load after secondary indexes created. Graphs for performance per 1-second interval are here.
Average throughput:
Insert response time histogram: each cell has the percentage of responses that take <= the time in the header and max is the max response time in seconds. For the max column values in the top 25% of the range have a red background and in the bottom 25% of the range have a green background. The red background is not used when the min value is within 80% of the max value.
| dbms | 256us | 1ms | 4ms | 16ms | 64ms | 256ms | 1s | 4s | 16s | gt | max |
|---|---|---|---|---|---|---|---|---|---|---|---|
| pg1211.cx5 | 26.661 | 73.311 | 0.028 | 0.140 | |||||||
| pg137.cx5 | 24.784 | 75.091 | 0.124 | 0.155 | |||||||
| pg143.cx5 | 21.258 | 78.626 | 0.114 | 0.002 | 0.377 | ||||||
| pg15b1.cx5 | 20.479 | 79.454 | 0.066 | 0.002 | 0.305 |
Performance metrics for the DBMS listed above. Some are normalized by throughput, others are not. Legend for results is here.
ips	qps	rps	rmbps	wps	wmbps	rpq	rkbpq	wpi	wkbpi	csps	cpups	cspq	cpupq	dbgb1	dbgb2	rss	maxop	p50	p99	tag
2407	0	3219	25.8	4082.4	64.9	1.337	10.961	1.696	27.626	7457	22.0	3.098	366	93.6	110.4	0.0	0.140	2447	1598	500m.pg1211.cx5
2379	0	3212	25.7	4051.1	65.2	1.350	11.070	1.703	28.059	7539	22.0	3.169	370	93.6	110.4	0.0	0.155	2447	1548	500m.pg137.cx5
2308	0	3113	24.9	3947.4	64.9	1.349	11.057	1.710	28.794	7175	20.8	3.109	361	93.6	113.2	0.0	0.377	2347	1298	500m.pg143.cx5
2344	0	3168	25.4	4002.6	63.4	1.352	11.086	1.708	27.703	7234	20.3	3.087	346	93.6	112.4	0.0	0.305	2347	1298	500m.pg15b1.cx5
q100.1
q100.1: range queries with 100 insert/s per client. Graphs for performance per 1-second interval are here.
Average throughput:
Query response time histogram: each cell has the percentage of responses that take <= the time in the header and max is the max response time in seconds. For max values in the top 25% of the range have a red background and in the bottom 25% of the range have a green background. The red background is not used when the min value is within 80% of the max value.
| dbms | 256us | 1ms | 4ms | 16ms | 64ms | 256ms | 1s | 4s | 16s | gt | max |
|---|---|---|---|---|---|---|---|---|---|---|---|
| pg1211.cx5 | 99.903 | 0.097 | 0.001 | nonzero | 0.015 | ||||||
| pg137.cx5 | 99.883 | 0.115 | 0.001 | nonzero | nonzero | 0.050 | |||||
| pg143.cx5 | 99.825 | 0.172 | 0.003 | nonzero | nonzero | 0.046 | |||||
| pg15b1.cx5 | 99.829 | 0.168 | 0.003 | nonzero | nonzero | 0.053 |
Insert response time histogram: each cell has the percentage of responses that take <= the time in the header and max is the max response time in seconds. For max values in the top 25% of the range have a red background and in the bottom 25% of the range have a green background. The red background is not used when the min value is within 80% of the max value.
| dbms | 256us | 1ms | 4ms | 16ms | 64ms | 256ms | 1s | 4s | 16s | gt | max |
|---|---|---|---|---|---|---|---|---|---|---|---|
| pg1211.cx5 | 85.146 | 14.854 | 0.033 | ||||||||
| pg137.cx5 | 85.708 | 14.285 | 0.007 | 0.255 | |||||||
| pg143.cx5 | 96.861 | 3.132 | 0.007 | 0.095 | |||||||
| pg15b1.cx5 | 96.507 | 3.486 | 0.007 | 0.230 |
Performance metrics for the DBMS listed above. Some are normalized by throughput, others are not. Legend for results is here.
ips	qps	rps	rmbps	wps	wmbps	rpq	rkbpq	wpi	wkbpi	csps	cpups	cspq	cpupq	dbgb1	dbgb2	rss	maxop	p50	p99	tag
100	7540	135	1.1	270.4	4.2	0.018	0.147	2.709	43.065	29332	27.7	3.890	147	93.7	96.1	0.0	0.015	7560	7080	500m.pg1211.cx5
100	7587	137	1.1	273.5	4.3	0.018	0.148	2.741	43.809	29522	27.7	3.891	146	93.7	96.1	0.0	0.050	7608	6952	500m.pg137.cx5
100	7465	137	1.1	335.7	4.8	0.018	0.151	3.360	48.811	28979	26.3	3.882	141	93.7	98.5	0.0	0.046	7496	6297	500m.pg143.cx5
100	7344	137	1.1	291.5	4.4	0.019	0.153	2.921	45.419	28491	26.2	3.879	143	93.7	99.3	0.0	0.053	7368	6473	500m.pg15b1.cx5
q500.1
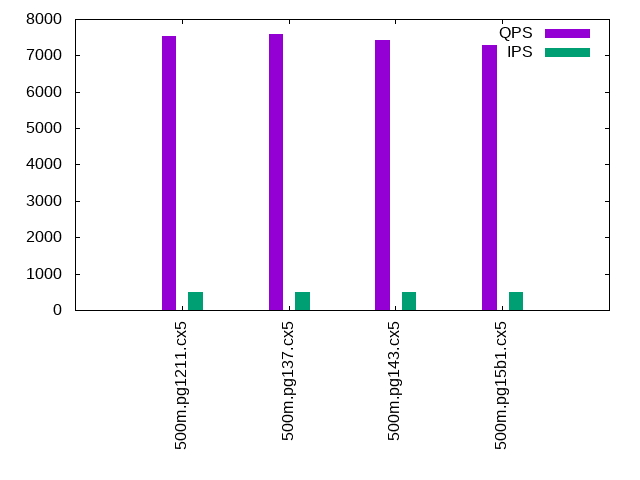
q500.1: range queries with 500 insert/s per client. Graphs for performance per 1-second interval are here.
Average throughput:
Query response time histogram: each cell has the percentage of responses that take <= the time in the header and max is the max response time in seconds. For max values in the top 25% of the range have a red background and in the bottom 25% of the range have a green background. The red background is not used when the min value is within 80% of the max value.
| dbms | 256us | 1ms | 4ms | 16ms | 64ms | 256ms | 1s | 4s | 16s | gt | max |
|---|---|---|---|---|---|---|---|---|---|---|---|
| pg1211.cx5 | 99.910 | 0.088 | 0.002 | nonzero | 0.005 | ||||||
| pg137.cx5 | 99.920 | 0.078 | 0.002 | nonzero | nonzero | 0.017 | |||||
| pg143.cx5 | 99.861 | 0.137 | 0.002 | nonzero | 0.005 | ||||||
| pg15b1.cx5 | 99.849 | 0.149 | 0.002 | nonzero | 0.005 |
Insert response time histogram: each cell has the percentage of responses that take <= the time in the header and max is the max response time in seconds. For max values in the top 25% of the range have a red background and in the bottom 25% of the range have a green background. The red background is not used when the min value is within 80% of the max value.
| dbms | 256us | 1ms | 4ms | 16ms | 64ms | 256ms | 1s | 4s | 16s | gt | max |
|---|---|---|---|---|---|---|---|---|---|---|---|
| pg1211.cx5 | 97.018 | 2.979 | 0.003 | 0.078 | |||||||
| pg137.cx5 | 96.667 | 3.326 | 0.007 | 0.075 | |||||||
| pg143.cx5 | 89.878 | 10.114 | 0.008 | 0.113 | |||||||
| pg15b1.cx5 | 92.101 | 7.893 | 0.006 | 0.076 |
Performance metrics for the DBMS listed above. Some are normalized by throughput, others are not. Legend for results is here.
ips	qps	rps	rmbps	wps	wmbps	rpq	rkbpq	wpi	wkbpi	csps	cpups	cspq	cpupq	dbgb1	dbgb2	rss	maxop	p50	p99	tag
500	7541	658	5.2	1056.0	18.4	0.087	0.708	2.114	37.763	30450	28.1	4.038	149	94.6	98.8	0.0	0.005	7544	7419	500m.pg1211.cx5
500	7574	658	5.2	1063.6	18.5	0.087	0.705	2.129	37.960	30588	28.3	4.039	149	94.6	98.8	0.0	0.017	7576	7448	500m.pg137.cx5
500	7425	658	5.2	1018.5	17.8	0.089	0.721	2.039	36.461	29974	27.4	4.037	148	94.6	99.7	0.0	0.005	7432	7272	500m.pg143.cx5
499	7289	658	5.2	1018.5	17.8	0.090	0.734	2.039	36.494	29431	27.3	4.038	150	94.6	99.7	0.0	0.005	7288	7176	500m.pg15b1.cx5
q1000.1
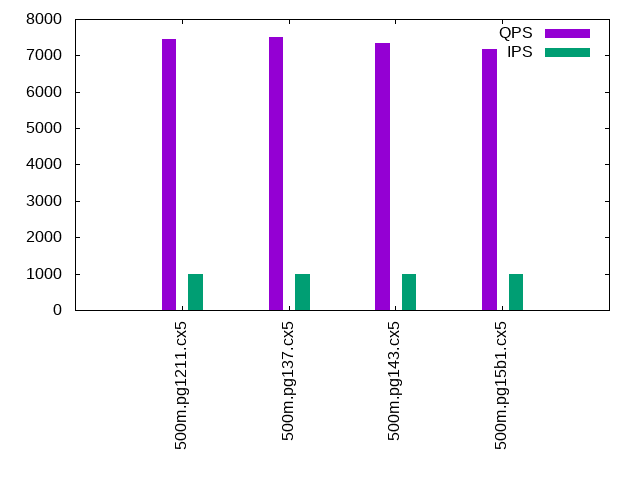
q1000.1: range queries with 1000 insert/s per client. Graphs for performance per 1-second interval are here.
Average throughput:
Query response time histogram: each cell has the percentage of responses that take <= the time in the header and max is the max response time in seconds. For max values in the top 25% of the range have a red background and in the bottom 25% of the range have a green background. The red background is not used when the min value is within 80% of the max value.
| dbms | 256us | 1ms | 4ms | 16ms | 64ms | 256ms | 1s | 4s | 16s | gt | max |
|---|---|---|---|---|---|---|---|---|---|---|---|
| pg1211.cx5 | 99.830 | 0.167 | 0.003 | nonzero | 0.014 | ||||||
| pg137.cx5 | 99.844 | 0.153 | 0.003 | nonzero | nonzero | 0.017 | |||||
| pg143.cx5 | 99.716 | 0.281 | 0.003 | nonzero | 0.007 | ||||||
| pg15b1.cx5 | 99.674 | 0.323 | 0.003 | nonzero | 0.006 |
Insert response time histogram: each cell has the percentage of responses that take <= the time in the header and max is the max response time in seconds. For max values in the top 25% of the range have a red background and in the bottom 25% of the range have a green background. The red background is not used when the min value is within 80% of the max value.
| dbms | 256us | 1ms | 4ms | 16ms | 64ms | 256ms | 1s | 4s | 16s | gt | max |
|---|---|---|---|---|---|---|---|---|---|---|---|
| pg1211.cx5 | 93.183 | 6.811 | 0.006 | 0.097 | |||||||
| pg137.cx5 | 91.966 | 8.026 | 0.008 | 0.092 | |||||||
| pg143.cx5 | 83.035 | 16.935 | 0.027 | 0.003 | 0.513 | ||||||
| pg15b1.cx5 | 84.762 | 15.217 | 0.021 | 0.001 | 0.293 |
Performance metrics for the DBMS listed above. Some are normalized by throughput, others are not. Legend for results is here.
ips	qps	rps	rmbps	wps	wmbps	rpq	rkbpq	wpi	wkbpi	csps	cpups	cspq	cpupq	dbgb1	dbgb2	rss	maxop	p50	p99	tag
999	7440	1292	10.3	1696.0	32.3	0.174	1.418	1.698	33.143	31464	29.1	4.229	156	95.5	102.8	0.0	0.014	7448	7288	500m.pg1211.cx5
999	7512	1294	10.3	1691.4	32.3	0.172	1.406	1.693	33.072	31756	29.2	4.228	155	95.5	102.8	0.0	0.017	7512	7352	500m.pg137.cx5
999	7342	1294	10.3	1736.7	31.6	0.176	1.443	1.738	32.419	31068	28.5	4.232	155	95.5	104.5	0.0	0.007	7352	7176	500m.pg143.cx5
999	7180	1294	10.3	1727.9	31.5	0.180	1.475	1.729	32.332	30411	28.3	4.236	158	95.5	104.5	0.0	0.006	7179	7048	500m.pg15b1.cx5
l.i0
l.i0: load without secondary indexes
Performance metrics for all DBMS, not just the ones listed above. Some are normalized by throughput, others are not. Legend for results is here.
ips	qps	rps	rmbps	wps	wmbps	rpq	rkbpq	wpi	wkbpi	csps	cpups	cspq	cpupq	dbgb1	dbgb2	rss	maxop	p50	p99	tag
102796	0	44	0.3	195.8	39.6	0.000	0.003	0.002	0.395	12269	42.1	0.119	16	47.8	55.8	0.0	0.146	102887	98592	500m.pg1211.cx5
107296	0	38	0.3	160.6	51.4	0.000	0.003	0.001	0.490	12894	43.5	0.120	16	47.8	62.9	0.0	0.127	107883	98795	500m.pg137.cx5
100867	0	37	0.4	139.1	46.5	0.000	0.004	0.001	0.472	12091	43.2	0.120	17	47.8	63.5	5.4	0.239	101289	95298	500m.pg143.cx5
91929	0	34	0.3	130.7	43.3	0.000	0.003	0.001	0.482	11057	42.5	0.120	18	47.8	63.4	0.0	0.432	92199	86408	500m.pg15b1.cx5
l.x
l.x: create secondary indexes
Performance metrics for all DBMS, not just the ones listed above. Some are normalized by throughput, others are not. Legend for results is here.
ips	qps	rps	rmbps	wps	wmbps	rpq	rkbpq	wpi	wkbpi	csps	cpups	cspq	cpupq	dbgb1	dbgb2	rss	maxop	p50	p99	tag
221283	0	570	69.2	473.0	102.2	0.003	0.320	0.002	0.473	918	22.7	0.004	4	91.9	111.5	0.0	0.003	NA	NA	500m.pg1211.cx5
241361	0	591	73.5	198.0	77.1	0.002	0.312	0.001	0.327	522	23.1	0.002	4	91.9	106.1	0.0	0.006	NA	NA	500m.pg137.cx5
237239	0	579	72.0	203.0	78.2	0.002	0.311	0.001	0.338	602	22.9	0.003	4	91.9	110.4	0.0	0.003	NA	NA	500m.pg143.cx5
234899	0	648	80.4	214.0	83.6	0.003	0.351	0.001	0.365	572	22.8	0.002	4	91.9	107.5	0.0	0.003	NA	NA	500m.pg15b1.cx5
l.i1
l.i1: continue load after secondary indexes created
Performance metrics for all DBMS, not just the ones listed above. Some are normalized by throughput, others are not. Legend for results is here.
ips	qps	rps	rmbps	wps	wmbps	rpq	rkbpq	wpi	wkbpi	csps	cpups	cspq	cpupq	dbgb1	dbgb2	rss	maxop	p50	p99	tag
2407	0	3219	25.8	4082.4	64.9	1.337	10.961	1.696	27.626	7457	22.0	3.098	366	93.6	110.4	0.0	0.140	2447	1598	500m.pg1211.cx5
2379	0	3212	25.7	4051.1	65.2	1.350	11.070	1.703	28.059	7539	22.0	3.169	370	93.6	110.4	0.0	0.155	2447	1548	500m.pg137.cx5
2308	0	3113	24.9	3947.4	64.9	1.349	11.057	1.710	28.794	7175	20.8	3.109	361	93.6	113.2	0.0	0.377	2347	1298	500m.pg143.cx5
2344	0	3168	25.4	4002.6	63.4	1.352	11.086	1.708	27.703	7234	20.3	3.087	346	93.6	112.4	0.0	0.305	2347	1298	500m.pg15b1.cx5
q100.1
q100.1: range queries with 100 insert/s per client
Performance metrics for all DBMS, not just the ones listed above. Some are normalized by throughput, others are not. Legend for results is here.
ips	qps	rps	rmbps	wps	wmbps	rpq	rkbpq	wpi	wkbpi	csps	cpups	cspq	cpupq	dbgb1	dbgb2	rss	maxop	p50	p99	tag
100	7540	135	1.1	270.4	4.2	0.018	0.147	2.709	43.065	29332	27.7	3.890	147	93.7	96.1	0.0	0.015	7560	7080	500m.pg1211.cx5
100	7587	137	1.1	273.5	4.3	0.018	0.148	2.741	43.809	29522	27.7	3.891	146	93.7	96.1	0.0	0.050	7608	6952	500m.pg137.cx5
100	7465	137	1.1	335.7	4.8	0.018	0.151	3.360	48.811	28979	26.3	3.882	141	93.7	98.5	0.0	0.046	7496	6297	500m.pg143.cx5
100	7344	137	1.1	291.5	4.4	0.019	0.153	2.921	45.419	28491	26.2	3.879	143	93.7	99.3	0.0	0.053	7368	6473	500m.pg15b1.cx5
q500.1
q500.1: range queries with 500 insert/s per client
Performance metrics for all DBMS, not just the ones listed above. Some are normalized by throughput, others are not. Legend for results is here.
ips	qps	rps	rmbps	wps	wmbps	rpq	rkbpq	wpi	wkbpi	csps	cpups	cspq	cpupq	dbgb1	dbgb2	rss	maxop	p50	p99	tag
500	7541	658	5.2	1056.0	18.4	0.087	0.708	2.114	37.763	30450	28.1	4.038	149	94.6	98.8	0.0	0.005	7544	7419	500m.pg1211.cx5
500	7574	658	5.2	1063.6	18.5	0.087	0.705	2.129	37.960	30588	28.3	4.039	149	94.6	98.8	0.0	0.017	7576	7448	500m.pg137.cx5
500	7425	658	5.2	1018.5	17.8	0.089	0.721	2.039	36.461	29974	27.4	4.037	148	94.6	99.7	0.0	0.005	7432	7272	500m.pg143.cx5
499	7289	658	5.2	1018.5	17.8	0.090	0.734	2.039	36.494	29431	27.3	4.038	150	94.6	99.7	0.0	0.005	7288	7176	500m.pg15b1.cx5
q1000.1
q1000.1: range queries with 1000 insert/s per client
Performance metrics for all DBMS, not just the ones listed above. Some are normalized by throughput, others are not. Legend for results is here.
ips	qps	rps	rmbps	wps	wmbps	rpq	rkbpq	wpi	wkbpi	csps	cpups	cspq	cpupq	dbgb1	dbgb2	rss	maxop	p50	p99	tag
999	7440	1292	10.3	1696.0	32.3	0.174	1.418	1.698	33.143	31464	29.1	4.229	156	95.5	102.8	0.0	0.014	7448	7288	500m.pg1211.cx5
999	7512	1294	10.3	1691.4	32.3	0.172	1.406	1.693	33.072	31756	29.2	4.228	155	95.5	102.8	0.0	0.017	7512	7352	500m.pg137.cx5
999	7342	1294	10.3	1736.7	31.6	0.176	1.443	1.738	32.419	31068	28.5	4.232	155	95.5	104.5	0.0	0.007	7352	7176	500m.pg143.cx5
999	7180	1294	10.3	1727.9	31.5	0.180	1.475	1.729	32.332	30411	28.3	4.236	158	95.5	104.5	0.0	0.006	7179	7048	500m.pg15b1.cx5
l.i0
- l.i0: load without secondary indexes
- Legend for results is here.
- Each entry lists the percentage of responses that fit in that bucket (slower than max time for previous bucket, faster than min time for next bucket).
Insert response time histogram
256us	1ms	4ms	16ms	64ms	256ms	1s	4s	16s	gt	max	tag
0.000	92.857	7.140	0.002	0.001	nonzero	0.000	0.000	0.000	0.000	0.146	pg1211.cx5
0.000	96.923	3.073	0.003	0.001	nonzero	0.000	0.000	0.000	0.000	0.127	pg137.cx5
0.000	83.055	16.941	0.003	0.001	nonzero	0.000	0.000	0.000	0.000	0.239	pg143.cx5
0.000	1.142	98.852	0.005	0.001	nonzero	nonzero	0.000	0.000	0.000	0.432	pg15b1.cx5
l.x
- l.x: create secondary indexes
- Legend for results is here.
- Each entry lists the percentage of responses that fit in that bucket (slower than max time for previous bucket, faster than min time for next bucket).
TODO - determine whether there is data for create index response time
l.i1
- l.i1: continue load after secondary indexes created
- Legend for results is here.
- Each entry lists the percentage of responses that fit in that bucket (slower than max time for previous bucket, faster than min time for next bucket).
Insert response time histogram
256us	1ms	4ms	16ms	64ms	256ms	1s	4s	16s	gt	max	tag
0.000	0.000	0.000	26.661	73.311	0.028	0.000	0.000	0.000	0.000	0.140	pg1211.cx5
0.000	0.000	0.000	24.784	75.091	0.124	0.000	0.000	0.000	0.000	0.155	pg137.cx5
0.000	0.000	0.000	21.258	78.626	0.114	0.002	0.000	0.000	0.000	0.377	pg143.cx5
0.000	0.000	0.000	20.479	79.454	0.066	0.002	0.000	0.000	0.000	0.305	pg15b1.cx5
q100.1
- q100.1: range queries with 100 insert/s per client
- Legend for results is here.
- Each entry lists the percentage of responses that fit in that bucket (slower than max time for previous bucket, faster than min time for next bucket).
Query response time histogram
256us	1ms	4ms	16ms	64ms	256ms	1s	4s	16s	gt	max	tag
99.903	0.097	0.001	nonzero	0.000	0.000	0.000	0.000	0.000	0.000	0.015	pg1211.cx5
99.883	0.115	0.001	nonzero	nonzero	0.000	0.000	0.000	0.000	0.000	0.050	pg137.cx5
99.825	0.172	0.003	nonzero	nonzero	0.000	0.000	0.000	0.000	0.000	0.046	pg143.cx5
99.829	0.168	0.003	nonzero	nonzero	0.000	0.000	0.000	0.000	0.000	0.053	pg15b1.cx5
Insert response time histogram
256us	1ms	4ms	16ms	64ms	256ms	1s	4s	16s	gt	max	tag
0.000	0.000	0.000	85.146	14.854	0.000	0.000	0.000	0.000	0.000	0.033	pg1211.cx5
0.000	0.000	0.000	85.708	14.285	0.007	0.000	0.000	0.000	0.000	0.255	pg137.cx5
0.000	0.000	0.000	96.861	3.132	0.007	0.000	0.000	0.000	0.000	0.095	pg143.cx5
0.000	0.000	0.000	96.507	3.486	0.007	0.000	0.000	0.000	0.000	0.230	pg15b1.cx5
q500.1
- q500.1: range queries with 500 insert/s per client
- Legend for results is here.
- Each entry lists the percentage of responses that fit in that bucket (slower than max time for previous bucket, faster than min time for next bucket).
Query response time histogram
256us	1ms	4ms	16ms	64ms	256ms	1s	4s	16s	gt	max	tag
99.910	0.088	0.002	nonzero	0.000	0.000	0.000	0.000	0.000	0.000	0.005	pg1211.cx5
99.920	0.078	0.002	nonzero	nonzero	0.000	0.000	0.000	0.000	0.000	0.017	pg137.cx5
99.861	0.137	0.002	nonzero	0.000	0.000	0.000	0.000	0.000	0.000	0.005	pg143.cx5
99.849	0.149	0.002	nonzero	0.000	0.000	0.000	0.000	0.000	0.000	0.005	pg15b1.cx5
Insert response time histogram
256us	1ms	4ms	16ms	64ms	256ms	1s	4s	16s	gt	max	tag
0.000	0.000	0.000	97.018	2.979	0.003	0.000	0.000	0.000	0.000	0.078	pg1211.cx5
0.000	0.000	0.000	96.667	3.326	0.007	0.000	0.000	0.000	0.000	0.075	pg137.cx5
0.000	0.000	0.000	89.878	10.114	0.008	0.000	0.000	0.000	0.000	0.113	pg143.cx5
0.000	0.000	0.000	92.101	7.893	0.006	0.000	0.000	0.000	0.000	0.076	pg15b1.cx5
q1000.1
- q1000.1: range queries with 1000 insert/s per client
- Legend for results is here.
- Each entry lists the percentage of responses that fit in that bucket (slower than max time for previous bucket, faster than min time for next bucket).
Query response time histogram
256us	1ms	4ms	16ms	64ms	256ms	1s	4s	16s	gt	max	tag
99.830	0.167	0.003	nonzero	0.000	0.000	0.000	0.000	0.000	0.000	0.014	pg1211.cx5
99.844	0.153	0.003	nonzero	nonzero	0.000	0.000	0.000	0.000	0.000	0.017	pg137.cx5
99.716	0.281	0.003	nonzero	0.000	0.000	0.000	0.000	0.000	0.000	0.007	pg143.cx5
99.674	0.323	0.003	nonzero	0.000	0.000	0.000	0.000	0.000	0.000	0.006	pg15b1.cx5
Insert response time histogram
256us	1ms	4ms	16ms	64ms	256ms	1s	4s	16s	gt	max	tag
0.000	0.000	0.000	93.183	6.811	0.006	0.000	0.000	0.000	0.000	0.097	pg1211.cx5
0.000	0.000	0.000	91.966	8.026	0.008	0.000	0.000	0.000	0.000	0.092	pg137.cx5
0.000	0.000	0.000	83.035	16.935	0.027	0.003	0.000	0.000	0.000	0.513	pg143.cx5
0.000	0.000	0.000	84.762	15.217	0.021	0.001	0.000	0.000	0.000	0.293	pg15b1.cx5