Introduction
This is a report for the insert benchmark with 20M docs and 1 client(s). It is generated by scripts (bash, awk, sed) and Tufte might not be impressed. An overview of the insert benchmark is here and a short update is here. Below, by DBMS, I mean DBMS+version.config. An example is my8020.c10b40 where my means MySQL, 8020 is version 8.0.20 and c10b40 is the name for the configuration file.
The test server is an Intel NUC with 4 cores, 16G RAM and a Samsung 970 EVO. More details are here. Clients and the DBMS share one server. The per-database configs are in the per-database subdirectories here.
The tested DBMS are:
- pg140.cx5 - Postgres 14.0 and the cx5 config
- pg141.cx5 - Postgres 14.1 and the cx5 config
- pg142.cx5 - Postgres 14.2 and the cx5 config
- pg143.cx5 - Postgres 14.3 and the cx5 config
Contents
- Summary
- l.i0: load without secondary indexes
- l.x: create secondary indexes
- l.i1: continue load after secondary indexes created
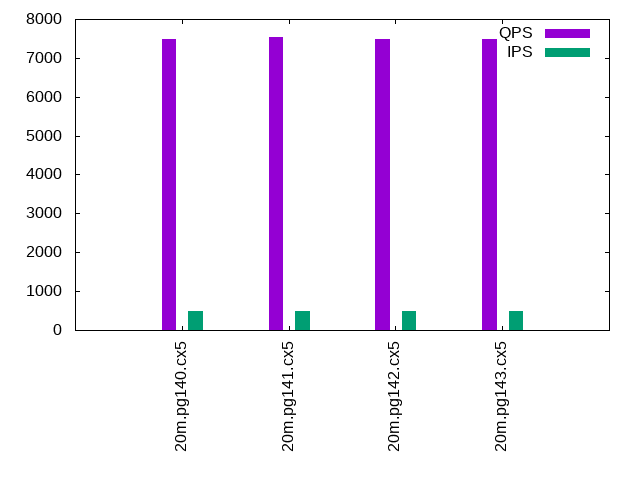
- q100.1: range queries with 100 insert/s per client
- q500.1: range queries with 500 insert/s per client
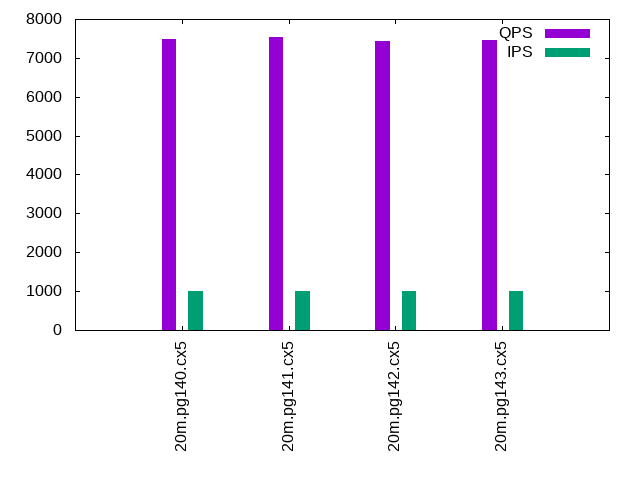
- q1000.1: range queries with 1000 insert/s per client
Summary
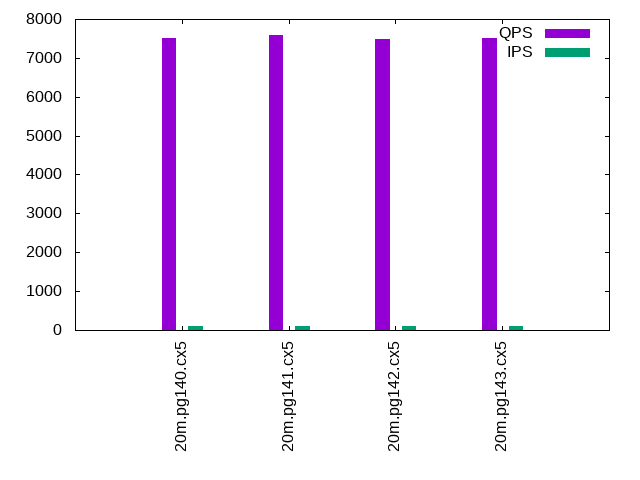
The numbers are inserts/s for l.i0 and l.i1, indexed docs (or rows) /s for l.x and queries/s for q*.2. The values are the average rate over the entire test for inserts (IPS) and queries (QPS). The range of values for IPS and QPS is split into 3 parts: bottom 25%, middle 50%, top 25%. Values in the bottom 25% have a red background, values in the top 25% have a green background and values in the middle have no color. A gray background is used for values that can be ignored because the DBMS did not sustain the target insert rate. Red backgrounds are not used when the minimum value is within 80% of the max value.
| dbms | l.i0 | l.x | l.i1 | q100.1 | q500.1 | q1000.1 |
|---|---|---|---|---|---|---|
| 20m.pg140.cx5 | 101010 | 304545 | 37951 | 7509 | 7498 | 7491 |
| 20m.pg141.cx5 | 100000 | 300000 | 37736 | 7586 | 7542 | 7526 |
| 20m.pg142.cx5 | 101523 | 300000 | 37951 | 7482 | 7479 | 7424 |
| 20m.pg143.cx5 | 101010 | 300000 | 37951 | 7508 | 7497 | 7467 |
This lists the average rate of inserts/s for the tests that do inserts concurrent with queries. For such tests the query rate is listed in the table above. The read+write tests are setup so that the insert rate should match the target rate every second. Cells that are not at least 95% of the target have a red background to indicate a failure to satisfy the target.
| dbms | q100.1 | q500.1 | q1000.1 |
|---|---|---|---|
| pg140.cx5 | 100 | 500 | 999 |
| pg141.cx5 | 100 | 499 | 999 |
| pg142.cx5 | 100 | 500 | 999 |
| pg143.cx5 | 100 | 499 | 999 |
| target | 100 | 500 | 1000 |
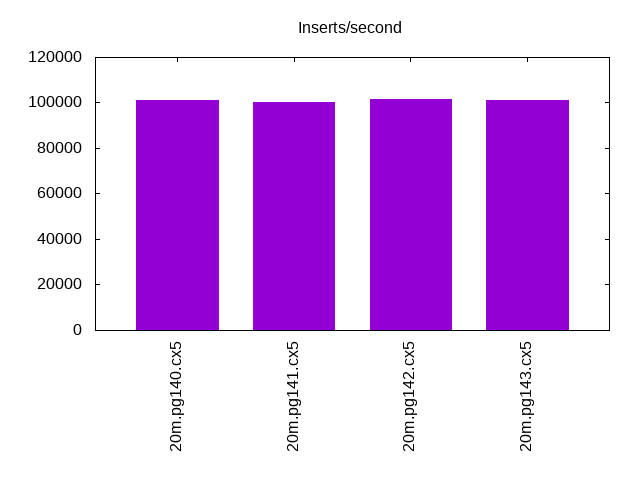
l.i0
l.i0: load without secondary indexes. Graphs for performance per 1-second interval are here.
Average throughput:
Insert response time histogram: each cell has the percentage of responses that take <= the time in the header and max is the max response time in seconds. For the max column values in the top 25% of the range have a red background and in the bottom 25% of the range have a green background. The red background is not used when the min value is within 80% of the max value.
| dbms | 256us | 1ms | 4ms | 16ms | 64ms | 256ms | 1s | 4s | 16s | gt | max |
|---|---|---|---|---|---|---|---|---|---|---|---|
| pg140.cx5 | 85.585 | 14.415 | 0.001 | 0.005 | |||||||
| pg141.cx5 | 78.752 | 21.246 | 0.002 | 0.006 | |||||||
| pg142.cx5 | 87.804 | 12.194 | 0.002 | 0.006 | |||||||
| pg143.cx5 | 80.902 | 19.098 | 0.003 |
Performance metrics for the DBMS listed above. Some are normalized by throughput, others are not. Legend for results is here.
ips	qps	rps	rmbps	wps	wmbps	rpq	rkbpq	wpi	wkbpi	csps	cpups	cspq	cpupq	dbgb1	dbgb2	rss	maxop	p50	p99	tag
101010	0	0	0.0	64.7	42.3	0.000	0.000	0.001	0.429	12275	42.1	0.122	17	1.9	5.2	0.0	0.005	101392	82110	20m.pg140.cx5
100000	0	0	0.0	66.5	43.1	0.000	0.000	0.001	0.442	12158	44.7	0.122	18	1.9	5.2	0.0	0.006	100591	89889	20m.pg141.cx5
101523	0	0	0.0	66.3	42.8	0.000	0.000	0.001	0.431	12314	42.6	0.121	17	1.9	5.2	0.0	0.006	101790	82112	20m.pg142.cx5
101010	0	0	0.0	65.7	42.9	0.000	0.000	0.001	0.435	12258	43.0	0.121	17	1.9	5.2	0.0	0.003	101284	82135	20m.pg143.cx5
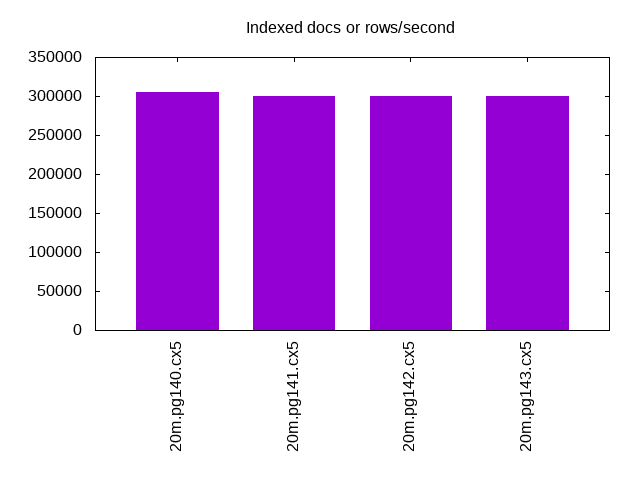
l.x
l.x: create secondary indexes.
Average throughput:
Performance metrics for the DBMS listed above. Some are normalized by throughput, others are not. Legend for results is here.
ips	qps	rps	rmbps	wps	wmbps	rpq	rkbpq	wpi	wkbpi	csps	cpups	cspq	cpupq	dbgb1	dbgb2	rss	maxop	p50	p99	tag
304545	0	0	0.0	64.1	67.7	0.000	0.000	0.000	0.228	1986	25.0	0.007	3	3.7	8.6	0.0	0.002	NA	NA	20m.pg140.cx5
300000	0	0	0.0	59.9	63.4	0.000	0.000	0.000	0.216	1888	24.7	0.006	3	3.7	8.6	0.0	0.002	NA	NA	20m.pg141.cx5
300000	0	0	0.0	59.2	62.1	0.000	0.000	0.000	0.212	1949	24.8	0.006	3	3.7	8.6	0.0	0.002	NA	NA	20m.pg142.cx5
300000	0	0	0.0	57.8	61.6	0.000	0.000	0.000	0.210	1896	25.0	0.006	3	3.7	8.6	0.0	0.002	NA	NA	20m.pg143.cx5
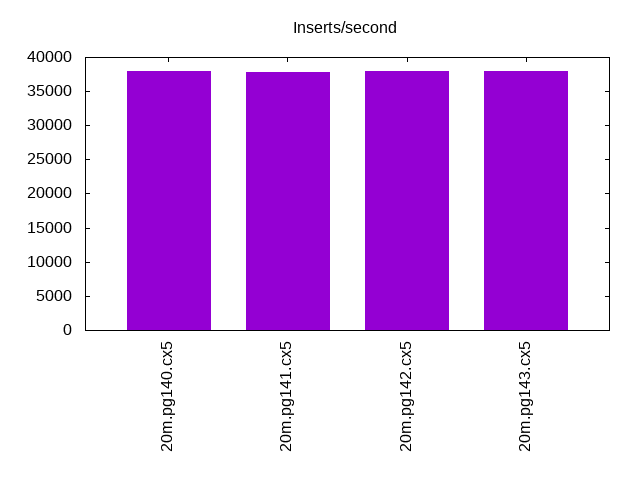
l.i1
l.i1: continue load after secondary indexes created. Graphs for performance per 1-second interval are here.
Average throughput:
Insert response time histogram: each cell has the percentage of responses that take <= the time in the header and max is the max response time in seconds. For the max column values in the top 25% of the range have a red background and in the bottom 25% of the range have a green background. The red background is not used when the min value is within 80% of the max value.
| dbms | 256us | 1ms | 4ms | 16ms | 64ms | 256ms | 1s | 4s | 16s | gt | max |
|---|---|---|---|---|---|---|---|---|---|---|---|
| pg140.cx5 | 99.844 | 0.126 | 0.028 | 0.001 | nonzero | 1.295 | |||||
| pg141.cx5 | 99.826 | 0.142 | 0.029 | 0.002 | 0.001 | 0.383 | |||||
| pg142.cx5 | 99.850 | 0.121 | 0.028 | 0.002 | nonzero | 0.485 | |||||
| pg143.cx5 | 99.855 | 0.115 | 0.029 | 0.001 | nonzero | 0.336 |
Performance metrics for the DBMS listed above. Some are normalized by throughput, others are not. Legend for results is here.
ips	qps	rps	rmbps	wps	wmbps	rpq	rkbpq	wpi	wkbpi	csps	cpups	cspq	cpupq	dbgb1	dbgb2	rss	maxop	p50	p99	tag
37951	0	0	0.0	155.7	63.6	0.000	0.000	0.004	1.715	9569	36.1	0.252	38	8.2	20.8	0.0	1.295	39571	9488	20m.pg140.cx5
37736	0	0	0.0	154.8	63.6	0.000	0.000	0.004	1.725	9527	36.1	0.252	38	8.2	20.8	0.0	0.383	39507	11485	20m.pg141.cx5
37951	0	0	0.0	155.8	63.9	0.000	0.000	0.004	1.723	9578	36.0	0.252	38	8.2	20.8	0.0	0.485	39624	12248	20m.pg142.cx5
37951	0	0	0.0	154.1	63.6	0.000	0.000	0.004	1.715	9572	35.9	0.252	38	8.2	20.8	0.0	0.336	39607	12848	20m.pg143.cx5
q100.1
q100.1: range queries with 100 insert/s per client. Graphs for performance per 1-second interval are here.
Average throughput:
Query response time histogram: each cell has the percentage of responses that take <= the time in the header and max is the max response time in seconds. For max values in the top 25% of the range have a red background and in the bottom 25% of the range have a green background. The red background is not used when the min value is within 80% of the max value.
| dbms | 256us | 1ms | 4ms | 16ms | 64ms | 256ms | 1s | 4s | 16s | gt | max |
|---|---|---|---|---|---|---|---|---|---|---|---|
| pg140.cx5 | 99.945 | 0.054 | 0.001 | nonzero | 0.005 | ||||||
| pg141.cx5 | 99.948 | 0.051 | 0.001 | 0.003 | |||||||
| pg142.cx5 | 99.940 | 0.059 | 0.001 | 0.003 | |||||||
| pg143.cx5 | 99.937 | 0.062 | 0.001 | 0.003 |
Insert response time histogram: each cell has the percentage of responses that take <= the time in the header and max is the max response time in seconds. For max values in the top 25% of the range have a red background and in the bottom 25% of the range have a green background. The red background is not used when the min value is within 80% of the max value.
| dbms | 256us | 1ms | 4ms | 16ms | 64ms | 256ms | 1s | 4s | 16s | gt | max |
|---|---|---|---|---|---|---|---|---|---|---|---|
| pg140.cx5 | 99.979 | 0.021 | 0.005 | ||||||||
| pg141.cx5 | 99.986 | 0.014 | 0.005 | ||||||||
| pg142.cx5 | 99.986 | 0.014 | 0.005 | ||||||||
| pg143.cx5 | 99.979 | 0.021 | 0.005 |
Performance metrics for the DBMS listed above. Some are normalized by throughput, others are not. Legend for results is here.
ips	qps	rps	rmbps	wps	wmbps	rpq	rkbpq	wpi	wkbpi	csps	cpups	cspq	cpupq	dbgb1	dbgb2	rss	maxop	p50	p99	tag
100	7509	0	0.0	197.1	4.4	0.000	0.000	1.973	44.726	28883	26.3	3.847	140	8.3	10.8	0.0	0.005	7512	7368	20m.pg140.cx5
100	7586	0	0.0	197.0	4.3	0.000	0.000	1.974	44.626	29176	26.1	3.846	138	8.3	10.8	0.0	0.003	7592	7480	20m.pg141.cx5
100	7482	0	0.0	197.4	4.4	0.000	0.000	1.976	44.597	28779	26.2	3.846	140	8.3	10.8	0.0	0.003	7480	7336	20m.pg142.cx5
100	7508	0	0.0	197.1	4.4	0.000	0.000	1.975	44.699	28894	26.3	3.849	140	8.3	10.8	0.0	0.003	7512	7368	20m.pg143.cx5
q500.1
q500.1: range queries with 500 insert/s per client. Graphs for performance per 1-second interval are here.
Average throughput:
Query response time histogram: each cell has the percentage of responses that take <= the time in the header and max is the max response time in seconds. For max values in the top 25% of the range have a red background and in the bottom 25% of the range have a green background. The red background is not used when the min value is within 80% of the max value.
| dbms | 256us | 1ms | 4ms | 16ms | 64ms | 256ms | 1s | 4s | 16s | gt | max |
|---|---|---|---|---|---|---|---|---|---|---|---|
| pg140.cx5 | 99.895 | 0.098 | 0.007 | nonzero | 0.007 | ||||||
| pg141.cx5 | 99.901 | 0.092 | 0.007 | nonzero | 0.006 | ||||||
| pg142.cx5 | 99.897 | 0.097 | 0.007 | nonzero | 0.006 | ||||||
| pg143.cx5 | 99.887 | 0.106 | 0.007 | nonzero | 0.005 |
Insert response time histogram: each cell has the percentage of responses that take <= the time in the header and max is the max response time in seconds. For max values in the top 25% of the range have a red background and in the bottom 25% of the range have a green background. The red background is not used when the min value is within 80% of the max value.
| dbms | 256us | 1ms | 4ms | 16ms | 64ms | 256ms | 1s | 4s | 16s | gt | max |
|---|---|---|---|---|---|---|---|---|---|---|---|
| pg140.cx5 | 99.990 | 0.010 | 0.008 | ||||||||
| pg141.cx5 | 99.987 | 0.013 | 0.007 | ||||||||
| pg142.cx5 | 99.976 | 0.024 | 0.008 | ||||||||
| pg143.cx5 | 99.987 | 0.013 | 0.016 |
Performance metrics for the DBMS listed above. Some are normalized by throughput, others are not. Legend for results is here.
ips	qps	rps	rmbps	wps	wmbps	rpq	rkbpq	wpi	wkbpi	csps	cpups	cspq	cpupq	dbgb1	dbgb2	rss	maxop	p50	p99	tag
500	7498	0	0.0	376.5	12.4	0.000	0.000	0.754	25.404	28954	26.6	3.861	142	9.7	13.3	0.0	0.007	7498	7352	20m.pg140.cx5
499	7542	0	0.0	376.4	12.4	0.000	0.000	0.754	25.400	29124	26.6	3.861	141	9.7	13.3	0.0	0.006	7544	7432	20m.pg141.cx5
500	7479	0	0.0	376.8	12.4	0.000	0.000	0.754	25.402	28879	26.6	3.861	142	9.7	13.3	0.0	0.006	7480	7336	20m.pg142.cx5
499	7497	0	0.0	376.6	12.4	0.000	0.000	0.754	25.414	28957	26.7	3.862	142	9.7	13.3	0.0	0.005	7498	7368	20m.pg143.cx5
q1000.1
q1000.1: range queries with 1000 insert/s per client. Graphs for performance per 1-second interval are here.
Average throughput:
Query response time histogram: each cell has the percentage of responses that take <= the time in the header and max is the max response time in seconds. For max values in the top 25% of the range have a red background and in the bottom 25% of the range have a green background. The red background is not used when the min value is within 80% of the max value.
| dbms | 256us | 1ms | 4ms | 16ms | 64ms | 256ms | 1s | 4s | 16s | gt | max |
|---|---|---|---|---|---|---|---|---|---|---|---|
| pg140.cx5 | 99.841 | 0.144 | 0.014 | nonzero | 0.008 | ||||||
| pg141.cx5 | 99.846 | 0.139 | 0.015 | nonzero | 0.011 | ||||||
| pg142.cx5 | 99.835 | 0.151 | 0.015 | nonzero | 0.007 | ||||||
| pg143.cx5 | 99.830 | 0.156 | 0.014 | nonzero | 0.007 |
Insert response time histogram: each cell has the percentage of responses that take <= the time in the header and max is the max response time in seconds. For max values in the top 25% of the range have a red background and in the bottom 25% of the range have a green background. The red background is not used when the min value is within 80% of the max value.
| dbms | 256us | 1ms | 4ms | 16ms | 64ms | 256ms | 1s | 4s | 16s | gt | max |
|---|---|---|---|---|---|---|---|---|---|---|---|
| pg140.cx5 | 98.272 | 1.719 | 0.010 | 0.036 | |||||||
| pg141.cx5 | 98.223 | 1.767 | 0.010 | 0.035 | |||||||
| pg142.cx5 | 98.258 | 1.726 | 0.015 | 0.036 | |||||||
| pg143.cx5 | 98.199 | 1.790 | 0.010 | 0.035 |
Performance metrics for the DBMS listed above. Some are normalized by throughput, others are not. Legend for results is here.
ips	qps	rps	rmbps	wps	wmbps	rpq	rkbpq	wpi	wkbpi	csps	cpups	cspq	cpupq	dbgb1	dbgb2	rss	maxop	p50	p99	tag
999	7491	7	0.1	513.4	17.5	0.001	0.008	0.514	17.943	29050	27.2	3.878	145	12.0	16.7	0.0	0.008	7496	7352	20m.pg140.cx5
999	7526	7	0.1	513.1	17.5	0.001	0.008	0.514	17.939	29184	27.2	3.878	145	12.0	16.7	0.0	0.011	7528	7389	20m.pg141.cx5
999	7424	7	0.1	513.1	17.5	0.001	0.008	0.514	17.931	28787	27.1	3.878	146	12.0	16.7	0.0	0.007	7432	7272	20m.pg142.cx5
999	7467	7	0.1	512.9	17.5	0.001	0.008	0.513	17.943	28955	27.2	3.878	146	12.0	16.7	0.0	0.007	7480	7320	20m.pg143.cx5
l.i0
l.i0: load without secondary indexes
Performance metrics for all DBMS, not just the ones listed above. Some are normalized by throughput, others are not. Legend for results is here.
ips	qps	rps	rmbps	wps	wmbps	rpq	rkbpq	wpi	wkbpi	csps	cpups	cspq	cpupq	dbgb1	dbgb2	rss	maxop	p50	p99	tag
101010	0	0	0.0	64.7	42.3	0.000	0.000	0.001	0.429	12275	42.1	0.122	17	1.9	5.2	0.0	0.005	101392	82110	20m.pg140.cx5
100000	0	0	0.0	66.5	43.1	0.000	0.000	0.001	0.442	12158	44.7	0.122	18	1.9	5.2	0.0	0.006	100591	89889	20m.pg141.cx5
101523	0	0	0.0	66.3	42.8	0.000	0.000	0.001	0.431	12314	42.6	0.121	17	1.9	5.2	0.0	0.006	101790	82112	20m.pg142.cx5
101010	0	0	0.0	65.7	42.9	0.000	0.000	0.001	0.435	12258	43.0	0.121	17	1.9	5.2	0.0	0.003	101284	82135	20m.pg143.cx5
l.x
l.x: create secondary indexes
Performance metrics for all DBMS, not just the ones listed above. Some are normalized by throughput, others are not. Legend for results is here.
ips	qps	rps	rmbps	wps	wmbps	rpq	rkbpq	wpi	wkbpi	csps	cpups	cspq	cpupq	dbgb1	dbgb2	rss	maxop	p50	p99	tag
304545	0	0	0.0	64.1	67.7	0.000	0.000	0.000	0.228	1986	25.0	0.007	3	3.7	8.6	0.0	0.002	NA	NA	20m.pg140.cx5
300000	0	0	0.0	59.9	63.4	0.000	0.000	0.000	0.216	1888	24.7	0.006	3	3.7	8.6	0.0	0.002	NA	NA	20m.pg141.cx5
300000	0	0	0.0	59.2	62.1	0.000	0.000	0.000	0.212	1949	24.8	0.006	3	3.7	8.6	0.0	0.002	NA	NA	20m.pg142.cx5
300000	0	0	0.0	57.8	61.6	0.000	0.000	0.000	0.210	1896	25.0	0.006	3	3.7	8.6	0.0	0.002	NA	NA	20m.pg143.cx5
l.i1
l.i1: continue load after secondary indexes created
Performance metrics for all DBMS, not just the ones listed above. Some are normalized by throughput, others are not. Legend for results is here.
ips	qps	rps	rmbps	wps	wmbps	rpq	rkbpq	wpi	wkbpi	csps	cpups	cspq	cpupq	dbgb1	dbgb2	rss	maxop	p50	p99	tag
37951	0	0	0.0	155.7	63.6	0.000	0.000	0.004	1.715	9569	36.1	0.252	38	8.2	20.8	0.0	1.295	39571	9488	20m.pg140.cx5
37736	0	0	0.0	154.8	63.6	0.000	0.000	0.004	1.725	9527	36.1	0.252	38	8.2	20.8	0.0	0.383	39507	11485	20m.pg141.cx5
37951	0	0	0.0	155.8	63.9	0.000	0.000	0.004	1.723	9578	36.0	0.252	38	8.2	20.8	0.0	0.485	39624	12248	20m.pg142.cx5
37951	0	0	0.0	154.1	63.6	0.000	0.000	0.004	1.715	9572	35.9	0.252	38	8.2	20.8	0.0	0.336	39607	12848	20m.pg143.cx5
q100.1
q100.1: range queries with 100 insert/s per client
Performance metrics for all DBMS, not just the ones listed above. Some are normalized by throughput, others are not. Legend for results is here.
ips	qps	rps	rmbps	wps	wmbps	rpq	rkbpq	wpi	wkbpi	csps	cpups	cspq	cpupq	dbgb1	dbgb2	rss	maxop	p50	p99	tag
100	7509	0	0.0	197.1	4.4	0.000	0.000	1.973	44.726	28883	26.3	3.847	140	8.3	10.8	0.0	0.005	7512	7368	20m.pg140.cx5
100	7586	0	0.0	197.0	4.3	0.000	0.000	1.974	44.626	29176	26.1	3.846	138	8.3	10.8	0.0	0.003	7592	7480	20m.pg141.cx5
100	7482	0	0.0	197.4	4.4	0.000	0.000	1.976	44.597	28779	26.2	3.846	140	8.3	10.8	0.0	0.003	7480	7336	20m.pg142.cx5
100	7508	0	0.0	197.1	4.4	0.000	0.000	1.975	44.699	28894	26.3	3.849	140	8.3	10.8	0.0	0.003	7512	7368	20m.pg143.cx5
q500.1
q500.1: range queries with 500 insert/s per client
Performance metrics for all DBMS, not just the ones listed above. Some are normalized by throughput, others are not. Legend for results is here.
ips	qps	rps	rmbps	wps	wmbps	rpq	rkbpq	wpi	wkbpi	csps	cpups	cspq	cpupq	dbgb1	dbgb2	rss	maxop	p50	p99	tag
500	7498	0	0.0	376.5	12.4	0.000	0.000	0.754	25.404	28954	26.6	3.861	142	9.7	13.3	0.0	0.007	7498	7352	20m.pg140.cx5
499	7542	0	0.0	376.4	12.4	0.000	0.000	0.754	25.400	29124	26.6	3.861	141	9.7	13.3	0.0	0.006	7544	7432	20m.pg141.cx5
500	7479	0	0.0	376.8	12.4	0.000	0.000	0.754	25.402	28879	26.6	3.861	142	9.7	13.3	0.0	0.006	7480	7336	20m.pg142.cx5
499	7497	0	0.0	376.6	12.4	0.000	0.000	0.754	25.414	28957	26.7	3.862	142	9.7	13.3	0.0	0.005	7498	7368	20m.pg143.cx5
q1000.1
q1000.1: range queries with 1000 insert/s per client
Performance metrics for all DBMS, not just the ones listed above. Some are normalized by throughput, others are not. Legend for results is here.
ips	qps	rps	rmbps	wps	wmbps	rpq	rkbpq	wpi	wkbpi	csps	cpups	cspq	cpupq	dbgb1	dbgb2	rss	maxop	p50	p99	tag
999	7491	7	0.1	513.4	17.5	0.001	0.008	0.514	17.943	29050	27.2	3.878	145	12.0	16.7	0.0	0.008	7496	7352	20m.pg140.cx5
999	7526	7	0.1	513.1	17.5	0.001	0.008	0.514	17.939	29184	27.2	3.878	145	12.0	16.7	0.0	0.011	7528	7389	20m.pg141.cx5
999	7424	7	0.1	513.1	17.5	0.001	0.008	0.514	17.931	28787	27.1	3.878	146	12.0	16.7	0.0	0.007	7432	7272	20m.pg142.cx5
999	7467	7	0.1	512.9	17.5	0.001	0.008	0.513	17.943	28955	27.2	3.878	146	12.0	16.7	0.0	0.007	7480	7320	20m.pg143.cx5
l.i0
- l.i0: load without secondary indexes
- Legend for results is here.
- Each entry lists the percentage of responses that fit in that bucket (slower than max time for previous bucket, faster than min time for next bucket).
Insert response time histogram
256us	1ms	4ms	16ms	64ms	256ms	1s	4s	16s	gt	max	tag
0.000	85.585	14.415	0.001	0.000	0.000	0.000	0.000	0.000	0.000	0.005	pg140.cx5
0.000	78.752	21.246	0.002	0.000	0.000	0.000	0.000	0.000	0.000	0.006	pg141.cx5
0.000	87.804	12.194	0.002	0.000	0.000	0.000	0.000	0.000	0.000	0.006	pg142.cx5
0.000	80.902	19.098	0.000	0.000	0.000	0.000	0.000	0.000	0.000	0.003	pg143.cx5
l.x
- l.x: create secondary indexes
- Legend for results is here.
- Each entry lists the percentage of responses that fit in that bucket (slower than max time for previous bucket, faster than min time for next bucket).
TODO - determine whether there is data for create index response time
l.i1
- l.i1: continue load after secondary indexes created
- Legend for results is here.
- Each entry lists the percentage of responses that fit in that bucket (slower than max time for previous bucket, faster than min time for next bucket).
Insert response time histogram
256us	1ms	4ms	16ms	64ms	256ms	1s	4s	16s	gt	max	tag
0.000	0.000	99.844	0.126	0.028	0.001	0.000	nonzero	0.000	0.000	1.295	pg140.cx5
0.000	0.000	99.826	0.142	0.029	0.002	0.001	0.000	0.000	0.000	0.383	pg141.cx5
0.000	0.000	99.850	0.121	0.028	0.002	nonzero	0.000	0.000	0.000	0.485	pg142.cx5
0.000	0.000	99.855	0.115	0.029	0.001	nonzero	0.000	0.000	0.000	0.336	pg143.cx5
q100.1
- q100.1: range queries with 100 insert/s per client
- Legend for results is here.
- Each entry lists the percentage of responses that fit in that bucket (slower than max time for previous bucket, faster than min time for next bucket).
Query response time histogram
256us	1ms	4ms	16ms	64ms	256ms	1s	4s	16s	gt	max	tag
99.945	0.054	0.001	nonzero	0.000	0.000	0.000	0.000	0.000	0.000	0.005	pg140.cx5
99.948	0.051	0.001	0.000	0.000	0.000	0.000	0.000	0.000	0.000	0.003	pg141.cx5
99.940	0.059	0.001	0.000	0.000	0.000	0.000	0.000	0.000	0.000	0.003	pg142.cx5
99.937	0.062	0.001	0.000	0.000	0.000	0.000	0.000	0.000	0.000	0.003	pg143.cx5
Insert response time histogram
256us	1ms	4ms	16ms	64ms	256ms	1s	4s	16s	gt	max	tag
0.000	0.000	99.979	0.021	0.000	0.000	0.000	0.000	0.000	0.000	0.005	pg140.cx5
0.000	0.000	99.986	0.014	0.000	0.000	0.000	0.000	0.000	0.000	0.005	pg141.cx5
0.000	0.000	99.986	0.014	0.000	0.000	0.000	0.000	0.000	0.000	0.005	pg142.cx5
0.000	0.000	99.979	0.021	0.000	0.000	0.000	0.000	0.000	0.000	0.005	pg143.cx5
q500.1
- q500.1: range queries with 500 insert/s per client
- Legend for results is here.
- Each entry lists the percentage of responses that fit in that bucket (slower than max time for previous bucket, faster than min time for next bucket).
Query response time histogram
256us	1ms	4ms	16ms	64ms	256ms	1s	4s	16s	gt	max	tag
99.895	0.098	0.007	nonzero	0.000	0.000	0.000	0.000	0.000	0.000	0.007	pg140.cx5
99.901	0.092	0.007	nonzero	0.000	0.000	0.000	0.000	0.000	0.000	0.006	pg141.cx5
99.897	0.097	0.007	nonzero	0.000	0.000	0.000	0.000	0.000	0.000	0.006	pg142.cx5
99.887	0.106	0.007	nonzero	0.000	0.000	0.000	0.000	0.000	0.000	0.005	pg143.cx5
Insert response time histogram
256us	1ms	4ms	16ms	64ms	256ms	1s	4s	16s	gt	max	tag
0.000	0.000	99.990	0.010	0.000	0.000	0.000	0.000	0.000	0.000	0.008	pg140.cx5
0.000	0.000	99.987	0.013	0.000	0.000	0.000	0.000	0.000	0.000	0.007	pg141.cx5
0.000	0.000	99.976	0.024	0.000	0.000	0.000	0.000	0.000	0.000	0.008	pg142.cx5
0.000	0.000	99.987	0.013	0.000	0.000	0.000	0.000	0.000	0.000	0.016	pg143.cx5
q1000.1
- q1000.1: range queries with 1000 insert/s per client
- Legend for results is here.
- Each entry lists the percentage of responses that fit in that bucket (slower than max time for previous bucket, faster than min time for next bucket).
Query response time histogram
256us	1ms	4ms	16ms	64ms	256ms	1s	4s	16s	gt	max	tag
99.841	0.144	0.014	nonzero	0.000	0.000	0.000	0.000	0.000	0.000	0.008	pg140.cx5
99.846	0.139	0.015	nonzero	0.000	0.000	0.000	0.000	0.000	0.000	0.011	pg141.cx5
99.835	0.151	0.015	nonzero	0.000	0.000	0.000	0.000	0.000	0.000	0.007	pg142.cx5
99.830	0.156	0.014	nonzero	0.000	0.000	0.000	0.000	0.000	0.000	0.007	pg143.cx5
Insert response time histogram
256us	1ms	4ms	16ms	64ms	256ms	1s	4s	16s	gt	max	tag
0.000	0.000	98.272	1.719	0.010	0.000	0.000	0.000	0.000	0.000	0.036	pg140.cx5
0.000	0.000	98.223	1.767	0.010	0.000	0.000	0.000	0.000	0.000	0.035	pg141.cx5
0.000	0.000	98.258	1.726	0.015	0.000	0.000	0.000	0.000	0.000	0.036	pg142.cx5
0.000	0.000	98.199	1.790	0.010	0.000	0.000	0.000	0.000	0.000	0.035	pg143.cx5