Introduction
This is a report for the insert benchmark with 20M docs and 1 client(s). It is generated by scripts (bash, awk, sed) and Tufte might not be impressed. An overview of the insert benchmark is here and a short update is here. Below, by DBMS, I mean DBMS+version.config. An example is my8020.c10b40 where my means MySQL, 8020 is version 8.0.20 and c10b40 is the name for the configuration file.
The test server is an Intel NUC with 4 cores, 16G RAM and a Samsung 970 EVO. More details are here. Clients and the DBMS share one server. The per-database configs are in the per-database subdirectories here.
The tested DBMS are:
- pg1211.cx5 - Postgres 12.11 and the cx5 config
- pg137.cx5 - Postgres 13.7 and the cx5 config
- pg143.cx5 - Postgres 14.3 and the cx5 config
- pg15b1.cx5 - Postgres 15beta1 and the cx5 config
Contents
- Summary
- l.i0: load without secondary indexes
- l.x: create secondary indexes
- l.i1: continue load after secondary indexes created
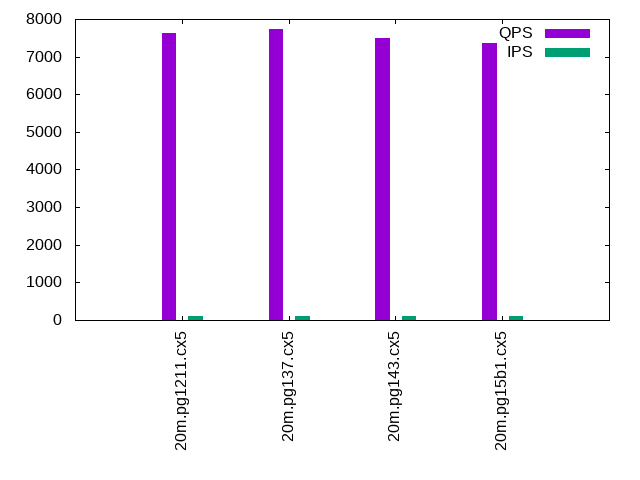
- q100.1: range queries with 100 insert/s per client
- q500.1: range queries with 500 insert/s per client
- q1000.1: range queries with 1000 insert/s per client
Summary
The numbers are inserts/s for l.i0 and l.i1, indexed docs (or rows) /s for l.x and queries/s for q*.2. The values are the average rate over the entire test for inserts (IPS) and queries (QPS). The range of values for IPS and QPS is split into 3 parts: bottom 25%, middle 50%, top 25%. Values in the bottom 25% have a red background, values in the top 25% have a green background and values in the middle have no color. A gray background is used for values that can be ignored because the DBMS did not sustain the target insert rate. Red backgrounds are not used when the minimum value is within 80% of the max value.
| dbms | l.i0 | l.x | l.i1 | q100.1 | q500.1 | q1000.1 |
|---|---|---|---|---|---|---|
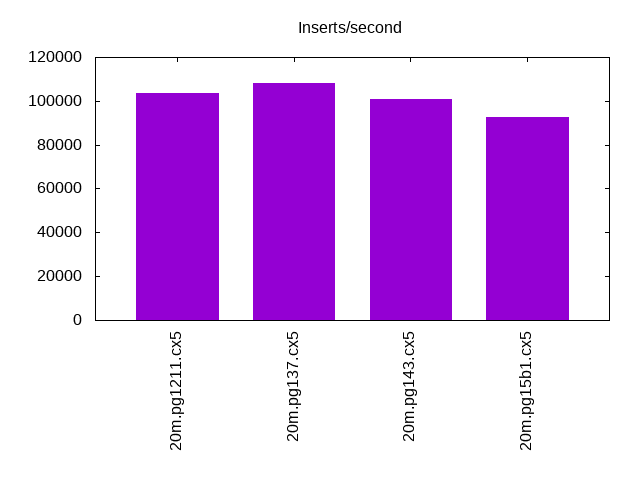
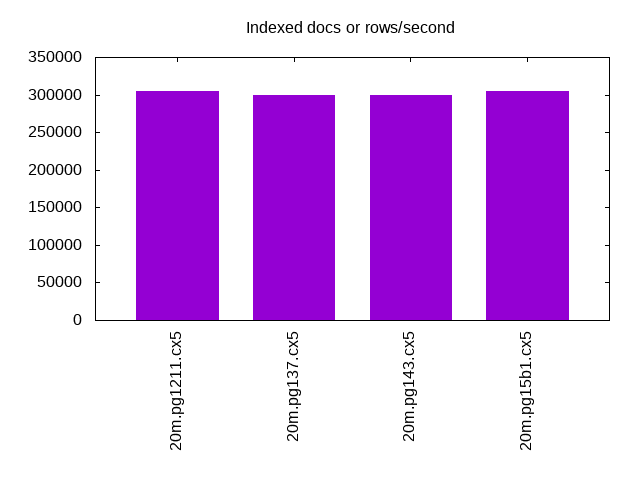
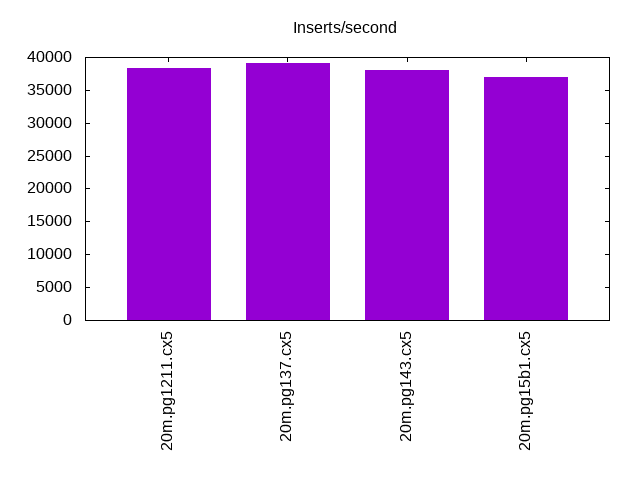
| 20m.pg1211.cx5 | 103627 | 304545 | 38388 | 7616 | 7547 | 7573 |
| 20m.pg137.cx5 | 108108 | 300000 | 39062 | 7731 | 7646 | 7607 |
| 20m.pg143.cx5 | 101010 | 300000 | 37951 | 7508 | 7497 | 7467 |
| 20m.pg15b1.cx5 | 92592 | 304545 | 36968 | 7368 | 7346 | 7349 |
This lists the average rate of inserts/s for the tests that do inserts concurrent with queries. For such tests the query rate is listed in the table above. The read+write tests are setup so that the insert rate should match the target rate every second. Cells that are not at least 95% of the target have a red background to indicate a failure to satisfy the target.
| dbms | q100.1 | q500.1 | q1000.1 |
|---|---|---|---|
| pg1211.cx5 | 100 | 499 | 999 |
| pg137.cx5 | 100 | 499 | 999 |
| pg143.cx5 | 100 | 499 | 999 |
| pg15b1.cx5 | 100 | 499 | 999 |
| target | 100 | 500 | 1000 |
l.i0
l.i0: load without secondary indexes. Graphs for performance per 1-second interval are here.
Average throughput:
Insert response time histogram: each cell has the percentage of responses that take <= the time in the header and max is the max response time in seconds. For the max column values in the top 25% of the range have a red background and in the bottom 25% of the range have a green background. The red background is not used when the min value is within 80% of the max value.
| dbms | 256us | 1ms | 4ms | 16ms | 64ms | 256ms | 1s | 4s | 16s | gt | max |
|---|---|---|---|---|---|---|---|---|---|---|---|
| pg1211.cx5 | 95.594 | 4.406 | 0.004 | ||||||||
| pg137.cx5 | 98.550 | 1.448 | 0.002 | 0.006 | |||||||
| pg143.cx5 | 80.902 | 19.098 | 0.003 | ||||||||
| pg15b1.cx5 | 1.405 | 98.596 | 0.003 |
Performance metrics for the DBMS listed above. Some are normalized by throughput, others are not. Legend for results is here.
ips	qps	rps	rmbps	wps	wmbps	rpq	rkbpq	wpi	wkbpi	csps	cpups	cspq	cpupq	dbgb1	dbgb2	rss	maxop	p50	p99	tag
103627	0	0	0.0	66.2	43.5	0.000	0.000	0.001	0.429	12543	42.1	0.121	16	1.9	5.2	0.0	0.004	103728	89979	20m.pg1211.cx5
108108	0	0	0.0	69.1	45.1	0.000	0.000	0.001	0.427	13076	43.8	0.121	16	1.9	5.2	0.0	0.006	108382	94283	20m.pg137.cx5
101010	0	0	0.0	65.7	42.9	0.000	0.000	0.001	0.435	12258	43.0	0.121	17	1.9	5.2	0.0	0.003	101284	82135	20m.pg143.cx5
92592	0	0	0.0	60.8	39.5	0.000	0.000	0.001	0.437	11124	41.7	0.120	18	1.9	5.2	0.0	0.003	93233	75817	20m.pg15b1.cx5
l.x
l.x: create secondary indexes.
Average throughput:
Performance metrics for the DBMS listed above. Some are normalized by throughput, others are not. Legend for results is here.
ips	qps	rps	rmbps	wps	wmbps	rpq	rkbpq	wpi	wkbpi	csps	cpups	cspq	cpupq	dbgb1	dbgb2	rss	maxop	p50	p99	tag
304545	0	0	0.0	67.2	69.5	0.000	0.000	0.000	0.234	2050	23.1	0.007	3	3.7	8.6	0.0	0.002	NA	NA	20m.pg1211.cx5
300000	0	0	0.0	63.6	65.4	0.000	0.000	0.000	0.223	1935	24.8	0.006	3	3.7	8.6	0.0	0.002	NA	NA	20m.pg137.cx5
300000	0	0	0.0	57.8	61.6	0.000	0.000	0.000	0.210	1896	25.0	0.006	3	3.7	8.6	0.0	0.002	NA	NA	20m.pg143.cx5
304545	0	0	0.0	69.8	73.7	0.000	0.000	0.000	0.248	2033	24.6	0.007	3	3.7	8.6	0.0	0.002	NA	NA	20m.pg15b1.cx5
l.i1
l.i1: continue load after secondary indexes created. Graphs for performance per 1-second interval are here.
Average throughput:
Insert response time histogram: each cell has the percentage of responses that take <= the time in the header and max is the max response time in seconds. For the max column values in the top 25% of the range have a red background and in the bottom 25% of the range have a green background. The red background is not used when the min value is within 80% of the max value.
| dbms | 256us | 1ms | 4ms | 16ms | 64ms | 256ms | 1s | 4s | 16s | gt | max |
|---|---|---|---|---|---|---|---|---|---|---|---|
| pg1211.cx5 | 99.837 | 0.135 | 0.025 | 0.003 | nonzero | 0.518 | |||||
| pg137.cx5 | 99.827 | 0.142 | 0.028 | 0.003 | nonzero | 0.287 | |||||
| pg143.cx5 | 99.855 | 0.115 | 0.029 | 0.001 | nonzero | 0.336 | |||||
| pg15b1.cx5 | 99.869 | 0.106 | 0.023 | 0.002 | 0.198 |
Performance metrics for the DBMS listed above. Some are normalized by throughput, others are not. Legend for results is here.
ips	qps	rps	rmbps	wps	wmbps	rpq	rkbpq	wpi	wkbpi	csps	cpups	cspq	cpupq	dbgb1	dbgb2	rss	maxop	p50	p99	tag
38388	0	0	0.0	195.5	65.3	0.000	0.000	0.005	1.741	9744	35.6	0.254	37	8.2	19.4	0.0	0.518	39958	10188	20m.pg1211.cx5
39062	0	0	0.0	202.6	68.1	0.000	0.000	0.005	1.785	9916	35.8	0.254	37	8.2	19.9	0.0	0.287	40570	9188	20m.pg137.cx5
37951	0	0	0.0	154.1	63.6	0.000	0.000	0.004	1.715	9572	35.9	0.252	38	8.2	20.8	0.0	0.336	39607	12848	20m.pg143.cx5
36968	0	0	0.0	168.6	63.9	0.000	0.000	0.005	1.769	9370	36.1	0.253	39	8.2	21.2	0.0	0.198	38273	14332	20m.pg15b1.cx5
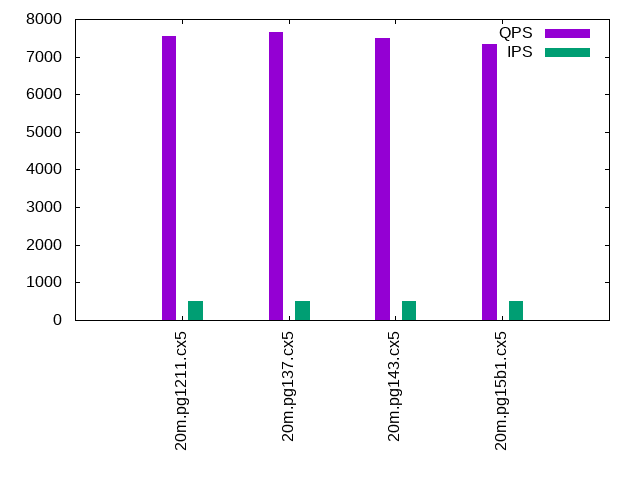
q100.1
q100.1: range queries with 100 insert/s per client. Graphs for performance per 1-second interval are here.
Average throughput:
Query response time histogram: each cell has the percentage of responses that take <= the time in the header and max is the max response time in seconds. For max values in the top 25% of the range have a red background and in the bottom 25% of the range have a green background. The red background is not used when the min value is within 80% of the max value.
| dbms | 256us | 1ms | 4ms | 16ms | 64ms | 256ms | 1s | 4s | 16s | gt | max |
|---|---|---|---|---|---|---|---|---|---|---|---|
| pg1211.cx5 | 99.971 | 0.028 | 0.001 | nonzero | 0.005 | ||||||
| pg137.cx5 | 99.971 | 0.028 | 0.001 | nonzero | 0.006 | ||||||
| pg143.cx5 | 99.937 | 0.062 | 0.001 | 0.003 | |||||||
| pg15b1.cx5 | 99.938 | 0.061 | 0.001 | 0.003 |
Insert response time histogram: each cell has the percentage of responses that take <= the time in the header and max is the max response time in seconds. For max values in the top 25% of the range have a red background and in the bottom 25% of the range have a green background. The red background is not used when the min value is within 80% of the max value.
| dbms | 256us | 1ms | 4ms | 16ms | 64ms | 256ms | 1s | 4s | 16s | gt | max |
|---|---|---|---|---|---|---|---|---|---|---|---|
| pg1211.cx5 | 99.938 | 0.062 | 0.006 | ||||||||
| pg137.cx5 | 99.986 | 0.014 | 0.006 | ||||||||
| pg143.cx5 | 99.979 | 0.021 | 0.005 | ||||||||
| pg15b1.cx5 | 99.979 | 0.021 | 0.006 |
Performance metrics for the DBMS listed above. Some are normalized by throughput, others are not. Legend for results is here.
ips	qps	rps	rmbps	wps	wmbps	rpq	rkbpq	wpi	wkbpi	csps	cpups	cspq	cpupq	dbgb1	dbgb2	rss	maxop	p50	p99	tag
100	7616	0	0.0	205.2	4.6	0.000	0.000	2.057	47.399	29354	27.5	3.854	144	8.3	10.3	0.0	0.005	7624	7400	20m.pg1211.cx5
100	7731	0	0.0	205.0	4.3	0.000	0.000	2.052	43.939	29792	27.7	3.854	143	8.3	10.2	0.0	0.006	7723	7592	20m.pg137.cx5
100	7508	0	0.0	197.1	4.4	0.000	0.000	1.975	44.699	28894	26.3	3.849	140	8.3	10.8	0.0	0.003	7512	7368	20m.pg143.cx5
100	7368	0	0.0	195.4	4.4	0.000	0.000	1.956	44.595	28312	26.1	3.843	142	8.3	10.8	0.0	0.003	7368	7272	20m.pg15b1.cx5
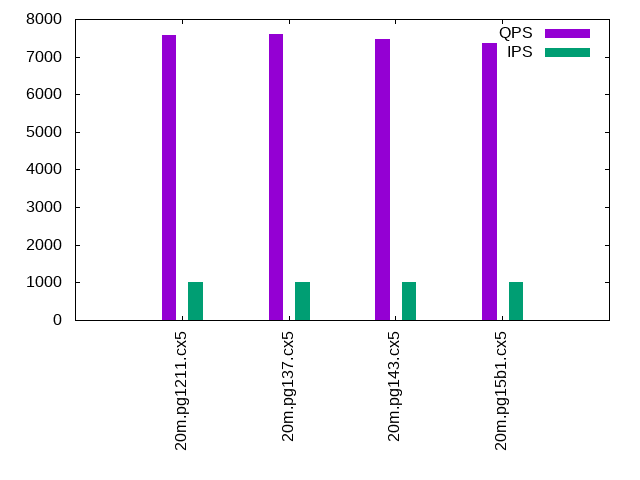
q500.1
q500.1: range queries with 500 insert/s per client. Graphs for performance per 1-second interval are here.
Average throughput:
Query response time histogram: each cell has the percentage of responses that take <= the time in the header and max is the max response time in seconds. For max values in the top 25% of the range have a red background and in the bottom 25% of the range have a green background. The red background is not used when the min value is within 80% of the max value.
| dbms | 256us | 1ms | 4ms | 16ms | 64ms | 256ms | 1s | 4s | 16s | gt | max |
|---|---|---|---|---|---|---|---|---|---|---|---|
| pg1211.cx5 | 99.936 | 0.058 | 0.006 | 0.004 | |||||||
| pg137.cx5 | 99.942 | 0.052 | 0.006 | nonzero | 0.005 | ||||||
| pg143.cx5 | 99.887 | 0.106 | 0.007 | nonzero | 0.005 | ||||||
| pg15b1.cx5 | 99.885 | 0.108 | 0.006 | nonzero | 0.005 |
Insert response time histogram: each cell has the percentage of responses that take <= the time in the header and max is the max response time in seconds. For max values in the top 25% of the range have a red background and in the bottom 25% of the range have a green background. The red background is not used when the min value is within 80% of the max value.
| dbms | 256us | 1ms | 4ms | 16ms | 64ms | 256ms | 1s | 4s | 16s | gt | max |
|---|---|---|---|---|---|---|---|---|---|---|---|
| pg1211.cx5 | 99.992 | 0.008 | 0.007 | ||||||||
| pg137.cx5 | 99.993 | 0.006 | 0.001 | 0.036 | |||||||
| pg143.cx5 | 99.987 | 0.013 | 0.016 | ||||||||
| pg15b1.cx5 | 99.987 | 0.013 | 0.015 |
Performance metrics for the DBMS listed above. Some are normalized by throughput, others are not. Legend for results is here.
ips	qps	rps	rmbps	wps	wmbps	rpq	rkbpq	wpi	wkbpi	csps	cpups	cspq	cpupq	dbgb1	dbgb2	rss	maxop	p50	p99	tag
499	7547	0	0.0	373.3	13.0	0.000	0.000	0.748	26.688	29195	28.1	3.868	149	9.7	12.7	0.0	0.004	7560	7416	20m.pg1211.cx5
499	7646	0	0.0	376.7	13.1	0.000	0.000	0.754	26.796	29571	28.2	3.868	148	9.7	12.8	0.0	0.005	7642	7512	20m.pg137.cx5
499	7497	0	0.0	376.6	12.4	0.000	0.000	0.754	25.414	28957	26.7	3.862	142	9.7	13.3	0.0	0.005	7498	7368	20m.pg143.cx5
499	7346	0	0.0	375.6	12.4	0.000	0.000	0.752	25.336	28345	26.5	3.859	144	9.7	13.3	0.0	0.005	7352	7226	20m.pg15b1.cx5
q1000.1
q1000.1: range queries with 1000 insert/s per client. Graphs for performance per 1-second interval are here.
Average throughput:
Query response time histogram: each cell has the percentage of responses that take <= the time in the header and max is the max response time in seconds. For max values in the top 25% of the range have a red background and in the bottom 25% of the range have a green background. The red background is not used when the min value is within 80% of the max value.
| dbms | 256us | 1ms | 4ms | 16ms | 64ms | 256ms | 1s | 4s | 16s | gt | max |
|---|---|---|---|---|---|---|---|---|---|---|---|
| pg1211.cx5 | 99.896 | 0.091 | 0.013 | nonzero | 0.007 | ||||||
| pg137.cx5 | 99.891 | 0.096 | 0.013 | nonzero | 0.008 | ||||||
| pg143.cx5 | 99.830 | 0.156 | 0.014 | nonzero | 0.007 | ||||||
| pg15b1.cx5 | 99.823 | 0.163 | 0.014 | nonzero | 0.005 |
Insert response time histogram: each cell has the percentage of responses that take <= the time in the header and max is the max response time in seconds. For max values in the top 25% of the range have a red background and in the bottom 25% of the range have a green background. The red background is not used when the min value is within 80% of the max value.
| dbms | 256us | 1ms | 4ms | 16ms | 64ms | 256ms | 1s | 4s | 16s | gt | max |
|---|---|---|---|---|---|---|---|---|---|---|---|
| pg1211.cx5 | 98.113 | 1.864 | 0.023 | 0.035 | |||||||
| pg137.cx5 | 98.259 | 1.717 | 0.024 | 0.060 | |||||||
| pg143.cx5 | 98.199 | 1.790 | 0.010 | 0.035 | |||||||
| pg15b1.cx5 | 98.258 | 1.726 | 0.016 | 0.035 |
Performance metrics for the DBMS listed above. Some are normalized by throughput, others are not. Legend for results is here.
ips	qps	rps	rmbps	wps	wmbps	rpq	rkbpq	wpi	wkbpi	csps	cpups	cspq	cpupq	dbgb1	dbgb2	rss	maxop	p50	p99	tag
999	7573	7	0.1	482.6	18.8	0.001	0.008	0.483	19.280	29433	28.6	3.887	151	12.0	15.8	0.0	0.007	7576	7448	20m.pg1211.cx5
999	7607	7	0.1	481.8	18.8	0.001	0.008	0.482	19.285	29566	28.6	3.887	150	12.0	15.8	0.0	0.008	7608	7464	20m.pg137.cx5
999	7467	7	0.1	512.9	17.5	0.001	0.008	0.513	17.943	28955	27.2	3.878	146	12.0	16.7	0.0	0.007	7480	7320	20m.pg143.cx5
999	7349	8	0.1	512.5	17.5	0.001	0.009	0.513	17.912	28485	27.2	3.876	148	12.0	16.7	0.0	0.005	7352	7224	20m.pg15b1.cx5
l.i0
l.i0: load without secondary indexes
Performance metrics for all DBMS, not just the ones listed above. Some are normalized by throughput, others are not. Legend for results is here.
ips	qps	rps	rmbps	wps	wmbps	rpq	rkbpq	wpi	wkbpi	csps	cpups	cspq	cpupq	dbgb1	dbgb2	rss	maxop	p50	p99	tag
103627	0	0	0.0	66.2	43.5	0.000	0.000	0.001	0.429	12543	42.1	0.121	16	1.9	5.2	0.0	0.004	103728	89979	20m.pg1211.cx5
108108	0	0	0.0	69.1	45.1	0.000	0.000	0.001	0.427	13076	43.8	0.121	16	1.9	5.2	0.0	0.006	108382	94283	20m.pg137.cx5
101010	0	0	0.0	65.7	42.9	0.000	0.000	0.001	0.435	12258	43.0	0.121	17	1.9	5.2	0.0	0.003	101284	82135	20m.pg143.cx5
92592	0	0	0.0	60.8	39.5	0.000	0.000	0.001	0.437	11124	41.7	0.120	18	1.9	5.2	0.0	0.003	93233	75817	20m.pg15b1.cx5
l.x
l.x: create secondary indexes
Performance metrics for all DBMS, not just the ones listed above. Some are normalized by throughput, others are not. Legend for results is here.
ips	qps	rps	rmbps	wps	wmbps	rpq	rkbpq	wpi	wkbpi	csps	cpups	cspq	cpupq	dbgb1	dbgb2	rss	maxop	p50	p99	tag
304545	0	0	0.0	67.2	69.5	0.000	0.000	0.000	0.234	2050	23.1	0.007	3	3.7	8.6	0.0	0.002	NA	NA	20m.pg1211.cx5
300000	0	0	0.0	63.6	65.4	0.000	0.000	0.000	0.223	1935	24.8	0.006	3	3.7	8.6	0.0	0.002	NA	NA	20m.pg137.cx5
300000	0	0	0.0	57.8	61.6	0.000	0.000	0.000	0.210	1896	25.0	0.006	3	3.7	8.6	0.0	0.002	NA	NA	20m.pg143.cx5
304545	0	0	0.0	69.8	73.7	0.000	0.000	0.000	0.248	2033	24.6	0.007	3	3.7	8.6	0.0	0.002	NA	NA	20m.pg15b1.cx5
l.i1
l.i1: continue load after secondary indexes created
Performance metrics for all DBMS, not just the ones listed above. Some are normalized by throughput, others are not. Legend for results is here.
ips	qps	rps	rmbps	wps	wmbps	rpq	rkbpq	wpi	wkbpi	csps	cpups	cspq	cpupq	dbgb1	dbgb2	rss	maxop	p50	p99	tag
38388	0	0	0.0	195.5	65.3	0.000	0.000	0.005	1.741	9744	35.6	0.254	37	8.2	19.4	0.0	0.518	39958	10188	20m.pg1211.cx5
39062	0	0	0.0	202.6	68.1	0.000	0.000	0.005	1.785	9916	35.8	0.254	37	8.2	19.9	0.0	0.287	40570	9188	20m.pg137.cx5
37951	0	0	0.0	154.1	63.6	0.000	0.000	0.004	1.715	9572	35.9	0.252	38	8.2	20.8	0.0	0.336	39607	12848	20m.pg143.cx5
36968	0	0	0.0	168.6	63.9	0.000	0.000	0.005	1.769	9370	36.1	0.253	39	8.2	21.2	0.0	0.198	38273	14332	20m.pg15b1.cx5
q100.1
q100.1: range queries with 100 insert/s per client
Performance metrics for all DBMS, not just the ones listed above. Some are normalized by throughput, others are not. Legend for results is here.
ips	qps	rps	rmbps	wps	wmbps	rpq	rkbpq	wpi	wkbpi	csps	cpups	cspq	cpupq	dbgb1	dbgb2	rss	maxop	p50	p99	tag
100	7616	0	0.0	205.2	4.6	0.000	0.000	2.057	47.399	29354	27.5	3.854	144	8.3	10.3	0.0	0.005	7624	7400	20m.pg1211.cx5
100	7731	0	0.0	205.0	4.3	0.000	0.000	2.052	43.939	29792	27.7	3.854	143	8.3	10.2	0.0	0.006	7723	7592	20m.pg137.cx5
100	7508	0	0.0	197.1	4.4	0.000	0.000	1.975	44.699	28894	26.3	3.849	140	8.3	10.8	0.0	0.003	7512	7368	20m.pg143.cx5
100	7368	0	0.0	195.4	4.4	0.000	0.000	1.956	44.595	28312	26.1	3.843	142	8.3	10.8	0.0	0.003	7368	7272	20m.pg15b1.cx5
q500.1
q500.1: range queries with 500 insert/s per client
Performance metrics for all DBMS, not just the ones listed above. Some are normalized by throughput, others are not. Legend for results is here.
ips	qps	rps	rmbps	wps	wmbps	rpq	rkbpq	wpi	wkbpi	csps	cpups	cspq	cpupq	dbgb1	dbgb2	rss	maxop	p50	p99	tag
499	7547	0	0.0	373.3	13.0	0.000	0.000	0.748	26.688	29195	28.1	3.868	149	9.7	12.7	0.0	0.004	7560	7416	20m.pg1211.cx5
499	7646	0	0.0	376.7	13.1	0.000	0.000	0.754	26.796	29571	28.2	3.868	148	9.7	12.8	0.0	0.005	7642	7512	20m.pg137.cx5
499	7497	0	0.0	376.6	12.4	0.000	0.000	0.754	25.414	28957	26.7	3.862	142	9.7	13.3	0.0	0.005	7498	7368	20m.pg143.cx5
499	7346	0	0.0	375.6	12.4	0.000	0.000	0.752	25.336	28345	26.5	3.859	144	9.7	13.3	0.0	0.005	7352	7226	20m.pg15b1.cx5
q1000.1
q1000.1: range queries with 1000 insert/s per client
Performance metrics for all DBMS, not just the ones listed above. Some are normalized by throughput, others are not. Legend for results is here.
ips	qps	rps	rmbps	wps	wmbps	rpq	rkbpq	wpi	wkbpi	csps	cpups	cspq	cpupq	dbgb1	dbgb2	rss	maxop	p50	p99	tag
999	7573	7	0.1	482.6	18.8	0.001	0.008	0.483	19.280	29433	28.6	3.887	151	12.0	15.8	0.0	0.007	7576	7448	20m.pg1211.cx5
999	7607	7	0.1	481.8	18.8	0.001	0.008	0.482	19.285	29566	28.6	3.887	150	12.0	15.8	0.0	0.008	7608	7464	20m.pg137.cx5
999	7467	7	0.1	512.9	17.5	0.001	0.008	0.513	17.943	28955	27.2	3.878	146	12.0	16.7	0.0	0.007	7480	7320	20m.pg143.cx5
999	7349	8	0.1	512.5	17.5	0.001	0.009	0.513	17.912	28485	27.2	3.876	148	12.0	16.7	0.0	0.005	7352	7224	20m.pg15b1.cx5
l.i0
- l.i0: load without secondary indexes
- Legend for results is here.
- Each entry lists the percentage of responses that fit in that bucket (slower than max time for previous bucket, faster than min time for next bucket).
Insert response time histogram
256us	1ms	4ms	16ms	64ms	256ms	1s	4s	16s	gt	max	tag
0.000	95.594	4.406	0.000	0.000	0.000	0.000	0.000	0.000	0.000	0.004	pg1211.cx5
0.000	98.550	1.448	0.002	0.000	0.000	0.000	0.000	0.000	0.000	0.006	pg137.cx5
0.000	80.902	19.098	0.000	0.000	0.000	0.000	0.000	0.000	0.000	0.003	pg143.cx5
0.000	1.405	98.596	0.000	0.000	0.000	0.000	0.000	0.000	0.000	0.003	pg15b1.cx5
l.x
- l.x: create secondary indexes
- Legend for results is here.
- Each entry lists the percentage of responses that fit in that bucket (slower than max time for previous bucket, faster than min time for next bucket).
TODO - determine whether there is data for create index response time
l.i1
- l.i1: continue load after secondary indexes created
- Legend for results is here.
- Each entry lists the percentage of responses that fit in that bucket (slower than max time for previous bucket, faster than min time for next bucket).
Insert response time histogram
256us	1ms	4ms	16ms	64ms	256ms	1s	4s	16s	gt	max	tag
0.000	0.000	99.837	0.135	0.025	0.003	nonzero	0.000	0.000	0.000	0.518	pg1211.cx5
0.000	0.000	99.827	0.142	0.028	0.003	nonzero	0.000	0.000	0.000	0.287	pg137.cx5
0.000	0.000	99.855	0.115	0.029	0.001	nonzero	0.000	0.000	0.000	0.336	pg143.cx5
0.000	0.000	99.869	0.106	0.023	0.002	0.000	0.000	0.000	0.000	0.198	pg15b1.cx5
q100.1
- q100.1: range queries with 100 insert/s per client
- Legend for results is here.
- Each entry lists the percentage of responses that fit in that bucket (slower than max time for previous bucket, faster than min time for next bucket).
Query response time histogram
256us	1ms	4ms	16ms	64ms	256ms	1s	4s	16s	gt	max	tag
99.971	0.028	0.001	nonzero	0.000	0.000	0.000	0.000	0.000	0.000	0.005	pg1211.cx5
99.971	0.028	0.001	nonzero	0.000	0.000	0.000	0.000	0.000	0.000	0.006	pg137.cx5
99.937	0.062	0.001	0.000	0.000	0.000	0.000	0.000	0.000	0.000	0.003	pg143.cx5
99.938	0.061	0.001	0.000	0.000	0.000	0.000	0.000	0.000	0.000	0.003	pg15b1.cx5
Insert response time histogram
256us	1ms	4ms	16ms	64ms	256ms	1s	4s	16s	gt	max	tag
0.000	0.000	99.938	0.062	0.000	0.000	0.000	0.000	0.000	0.000	0.006	pg1211.cx5
0.000	0.000	99.986	0.014	0.000	0.000	0.000	0.000	0.000	0.000	0.006	pg137.cx5
0.000	0.000	99.979	0.021	0.000	0.000	0.000	0.000	0.000	0.000	0.005	pg143.cx5
0.000	0.000	99.979	0.021	0.000	0.000	0.000	0.000	0.000	0.000	0.006	pg15b1.cx5
q500.1
- q500.1: range queries with 500 insert/s per client
- Legend for results is here.
- Each entry lists the percentage of responses that fit in that bucket (slower than max time for previous bucket, faster than min time for next bucket).
Query response time histogram
256us	1ms	4ms	16ms	64ms	256ms	1s	4s	16s	gt	max	tag
99.936	0.058	0.006	0.000	0.000	0.000	0.000	0.000	0.000	0.000	0.004	pg1211.cx5
99.942	0.052	0.006	nonzero	0.000	0.000	0.000	0.000	0.000	0.000	0.005	pg137.cx5
99.887	0.106	0.007	nonzero	0.000	0.000	0.000	0.000	0.000	0.000	0.005	pg143.cx5
99.885	0.108	0.006	nonzero	0.000	0.000	0.000	0.000	0.000	0.000	0.005	pg15b1.cx5
Insert response time histogram
256us	1ms	4ms	16ms	64ms	256ms	1s	4s	16s	gt	max	tag
0.000	0.000	99.992	0.008	0.000	0.000	0.000	0.000	0.000	0.000	0.007	pg1211.cx5
0.000	0.000	99.993	0.006	0.001	0.000	0.000	0.000	0.000	0.000	0.036	pg137.cx5
0.000	0.000	99.987	0.013	0.000	0.000	0.000	0.000	0.000	0.000	0.016	pg143.cx5
0.000	0.000	99.987	0.013	0.000	0.000	0.000	0.000	0.000	0.000	0.015	pg15b1.cx5
q1000.1
- q1000.1: range queries with 1000 insert/s per client
- Legend for results is here.
- Each entry lists the percentage of responses that fit in that bucket (slower than max time for previous bucket, faster than min time for next bucket).
Query response time histogram
256us	1ms	4ms	16ms	64ms	256ms	1s	4s	16s	gt	max	tag
99.896	0.091	0.013	nonzero	0.000	0.000	0.000	0.000	0.000	0.000	0.007	pg1211.cx5
99.891	0.096	0.013	nonzero	0.000	0.000	0.000	0.000	0.000	0.000	0.008	pg137.cx5
99.830	0.156	0.014	nonzero	0.000	0.000	0.000	0.000	0.000	0.000	0.007	pg143.cx5
99.823	0.163	0.014	nonzero	0.000	0.000	0.000	0.000	0.000	0.000	0.005	pg15b1.cx5
Insert response time histogram
256us	1ms	4ms	16ms	64ms	256ms	1s	4s	16s	gt	max	tag
0.000	0.000	98.113	1.864	0.023	0.000	0.000	0.000	0.000	0.000	0.035	pg1211.cx5
0.000	0.000	98.259	1.717	0.024	0.000	0.000	0.000	0.000	0.000	0.060	pg137.cx5
0.000	0.000	98.199	1.790	0.010	0.000	0.000	0.000	0.000	0.000	0.035	pg143.cx5
0.000	0.000	98.258	1.726	0.016	0.000	0.000	0.000	0.000	0.000	0.035	pg15b1.cx5