Introduction
This is a report for the insert benchmark with 500M docs and 1 client(s). It is generated by scripts (bash, awk, sed) and Tufte might not be impressed. An overview of the insert benchmark is here and a short update is here. Below, by DBMS, I mean DBMS+version.config. An example is my8020.c10b40 where my means MySQL, 8020 is version 8.0.20 and c10b40 is the name for the configuration file.
The test server is an Intel NUC with 4 cores, 16G RAM and a Samsung 970 EVO. More details are here. Clients and the DBMS share one server. The per-database configs are in the per-database subdirectories here.
The tested DBMS are:
- pg15b1.cx5 - Postgres 15beta1 and the cx5 config, wal_compression=off
- pg15b1.cx5a - Postgres 15beta1 and the cx5a config, wal_compression=pglz
- pg15b1.cx5b - Postgres 15beta1 and the cx5b config, wall_compression=lz4
- pg15b1.cx5c - Postgres 15beta1 and the cx5c config, wal_compression=zstd
Contents
- Summary
- l.i0: load without secondary indexes
- l.x: create secondary indexes
- l.i1: continue load after secondary indexes created
- q100.1: range queries with 100 insert/s per client
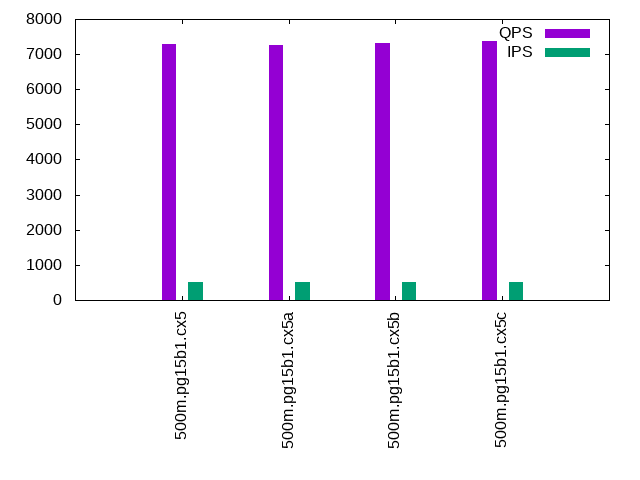
- q500.1: range queries with 500 insert/s per client
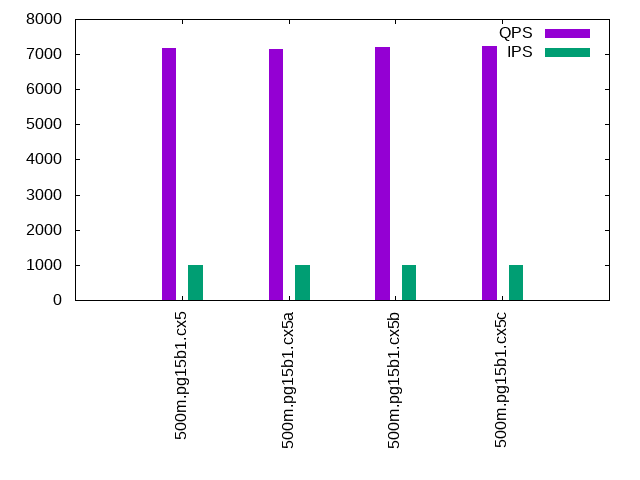
- q1000.1: range queries with 1000 insert/s per client
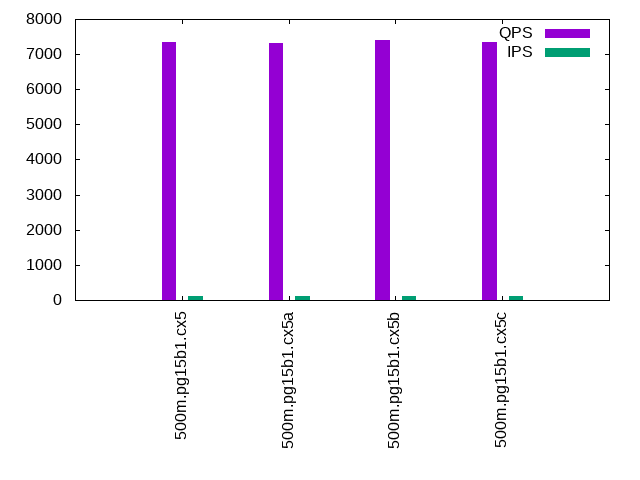
Summary
The numbers are inserts/s for l.i0 and l.i1, indexed docs (or rows) /s for l.x and queries/s for q*.2. The values are the average rate over the entire test for inserts (IPS) and queries (QPS). The range of values for IPS and QPS is split into 3 parts: bottom 25%, middle 50%, top 25%. Values in the bottom 25% have a red background, values in the top 25% have a green background and values in the middle have no color. A gray background is used for values that can be ignored because the DBMS did not sustain the target insert rate. Red backgrounds are not used when the minimum value is within 80% of the max value.
| dbms | l.i0 | l.x | l.i1 | q100.1 | q500.1 | q1000.1 |
|---|---|---|---|---|---|---|
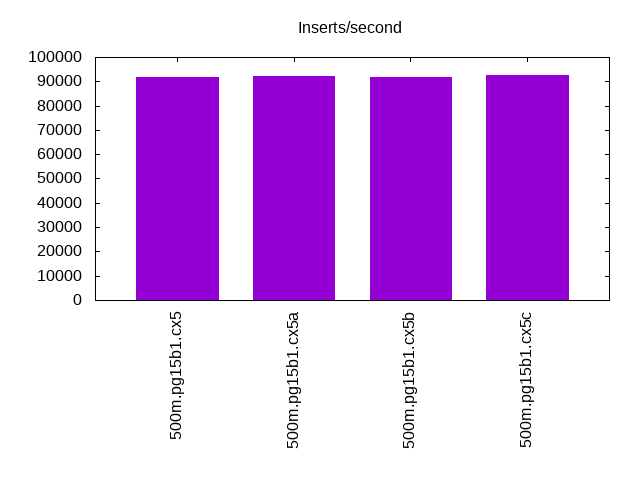
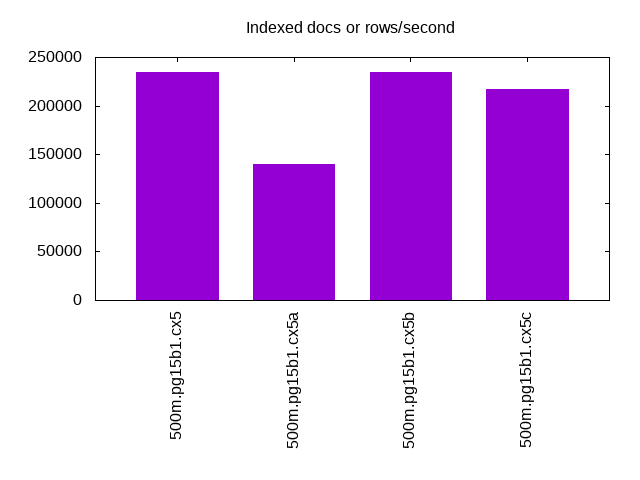
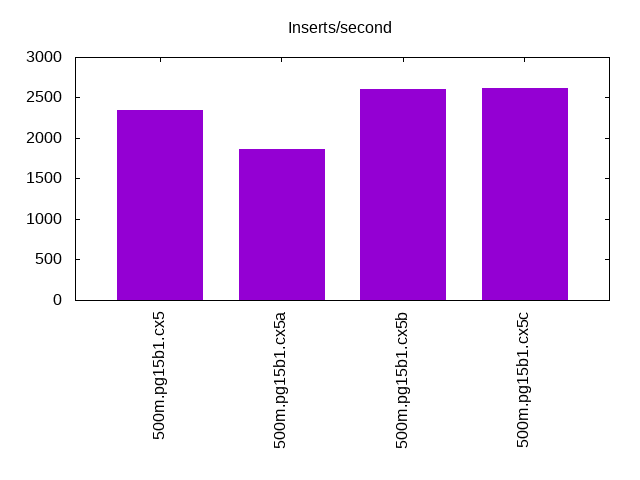
| 500m.pg15b1.cx5 | 91929 | 234899 | 2344 | 7344 | 7289 | 7180 |
| 500m.pg15b1.cx5a | 92370 | 139459 | 1868 | 7316 | 7254 | 7135 |
| 500m.pg15b1.cx5b | 91861 | 234678 | 2609 | 7388 | 7303 | 7204 |
| 500m.pg15b1.cx5c | 92456 | 216681 | 2617 | 7356 | 7362 | 7243 |
This lists the average rate of inserts/s for the tests that do inserts concurrent with queries. For such tests the query rate is listed in the table above. The read+write tests are setup so that the insert rate should match the target rate every second. Cells that are not at least 95% of the target have a red background to indicate a failure to satisfy the target.
| dbms | q100.1 | q500.1 | q1000.1 |
|---|---|---|---|
| pg15b1.cx5 | 100 | 499 | 999 |
| pg15b1.cx5a | 100 | 499 | 999 |
| pg15b1.cx5b | 100 | 499 | 999 |
| pg15b1.cx5c | 100 | 500 | 999 |
| target | 100 | 500 | 1000 |
l.i0
l.i0: load without secondary indexes. Graphs for performance per 1-second interval are here.
Average throughput:
Insert response time histogram: each cell has the percentage of responses that take <= the time in the header and max is the max response time in seconds. For the max column values in the top 25% of the range have a red background and in the bottom 25% of the range have a green background. The red background is not used when the min value is within 80% of the max value.
| dbms | 256us | 1ms | 4ms | 16ms | 64ms | 256ms | 1s | 4s | 16s | gt | max |
|---|---|---|---|---|---|---|---|---|---|---|---|
| pg15b1.cx5 | 1.142 | 98.852 | 0.005 | 0.001 | nonzero | nonzero | 0.432 | ||||
| pg15b1.cx5a | 5.569 | 94.428 | 0.003 | 0.001 | 0.038 | ||||||
| pg15b1.cx5b | 1.024 | 98.973 | 0.002 | 0.001 | nonzero | 0.150 | |||||
| pg15b1.cx5c | 4.167 | 95.830 | 0.002 | 0.001 | nonzero | 0.106 |
Performance metrics for the DBMS listed above. Some are normalized by throughput, others are not. Legend for results is here.
ips	qps	rps	rmbps	wps	wmbps	rpq	rkbpq	wpi	wkbpi	csps	cpups	cspq	cpupq	dbgb1	dbgb2	rss	maxop	p50	p99	tag
91929	0	34	0.3	130.7	43.3	0.000	0.003	0.001	0.482	11057	42.5	0.120	18	47.8	63.4	0.0	0.432	92199	86408	500m.pg15b1.cx5
92370	0	32	0.3	132.3	40.7	0.000	0.004	0.001	0.451	11041	45.1	0.120	20	47.8	59.4	0.0	0.038	92697	88204	500m.pg15b1.cx5a
91861	0	34	0.3	123.7	40.8	0.000	0.003	0.001	0.454	11035	42.4	0.120	18	47.8	60.0	0.0	0.150	92130	85409	500m.pg15b1.cx5b
92456	0	35	0.3	121.0	40.1	0.000	0.003	0.001	0.444	11089	42.8	0.120	19	47.8	59.1	0.0	0.106	92698	87504	500m.pg15b1.cx5c
l.x
l.x: create secondary indexes.
Average throughput:
Performance metrics for the DBMS listed above. Some are normalized by throughput, others are not. Legend for results is here.
ips	qps	rps	rmbps	wps	wmbps	rpq	rkbpq	wpi	wkbpi	csps	cpups	cspq	cpupq	dbgb1	dbgb2	rss	maxop	p50	p99	tag
234899	0	648	80.4	214.0	83.6	0.003	0.351	0.001	0.365	572	22.8	0.002	4	91.9	107.5	0.0	0.003	NA	NA	500m.pg15b1.cx5
139459	0	389	48.0	117.5	45.7	0.003	0.352	0.001	0.336	399	23.8	0.003	7	91.9	101.9	0.0	0.014	NA	NA	500m.pg15b1.cx5a
234678	0	647	80.4	182.3	74.3	0.003	0.351	0.001	0.324	570	23.2	0.002	4	91.9	104.1	0.0	0.003	NA	NA	500m.pg15b1.cx5b
216681	0	593	73.6	157.3	64.4	0.003	0.348	0.001	0.304	534	23.8	0.002	4	91.9	103.2	0.0	0.003	NA	NA	500m.pg15b1.cx5c
l.i1
l.i1: continue load after secondary indexes created. Graphs for performance per 1-second interval are here.
Average throughput:
Insert response time histogram: each cell has the percentage of responses that take <= the time in the header and max is the max response time in seconds. For the max column values in the top 25% of the range have a red background and in the bottom 25% of the range have a green background. The red background is not used when the min value is within 80% of the max value.
| dbms | 256us | 1ms | 4ms | 16ms | 64ms | 256ms | 1s | 4s | 16s | gt | max |
|---|---|---|---|---|---|---|---|---|---|---|---|
| pg15b1.cx5 | 20.479 | 79.454 | 0.066 | 0.002 | 0.305 | ||||||
| pg15b1.cx5a | 4.697 | 94.802 | 0.500 | 0.174 | |||||||
| pg15b1.cx5b | 43.418 | 56.413 | 0.169 | 0.175 | |||||||
| pg15b1.cx5c | 46.608 | 53.245 | 0.147 | 0.221 |
Performance metrics for the DBMS listed above. Some are normalized by throughput, others are not. Legend for results is here.
ips	qps	rps	rmbps	wps	wmbps	rpq	rkbpq	wpi	wkbpi	csps	cpups	cspq	cpupq	dbgb1	dbgb2	rss	maxop	p50	p99	tag
2344	0	3168	25.4	4002.6	63.4	1.352	11.086	1.708	27.703	7234	20.3	3.087	346	93.6	112.4	0.0	0.305	2347	1298	500m.pg15b1.cx5
1868	0	2497	20.1	3169.4	46.7	1.337	10.996	1.697	25.597	5590	17.4	2.993	373	93.6	106.3	0.0	0.174	1898	1100	500m.pg15b1.cx5a
2609	0	3515	28.3	4404.7	58.4	1.347	11.115	1.688	22.928	7896	17.7	3.027	271	93.6	109.7	0.0	0.175	2648	1099	500m.pg15b1.cx5b
2617	0	3515	28.5	4351.9	49.0	1.343	11.144	1.663	19.176	7702	16.4	2.943	251	93.6	103.6	0.0	0.221	2697	1349	500m.pg15b1.cx5c
q100.1
q100.1: range queries with 100 insert/s per client. Graphs for performance per 1-second interval are here.
Average throughput:
Query response time histogram: each cell has the percentage of responses that take <= the time in the header and max is the max response time in seconds. For max values in the top 25% of the range have a red background and in the bottom 25% of the range have a green background. The red background is not used when the min value is within 80% of the max value.
| dbms | 256us | 1ms | 4ms | 16ms | 64ms | 256ms | 1s | 4s | 16s | gt | max |
|---|---|---|---|---|---|---|---|---|---|---|---|
| pg15b1.cx5 | 99.829 | 0.168 | 0.003 | nonzero | nonzero | 0.053 | |||||
| pg15b1.cx5a | 99.865 | 0.134 | 0.001 | nonzero | nonzero | nonzero | 0.078 | ||||
| pg15b1.cx5b | 99.850 | 0.145 | 0.004 | nonzero | nonzero | nonzero | 0.098 | ||||
| pg15b1.cx5c | 99.845 | 0.151 | 0.004 | nonzero | nonzero | nonzero | 0.093 |
Insert response time histogram: each cell has the percentage of responses that take <= the time in the header and max is the max response time in seconds. For max values in the top 25% of the range have a red background and in the bottom 25% of the range have a green background. The red background is not used when the min value is within 80% of the max value.
| dbms | 256us | 1ms | 4ms | 16ms | 64ms | 256ms | 1s | 4s | 16s | gt | max |
|---|---|---|---|---|---|---|---|---|---|---|---|
| pg15b1.cx5 | 96.507 | 3.486 | 0.007 | 0.230 | |||||||
| pg15b1.cx5a | 99.993 | 0.007 | 0.092 | ||||||||
| pg15b1.cx5b | 97.007 | 2.986 | 0.007 | 0.076 | |||||||
| pg15b1.cx5c | 6.965 | 93.021 | 0.007 | 0.007 | 0.518 |
Performance metrics for the DBMS listed above. Some are normalized by throughput, others are not. Legend for results is here.
ips	qps	rps	rmbps	wps	wmbps	rpq	rkbpq	wpi	wkbpi	csps	cpups	cspq	cpupq	dbgb1	dbgb2	rss	maxop	p50	p99	tag
100	7344	137	1.1	291.5	4.4	0.019	0.153	2.921	45.419	28491	26.2	3.879	143	93.7	99.3	0.0	0.053	7368	6473	500m.pg15b1.cx5
100	7316	136	1.1	261.2	3.5	0.019	0.153	2.617	35.947	28380	27.4	3.879	150	93.7	95.7	0.0	0.078	7336	6793	500m.pg15b1.cx5a
100	7388	136	1.1	309.3	3.9	0.018	0.153	3.099	39.624	28655	26.4	3.879	143	93.7	100.6	0.0	0.098	7402	6617	500m.pg15b1.cx5b
100	7356	137	1.1	325.1	3.5	0.019	0.155	3.257	36.092	28532	26.5	3.879	144	93.7	97.8	0.0	0.093	7384	6510	500m.pg15b1.cx5c
q500.1
q500.1: range queries with 500 insert/s per client. Graphs for performance per 1-second interval are here.
Average throughput:
Query response time histogram: each cell has the percentage of responses that take <= the time in the header and max is the max response time in seconds. For max values in the top 25% of the range have a red background and in the bottom 25% of the range have a green background. The red background is not used when the min value is within 80% of the max value.
| dbms | 256us | 1ms | 4ms | 16ms | 64ms | 256ms | 1s | 4s | 16s | gt | max |
|---|---|---|---|---|---|---|---|---|---|---|---|
| pg15b1.cx5 | 99.849 | 0.149 | 0.002 | nonzero | 0.005 | ||||||
| pg15b1.cx5a | 99.805 | 0.191 | 0.004 | nonzero | 0.007 | ||||||
| pg15b1.cx5b | 99.855 | 0.143 | 0.002 | nonzero | nonzero | 0.018 | |||||
| pg15b1.cx5c | 99.853 | 0.145 | 0.002 | nonzero | 0.006 |
Insert response time histogram: each cell has the percentage of responses that take <= the time in the header and max is the max response time in seconds. For max values in the top 25% of the range have a red background and in the bottom 25% of the range have a green background. The red background is not used when the min value is within 80% of the max value.
| dbms | 256us | 1ms | 4ms | 16ms | 64ms | 256ms | 1s | 4s | 16s | gt | max |
|---|---|---|---|---|---|---|---|---|---|---|---|
| pg15b1.cx5 | 92.101 | 7.893 | 0.006 | 0.076 | |||||||
| pg15b1.cx5a | 99.900 | 0.100 | 0.120 | ||||||||
| pg15b1.cx5b | 96.237 | 3.760 | 0.003 | 0.070 | |||||||
| pg15b1.cx5c | 45.793 | 54.200 | 0.007 | 0.104 |
Performance metrics for the DBMS listed above. Some are normalized by throughput, others are not. Legend for results is here.
ips	qps	rps	rmbps	wps	wmbps	rpq	rkbpq	wpi	wkbpi	csps	cpups	cspq	cpupq	dbgb1	dbgb2	rss	maxop	p50	p99	tag
499	7289	658	5.2	1018.5	17.8	0.090	0.734	2.039	36.494	29431	27.3	4.038	150	94.6	99.7	0.0	0.005	7288	7176	500m.pg15b1.cx5
499	7254	658	5.2	1013.6	15.0	0.091	0.741	2.030	30.823	29315	33.1	4.041	183	94.6	98.0	0.0	0.007	7256	7144	500m.pg15b1.cx5a
499	7303	658	5.2	1009.1	14.5	0.090	0.736	2.021	29.671	29458	27.7	4.034	152	94.6	98.2	0.0	0.018	7304	7192	500m.pg15b1.cx5b
500	7362	658	5.3	999.8	12.3	0.089	0.733	2.002	25.222	29676	29.1	4.031	158	94.6	96.9	0.0	0.006	7358	7224	500m.pg15b1.cx5c
q1000.1
q1000.1: range queries with 1000 insert/s per client. Graphs for performance per 1-second interval are here.
Average throughput:
Query response time histogram: each cell has the percentage of responses that take <= the time in the header and max is the max response time in seconds. For max values in the top 25% of the range have a red background and in the bottom 25% of the range have a green background. The red background is not used when the min value is within 80% of the max value.
| dbms | 256us | 1ms | 4ms | 16ms | 64ms | 256ms | 1s | 4s | 16s | gt | max |
|---|---|---|---|---|---|---|---|---|---|---|---|
| pg15b1.cx5 | 99.674 | 0.323 | 0.003 | nonzero | 0.006 | ||||||
| pg15b1.cx5a | 99.605 | 0.386 | 0.008 | nonzero | 0.008 | ||||||
| pg15b1.cx5b | 99.701 | 0.296 | 0.003 | nonzero | nonzero | 0.018 | |||||
| pg15b1.cx5c | 99.696 | 0.300 | 0.004 | nonzero | 0.007 |
Insert response time histogram: each cell has the percentage of responses that take <= the time in the header and max is the max response time in seconds. For max values in the top 25% of the range have a red background and in the bottom 25% of the range have a green background. The red background is not used when the min value is within 80% of the max value.
| dbms | 256us | 1ms | 4ms | 16ms | 64ms | 256ms | 1s | 4s | 16s | gt | max |
|---|---|---|---|---|---|---|---|---|---|---|---|
| pg15b1.cx5 | 84.762 | 15.217 | 0.021 | 0.001 | 0.293 | ||||||
| pg15b1.cx5a | 99.876 | 0.124 | 0.001 | 0.259 | |||||||
| pg15b1.cx5b | 83.189 | 16.799 | 0.012 | 0.100 | |||||||
| pg15b1.cx5c | 53.013 | 46.967 | 0.019 | 0.102 |
Performance metrics for the DBMS listed above. Some are normalized by throughput, others are not. Legend for results is here.
ips	qps	rps	rmbps	wps	wmbps	rpq	rkbpq	wpi	wkbpi	csps	cpups	cspq	cpupq	dbgb1	dbgb2	rss	maxop	p50	p99	tag
999	7180	1294	10.3	1727.9	31.5	0.180	1.475	1.729	32.332	30411	28.3	4.236	158	95.5	104.5	0.0	0.006	7179	7048	500m.pg15b1.cx5
999	7135	1299	10.4	1713.7	26.0	0.182	1.499	1.715	26.640	30195	38.9	4.232	218	95.5	101.4	0.0	0.008	7144	6987	500m.pg15b1.cx5a
999	7204	1299	10.4	1711.9	25.9	0.180	1.485	1.714	26.566	30459	28.9	4.228	160	95.5	101.4	0.0	0.018	7208	7080	500m.pg15b1.cx5b
999	7243	1295	10.5	1702.3	22.0	0.179	1.480	1.704	22.501	30563	31.5	4.220	174	95.5	99.2	0.0	0.007	7240	7112	500m.pg15b1.cx5c
l.i0
l.i0: load without secondary indexes
Performance metrics for all DBMS, not just the ones listed above. Some are normalized by throughput, others are not. Legend for results is here.
ips	qps	rps	rmbps	wps	wmbps	rpq	rkbpq	wpi	wkbpi	csps	cpups	cspq	cpupq	dbgb1	dbgb2	rss	maxop	p50	p99	tag
91929	0	34	0.3	130.7	43.3	0.000	0.003	0.001	0.482	11057	42.5	0.120	18	47.8	63.4	0.0	0.432	92199	86408	500m.pg15b1.cx5
92370	0	32	0.3	132.3	40.7	0.000	0.004	0.001	0.451	11041	45.1	0.120	20	47.8	59.4	0.0	0.038	92697	88204	500m.pg15b1.cx5a
91861	0	34	0.3	123.7	40.8	0.000	0.003	0.001	0.454	11035	42.4	0.120	18	47.8	60.0	0.0	0.150	92130	85409	500m.pg15b1.cx5b
92456	0	35	0.3	121.0	40.1	0.000	0.003	0.001	0.444	11089	42.8	0.120	19	47.8	59.1	0.0	0.106	92698	87504	500m.pg15b1.cx5c
l.x
l.x: create secondary indexes
Performance metrics for all DBMS, not just the ones listed above. Some are normalized by throughput, others are not. Legend for results is here.
ips	qps	rps	rmbps	wps	wmbps	rpq	rkbpq	wpi	wkbpi	csps	cpups	cspq	cpupq	dbgb1	dbgb2	rss	maxop	p50	p99	tag
234899	0	648	80.4	214.0	83.6	0.003	0.351	0.001	0.365	572	22.8	0.002	4	91.9	107.5	0.0	0.003	NA	NA	500m.pg15b1.cx5
139459	0	389	48.0	117.5	45.7	0.003	0.352	0.001	0.336	399	23.8	0.003	7	91.9	101.9	0.0	0.014	NA	NA	500m.pg15b1.cx5a
234678	0	647	80.4	182.3	74.3	0.003	0.351	0.001	0.324	570	23.2	0.002	4	91.9	104.1	0.0	0.003	NA	NA	500m.pg15b1.cx5b
216681	0	593	73.6	157.3	64.4	0.003	0.348	0.001	0.304	534	23.8	0.002	4	91.9	103.2	0.0	0.003	NA	NA	500m.pg15b1.cx5c
l.i1
l.i1: continue load after secondary indexes created
Performance metrics for all DBMS, not just the ones listed above. Some are normalized by throughput, others are not. Legend for results is here.
ips	qps	rps	rmbps	wps	wmbps	rpq	rkbpq	wpi	wkbpi	csps	cpups	cspq	cpupq	dbgb1	dbgb2	rss	maxop	p50	p99	tag
2344	0	3168	25.4	4002.6	63.4	1.352	11.086	1.708	27.703	7234	20.3	3.087	346	93.6	112.4	0.0	0.305	2347	1298	500m.pg15b1.cx5
1868	0	2497	20.1	3169.4	46.7	1.337	10.996	1.697	25.597	5590	17.4	2.993	373	93.6	106.3	0.0	0.174	1898	1100	500m.pg15b1.cx5a
2609	0	3515	28.3	4404.7	58.4	1.347	11.115	1.688	22.928	7896	17.7	3.027	271	93.6	109.7	0.0	0.175	2648	1099	500m.pg15b1.cx5b
2617	0	3515	28.5	4351.9	49.0	1.343	11.144	1.663	19.176	7702	16.4	2.943	251	93.6	103.6	0.0	0.221	2697	1349	500m.pg15b1.cx5c
q100.1
q100.1: range queries with 100 insert/s per client
Performance metrics for all DBMS, not just the ones listed above. Some are normalized by throughput, others are not. Legend for results is here.
ips	qps	rps	rmbps	wps	wmbps	rpq	rkbpq	wpi	wkbpi	csps	cpups	cspq	cpupq	dbgb1	dbgb2	rss	maxop	p50	p99	tag
100	7344	137	1.1	291.5	4.4	0.019	0.153	2.921	45.419	28491	26.2	3.879	143	93.7	99.3	0.0	0.053	7368	6473	500m.pg15b1.cx5
100	7316	136	1.1	261.2	3.5	0.019	0.153	2.617	35.947	28380	27.4	3.879	150	93.7	95.7	0.0	0.078	7336	6793	500m.pg15b1.cx5a
100	7388	136	1.1	309.3	3.9	0.018	0.153	3.099	39.624	28655	26.4	3.879	143	93.7	100.6	0.0	0.098	7402	6617	500m.pg15b1.cx5b
100	7356	137	1.1	325.1	3.5	0.019	0.155	3.257	36.092	28532	26.5	3.879	144	93.7	97.8	0.0	0.093	7384	6510	500m.pg15b1.cx5c
q500.1
q500.1: range queries with 500 insert/s per client
Performance metrics for all DBMS, not just the ones listed above. Some are normalized by throughput, others are not. Legend for results is here.
ips	qps	rps	rmbps	wps	wmbps	rpq	rkbpq	wpi	wkbpi	csps	cpups	cspq	cpupq	dbgb1	dbgb2	rss	maxop	p50	p99	tag
499	7289	658	5.2	1018.5	17.8	0.090	0.734	2.039	36.494	29431	27.3	4.038	150	94.6	99.7	0.0	0.005	7288	7176	500m.pg15b1.cx5
499	7254	658	5.2	1013.6	15.0	0.091	0.741	2.030	30.823	29315	33.1	4.041	183	94.6	98.0	0.0	0.007	7256	7144	500m.pg15b1.cx5a
499	7303	658	5.2	1009.1	14.5	0.090	0.736	2.021	29.671	29458	27.7	4.034	152	94.6	98.2	0.0	0.018	7304	7192	500m.pg15b1.cx5b
500	7362	658	5.3	999.8	12.3	0.089	0.733	2.002	25.222	29676	29.1	4.031	158	94.6	96.9	0.0	0.006	7358	7224	500m.pg15b1.cx5c
q1000.1
q1000.1: range queries with 1000 insert/s per client
Performance metrics for all DBMS, not just the ones listed above. Some are normalized by throughput, others are not. Legend for results is here.
ips	qps	rps	rmbps	wps	wmbps	rpq	rkbpq	wpi	wkbpi	csps	cpups	cspq	cpupq	dbgb1	dbgb2	rss	maxop	p50	p99	tag
999	7180	1294	10.3	1727.9	31.5	0.180	1.475	1.729	32.332	30411	28.3	4.236	158	95.5	104.5	0.0	0.006	7179	7048	500m.pg15b1.cx5
999	7135	1299	10.4	1713.7	26.0	0.182	1.499	1.715	26.640	30195	38.9	4.232	218	95.5	101.4	0.0	0.008	7144	6987	500m.pg15b1.cx5a
999	7204	1299	10.4	1711.9	25.9	0.180	1.485	1.714	26.566	30459	28.9	4.228	160	95.5	101.4	0.0	0.018	7208	7080	500m.pg15b1.cx5b
999	7243	1295	10.5	1702.3	22.0	0.179	1.480	1.704	22.501	30563	31.5	4.220	174	95.5	99.2	0.0	0.007	7240	7112	500m.pg15b1.cx5c
l.i0
- l.i0: load without secondary indexes
- Legend for results is here.
- Each entry lists the percentage of responses that fit in that bucket (slower than max time for previous bucket, faster than min time for next bucket).
Insert response time histogram
256us	1ms	4ms	16ms	64ms	256ms	1s	4s	16s	gt	max	tag
0.000	1.142	98.852	0.005	0.001	nonzero	nonzero	0.000	0.000	0.000	0.432	pg15b1.cx5
0.000	5.569	94.428	0.003	0.001	0.000	0.000	0.000	0.000	0.000	0.038	pg15b1.cx5a
0.000	1.024	98.973	0.002	0.001	nonzero	0.000	0.000	0.000	0.000	0.150	pg15b1.cx5b
0.000	4.167	95.830	0.002	0.001	nonzero	0.000	0.000	0.000	0.000	0.106	pg15b1.cx5c
l.x
- l.x: create secondary indexes
- Legend for results is here.
- Each entry lists the percentage of responses that fit in that bucket (slower than max time for previous bucket, faster than min time for next bucket).
TODO - determine whether there is data for create index response time
l.i1
- l.i1: continue load after secondary indexes created
- Legend for results is here.
- Each entry lists the percentage of responses that fit in that bucket (slower than max time for previous bucket, faster than min time for next bucket).
Insert response time histogram
256us	1ms	4ms	16ms	64ms	256ms	1s	4s	16s	gt	max	tag
0.000	0.000	0.000	20.479	79.454	0.066	0.002	0.000	0.000	0.000	0.305	pg15b1.cx5
0.000	0.000	0.000	4.697	94.802	0.500	0.000	0.000	0.000	0.000	0.174	pg15b1.cx5a
0.000	0.000	0.000	43.418	56.413	0.169	0.000	0.000	0.000	0.000	0.175	pg15b1.cx5b
0.000	0.000	0.000	46.608	53.245	0.147	0.000	0.000	0.000	0.000	0.221	pg15b1.cx5c
q100.1
- q100.1: range queries with 100 insert/s per client
- Legend for results is here.
- Each entry lists the percentage of responses that fit in that bucket (slower than max time for previous bucket, faster than min time for next bucket).
Query response time histogram
256us	1ms	4ms	16ms	64ms	256ms	1s	4s	16s	gt	max	tag
99.829	0.168	0.003	nonzero	nonzero	0.000	0.000	0.000	0.000	0.000	0.053	pg15b1.cx5
99.865	0.134	0.001	nonzero	nonzero	nonzero	0.000	0.000	0.000	0.000	0.078	pg15b1.cx5a
99.850	0.145	0.004	nonzero	nonzero	nonzero	0.000	0.000	0.000	0.000	0.098	pg15b1.cx5b
99.845	0.151	0.004	nonzero	nonzero	nonzero	0.000	0.000	0.000	0.000	0.093	pg15b1.cx5c
Insert response time histogram
256us	1ms	4ms	16ms	64ms	256ms	1s	4s	16s	gt	max	tag
0.000	0.000	0.000	96.507	3.486	0.007	0.000	0.000	0.000	0.000	0.230	pg15b1.cx5
0.000	0.000	0.000	0.000	99.993	0.007	0.000	0.000	0.000	0.000	0.092	pg15b1.cx5a
0.000	0.000	0.000	97.007	2.986	0.007	0.000	0.000	0.000	0.000	0.076	pg15b1.cx5b
0.000	0.000	0.000	6.965	93.021	0.007	0.007	0.000	0.000	0.000	0.518	pg15b1.cx5c
q500.1
- q500.1: range queries with 500 insert/s per client
- Legend for results is here.
- Each entry lists the percentage of responses that fit in that bucket (slower than max time for previous bucket, faster than min time for next bucket).
Query response time histogram
256us	1ms	4ms	16ms	64ms	256ms	1s	4s	16s	gt	max	tag
99.849	0.149	0.002	nonzero	0.000	0.000	0.000	0.000	0.000	0.000	0.005	pg15b1.cx5
99.805	0.191	0.004	nonzero	0.000	0.000	0.000	0.000	0.000	0.000	0.007	pg15b1.cx5a
99.855	0.143	0.002	nonzero	nonzero	0.000	0.000	0.000	0.000	0.000	0.018	pg15b1.cx5b
99.853	0.145	0.002	nonzero	0.000	0.000	0.000	0.000	0.000	0.000	0.006	pg15b1.cx5c
Insert response time histogram
256us	1ms	4ms	16ms	64ms	256ms	1s	4s	16s	gt	max	tag
0.000	0.000	0.000	92.101	7.893	0.006	0.000	0.000	0.000	0.000	0.076	pg15b1.cx5
0.000	0.000	0.000	0.000	99.900	0.100	0.000	0.000	0.000	0.000	0.120	pg15b1.cx5a
0.000	0.000	0.000	96.237	3.760	0.003	0.000	0.000	0.000	0.000	0.070	pg15b1.cx5b
0.000	0.000	0.000	45.793	54.200	0.007	0.000	0.000	0.000	0.000	0.104	pg15b1.cx5c
q1000.1
- q1000.1: range queries with 1000 insert/s per client
- Legend for results is here.
- Each entry lists the percentage of responses that fit in that bucket (slower than max time for previous bucket, faster than min time for next bucket).
Query response time histogram
256us	1ms	4ms	16ms	64ms	256ms	1s	4s	16s	gt	max	tag
99.674	0.323	0.003	nonzero	0.000	0.000	0.000	0.000	0.000	0.000	0.006	pg15b1.cx5
99.605	0.386	0.008	nonzero	0.000	0.000	0.000	0.000	0.000	0.000	0.008	pg15b1.cx5a
99.701	0.296	0.003	nonzero	nonzero	0.000	0.000	0.000	0.000	0.000	0.018	pg15b1.cx5b
99.696	0.300	0.004	nonzero	0.000	0.000	0.000	0.000	0.000	0.000	0.007	pg15b1.cx5c
Insert response time histogram
256us	1ms	4ms	16ms	64ms	256ms	1s	4s	16s	gt	max	tag
0.000	0.000	0.000	84.762	15.217	0.021	0.001	0.000	0.000	0.000	0.293	pg15b1.cx5
0.000	0.000	0.000	0.000	99.876	0.124	0.001	0.000	0.000	0.000	0.259	pg15b1.cx5a
0.000	0.000	0.000	83.189	16.799	0.012	0.000	0.000	0.000	0.000	0.100	pg15b1.cx5b
0.000	0.000	0.000	53.013	46.967	0.019	0.000	0.000	0.000	0.000	0.102	pg15b1.cx5c