Introduction
This is a report for the insert benchmark with 20M docs and 1 client(s). It is generated by scripts (bash, awk, sed) and Tufte might not be impressed. An overview of the insert benchmark is here and a short update is here. Below, by DBMS, I mean DBMS+version.config. An example is my8020.c10b40 where my means MySQL, 8020 is version 8.0.20 and c10b40 is the name for the configuration file.
The test server is an Intel NUC with 4 cores, 16G RAM and a Samsung 970 EVO. More details are here. Clients and the DBMS share one server. The per-database configs are in the per-database subdirectories here.
The tested DBMS are:
- pg15b1.cx5 - Postgres 15beta1 and the cx5 config, wal_compression=off
- pg15b1.cx5a - Postgres 15beta1 and the cx5a config, wal_compression=pglz
- pg15b1.cx5b - Postgres 15beta1 and the cx5b config, wall_compression=lz4
- pg15b1.cx5c - Postgres 15beta1 and the cx5c config, wal_compression=zstd
Contents
- Summary
- l.i0: load without secondary indexes
- l.x: create secondary indexes
- l.i1: continue load after secondary indexes created
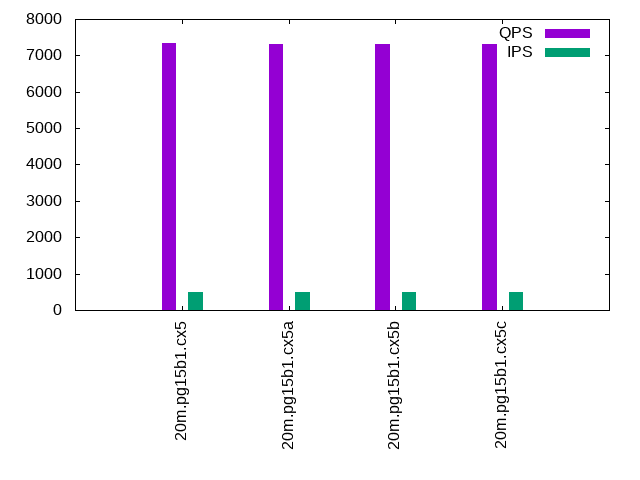
- q100.1: range queries with 100 insert/s per client
- q500.1: range queries with 500 insert/s per client
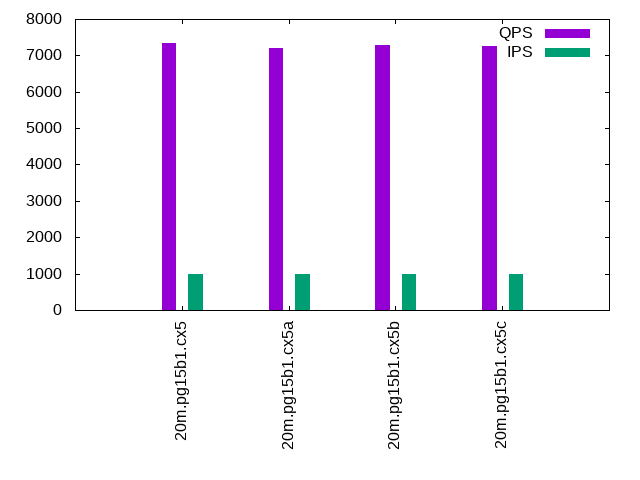
- q1000.1: range queries with 1000 insert/s per client
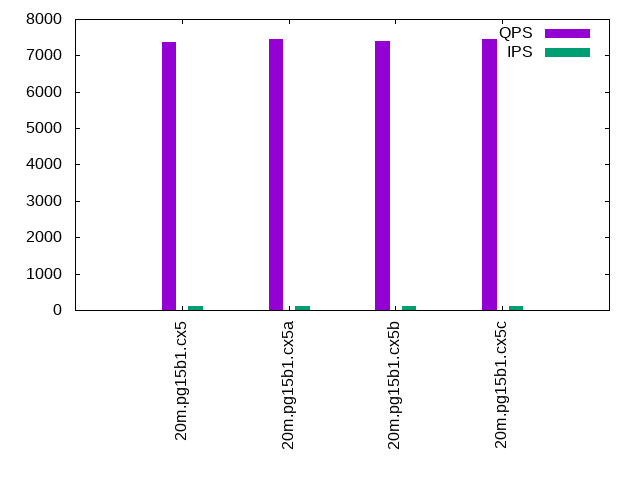
Summary
The numbers are inserts/s for l.i0 and l.i1, indexed docs (or rows) /s for l.x and queries/s for q*.2. The values are the average rate over the entire test for inserts (IPS) and queries (QPS). The range of values for IPS and QPS is split into 3 parts: bottom 25%, middle 50%, top 25%. Values in the bottom 25% have a red background, values in the top 25% have a green background and values in the middle have no color. A gray background is used for values that can be ignored because the DBMS did not sustain the target insert rate. Red backgrounds are not used when the minimum value is within 80% of the max value.
| dbms | l.i0 | l.x | l.i1 | q100.1 | q500.1 | q1000.1 |
|---|---|---|---|---|---|---|
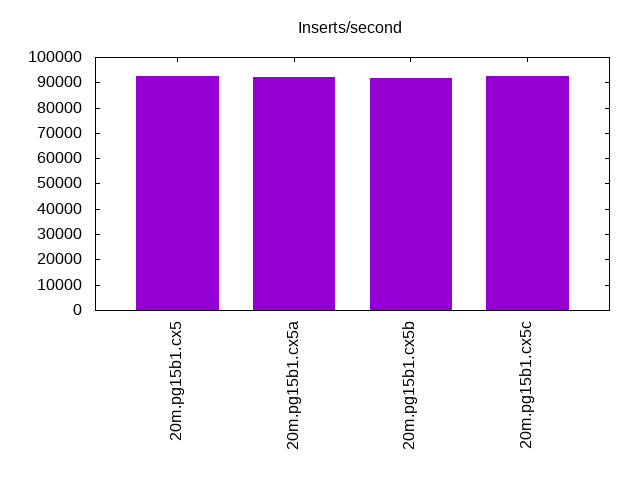
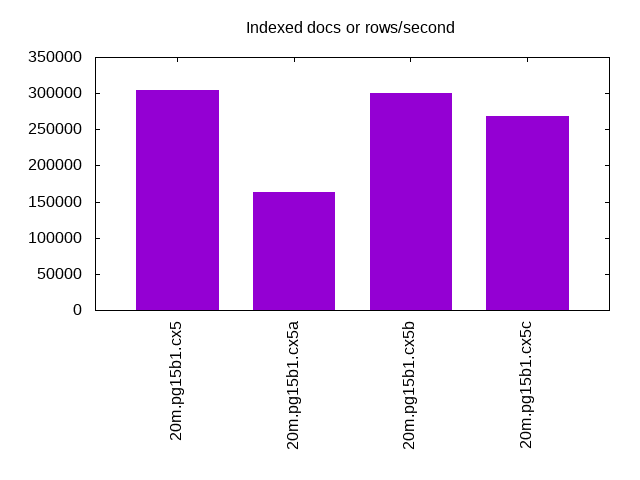
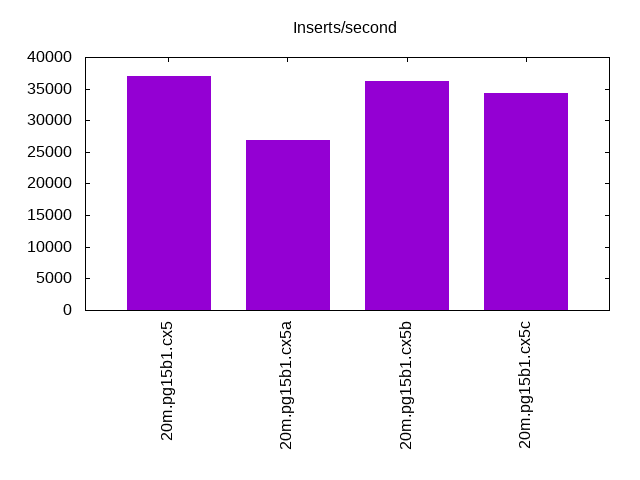
| 20m.pg15b1.cx5 | 92592 | 304545 | 36968 | 7368 | 7346 | 7349 |
| 20m.pg15b1.cx5a | 92166 | 163415 | 26918 | 7456 | 7315 | 7216 |
| 20m.pg15b1.cx5b | 91743 | 300000 | 36166 | 7396 | 7314 | 7290 |
| 20m.pg15b1.cx5c | 92592 | 268000 | 34364 | 7440 | 7306 | 7253 |
This lists the average rate of inserts/s for the tests that do inserts concurrent with queries. For such tests the query rate is listed in the table above. The read+write tests are setup so that the insert rate should match the target rate every second. Cells that are not at least 95% of the target have a red background to indicate a failure to satisfy the target.
| dbms | q100.1 | q500.1 | q1000.1 |
|---|---|---|---|
| pg15b1.cx5 | 100 | 499 | 999 |
| pg15b1.cx5a | 100 | 499 | 999 |
| pg15b1.cx5b | 100 | 499 | 999 |
| pg15b1.cx5c | 100 | 500 | 999 |
| target | 100 | 500 | 1000 |
l.i0
l.i0: load without secondary indexes. Graphs for performance per 1-second interval are here.
Average throughput:
Insert response time histogram: each cell has the percentage of responses that take <= the time in the header and max is the max response time in seconds. For the max column values in the top 25% of the range have a red background and in the bottom 25% of the range have a green background. The red background is not used when the min value is within 80% of the max value.
| dbms | 256us | 1ms | 4ms | 16ms | 64ms | 256ms | 1s | 4s | 16s | gt | max |
|---|---|---|---|---|---|---|---|---|---|---|---|
| pg15b1.cx5 | 1.405 | 98.596 | 0.003 | ||||||||
| pg15b1.cx5a | 0.982 | 99.018 | 0.001 | 0.004 | |||||||
| pg15b1.cx5b | 0.614 | 99.385 | 0.002 | 0.007 | |||||||
| pg15b1.cx5c | 1.110 | 98.889 | 0.001 | 0.009 |
Performance metrics for the DBMS listed above. Some are normalized by throughput, others are not. Legend for results is here.
ips	qps	rps	rmbps	wps	wmbps	rpq	rkbpq	wpi	wkbpi	csps	cpups	cspq	cpupq	dbgb1	dbgb2	rss	maxop	p50	p99	tag
92592	0	0	0.0	60.8	39.5	0.000	0.000	0.001	0.437	11124	41.7	0.120	18	1.9	5.2	0.0	0.003	93233	75817	20m.pg15b1.cx5
92166	0	0	0.0	61.3	39.9	0.000	0.000	0.001	0.443	11136	41.2	0.121	18	1.9	5.2	0.0	0.004	92899	75620	20m.pg15b1.cx5a
91743	0	0	0.0	61.1	39.5	0.000	0.000	0.001	0.441	11047	42.2	0.120	18	1.9	5.2	0.0	0.007	92598	74176	20m.pg15b1.cx5b
92592	0	0	0.0	61.7	39.7	0.000	0.000	0.001	0.439	11103	41.6	0.120	18	1.9	5.2	0.0	0.009	92998	75350	20m.pg15b1.cx5c
l.x
l.x: create secondary indexes.
Average throughput:
Performance metrics for the DBMS listed above. Some are normalized by throughput, others are not. Legend for results is here.
ips	qps	rps	rmbps	wps	wmbps	rpq	rkbpq	wpi	wkbpi	csps	cpups	cspq	cpupq	dbgb1	dbgb2	rss	maxop	p50	p99	tag
304545	0	0	0.0	69.8	73.7	0.000	0.000	0.000	0.248	2033	24.6	0.007	3	3.7	8.6	0.0	0.002	NA	NA	20m.pg15b1.cx5
163415	0	0	0.0	48.7	40.0	0.000	0.000	0.000	0.250	915	24.0	0.006	6	3.7	7.9	0.0	0.002	NA	NA	20m.pg15b1.cx5a
300000	0	0	0.0	43.9	45.7	0.000	0.000	0.000	0.156	1482	24.0	0.005	3	3.7	8.0	0.0	0.002	NA	NA	20m.pg15b1.cx5b
268000	0	0	0.0	37.9	39.2	0.000	0.000	0.000	0.150	1247	24.6	0.005	4	3.7	7.7	0.0	0.002	NA	NA	20m.pg15b1.cx5c
l.i1
l.i1: continue load after secondary indexes created. Graphs for performance per 1-second interval are here.
Average throughput:
Insert response time histogram: each cell has the percentage of responses that take <= the time in the header and max is the max response time in seconds. For the max column values in the top 25% of the range have a red background and in the bottom 25% of the range have a green background. The red background is not used when the min value is within 80% of the max value.
| dbms | 256us | 1ms | 4ms | 16ms | 64ms | 256ms | 1s | 4s | 16s | gt | max |
|---|---|---|---|---|---|---|---|---|---|---|---|
| pg15b1.cx5 | 99.869 | 0.106 | 0.023 | 0.002 | 0.198 | ||||||
| pg15b1.cx5a | 96.144 | 2.687 | 1.168 | 0.037 | |||||||
| pg15b1.cx5b | 99.946 | 0.053 | 0.001 | nonzero | 0.699 | ||||||
| pg15b1.cx5c | 98.745 | 1.253 | 0.001 | 0.001 | nonzero | 0.739 |
Performance metrics for the DBMS listed above. Some are normalized by throughput, others are not. Legend for results is here.
ips	qps	rps	rmbps	wps	wmbps	rpq	rkbpq	wpi	wkbpi	csps	cpups	cspq	cpupq	dbgb1	dbgb2	rss	maxop	p50	p99	tag
36968	0	0	0.0	168.6	63.9	0.000	0.000	0.005	1.769	9370	36.1	0.253	39	8.2	21.2	0.0	0.198	38273	14332	20m.pg15b1.cx5
26918	0	0	0.0	113.7	41.5	0.000	0.000	0.004	1.580	6816	34.0	0.253	51	8.2	17.2	0.0	0.037	34126	1498	20m.pg15b1.cx5a
36166	0	0	0.0	168.2	57.1	0.000	0.000	0.005	1.617	9092	35.7	0.251	39	8.2	19.4	0.0	0.699	37758	15733	20m.pg15b1.cx5b
34364	0	0	0.0	218.6	50.3	0.000	0.000	0.006	1.499	8662	35.4	0.252	41	8.2	18.3	0.0	0.739	37559	5196	20m.pg15b1.cx5c
q100.1
q100.1: range queries with 100 insert/s per client. Graphs for performance per 1-second interval are here.
Average throughput:
Query response time histogram: each cell has the percentage of responses that take <= the time in the header and max is the max response time in seconds. For max values in the top 25% of the range have a red background and in the bottom 25% of the range have a green background. The red background is not used when the min value is within 80% of the max value.
| dbms | 256us | 1ms | 4ms | 16ms | 64ms | 256ms | 1s | 4s | 16s | gt | max |
|---|---|---|---|---|---|---|---|---|---|---|---|
| pg15b1.cx5 | 99.938 | 0.061 | 0.001 | 0.003 | |||||||
| pg15b1.cx5a | 99.937 | 0.063 | nonzero | nonzero | 0.007 | ||||||
| pg15b1.cx5b | 99.926 | 0.073 | 0.001 | nonzero | 0.005 | ||||||
| pg15b1.cx5c | 99.939 | 0.060 | nonzero | nonzero | 0.012 |
Insert response time histogram: each cell has the percentage of responses that take <= the time in the header and max is the max response time in seconds. For max values in the top 25% of the range have a red background and in the bottom 25% of the range have a green background. The red background is not used when the min value is within 80% of the max value.
| dbms | 256us | 1ms | 4ms | 16ms | 64ms | 256ms | 1s | 4s | 16s | gt | max |
|---|---|---|---|---|---|---|---|---|---|---|---|
| pg15b1.cx5 | 99.979 | 0.021 | 0.006 | ||||||||
| pg15b1.cx5a | 1.528 | 0.007 | 98.465 | 0.043 | |||||||
| pg15b1.cx5b | 46.514 | 53.486 | 0.009 | ||||||||
| pg15b1.cx5c | 0.264 | 99.729 | 0.007 | 0.017 |
Performance metrics for the DBMS listed above. Some are normalized by throughput, others are not. Legend for results is here.
ips	qps	rps	rmbps	wps	wmbps	rpq	rkbpq	wpi	wkbpi	csps	cpups	cspq	cpupq	dbgb1	dbgb2	rss	maxop	p50	p99	tag
100	7368	0	0.0	195.4	4.4	0.000	0.000	1.956	44.595	28312	26.1	3.843	142	8.3	10.8	0.0	0.003	7368	7272	20m.pg15b1.cx5
100	7456	0	0.0	198.4	3.4	0.000	0.000	1.988	34.961	28658	27.7	3.844	149	8.3	10.6	0.0	0.007	7448	7320	20m.pg15b1.cx5a
100	7396	0	0.0	194.8	3.7	0.000	0.000	1.952	37.694	28425	26.2	3.843	142	8.3	12.2	0.0	0.005	7400	7288	20m.pg15b1.cx5b
100	7440	0	0.0	194.7	3.2	0.000	0.000	1.949	32.906	28589	26.4	3.842	142	8.3	13.3	0.0	0.012	7432	7304	20m.pg15b1.cx5c
q500.1
q500.1: range queries with 500 insert/s per client. Graphs for performance per 1-second interval are here.
Average throughput:
Query response time histogram: each cell has the percentage of responses that take <= the time in the header and max is the max response time in seconds. For max values in the top 25% of the range have a red background and in the bottom 25% of the range have a green background. The red background is not used when the min value is within 80% of the max value.
| dbms | 256us | 1ms | 4ms | 16ms | 64ms | 256ms | 1s | 4s | 16s | gt | max |
|---|---|---|---|---|---|---|---|---|---|---|---|
| pg15b1.cx5 | 99.885 | 0.108 | 0.006 | nonzero | 0.005 | ||||||
| pg15b1.cx5a | 99.841 | 0.155 | 0.004 | 0.001 | 0.009 | ||||||
| pg15b1.cx5b | 99.872 | 0.123 | 0.005 | nonzero | 0.006 | ||||||
| pg15b1.cx5c | 99.865 | 0.131 | 0.003 | 0.001 | 0.012 |
Insert response time histogram: each cell has the percentage of responses that take <= the time in the header and max is the max response time in seconds. For max values in the top 25% of the range have a red background and in the bottom 25% of the range have a green background. The red background is not used when the min value is within 80% of the max value.
| dbms | 256us | 1ms | 4ms | 16ms | 64ms | 256ms | 1s | 4s | 16s | gt | max |
|---|---|---|---|---|---|---|---|---|---|---|---|
| pg15b1.cx5 | 99.987 | 0.013 | 0.015 | ||||||||
| pg15b1.cx5a | 17.046 | 82.954 | 0.044 | ||||||||
| pg15b1.cx5b | 86.944 | 13.056 | 0.008 | ||||||||
| pg15b1.cx5c | 0.213 | 99.786 | 0.001 | 0.025 |
Performance metrics for the DBMS listed above. Some are normalized by throughput, others are not. Legend for results is here.
ips	qps	rps	rmbps	wps	wmbps	rpq	rkbpq	wpi	wkbpi	csps	cpups	cspq	cpupq	dbgb1	dbgb2	rss	maxop	p50	p99	tag
499	7346	0	0.0	375.6	12.4	0.000	0.000	0.752	25.336	28345	26.5	3.859	144	9.7	13.3	0.0	0.005	7352	7226	20m.pg15b1.cx5
499	7315	0	0.0	368.9	9.7	0.000	0.000	0.739	19.801	28254	32.1	3.862	176	9.7	11.8	0.0	0.009	7320	7192	20m.pg15b1.cx5a
499	7314	0	0.0	370.0	10.0	0.000	0.000	0.741	20.451	28205	26.8	3.856	147	9.7	12.2	0.0	0.006	7320	7208	20m.pg15b1.cx5b
500	7306	0	0.0	363.2	8.7	0.000	0.000	0.727	17.926	28172	27.9	3.856	153	9.7	11.5	0.0	0.012	7304	7183	20m.pg15b1.cx5c
q1000.1
q1000.1: range queries with 1000 insert/s per client. Graphs for performance per 1-second interval are here.
Average throughput:
Query response time histogram: each cell has the percentage of responses that take <= the time in the header and max is the max response time in seconds. For max values in the top 25% of the range have a red background and in the bottom 25% of the range have a green background. The red background is not used when the min value is within 80% of the max value.
| dbms | 256us | 1ms | 4ms | 16ms | 64ms | 256ms | 1s | 4s | 16s | gt | max |
|---|---|---|---|---|---|---|---|---|---|---|---|
| pg15b1.cx5 | 99.823 | 0.163 | 0.014 | nonzero | 0.005 | ||||||
| pg15b1.cx5a | 99.721 | 0.269 | 0.010 | 0.001 | 0.010 | ||||||
| pg15b1.cx5b | 99.787 | 0.203 | 0.010 | nonzero | 0.006 | ||||||
| pg15b1.cx5c | 99.773 | 0.219 | 0.007 | 0.001 | 0.008 |
Insert response time histogram: each cell has the percentage of responses that take <= the time in the header and max is the max response time in seconds. For max values in the top 25% of the range have a red background and in the bottom 25% of the range have a green background. The red background is not used when the min value is within 80% of the max value.
| dbms | 256us | 1ms | 4ms | 16ms | 64ms | 256ms | 1s | 4s | 16s | gt | max |
|---|---|---|---|---|---|---|---|---|---|---|---|
| pg15b1.cx5 | 98.258 | 1.726 | 0.016 | 0.035 | |||||||
| pg15b1.cx5a | 0.008 | 63.679 | 36.313 | 0.063 | |||||||
| pg15b1.cx5b | 97.458 | 2.529 | 0.013 | 0.037 | |||||||
| pg15b1.cx5c | 26.839 | 73.156 | 0.005 | 0.039 |
Performance metrics for the DBMS listed above. Some are normalized by throughput, others are not. Legend for results is here.
ips	qps	rps	rmbps	wps	wmbps	rpq	rkbpq	wpi	wkbpi	csps	cpups	cspq	cpupq	dbgb1	dbgb2	rss	maxop	p50	p99	tag
999	7349	8	0.1	512.5	17.5	0.001	0.009	0.513	17.912	28485	27.2	3.876	148	12.0	16.7	0.0	0.005	7352	7224	20m.pg15b1.cx5
999	7216	6	0.1	502.8	14.4	0.001	0.008	0.503	14.773	27986	33.4	3.878	185	12.0	14.8	0.0	0.010	7224	7080	20m.pg15b1.cx5a
999	7290	8	0.1	504.4	14.9	0.001	0.009	0.505	15.262	28244	27.5	3.874	151	12.0	15.1	0.0	0.006	7288	7160	20m.pg15b1.cx5b
999	7253	6	0.1	499.4	13.4	0.001	0.008	0.500	13.745	28091	28.9	3.873	159	12.0	14.3	0.0	0.008	7256	7128	20m.pg15b1.cx5c
l.i0
l.i0: load without secondary indexes
Performance metrics for all DBMS, not just the ones listed above. Some are normalized by throughput, others are not. Legend for results is here.
ips	qps	rps	rmbps	wps	wmbps	rpq	rkbpq	wpi	wkbpi	csps	cpups	cspq	cpupq	dbgb1	dbgb2	rss	maxop	p50	p99	tag
92592	0	0	0.0	60.8	39.5	0.000	0.000	0.001	0.437	11124	41.7	0.120	18	1.9	5.2	0.0	0.003	93233	75817	20m.pg15b1.cx5
92166	0	0	0.0	61.3	39.9	0.000	0.000	0.001	0.443	11136	41.2	0.121	18	1.9	5.2	0.0	0.004	92899	75620	20m.pg15b1.cx5a
91743	0	0	0.0	61.1	39.5	0.000	0.000	0.001	0.441	11047	42.2	0.120	18	1.9	5.2	0.0	0.007	92598	74176	20m.pg15b1.cx5b
92592	0	0	0.0	61.7	39.7	0.000	0.000	0.001	0.439	11103	41.6	0.120	18	1.9	5.2	0.0	0.009	92998	75350	20m.pg15b1.cx5c
l.x
l.x: create secondary indexes
Performance metrics for all DBMS, not just the ones listed above. Some are normalized by throughput, others are not. Legend for results is here.
ips	qps	rps	rmbps	wps	wmbps	rpq	rkbpq	wpi	wkbpi	csps	cpups	cspq	cpupq	dbgb1	dbgb2	rss	maxop	p50	p99	tag
304545	0	0	0.0	69.8	73.7	0.000	0.000	0.000	0.248	2033	24.6	0.007	3	3.7	8.6	0.0	0.002	NA	NA	20m.pg15b1.cx5
163415	0	0	0.0	48.7	40.0	0.000	0.000	0.000	0.250	915	24.0	0.006	6	3.7	7.9	0.0	0.002	NA	NA	20m.pg15b1.cx5a
300000	0	0	0.0	43.9	45.7	0.000	0.000	0.000	0.156	1482	24.0	0.005	3	3.7	8.0	0.0	0.002	NA	NA	20m.pg15b1.cx5b
268000	0	0	0.0	37.9	39.2	0.000	0.000	0.000	0.150	1247	24.6	0.005	4	3.7	7.7	0.0	0.002	NA	NA	20m.pg15b1.cx5c
l.i1
l.i1: continue load after secondary indexes created
Performance metrics for all DBMS, not just the ones listed above. Some are normalized by throughput, others are not. Legend for results is here.
ips	qps	rps	rmbps	wps	wmbps	rpq	rkbpq	wpi	wkbpi	csps	cpups	cspq	cpupq	dbgb1	dbgb2	rss	maxop	p50	p99	tag
36968	0	0	0.0	168.6	63.9	0.000	0.000	0.005	1.769	9370	36.1	0.253	39	8.2	21.2	0.0	0.198	38273	14332	20m.pg15b1.cx5
26918	0	0	0.0	113.7	41.5	0.000	0.000	0.004	1.580	6816	34.0	0.253	51	8.2	17.2	0.0	0.037	34126	1498	20m.pg15b1.cx5a
36166	0	0	0.0	168.2	57.1	0.000	0.000	0.005	1.617	9092	35.7	0.251	39	8.2	19.4	0.0	0.699	37758	15733	20m.pg15b1.cx5b
34364	0	0	0.0	218.6	50.3	0.000	0.000	0.006	1.499	8662	35.4	0.252	41	8.2	18.3	0.0	0.739	37559	5196	20m.pg15b1.cx5c
q100.1
q100.1: range queries with 100 insert/s per client
Performance metrics for all DBMS, not just the ones listed above. Some are normalized by throughput, others are not. Legend for results is here.
ips	qps	rps	rmbps	wps	wmbps	rpq	rkbpq	wpi	wkbpi	csps	cpups	cspq	cpupq	dbgb1	dbgb2	rss	maxop	p50	p99	tag
100	7368	0	0.0	195.4	4.4	0.000	0.000	1.956	44.595	28312	26.1	3.843	142	8.3	10.8	0.0	0.003	7368	7272	20m.pg15b1.cx5
100	7456	0	0.0	198.4	3.4	0.000	0.000	1.988	34.961	28658	27.7	3.844	149	8.3	10.6	0.0	0.007	7448	7320	20m.pg15b1.cx5a
100	7396	0	0.0	194.8	3.7	0.000	0.000	1.952	37.694	28425	26.2	3.843	142	8.3	12.2	0.0	0.005	7400	7288	20m.pg15b1.cx5b
100	7440	0	0.0	194.7	3.2	0.000	0.000	1.949	32.906	28589	26.4	3.842	142	8.3	13.3	0.0	0.012	7432	7304	20m.pg15b1.cx5c
q500.1
q500.1: range queries with 500 insert/s per client
Performance metrics for all DBMS, not just the ones listed above. Some are normalized by throughput, others are not. Legend for results is here.
ips	qps	rps	rmbps	wps	wmbps	rpq	rkbpq	wpi	wkbpi	csps	cpups	cspq	cpupq	dbgb1	dbgb2	rss	maxop	p50	p99	tag
499	7346	0	0.0	375.6	12.4	0.000	0.000	0.752	25.336	28345	26.5	3.859	144	9.7	13.3	0.0	0.005	7352	7226	20m.pg15b1.cx5
499	7315	0	0.0	368.9	9.7	0.000	0.000	0.739	19.801	28254	32.1	3.862	176	9.7	11.8	0.0	0.009	7320	7192	20m.pg15b1.cx5a
499	7314	0	0.0	370.0	10.0	0.000	0.000	0.741	20.451	28205	26.8	3.856	147	9.7	12.2	0.0	0.006	7320	7208	20m.pg15b1.cx5b
500	7306	0	0.0	363.2	8.7	0.000	0.000	0.727	17.926	28172	27.9	3.856	153	9.7	11.5	0.0	0.012	7304	7183	20m.pg15b1.cx5c
q1000.1
q1000.1: range queries with 1000 insert/s per client
Performance metrics for all DBMS, not just the ones listed above. Some are normalized by throughput, others are not. Legend for results is here.
ips	qps	rps	rmbps	wps	wmbps	rpq	rkbpq	wpi	wkbpi	csps	cpups	cspq	cpupq	dbgb1	dbgb2	rss	maxop	p50	p99	tag
999	7349	8	0.1	512.5	17.5	0.001	0.009	0.513	17.912	28485	27.2	3.876	148	12.0	16.7	0.0	0.005	7352	7224	20m.pg15b1.cx5
999	7216	6	0.1	502.8	14.4	0.001	0.008	0.503	14.773	27986	33.4	3.878	185	12.0	14.8	0.0	0.010	7224	7080	20m.pg15b1.cx5a
999	7290	8	0.1	504.4	14.9	0.001	0.009	0.505	15.262	28244	27.5	3.874	151	12.0	15.1	0.0	0.006	7288	7160	20m.pg15b1.cx5b
999	7253	6	0.1	499.4	13.4	0.001	0.008	0.500	13.745	28091	28.9	3.873	159	12.0	14.3	0.0	0.008	7256	7128	20m.pg15b1.cx5c
l.i0
- l.i0: load without secondary indexes
- Legend for results is here.
- Each entry lists the percentage of responses that fit in that bucket (slower than max time for previous bucket, faster than min time for next bucket).
Insert response time histogram
256us	1ms	4ms	16ms	64ms	256ms	1s	4s	16s	gt	max	tag
0.000	1.405	98.596	0.000	0.000	0.000	0.000	0.000	0.000	0.000	0.003	pg15b1.cx5
0.000	0.982	99.018	0.001	0.000	0.000	0.000	0.000	0.000	0.000	0.004	pg15b1.cx5a
0.000	0.614	99.385	0.002	0.000	0.000	0.000	0.000	0.000	0.000	0.007	pg15b1.cx5b
0.000	1.110	98.889	0.001	0.000	0.000	0.000	0.000	0.000	0.000	0.009	pg15b1.cx5c
l.x
- l.x: create secondary indexes
- Legend for results is here.
- Each entry lists the percentage of responses that fit in that bucket (slower than max time for previous bucket, faster than min time for next bucket).
TODO - determine whether there is data for create index response time
l.i1
- l.i1: continue load after secondary indexes created
- Legend for results is here.
- Each entry lists the percentage of responses that fit in that bucket (slower than max time for previous bucket, faster than min time for next bucket).
Insert response time histogram
256us	1ms	4ms	16ms	64ms	256ms	1s	4s	16s	gt	max	tag
0.000	0.000	99.869	0.106	0.023	0.002	0.000	0.000	0.000	0.000	0.198	pg15b1.cx5
0.000	0.000	96.144	2.687	1.168	0.000	0.000	0.000	0.000	0.000	0.037	pg15b1.cx5a
0.000	0.000	99.946	0.053	0.001	0.000	nonzero	0.000	0.000	0.000	0.699	pg15b1.cx5b
0.000	0.000	98.745	1.253	0.001	0.001	nonzero	0.000	0.000	0.000	0.739	pg15b1.cx5c
q100.1
- q100.1: range queries with 100 insert/s per client
- Legend for results is here.
- Each entry lists the percentage of responses that fit in that bucket (slower than max time for previous bucket, faster than min time for next bucket).
Query response time histogram
256us	1ms	4ms	16ms	64ms	256ms	1s	4s	16s	gt	max	tag
99.938	0.061	0.001	0.000	0.000	0.000	0.000	0.000	0.000	0.000	0.003	pg15b1.cx5
99.937	0.063	nonzero	nonzero	0.000	0.000	0.000	0.000	0.000	0.000	0.007	pg15b1.cx5a
99.926	0.073	0.001	nonzero	0.000	0.000	0.000	0.000	0.000	0.000	0.005	pg15b1.cx5b
99.939	0.060	nonzero	nonzero	0.000	0.000	0.000	0.000	0.000	0.000	0.012	pg15b1.cx5c
Insert response time histogram
256us	1ms	4ms	16ms	64ms	256ms	1s	4s	16s	gt	max	tag
0.000	0.000	99.979	0.021	0.000	0.000	0.000	0.000	0.000	0.000	0.006	pg15b1.cx5
0.000	0.000	1.528	0.007	98.465	0.000	0.000	0.000	0.000	0.000	0.043	pg15b1.cx5a
0.000	0.000	46.514	53.486	0.000	0.000	0.000	0.000	0.000	0.000	0.009	pg15b1.cx5b
0.000	0.000	0.264	99.729	0.007	0.000	0.000	0.000	0.000	0.000	0.017	pg15b1.cx5c
q500.1
- q500.1: range queries with 500 insert/s per client
- Legend for results is here.
- Each entry lists the percentage of responses that fit in that bucket (slower than max time for previous bucket, faster than min time for next bucket).
Query response time histogram
256us	1ms	4ms	16ms	64ms	256ms	1s	4s	16s	gt	max	tag
99.885	0.108	0.006	nonzero	0.000	0.000	0.000	0.000	0.000	0.000	0.005	pg15b1.cx5
99.841	0.155	0.004	0.001	0.000	0.000	0.000	0.000	0.000	0.000	0.009	pg15b1.cx5a
99.872	0.123	0.005	nonzero	0.000	0.000	0.000	0.000	0.000	0.000	0.006	pg15b1.cx5b
99.865	0.131	0.003	0.001	0.000	0.000	0.000	0.000	0.000	0.000	0.012	pg15b1.cx5c
Insert response time histogram
256us	1ms	4ms	16ms	64ms	256ms	1s	4s	16s	gt	max	tag
0.000	0.000	99.987	0.013	0.000	0.000	0.000	0.000	0.000	0.000	0.015	pg15b1.cx5
0.000	0.000	0.000	17.046	82.954	0.000	0.000	0.000	0.000	0.000	0.044	pg15b1.cx5a
0.000	0.000	86.944	13.056	0.000	0.000	0.000	0.000	0.000	0.000	0.008	pg15b1.cx5b
0.000	0.000	0.213	99.786	0.001	0.000	0.000	0.000	0.000	0.000	0.025	pg15b1.cx5c
q1000.1
- q1000.1: range queries with 1000 insert/s per client
- Legend for results is here.
- Each entry lists the percentage of responses that fit in that bucket (slower than max time for previous bucket, faster than min time for next bucket).
Query response time histogram
256us	1ms	4ms	16ms	64ms	256ms	1s	4s	16s	gt	max	tag
99.823	0.163	0.014	nonzero	0.000	0.000	0.000	0.000	0.000	0.000	0.005	pg15b1.cx5
99.721	0.269	0.010	0.001	0.000	0.000	0.000	0.000	0.000	0.000	0.010	pg15b1.cx5a
99.787	0.203	0.010	nonzero	0.000	0.000	0.000	0.000	0.000	0.000	0.006	pg15b1.cx5b
99.773	0.219	0.007	0.001	0.000	0.000	0.000	0.000	0.000	0.000	0.008	pg15b1.cx5c
Insert response time histogram
256us	1ms	4ms	16ms	64ms	256ms	1s	4s	16s	gt	max	tag
0.000	0.000	98.258	1.726	0.016	0.000	0.000	0.000	0.000	0.000	0.035	pg15b1.cx5
0.000	0.000	0.008	63.679	36.313	0.000	0.000	0.000	0.000	0.000	0.063	pg15b1.cx5a
0.000	0.000	97.458	2.529	0.013	0.000	0.000	0.000	0.000	0.000	0.037	pg15b1.cx5b
0.000	0.000	26.839	73.156	0.005	0.000	0.000	0.000	0.000	0.000	0.039	pg15b1.cx5c