Introduction
This is a report for the insert benchmark with 500M docs and 1 client(s). It is generated by scripts (bash, awk, sed) and Tufte might not be impressed. An overview of the insert benchmark is here and a short update is here. Below, by DBMS, I mean DBMS+version.config. An example is my8020.c10b40 where my means MySQL, 8020 is version 8.0.20 and c10b40 is the name for the configuration file.
The test server is an Intel NUC with 4 cores, 16G RAM and a Samsung 970 EVO. More details are here. Clients and the DBMS share one server. The per-database configs are in the per-database subdirectories here.
The tested DBMS are:
- pg124.cx5 - Postgres 12.4 and the cx5 config
- pg134.cx5 - Postgres 13.4 and the cx5 config
- pg140.cx5 - Postgres 14.0 and the cx5 config
Contents
- Summary
- l.i0: load without secondary indexes
- l.x: create secondary indexes
- l.i1: continue load after secondary indexes created
- q100.1: range queries with 100 insert/s per client
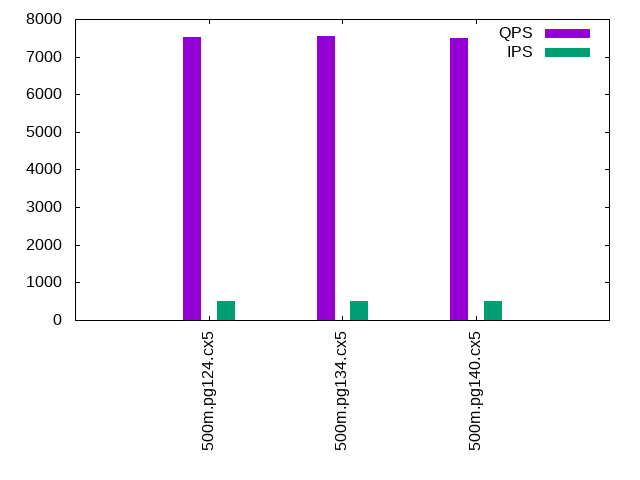
- q500.1: range queries with 500 insert/s per client
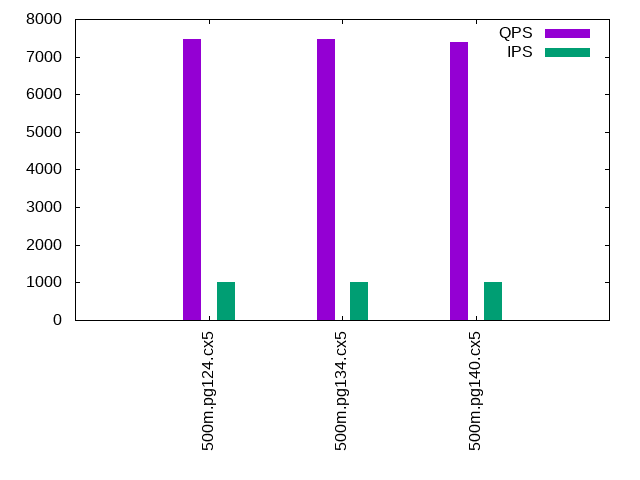
- q1000.1: range queries with 1000 insert/s per client
Summary
The numbers are inserts/s for l.i0 and l.i1, indexed docs (or rows) /s for l.x and queries/s for q*.2. The values are the average rate over the entire test for inserts (IPS) and queries (QPS). The range of values for IPS and QPS is split into 3 parts: bottom 25%, middle 50%, top 25%. Values in the bottom 25% have a red background, values in the top 25% have a green background and values in the middle have no color. A gray background is used for values that can be ignored because the DBMS did not sustain the target insert rate. Red backgrounds are not used when the minimum value is within 80% of the max value.
| dbms | l.i0 | l.x | l.i1 | q100.1 | q500.1 | q1000.1 |
|---|---|---|---|---|---|---|
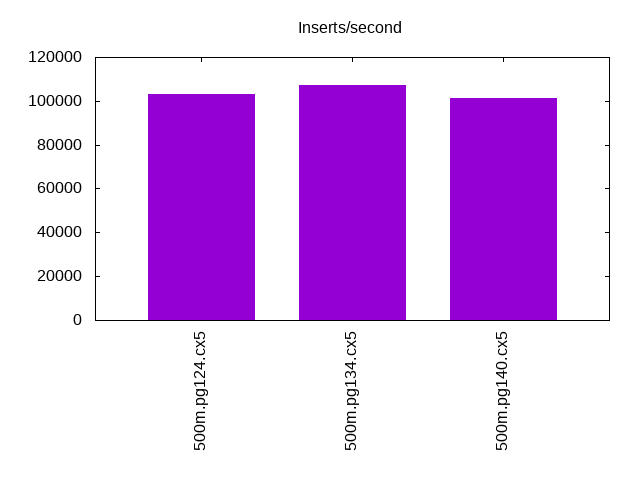
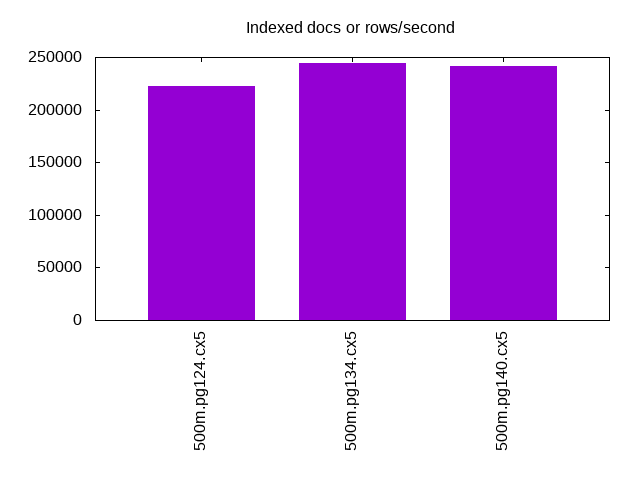
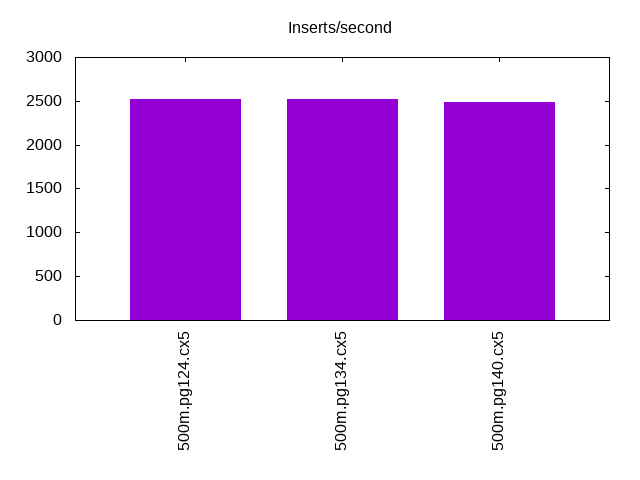
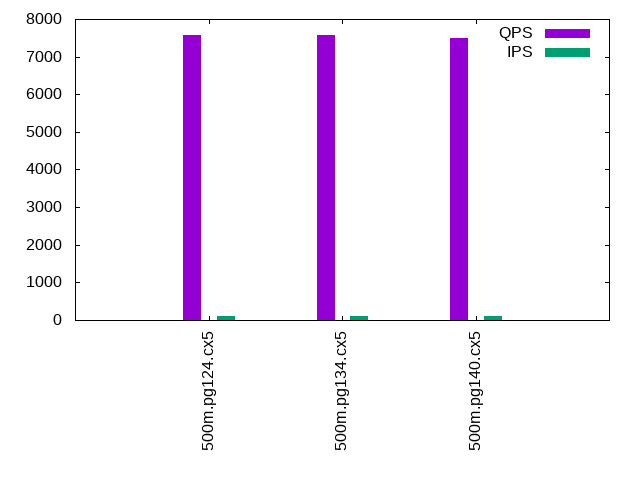
| 500m.pg124.cx5 | 103072 | 222762 | 2523 | 7567 | 7522 | 7468 |
| 500m.pg134.cx5 | 107158 | 244428 | 2526 | 7572 | 7538 | 7472 |
| 500m.pg140.cx5 | 101174 | 241828 | 2492 | 7502 | 7495 | 7381 |
This lists the average rate of inserts/s for the tests that do inserts concurrent with queries. For such tests the query rate is listed in the table above. The read+write tests are setup so that the insert rate should match the target rate every second. Cells that are not at least 95% of the target have a red background to indicate a failure to satisfy the target.
| dbms | q100.1 | q500.1 | q1000.1 |
|---|---|---|---|
| pg124.cx5 | 100 | 500 | 999 |
| pg134.cx5 | 100 | 499 | 999 |
| pg140.cx5 | 100 | 500 | 999 |
| target | 100 | 500 | 1000 |
l.i0
l.i0: load without secondary indexes. Graphs for performance per 1-second interval are here.
Average throughput:
Insert response time histogram: each cell has the percentage of responses that take <= the time in the header and max is the max response time in seconds. For the max column values in the top 25% of the range have a red background and in the bottom 25% of the range have a green background. The red background is not used when the min value is within 80% of the max value.
| dbms | 256us | 1ms | 4ms | 16ms | 64ms | 256ms | 1s | 4s | 16s | gt | max |
|---|---|---|---|---|---|---|---|---|---|---|---|
| pg124.cx5 | 93.617 | 6.381 | 0.001 | 0.001 | nonzero | 0.068 | |||||
| pg134.cx5 | 96.927 | 3.069 | 0.003 | 0.001 | nonzero | 0.200 | |||||
| pg140.cx5 | 86.091 | 13.906 | 0.002 | 0.001 | nonzero | nonzero | 0.276 |
Performance metrics for the DBMS listed above. Some are normalized by throughput, others are not. Legend for results is here.
ips	qps	rps	rmbps	wps	wmbps	rpq	rkbpq	wpi	wkbpi	csps	cpups	cspq	cpupq	dbgb1	dbgb2	rss	maxop	p50	p99	tag
103072	0	44	0.3	196.9	39.7	0.000	0.003	0.002	0.394	12341	42.4	0.120	16	47.8	55.8	0.0	0.068	103188	98695	500m.pg124.cx5
107158	0	38	0.3	160.9	51.3	0.000	0.003	0.002	0.490	12913	43.7	0.121	16	47.8	62.9	0.0	0.200	107781	96994	500m.pg134.cx5
101174	0	41	0.3	143.9	47.3	0.000	0.003	0.001	0.479	12159	43.1	0.120	17	47.8	62.8	0.0	0.276	101587	95796	500m.pg140.cx5
l.x
l.x: create secondary indexes.
Average throughput:
Performance metrics for the DBMS listed above. Some are normalized by throughput, others are not. Legend for results is here.
ips	qps	rps	rmbps	wps	wmbps	rpq	rkbpq	wpi	wkbpi	csps	cpups	cspq	cpupq	dbgb1	dbgb2	rss	maxop	p50	p99	tag
222762	0	574	69.7	476.8	103.0	0.003	0.320	0.002	0.474	933	22.8	0.004	4	91.9	111.6	0.0	0.003	NA	NA	500m.pg124.cx5
244428	0	598	74.4	202.5	78.2	0.002	0.312	0.001	0.328	536	23.2	0.002	4	91.9	106.4	0.0	0.006	NA	NA	500m.pg134.cx5
241828	0	593	73.4	194.4	75.5	0.002	0.311	0.001	0.320	543	23.2	0.002	4	91.9	108.1	0.0	0.007	NA	NA	500m.pg140.cx5
l.i1
l.i1: continue load after secondary indexes created. Graphs for performance per 1-second interval are here.
Average throughput:
Insert response time histogram: each cell has the percentage of responses that take <= the time in the header and max is the max response time in seconds. For the max column values in the top 25% of the range have a red background and in the bottom 25% of the range have a green background. The red background is not used when the min value is within 80% of the max value.
| dbms | 256us | 1ms | 4ms | 16ms | 64ms | 256ms | 1s | 4s | 16s | gt | max |
|---|---|---|---|---|---|---|---|---|---|---|---|
| pg124.cx5 | 29.200 | 70.749 | 0.051 | 0.175 | |||||||
| pg134.cx5 | 31.620 | 68.309 | 0.071 | 0.142 | |||||||
| pg140.cx5 | 27.828 | 72.072 | 0.100 | 0.160 |
Performance metrics for the DBMS listed above. Some are normalized by throughput, others are not. Legend for results is here.
ips	qps	rps	rmbps	wps	wmbps	rpq	rkbpq	wpi	wkbpi	csps	cpups	cspq	cpupq	dbgb1	dbgb2	rss	maxop	p50	p99	tag
2523	0	3374	27.0	4248.7	67.2	1.337	10.966	1.684	27.281	7846	22.6	3.110	358	93.6	111.0	0.0	0.175	2597	1498	500m.pg124.cx5
2526	0	3410	27.3	4289.6	68.3	1.350	11.064	1.698	27.681	7971	22.6	3.155	358	93.6	111.0	0.0	0.142	2597	1498	500m.pg134.cx5
2492	0	3350	26.8	4222.2	66.5	1.344	11.026	1.694	27.319	7703	21.0	3.091	337	93.6	112.5	0.0	0.160	2497	1398	500m.pg140.cx5
q100.1
q100.1: range queries with 100 insert/s per client. Graphs for performance per 1-second interval are here.
Average throughput:
Query response time histogram: each cell has the percentage of responses that take <= the time in the header and max is the max response time in seconds. For max values in the top 25% of the range have a red background and in the bottom 25% of the range have a green background. The red background is not used when the min value is within 80% of the max value.
| dbms | 256us | 1ms | 4ms | 16ms | 64ms | 256ms | 1s | 4s | 16s | gt | max |
|---|---|---|---|---|---|---|---|---|---|---|---|
| pg124.cx5 | 99.905 | 0.094 | 0.001 | nonzero | 0.014 | ||||||
| pg134.cx5 | 99.869 | 0.128 | 0.003 | nonzero | nonzero | 0.040 | |||||
| pg140.cx5 | 99.805 | 0.190 | 0.003 | 0.001 | nonzero | nonzero | 0.067 |
Insert response time histogram: each cell has the percentage of responses that take <= the time in the header and max is the max response time in seconds. For max values in the top 25% of the range have a red background and in the bottom 25% of the range have a green background. The red background is not used when the min value is within 80% of the max value.
| dbms | 256us | 1ms | 4ms | 16ms | 64ms | 256ms | 1s | 4s | 16s | gt | max |
|---|---|---|---|---|---|---|---|---|---|---|---|
| pg124.cx5 | 86.424 | 13.576 | 0.029 | ||||||||
| pg134.cx5 | 85.667 | 14.326 | 0.007 | 0.365 | |||||||
| pg140.cx5 | 96.625 | 3.375 | 0.040 |
Performance metrics for the DBMS listed above. Some are normalized by throughput, others are not. Legend for results is here.
ips	qps	rps	rmbps	wps	wmbps	rpq	rkbpq	wpi	wkbpi	csps	cpups	cspq	cpupq	dbgb1	dbgb2	rss	maxop	p50	p99	tag
100	7567	135	1.1	270.9	4.2	0.018	0.146	2.712	43.050	29452	27.8	3.892	147	93.7	96.2	0.0	0.014	7579	7067	500m.pg124.cx5
100	7572	137	1.1	277.6	4.3	0.018	0.148	2.782	44.285	29472	27.8	3.892	147	93.7	97.0	0.0	0.040	7594	6872	500m.pg134.cx5
100	7502	136	1.1	328.7	4.7	0.018	0.149	3.294	48.651	29134	26.4	3.884	141	93.7	99.3	0.0	0.067	7544	6345	500m.pg140.cx5
q500.1
q500.1: range queries with 500 insert/s per client. Graphs for performance per 1-second interval are here.
Average throughput:
Query response time histogram: each cell has the percentage of responses that take <= the time in the header and max is the max response time in seconds. For max values in the top 25% of the range have a red background and in the bottom 25% of the range have a green background. The red background is not used when the min value is within 80% of the max value.
| dbms | 256us | 1ms | 4ms | 16ms | 64ms | 256ms | 1s | 4s | 16s | gt | max |
|---|---|---|---|---|---|---|---|---|---|---|---|
| pg124.cx5 | 99.911 | 0.087 | 0.002 | nonzero | 0.008 | ||||||
| pg134.cx5 | 99.910 | 0.089 | 0.002 | nonzero | nonzero | 0.017 | |||||
| pg140.cx5 | 99.874 | 0.124 | 0.002 | nonzero | 0.006 |
Insert response time histogram: each cell has the percentage of responses that take <= the time in the header and max is the max response time in seconds. For max values in the top 25% of the range have a red background and in the bottom 25% of the range have a green background. The red background is not used when the min value is within 80% of the max value.
| dbms | 256us | 1ms | 4ms | 16ms | 64ms | 256ms | 1s | 4s | 16s | gt | max |
|---|---|---|---|---|---|---|---|---|---|---|---|
| pg124.cx5 | 97.160 | 2.837 | 0.003 | 0.096 | |||||||
| pg134.cx5 | 97.100 | 2.897 | 0.003 | 0.095 | |||||||
| pg140.cx5 | 95.006 | 4.994 | 0.062 |
Performance metrics for the DBMS listed above. Some are normalized by throughput, others are not. Legend for results is here.
ips	qps	rps	rmbps	wps	wmbps	rpq	rkbpq	wpi	wkbpi	csps	cpups	cspq	cpupq	dbgb1	dbgb2	rss	maxop	p50	p99	tag
500	7522	658	5.2	1057.8	18.4	0.087	0.710	2.118	37.779	30403	28.3	4.042	150	94.6	98.7	0.0	0.008	7528	7400	500m.pg124.cx5
499	7538	658	5.2	1066.3	18.5	0.087	0.709	2.135	37.875	30525	28.3	4.049	150	94.6	98.8	0.0	0.017	7544	7400	500m.pg134.cx5
500	7495	658	5.2	1020.9	17.9	0.088	0.715	2.044	36.669	30233	27.3	4.034	146	94.6	99.7	0.0	0.006	7496	7368	500m.pg140.cx5
q1000.1
q1000.1: range queries with 1000 insert/s per client. Graphs for performance per 1-second interval are here.
Average throughput:
Query response time histogram: each cell has the percentage of responses that take <= the time in the header and max is the max response time in seconds. For max values in the top 25% of the range have a red background and in the bottom 25% of the range have a green background. The red background is not used when the min value is within 80% of the max value.
| dbms | 256us | 1ms | 4ms | 16ms | 64ms | 256ms | 1s | 4s | 16s | gt | max |
|---|---|---|---|---|---|---|---|---|---|---|---|
| pg124.cx5 | 99.825 | 0.172 | 0.003 | nonzero | 0.015 | ||||||
| pg134.cx5 | 99.834 | 0.163 | 0.003 | nonzero | 0.013 | ||||||
| pg140.cx5 | 99.750 | 0.247 | 0.003 | nonzero | 0.007 |
Insert response time histogram: each cell has the percentage of responses that take <= the time in the header and max is the max response time in seconds. For max values in the top 25% of the range have a red background and in the bottom 25% of the range have a green background. The red background is not used when the min value is within 80% of the max value.
| dbms | 256us | 1ms | 4ms | 16ms | 64ms | 256ms | 1s | 4s | 16s | gt | max |
|---|---|---|---|---|---|---|---|---|---|---|---|
| pg124.cx5 | 94.510 | 5.483 | 0.007 | 0.103 | |||||||
| pg134.cx5 | 94.006 | 5.987 | 0.006 | 0.083 | |||||||
| pg140.cx5 | 88.288 | 11.697 | 0.015 | 0.246 |
Performance metrics for the DBMS listed above. Some are normalized by throughput, others are not. Legend for results is here.
ips	qps	rps	rmbps	wps	wmbps	rpq	rkbpq	wpi	wkbpi	csps	cpups	cspq	cpupq	dbgb1	dbgb2	rss	maxop	p50	p99	tag
999	7468	1291	10.3	1695.7	32.3	0.173	1.411	1.697	33.123	31581	29.2	4.229	156	95.5	102.8	0.0	0.015	7480	7320	500m.pg124.cx5
999	7472	1294	10.3	1693.7	32.3	0.173	1.413	1.695	33.104	31753	29.2	4.250	156	95.5	102.8	0.0	0.013	7480	7320	500m.pg134.cx5
999	7381	1294	10.3	1735.4	31.6	0.175	1.435	1.737	32.341	31234	28.5	4.232	154	95.5	104.5	0.0	0.007	7384	7208	500m.pg140.cx5
l.i0
l.i0: load without secondary indexes
Performance metrics for all DBMS, not just the ones listed above. Some are normalized by throughput, others are not. Legend for results is here.
ips	qps	rps	rmbps	wps	wmbps	rpq	rkbpq	wpi	wkbpi	csps	cpups	cspq	cpupq	dbgb1	dbgb2	rss	maxop	p50	p99	tag
103072	0	44	0.3	196.9	39.7	0.000	0.003	0.002	0.394	12341	42.4	0.120	16	47.8	55.8	0.0	0.068	103188	98695	500m.pg124.cx5
107158	0	38	0.3	160.9	51.3	0.000	0.003	0.002	0.490	12913	43.7	0.121	16	47.8	62.9	0.0	0.200	107781	96994	500m.pg134.cx5
101174	0	41	0.3	143.9	47.3	0.000	0.003	0.001	0.479	12159	43.1	0.120	17	47.8	62.8	0.0	0.276	101587	95796	500m.pg140.cx5
l.x
l.x: create secondary indexes
Performance metrics for all DBMS, not just the ones listed above. Some are normalized by throughput, others are not. Legend for results is here.
ips	qps	rps	rmbps	wps	wmbps	rpq	rkbpq	wpi	wkbpi	csps	cpups	cspq	cpupq	dbgb1	dbgb2	rss	maxop	p50	p99	tag
222762	0	574	69.7	476.8	103.0	0.003	0.320	0.002	0.474	933	22.8	0.004	4	91.9	111.6	0.0	0.003	NA	NA	500m.pg124.cx5
244428	0	598	74.4	202.5	78.2	0.002	0.312	0.001	0.328	536	23.2	0.002	4	91.9	106.4	0.0	0.006	NA	NA	500m.pg134.cx5
241828	0	593	73.4	194.4	75.5	0.002	0.311	0.001	0.320	543	23.2	0.002	4	91.9	108.1	0.0	0.007	NA	NA	500m.pg140.cx5
l.i1
l.i1: continue load after secondary indexes created
Performance metrics for all DBMS, not just the ones listed above. Some are normalized by throughput, others are not. Legend for results is here.
ips	qps	rps	rmbps	wps	wmbps	rpq	rkbpq	wpi	wkbpi	csps	cpups	cspq	cpupq	dbgb1	dbgb2	rss	maxop	p50	p99	tag
2523	0	3374	27.0	4248.7	67.2	1.337	10.966	1.684	27.281	7846	22.6	3.110	358	93.6	111.0	0.0	0.175	2597	1498	500m.pg124.cx5
2526	0	3410	27.3	4289.6	68.3	1.350	11.064	1.698	27.681	7971	22.6	3.155	358	93.6	111.0	0.0	0.142	2597	1498	500m.pg134.cx5
2492	0	3350	26.8	4222.2	66.5	1.344	11.026	1.694	27.319	7703	21.0	3.091	337	93.6	112.5	0.0	0.160	2497	1398	500m.pg140.cx5
q100.1
q100.1: range queries with 100 insert/s per client
Performance metrics for all DBMS, not just the ones listed above. Some are normalized by throughput, others are not. Legend for results is here.
ips	qps	rps	rmbps	wps	wmbps	rpq	rkbpq	wpi	wkbpi	csps	cpups	cspq	cpupq	dbgb1	dbgb2	rss	maxop	p50	p99	tag
100	7567	135	1.1	270.9	4.2	0.018	0.146	2.712	43.050	29452	27.8	3.892	147	93.7	96.2	0.0	0.014	7579	7067	500m.pg124.cx5
100	7572	137	1.1	277.6	4.3	0.018	0.148	2.782	44.285	29472	27.8	3.892	147	93.7	97.0	0.0	0.040	7594	6872	500m.pg134.cx5
100	7502	136	1.1	328.7	4.7	0.018	0.149	3.294	48.651	29134	26.4	3.884	141	93.7	99.3	0.0	0.067	7544	6345	500m.pg140.cx5
q500.1
q500.1: range queries with 500 insert/s per client
Performance metrics for all DBMS, not just the ones listed above. Some are normalized by throughput, others are not. Legend for results is here.
ips	qps	rps	rmbps	wps	wmbps	rpq	rkbpq	wpi	wkbpi	csps	cpups	cspq	cpupq	dbgb1	dbgb2	rss	maxop	p50	p99	tag
500	7522	658	5.2	1057.8	18.4	0.087	0.710	2.118	37.779	30403	28.3	4.042	150	94.6	98.7	0.0	0.008	7528	7400	500m.pg124.cx5
499	7538	658	5.2	1066.3	18.5	0.087	0.709	2.135	37.875	30525	28.3	4.049	150	94.6	98.8	0.0	0.017	7544	7400	500m.pg134.cx5
500	7495	658	5.2	1020.9	17.9	0.088	0.715	2.044	36.669	30233	27.3	4.034	146	94.6	99.7	0.0	0.006	7496	7368	500m.pg140.cx5
q1000.1
q1000.1: range queries with 1000 insert/s per client
Performance metrics for all DBMS, not just the ones listed above. Some are normalized by throughput, others are not. Legend for results is here.
ips	qps	rps	rmbps	wps	wmbps	rpq	rkbpq	wpi	wkbpi	csps	cpups	cspq	cpupq	dbgb1	dbgb2	rss	maxop	p50	p99	tag
999	7468	1291	10.3	1695.7	32.3	0.173	1.411	1.697	33.123	31581	29.2	4.229	156	95.5	102.8	0.0	0.015	7480	7320	500m.pg124.cx5
999	7472	1294	10.3	1693.7	32.3	0.173	1.413	1.695	33.104	31753	29.2	4.250	156	95.5	102.8	0.0	0.013	7480	7320	500m.pg134.cx5
999	7381	1294	10.3	1735.4	31.6	0.175	1.435	1.737	32.341	31234	28.5	4.232	154	95.5	104.5	0.0	0.007	7384	7208	500m.pg140.cx5
l.i0
- l.i0: load without secondary indexes
- Legend for results is here.
- Each entry lists the percentage of responses that fit in that bucket (slower than max time for previous bucket, faster than min time for next bucket).
Insert response time histogram
256us	1ms	4ms	16ms	64ms	256ms	1s	4s	16s	gt	max	tag
0.000	93.617	6.381	0.001	0.001	nonzero	0.000	0.000	0.000	0.000	0.068	pg124.cx5
0.000	96.927	3.069	0.003	0.001	nonzero	0.000	0.000	0.000	0.000	0.200	pg134.cx5
0.000	86.091	13.906	0.002	0.001	nonzero	nonzero	0.000	0.000	0.000	0.276	pg140.cx5
l.x
- l.x: create secondary indexes
- Legend for results is here.
- Each entry lists the percentage of responses that fit in that bucket (slower than max time for previous bucket, faster than min time for next bucket).
TODO - determine whether there is data for create index response time
l.i1
- l.i1: continue load after secondary indexes created
- Legend for results is here.
- Each entry lists the percentage of responses that fit in that bucket (slower than max time for previous bucket, faster than min time for next bucket).
Insert response time histogram
256us	1ms	4ms	16ms	64ms	256ms	1s	4s	16s	gt	max	tag
0.000	0.000	0.000	29.200	70.749	0.051	0.000	0.000	0.000	0.000	0.175	pg124.cx5
0.000	0.000	0.000	31.620	68.309	0.071	0.000	0.000	0.000	0.000	0.142	pg134.cx5
0.000	0.000	0.000	27.828	72.072	0.100	0.000	0.000	0.000	0.000	0.160	pg140.cx5
q100.1
- q100.1: range queries with 100 insert/s per client
- Legend for results is here.
- Each entry lists the percentage of responses that fit in that bucket (slower than max time for previous bucket, faster than min time for next bucket).
Query response time histogram
256us	1ms	4ms	16ms	64ms	256ms	1s	4s	16s	gt	max	tag
99.905	0.094	0.001	nonzero	0.000	0.000	0.000	0.000	0.000	0.000	0.014	pg124.cx5
99.869	0.128	0.003	nonzero	nonzero	0.000	0.000	0.000	0.000	0.000	0.040	pg134.cx5
99.805	0.190	0.003	0.001	nonzero	nonzero	0.000	0.000	0.000	0.000	0.067	pg140.cx5
Insert response time histogram
256us	1ms	4ms	16ms	64ms	256ms	1s	4s	16s	gt	max	tag
0.000	0.000	0.000	86.424	13.576	0.000	0.000	0.000	0.000	0.000	0.029	pg124.cx5
0.000	0.000	0.000	85.667	14.326	0.000	0.007	0.000	0.000	0.000	0.365	pg134.cx5
0.000	0.000	0.000	96.625	3.375	0.000	0.000	0.000	0.000	0.000	0.040	pg140.cx5
q500.1
- q500.1: range queries with 500 insert/s per client
- Legend for results is here.
- Each entry lists the percentage of responses that fit in that bucket (slower than max time for previous bucket, faster than min time for next bucket).
Query response time histogram
256us	1ms	4ms	16ms	64ms	256ms	1s	4s	16s	gt	max	tag
99.911	0.087	0.002	nonzero	0.000	0.000	0.000	0.000	0.000	0.000	0.008	pg124.cx5
99.910	0.089	0.002	nonzero	nonzero	0.000	0.000	0.000	0.000	0.000	0.017	pg134.cx5
99.874	0.124	0.002	nonzero	0.000	0.000	0.000	0.000	0.000	0.000	0.006	pg140.cx5
Insert response time histogram
256us	1ms	4ms	16ms	64ms	256ms	1s	4s	16s	gt	max	tag
0.000	0.000	0.000	97.160	2.837	0.003	0.000	0.000	0.000	0.000	0.096	pg124.cx5
0.000	0.000	0.000	97.100	2.897	0.003	0.000	0.000	0.000	0.000	0.095	pg134.cx5
0.000	0.000	0.000	95.006	4.994	0.000	0.000	0.000	0.000	0.000	0.062	pg140.cx5
q1000.1
- q1000.1: range queries with 1000 insert/s per client
- Legend for results is here.
- Each entry lists the percentage of responses that fit in that bucket (slower than max time for previous bucket, faster than min time for next bucket).
Query response time histogram
256us	1ms	4ms	16ms	64ms	256ms	1s	4s	16s	gt	max	tag
99.825	0.172	0.003	nonzero	0.000	0.000	0.000	0.000	0.000	0.000	0.015	pg124.cx5
99.834	0.163	0.003	nonzero	0.000	0.000	0.000	0.000	0.000	0.000	0.013	pg134.cx5
99.750	0.247	0.003	nonzero	0.000	0.000	0.000	0.000	0.000	0.000	0.007	pg140.cx5
Insert response time histogram
256us	1ms	4ms	16ms	64ms	256ms	1s	4s	16s	gt	max	tag
0.000	0.000	0.000	94.510	5.483	0.007	0.000	0.000	0.000	0.000	0.103	pg124.cx5
0.000	0.000	0.000	94.006	5.987	0.006	0.000	0.000	0.000	0.000	0.083	pg134.cx5
0.000	0.000	0.000	88.288	11.697	0.015	0.000	0.000	0.000	0.000	0.246	pg140.cx5