Introduction
This is a report for the insert benchmark with 500M docs and 1 client(s). It is generated by scripts (bash, awk, sed) and Tufte might not be impressed. An overview of the insert benchmark is here and a short update is here. Below, by DBMS, I mean DBMS+version.config. An example is my8020.c10b40 where my means MySQL, 8020 is version 8.0.20 and c10b40 is the name for the configuration file.
The test server is an Intel NUC with 4 cores, 16G RAM and a Samsung 970 EVO. More details are here. Clients and the DBMS share one server. The per-database configs are in the per-database subdirectories here.
The tested DBMS are:
- my5649.cy8 - MySQL 5.6.49, InnoDB and the cy8 config
- my5735.cy8 - MySQL 5.7.35, InnoDB and the cy8 config
- my8020.cy8 - MySQL 8.0.20, InnoDB and the cy8 config
- my8022.cy8 - MySQL 8.0.22, InnoDB and the cy8 config
- my8023.cy8 - MySQL 8.0.23, InnoDB and the cy8 config
- my8026.cy8 - MySQL 8.0.26, InnoDB and the cy8 config
- my8027.cy8 - MySQL 8.0.27, InnoDB and the cy8 config
Contents
- Summary
- l.i0: load without secondary indexes
- l.x: create secondary indexes
- l.i1: continue load after secondary indexes created
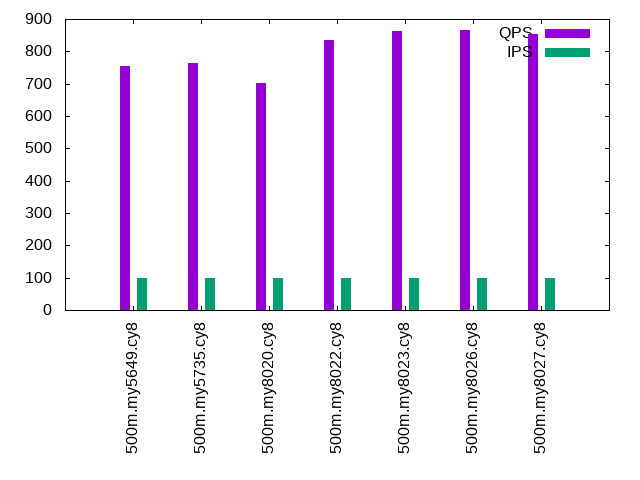
- q100.1: range queries with 100 insert/s per client
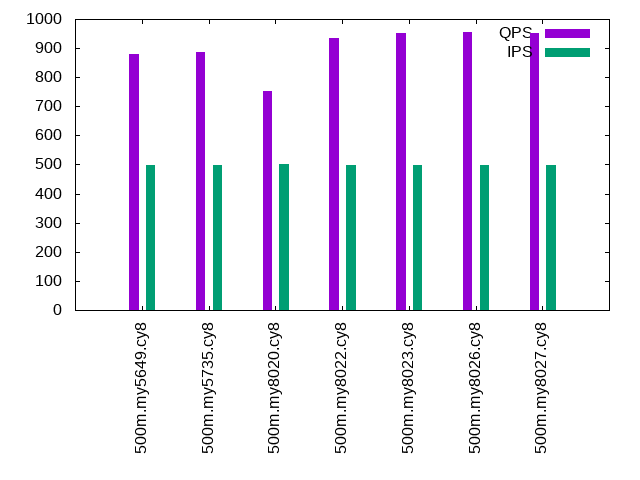
- q500.1: range queries with 500 insert/s per client
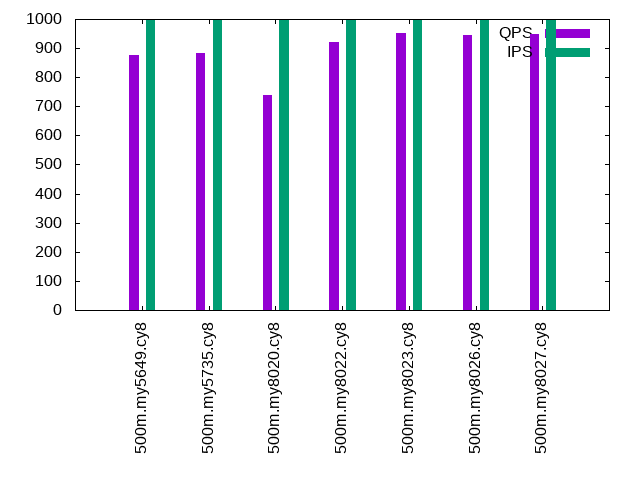
- q1000.1: range queries with 1000 insert/s per client
Summary
The numbers are inserts/s for l.i0 and l.i1, indexed docs (or rows) /s for l.x and queries/s for q*.2. The values are the average rate over the entire test for inserts (IPS) and queries (QPS). The range of values for IPS and QPS is split into 3 parts: bottom 25%, middle 50%, top 25%. Values in the bottom 25% have a red background, values in the top 25% have a green background and values in the middle have no color. A gray background is used for values that can be ignored because the DBMS did not sustain the target insert rate. Red backgrounds are not used when the minimum value is within 80% of the max value.
| dbms | l.i0 | l.x | l.i1 | q100.1 | q500.1 | q1000.1 |
|---|---|---|---|---|---|---|
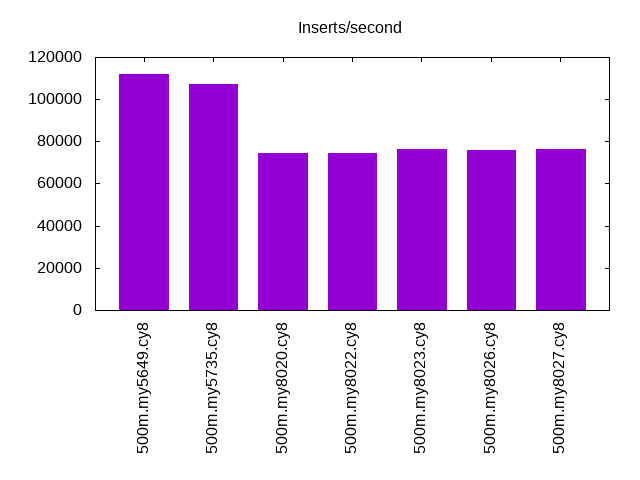
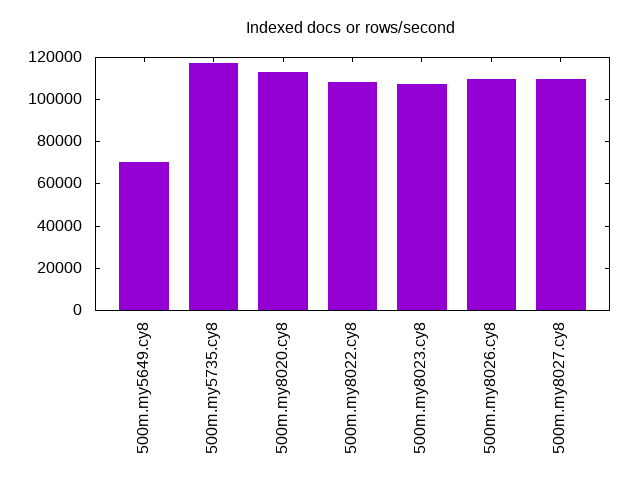
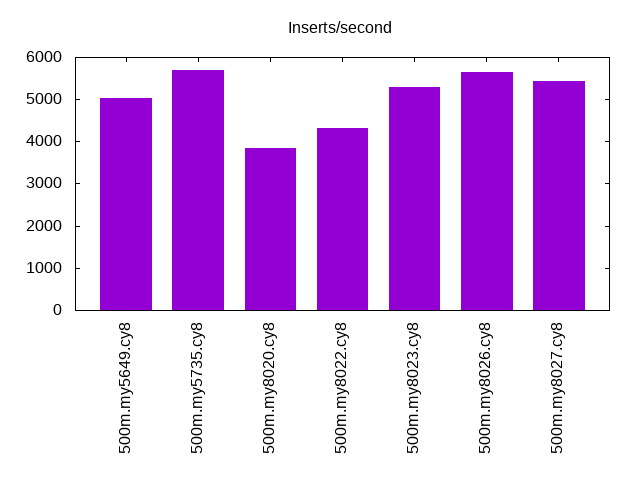
| 500m.my5649.cy8 | 112108 | 70091 | 5023 | 754 | 881 | 878 |
| 500m.my5735.cy8 | 107411 | 117037 | 5701 | 763 | 885 | 884 |
| 500m.my8020.cy8 | 74660 | 113068 | 3834 | 702 | 753 | 739 |
| 500m.my8022.cy8 | 74694 | 108340 | 4310 | 836 | 936 | 922 |
| 500m.my8023.cy8 | 76359 | 107088 | 5277 | 863 | 953 | 952 |
| 500m.my8026.cy8 | 75792 | 109551 | 5643 | 866 | 955 | 946 |
| 500m.my8027.cy8 | 76546 | 109695 | 5423 | 854 | 951 | 950 |
This lists the average rate of inserts/s for the tests that do inserts concurrent with queries. For such tests the query rate is listed in the table above. The read+write tests are setup so that the insert rate should match the target rate every second. Cells that are not at least 95% of the target have a red background to indicate a failure to satisfy the target.
| dbms | q100.1 | q500.1 | q1000.1 |
|---|---|---|---|
| my5649.cy8 | 100 | 499 | 999 |
| my5735.cy8 | 100 | 499 | 999 |
| my8020.cy8 | 100 | 500 | 999 |
| my8022.cy8 | 100 | 499 | 999 |
| my8023.cy8 | 100 | 499 | 999 |
| my8026.cy8 | 100 | 499 | 999 |
| my8027.cy8 | 100 | 499 | 999 |
| target | 100 | 500 | 1000 |
l.i0
l.i0: load without secondary indexes. Graphs for performance per 1-second interval are here.
Average throughput:
Insert response time histogram: each cell has the percentage of responses that take <= the time in the header and max is the max response time in seconds. For the max column values in the top 25% of the range have a red background and in the bottom 25% of the range have a green background. The red background is not used when the min value is within 80% of the max value.
| dbms | 256us | 1ms | 4ms | 16ms | 64ms | 256ms | 1s | 4s | 16s | gt | max |
|---|---|---|---|---|---|---|---|---|---|---|---|
| my5649.cy8 | 96.865 | 2.750 | 0.300 | 0.082 | 0.001 | 0.003 | 0.361 | ||||
| my5735.cy8 | 98.390 | 1.347 | 0.257 | 0.002 | 0.004 | 0.117 | |||||
| my8020.cy8 | 99.566 | 0.400 | 0.034 | nonzero | 0.082 | ||||||
| my8022.cy8 | 99.714 | 0.208 | 0.078 | nonzero | 0.078 | ||||||
| my8023.cy8 | 99.721 | 0.203 | 0.076 | nonzero | 0.121 | ||||||
| my8026.cy8 | 99.696 | 0.272 | 0.032 | nonzero | 0.109 | ||||||
| my8027.cy8 | 99.699 | 0.270 | 0.031 | nonzero | 0.112 |
Performance metrics for the DBMS listed above. Some are normalized by throughput, others are not. Legend for results is here.
ips	qps	rps	rmbps	wps	wmbps	rpq	rkbpq	wpi	wkbpi	csps	cpups	cspq	cpupq	dbgb1	dbgb2	rss	maxop	p50	p99	tag
112108	0	981	3.8	445.0	37.5	0.009	0.035	0.004	0.342	14147	44.8	0.126	16	32.9	73.4	10.7	0.361	112977	77537	500m.my5649.cy8
107411	0	0	0.0	457.1	36.6	0.000	0.000	0.004	0.349	11999	45.3	0.112	17	32.9	73.5	11.0	0.117	107483	95694	500m.my5735.cy8
74660	0	0	0.0	395.1	26.7	0.000	0.000	0.005	0.366	19060	39.7	0.255	21	32.8	73.3	11.1	0.082	74654	70222	500m.my8020.cy8
74694	0	0	0.0	397.7	26.7	0.000	0.000	0.005	0.366	8379	39.6	0.112	21	32.8	73.3	11.2	0.078	74717	70422	500m.my8022.cy8
76359	0	0	0.0	404.5	27.3	0.000	0.000	0.005	0.366	8732	40.5	0.114	21	32.8	73.3	11.1	0.121	76217	71719	500m.my8023.cy8
75792	0	0	0.0	398.0	27.1	0.000	0.000	0.005	0.366	8666	40.4	0.114	21	32.8	73.3	11.1	0.109	75648	71343	500m.my8026.cy8
76546	0	0	0.0	400.3	27.3	0.000	0.000	0.005	0.366	8895	40.6	0.116	21	32.8	73.3	11.1	0.112	76346	72220	500m.my8027.cy8
l.x
l.x: create secondary indexes.
Average throughput:
Performance metrics for the DBMS listed above. Some are normalized by throughput, others are not. Legend for results is here.
ips	qps	rps	rmbps	wps	wmbps	rpq	rkbpq	wpi	wkbpi	csps	cpups	cspq	cpupq	dbgb1	dbgb2	rss	maxop	p50	p99	tag
70091	0	425	63.1	739.3	85.0	0.006	0.922	0.011	1.241	2479	18.6	0.035	11	67.8	108.3	10.8	0.025	NA	NA	500m.my5649.cy8
117037	0	679	101.0	1184.8	128.9	0.006	0.884	0.010	1.127	7045	22.9	0.060	8	73.6	114.2	11.1	0.013	NA	NA	500m.my5735.cy8
113068	0	627	98.8	1228.8	124.2	0.006	0.895	0.011	1.125	7356	22.9	0.065	8	73.3	113.8	11.3	0.013	NA	NA	500m.my8020.cy8
108340	0	636	94.3	1185.3	119.2	0.006	0.891	0.011	1.127	6114	22.7	0.056	8	73.3	113.8	11.3	0.025	NA	NA	500m.my8022.cy8
107088	0	637	93.3	1186.3	117.9	0.006	0.893	0.011	1.127	6630	22.8	0.062	9	73.3	113.9	11.2	0.020	NA	NA	500m.my8023.cy8
109551	0	654	95.4	1204.6	120.2	0.006	0.892	0.011	1.123	6739	23.2	0.062	8	73.3	113.9	11.2	0.013	NA	NA	500m.my8026.cy8
109695	0	1631	143.7	2252.7	142.7	0.015	1.341	0.021	1.332	14790	67.6	0.135	25	73.3	113.9	11.2	0.016	NA	NA	500m.my8027.cy8
l.i1
l.i1: continue load after secondary indexes created. Graphs for performance per 1-second interval are here.
Average throughput:
Insert response time histogram: each cell has the percentage of responses that take <= the time in the header and max is the max response time in seconds. For the max column values in the top 25% of the range have a red background and in the bottom 25% of the range have a green background. The red background is not used when the min value is within 80% of the max value.
| dbms | 256us | 1ms | 4ms | 16ms | 64ms | 256ms | 1s | 4s | 16s | gt | max |
|---|---|---|---|---|---|---|---|---|---|---|---|
| my5649.cy8 | 71.762 | 14.226 | 11.828 | 1.761 | 0.422 | 0.571 | |||||
| my5735.cy8 | 67.054 | 22.146 | 9.653 | 0.864 | 0.283 | 0.643 | |||||
| my8020.cy8 | 60.388 | 23.460 | 11.995 | 3.774 | 0.383 | 0.667 | |||||
| my8022.cy8 | 62.238 | 23.598 | 10.797 | 3.101 | 0.265 | 0.615 | |||||
| my8023.cy8 | 61.922 | 26.968 | 9.741 | 1.121 | 0.248 | 0.751 | |||||
| my8026.cy8 | 61.715 | 27.402 | 9.945 | 0.694 | 0.246 | 0.809 | |||||
| my8027.cy8 | 69.830 | 19.443 | 9.639 | 0.656 | 0.432 | 0.734 |
Performance metrics for the DBMS listed above. Some are normalized by throughput, others are not. Legend for results is here.
ips	qps	rps	rmbps	wps	wmbps	rpq	rkbpq	wpi	wkbpi	csps	cpups	cspq	cpupq	dbgb1	dbgb2	rss	maxop	p50	p99	tag
5023	0	2612	39.8	3595.2	131.4	0.520	8.109	0.716	26.800	14370	19.1	2.861	152	101.8	144.2	10.8	0.571	1348	499	500m.my5649.cy8
5701	0	2863	44.7	3984.6	143.4	0.502	8.034	0.699	25.748	17765	25.5	3.116	179	101.8	144.4	11.1	0.643	2397	150	500m.my5735.cy8
3834	0	1943	30.4	3404.0	99.3	0.507	8.108	0.888	26.524	22399	27.3	5.842	285	101.4	143.9	11.3	0.667	1099	100	500m.my8020.cy8
4310	0	2173	33.9	3838.2	112.0	0.504	8.065	0.890	26.613	18530	22.3	4.299	207	101.4	143.8	11.3	0.615	1350	100	500m.my8022.cy8
5277	0	2653	41.5	4650.5	135.9	0.503	8.045	0.881	26.379	20002	24.5	3.790	186	101.4	143.9	11.2	0.751	2347	100	500m.my8023.cy8
5643	0	2842	44.4	4937.5	144.6	0.504	8.057	0.875	26.234	21039	25.7	3.728	182	101.4	143.9	11.3	0.809	2747	100	500m.my8026.cy8
5423	0	2745	42.9	4690.0	137.5	0.506	8.099	0.865	25.972	20106	24.3	3.708	179	101.4	143.9	11.2	0.734	2098	100	500m.my8027.cy8
q100.1
q100.1: range queries with 100 insert/s per client. Graphs for performance per 1-second interval are here.
Average throughput:
Query response time histogram: each cell has the percentage of responses that take <= the time in the header and max is the max response time in seconds. For max values in the top 25% of the range have a red background and in the bottom 25% of the range have a green background. The red background is not used when the min value is within 80% of the max value.
| dbms | 256us | 1ms | 4ms | 16ms | 64ms | 256ms | 1s | 4s | 16s | gt | max |
|---|---|---|---|---|---|---|---|---|---|---|---|
| my5649.cy8 | 3.981 | 56.679 | 38.770 | 0.471 | 0.097 | 0.002 | 0.091 | ||||
| my5735.cy8 | 6.414 | 51.881 | 41.157 | 0.443 | 0.105 | 0.001 | 0.105 | ||||
| my8020.cy8 | 3.511 | 45.525 | 50.278 | 0.589 | 0.097 | nonzero | 0.096 | ||||
| my8022.cy8 | 8.791 | 47.752 | 42.991 | 0.379 | 0.086 | nonzero | 0.112 | ||||
| my8023.cy8 | 8.538 | 49.522 | 41.458 | 0.386 | 0.096 | nonzero | 0.088 | ||||
| my8026.cy8 | 7.901 | 50.468 | 41.166 | 0.371 | 0.094 | 0.001 | 0.112 | ||||
| my8027.cy8 | 7.996 | 49.300 | 42.214 | 0.400 | 0.090 | nonzero | 0.118 |
Insert response time histogram: each cell has the percentage of responses that take <= the time in the header and max is the max response time in seconds. For max values in the top 25% of the range have a red background and in the bottom 25% of the range have a green background. The red background is not used when the min value is within 80% of the max value.
| dbms | 256us | 1ms | 4ms | 16ms | 64ms | 256ms | 1s | 4s | 16s | gt | max |
|---|---|---|---|---|---|---|---|---|---|---|---|
| my5649.cy8 | 0.257 | 42.333 | 56.528 | 0.882 | 0.111 | ||||||
| my5735.cy8 | 0.354 | 52.493 | 47.104 | 0.049 | 0.094 | ||||||
| my8020.cy8 | 0.076 | 43.188 | 56.736 | 0.064 | |||||||
| my8022.cy8 | 0.368 | 56.785 | 42.847 | 0.061 | |||||||
| my8023.cy8 | 0.361 | 63.458 | 36.076 | 0.104 | 0.097 | ||||||
| my8026.cy8 | 0.264 | 65.014 | 34.632 | 0.090 | 0.078 | ||||||
| my8027.cy8 | 0.375 | 74.007 | 25.611 | 0.007 | 0.074 |
Performance metrics for the DBMS listed above. Some are normalized by throughput, others are not. Legend for results is here.
ips	qps	rps	rmbps	wps	wmbps	rpq	rkbpq	wpi	wkbpi	csps	cpups	cspq	cpupq	dbgb1	dbgb2	rss	maxop	p50	p99	tag
100	754	2941	45.9	393.3	12.0	3.901	62.376	3.941	123.357	9493	17.5	12.592	929	101.8	144.3	10.8	0.091	735	464	500m.my5649.cy8
100	763	2976	46.5	404.2	12.3	3.900	62.401	4.050	126.385	9843	18.2	12.897	954	101.8	144.4	11.1	0.105	751	543	500m.my5735.cy8
100	702	2744	42.9	471.3	11.8	3.909	62.537	4.718	120.715	11759	23.7	16.751	1350	101.5	143.9	11.3	0.096	687	480	500m.my8020.cy8
100	836	3248	50.7	510.7	12.8	3.882	62.119	5.118	131.032	10617	17.6	12.692	842	101.5	143.9	11.3	0.112	815	591	500m.my8022.cy8
100	863	3345	52.3	531.2	13.1	3.876	62.014	5.323	134.699	11225	17.5	13.006	811	101.5	144.0	11.3	0.088	847	607	500m.my8023.cy8
100	866	3362	52.5	535.0	13.2	3.880	62.085	5.361	135.669	11283	17.4	13.024	803	101.5	144.0	11.3	0.112	847	623	500m.my8026.cy8
100	854	3315	51.8	511.3	12.6	3.882	62.108	5.123	129.595	11086	17.4	12.979	815	101.5	144.0	11.2	0.118	831	591	500m.my8027.cy8
q500.1
q500.1: range queries with 500 insert/s per client. Graphs for performance per 1-second interval are here.
Average throughput:
Query response time histogram: each cell has the percentage of responses that take <= the time in the header and max is the max response time in seconds. For max values in the top 25% of the range have a red background and in the bottom 25% of the range have a green background. The red background is not used when the min value is within 80% of the max value.
| dbms | 256us | 1ms | 4ms | 16ms | 64ms | 256ms | 1s | 4s | 16s | gt | max |
|---|---|---|---|---|---|---|---|---|---|---|---|
| my5649.cy8 | 9.104 | 50.423 | 40.093 | 0.289 | 0.091 | 0.046 | |||||
| my5735.cy8 | 16.537 | 41.557 | 41.545 | 0.260 | 0.101 | 0.046 | |||||
| my8020.cy8 | 8.145 | 40.338 | 51.131 | 0.272 | 0.114 | 0.041 | |||||
| my8022.cy8 | 17.780 | 38.609 | 43.280 | 0.238 | 0.093 | 0.054 | |||||
| my8023.cy8 | 15.651 | 41.619 | 42.363 | 0.273 | 0.095 | 0.044 | |||||
| my8026.cy8 | 14.441 | 43.019 | 42.183 | 0.260 | 0.097 | 0.044 | |||||
| my8027.cy8 | 14.610 | 42.812 | 42.224 | 0.257 | 0.097 | 0.050 |
Insert response time histogram: each cell has the percentage of responses that take <= the time in the header and max is the max response time in seconds. For max values in the top 25% of the range have a red background and in the bottom 25% of the range have a green background. The red background is not used when the min value is within 80% of the max value.
| dbms | 256us | 1ms | 4ms | 16ms | 64ms | 256ms | 1s | 4s | 16s | gt | max |
|---|---|---|---|---|---|---|---|---|---|---|---|
| my5649.cy8 | 54.825 | 40.603 | 4.572 | 0.064 | |||||||
| my5735.cy8 | 57.632 | 41.926 | 0.442 | 0.053 | |||||||
| my8020.cy8 | 22.271 | 76.921 | 0.807 | 0.001 | 0.068 | ||||||
| my8022.cy8 | 43.019 | 56.354 | 0.625 | 0.001 | 0.070 | ||||||
| my8023.cy8 | 41.839 | 57.510 | 0.650 | 0.001 | 0.066 | ||||||
| my8026.cy8 | 38.638 | 60.731 | 0.631 | 0.001 | 0.067 | ||||||
| my8027.cy8 | 46.972 | 52.515 | 0.513 | 0.057 |
Performance metrics for the DBMS listed above. Some are normalized by throughput, others are not. Legend for results is here.
ips	qps	rps	rmbps	wps	wmbps	rpq	rkbpq	wpi	wkbpi	csps	cpups	cspq	cpupq	dbgb1	dbgb2	rss	maxop	p50	p99	tag
499	881	3423	53.4	404.9	12.6	3.887	62.063	0.811	25.916	11059	16.7	12.557	758	102.1	144.5	10.8	0.046	863	671	500m.my5649.cy8
499	885	3432	53.6	406.1	12.6	3.878	62.042	0.813	25.837	11299	17.5	12.767	791	102.1	144.7	11.1	0.046	863	639	500m.my5735.cy8
500	753	2931	45.8	461.6	11.8	3.893	62.287	0.924	24.094	13307	24.1	17.672	1280	101.7	144.1	11.3	0.041	735	607	500m.my8020.cy8
499	936	3630	56.7	513.8	13.1	3.876	62.016	1.029	26.777	11719	17.3	12.513	739	101.7	144.1	11.3	0.054	927	656	500m.my8022.cy8
499	953	3696	57.7	530.7	13.3	3.878	62.055	1.063	27.323	12284	17.3	12.891	726	101.7	144.2	11.3	0.044	943	687	500m.my8023.cy8
499	955	3705	57.9	536.0	13.5	3.881	62.089	1.073	27.587	12327	17.3	12.912	725	101.7	144.2	11.3	0.044	943	687	500m.my8026.cy8
499	951	3682	57.5	524.6	13.2	3.872	61.946	1.051	27.027	12233	17.3	12.863	728	101.7	144.2	11.2	0.050	928	687	500m.my8027.cy8
q1000.1
q1000.1: range queries with 1000 insert/s per client. Graphs for performance per 1-second interval are here.
Average throughput:
Query response time histogram: each cell has the percentage of responses that take <= the time in the header and max is the max response time in seconds. For max values in the top 25% of the range have a red background and in the bottom 25% of the range have a green background. The red background is not used when the min value is within 80% of the max value.
| dbms | 256us | 1ms | 4ms | 16ms | 64ms | 256ms | 1s | 4s | 16s | gt | max |
|---|---|---|---|---|---|---|---|---|---|---|---|
| my5649.cy8 | 10.695 | 46.290 | 42.572 | 0.303 | 0.140 | nonzero | 0.233 | ||||
| my5735.cy8 | 19.955 | 36.039 | 43.544 | 0.324 | 0.138 | nonzero | 0.077 | ||||
| my8020.cy8 | 10.071 | 36.134 | 53.192 | 0.446 | 0.157 | nonzero | 0.085 | ||||
| my8022.cy8 | 19.295 | 35.171 | 45.107 | 0.307 | 0.120 | nonzero | 0.078 | ||||
| my8023.cy8 | 18.239 | 37.215 | 44.132 | 0.295 | 0.118 | nonzero | 0.096 | ||||
| my8026.cy8 | 16.835 | 38.434 | 44.304 | 0.301 | 0.126 | nonzero | 0.090 | ||||
| my8027.cy8 | 17.076 | 38.409 | 44.084 | 0.309 | 0.122 | nonzero | 0.082 |
Insert response time histogram: each cell has the percentage of responses that take <= the time in the header and max is the max response time in seconds. For max values in the top 25% of the range have a red background and in the bottom 25% of the range have a green background. The red background is not used when the min value is within 80% of the max value.
| dbms | 256us | 1ms | 4ms | 16ms | 64ms | 256ms | 1s | 4s | 16s | gt | max |
|---|---|---|---|---|---|---|---|---|---|---|---|
| my5649.cy8 | 60.691 | 33.989 | 5.315 | 0.006 | 0.170 | ||||||
| my5735.cy8 | 66.779 | 32.381 | 0.836 | 0.003 | 0.151 | ||||||
| my8020.cy8 | 45.181 | 53.933 | 0.881 | 0.005 | 0.181 | ||||||
| my8022.cy8 | 51.873 | 47.352 | 0.770 | 0.005 | 0.182 | ||||||
| my8023.cy8 | 55.902 | 43.398 | 0.696 | 0.004 | 0.170 | ||||||
| my8026.cy8 | 47.568 | 51.480 | 0.945 | 0.007 | 0.159 | ||||||
| my8027.cy8 | 63.088 | 36.320 | 0.588 | 0.003 | 0.170 |
Performance metrics for the DBMS listed above. Some are normalized by throughput, others are not. Legend for results is here.
ips	qps	rps	rmbps	wps	wmbps	rpq	rkbpq	wpi	wkbpi	csps	cpups	cspq	cpupq	dbgb1	dbgb2	rss	maxop	p50	p99	tag
999	878	3658	56.9	679.1	21.4	4.165	66.389	0.680	21.886	12273	17.5	13.972	797	102.5	145.3	10.8	0.233	863	655	500m.my5649.cy8
999	884	3646	57.0	677.6	21.2	4.122	65.953	0.678	21.686	12464	18.3	14.092	828	102.5	145.4	11.1	0.077	864	639	500m.my5735.cy8
999	739	3065	47.9	764.2	19.6	4.148	66.369	0.765	20.091	14496	25.1	19.616	1359	102.2	144.9	11.3	0.085	720	591	500m.my8020.cy8
999	922	3842	60.0	875.3	22.5	4.165	66.635	0.876	23.019	12812	18.2	13.889	789	102.2	145.0	11.3	0.078	911	656	500m.my8022.cy8
999	952	3909	61.1	848.5	21.6	4.108	65.731	0.850	22.175	13519	18.3	14.207	769	102.2	144.9	11.3	0.096	943	703	500m.my8023.cy8
999	946	3941	61.6	892.0	22.7	4.166	66.657	0.893	23.304	13654	18.4	14.433	778	102.2	145.1	11.3	0.090	943	687	500m.my8026.cy8
999	950	3891	60.8	839.0	21.4	4.096	65.538	0.840	21.949	13473	18.2	14.183	766	102.2	144.9	11.2	0.082	943	688	500m.my8027.cy8
l.i0
l.i0: load without secondary indexes
Performance metrics for all DBMS, not just the ones listed above. Some are normalized by throughput, others are not. Legend for results is here.
ips	qps	rps	rmbps	wps	wmbps	rpq	rkbpq	wpi	wkbpi	csps	cpups	cspq	cpupq	dbgb1	dbgb2	rss	maxop	p50	p99	tag
112108	0	981	3.8	445.0	37.5	0.009	0.035	0.004	0.342	14147	44.8	0.126	16	32.9	73.4	10.7	0.361	112977	77537	500m.my5649.cy8
107411	0	0	0.0	457.1	36.6	0.000	0.000	0.004	0.349	11999	45.3	0.112	17	32.9	73.5	11.0	0.117	107483	95694	500m.my5735.cy8
74660	0	0	0.0	395.1	26.7	0.000	0.000	0.005	0.366	19060	39.7	0.255	21	32.8	73.3	11.1	0.082	74654	70222	500m.my8020.cy8
74694	0	0	0.0	397.7	26.7	0.000	0.000	0.005	0.366	8379	39.6	0.112	21	32.8	73.3	11.2	0.078	74717	70422	500m.my8022.cy8
76359	0	0	0.0	404.5	27.3	0.000	0.000	0.005	0.366	8732	40.5	0.114	21	32.8	73.3	11.1	0.121	76217	71719	500m.my8023.cy8
75792	0	0	0.0	398.0	27.1	0.000	0.000	0.005	0.366	8666	40.4	0.114	21	32.8	73.3	11.1	0.109	75648	71343	500m.my8026.cy8
76546	0	0	0.0	400.3	27.3	0.000	0.000	0.005	0.366	8895	40.6	0.116	21	32.8	73.3	11.1	0.112	76346	72220	500m.my8027.cy8
l.x
l.x: create secondary indexes
Performance metrics for all DBMS, not just the ones listed above. Some are normalized by throughput, others are not. Legend for results is here.
ips	qps	rps	rmbps	wps	wmbps	rpq	rkbpq	wpi	wkbpi	csps	cpups	cspq	cpupq	dbgb1	dbgb2	rss	maxop	p50	p99	tag
70091	0	425	63.1	739.3	85.0	0.006	0.922	0.011	1.241	2479	18.6	0.035	11	67.8	108.3	10.8	0.025	NA	NA	500m.my5649.cy8
117037	0	679	101.0	1184.8	128.9	0.006	0.884	0.010	1.127	7045	22.9	0.060	8	73.6	114.2	11.1	0.013	NA	NA	500m.my5735.cy8
113068	0	627	98.8	1228.8	124.2	0.006	0.895	0.011	1.125	7356	22.9	0.065	8	73.3	113.8	11.3	0.013	NA	NA	500m.my8020.cy8
108340	0	636	94.3	1185.3	119.2	0.006	0.891	0.011	1.127	6114	22.7	0.056	8	73.3	113.8	11.3	0.025	NA	NA	500m.my8022.cy8
107088	0	637	93.3	1186.3	117.9	0.006	0.893	0.011	1.127	6630	22.8	0.062	9	73.3	113.9	11.2	0.020	NA	NA	500m.my8023.cy8
109551	0	654	95.4	1204.6	120.2	0.006	0.892	0.011	1.123	6739	23.2	0.062	8	73.3	113.9	11.2	0.013	NA	NA	500m.my8026.cy8
109695	0	1631	143.7	2252.7	142.7	0.015	1.341	0.021	1.332	14790	67.6	0.135	25	73.3	113.9	11.2	0.016	NA	NA	500m.my8027.cy8
l.i1
l.i1: continue load after secondary indexes created
Performance metrics for all DBMS, not just the ones listed above. Some are normalized by throughput, others are not. Legend for results is here.
ips	qps	rps	rmbps	wps	wmbps	rpq	rkbpq	wpi	wkbpi	csps	cpups	cspq	cpupq	dbgb1	dbgb2	rss	maxop	p50	p99	tag
5023	0	2612	39.8	3595.2	131.4	0.520	8.109	0.716	26.800	14370	19.1	2.861	152	101.8	144.2	10.8	0.571	1348	499	500m.my5649.cy8
5701	0	2863	44.7	3984.6	143.4	0.502	8.034	0.699	25.748	17765	25.5	3.116	179	101.8	144.4	11.1	0.643	2397	150	500m.my5735.cy8
3834	0	1943	30.4	3404.0	99.3	0.507	8.108	0.888	26.524	22399	27.3	5.842	285	101.4	143.9	11.3	0.667	1099	100	500m.my8020.cy8
4310	0	2173	33.9	3838.2	112.0	0.504	8.065	0.890	26.613	18530	22.3	4.299	207	101.4	143.8	11.3	0.615	1350	100	500m.my8022.cy8
5277	0	2653	41.5	4650.5	135.9	0.503	8.045	0.881	26.379	20002	24.5	3.790	186	101.4	143.9	11.2	0.751	2347	100	500m.my8023.cy8
5643	0	2842	44.4	4937.5	144.6	0.504	8.057	0.875	26.234	21039	25.7	3.728	182	101.4	143.9	11.3	0.809	2747	100	500m.my8026.cy8
5423	0	2745	42.9	4690.0	137.5	0.506	8.099	0.865	25.972	20106	24.3	3.708	179	101.4	143.9	11.2	0.734	2098	100	500m.my8027.cy8
q100.1
q100.1: range queries with 100 insert/s per client
Performance metrics for all DBMS, not just the ones listed above. Some are normalized by throughput, others are not. Legend for results is here.
ips	qps	rps	rmbps	wps	wmbps	rpq	rkbpq	wpi	wkbpi	csps	cpups	cspq	cpupq	dbgb1	dbgb2	rss	maxop	p50	p99	tag
100	754	2941	45.9	393.3	12.0	3.901	62.376	3.941	123.357	9493	17.5	12.592	929	101.8	144.3	10.8	0.091	735	464	500m.my5649.cy8
100	763	2976	46.5	404.2	12.3	3.900	62.401	4.050	126.385	9843	18.2	12.897	954	101.8	144.4	11.1	0.105	751	543	500m.my5735.cy8
100	702	2744	42.9	471.3	11.8	3.909	62.537	4.718	120.715	11759	23.7	16.751	1350	101.5	143.9	11.3	0.096	687	480	500m.my8020.cy8
100	836	3248	50.7	510.7	12.8	3.882	62.119	5.118	131.032	10617	17.6	12.692	842	101.5	143.9	11.3	0.112	815	591	500m.my8022.cy8
100	863	3345	52.3	531.2	13.1	3.876	62.014	5.323	134.699	11225	17.5	13.006	811	101.5	144.0	11.3	0.088	847	607	500m.my8023.cy8
100	866	3362	52.5	535.0	13.2	3.880	62.085	5.361	135.669	11283	17.4	13.024	803	101.5	144.0	11.3	0.112	847	623	500m.my8026.cy8
100	854	3315	51.8	511.3	12.6	3.882	62.108	5.123	129.595	11086	17.4	12.979	815	101.5	144.0	11.2	0.118	831	591	500m.my8027.cy8
q500.1
q500.1: range queries with 500 insert/s per client
Performance metrics for all DBMS, not just the ones listed above. Some are normalized by throughput, others are not. Legend for results is here.
ips	qps	rps	rmbps	wps	wmbps	rpq	rkbpq	wpi	wkbpi	csps	cpups	cspq	cpupq	dbgb1	dbgb2	rss	maxop	p50	p99	tag
499	881	3423	53.4	404.9	12.6	3.887	62.063	0.811	25.916	11059	16.7	12.557	758	102.1	144.5	10.8	0.046	863	671	500m.my5649.cy8
499	885	3432	53.6	406.1	12.6	3.878	62.042	0.813	25.837	11299	17.5	12.767	791	102.1	144.7	11.1	0.046	863	639	500m.my5735.cy8
500	753	2931	45.8	461.6	11.8	3.893	62.287	0.924	24.094	13307	24.1	17.672	1280	101.7	144.1	11.3	0.041	735	607	500m.my8020.cy8
499	936	3630	56.7	513.8	13.1	3.876	62.016	1.029	26.777	11719	17.3	12.513	739	101.7	144.1	11.3	0.054	927	656	500m.my8022.cy8
499	953	3696	57.7	530.7	13.3	3.878	62.055	1.063	27.323	12284	17.3	12.891	726	101.7	144.2	11.3	0.044	943	687	500m.my8023.cy8
499	955	3705	57.9	536.0	13.5	3.881	62.089	1.073	27.587	12327	17.3	12.912	725	101.7	144.2	11.3	0.044	943	687	500m.my8026.cy8
499	951	3682	57.5	524.6	13.2	3.872	61.946	1.051	27.027	12233	17.3	12.863	728	101.7	144.2	11.2	0.050	928	687	500m.my8027.cy8
q1000.1
q1000.1: range queries with 1000 insert/s per client
Performance metrics for all DBMS, not just the ones listed above. Some are normalized by throughput, others are not. Legend for results is here.
ips	qps	rps	rmbps	wps	wmbps	rpq	rkbpq	wpi	wkbpi	csps	cpups	cspq	cpupq	dbgb1	dbgb2	rss	maxop	p50	p99	tag
999	878	3658	56.9	679.1	21.4	4.165	66.389	0.680	21.886	12273	17.5	13.972	797	102.5	145.3	10.8	0.233	863	655	500m.my5649.cy8
999	884	3646	57.0	677.6	21.2	4.122	65.953	0.678	21.686	12464	18.3	14.092	828	102.5	145.4	11.1	0.077	864	639	500m.my5735.cy8
999	739	3065	47.9	764.2	19.6	4.148	66.369	0.765	20.091	14496	25.1	19.616	1359	102.2	144.9	11.3	0.085	720	591	500m.my8020.cy8
999	922	3842	60.0	875.3	22.5	4.165	66.635	0.876	23.019	12812	18.2	13.889	789	102.2	145.0	11.3	0.078	911	656	500m.my8022.cy8
999	952	3909	61.1	848.5	21.6	4.108	65.731	0.850	22.175	13519	18.3	14.207	769	102.2	144.9	11.3	0.096	943	703	500m.my8023.cy8
999	946	3941	61.6	892.0	22.7	4.166	66.657	0.893	23.304	13654	18.4	14.433	778	102.2	145.1	11.3	0.090	943	687	500m.my8026.cy8
999	950	3891	60.8	839.0	21.4	4.096	65.538	0.840	21.949	13473	18.2	14.183	766	102.2	144.9	11.2	0.082	943	688	500m.my8027.cy8
l.i0
- l.i0: load without secondary indexes
- Legend for results is here.
- Each entry lists the percentage of responses that fit in that bucket (slower than max time for previous bucket, faster than min time for next bucket).
Insert response time histogram
256us	1ms	4ms	16ms	64ms	256ms	1s	4s	16s	gt	max	tag
0.000	96.865	2.750	0.300	0.082	0.001	0.003	0.000	0.000	0.000	0.361	my5649.cy8
0.000	98.390	1.347	0.257	0.002	0.004	0.000	0.000	0.000	0.000	0.117	my5735.cy8
0.000	0.000	99.566	0.400	0.034	nonzero	0.000	0.000	0.000	0.000	0.082	my8020.cy8
0.000	0.000	99.714	0.208	0.078	nonzero	0.000	0.000	0.000	0.000	0.078	my8022.cy8
0.000	0.000	99.721	0.203	0.076	nonzero	0.000	0.000	0.000	0.000	0.121	my8023.cy8
0.000	0.000	99.696	0.272	0.032	nonzero	0.000	0.000	0.000	0.000	0.109	my8026.cy8
0.000	0.000	99.699	0.270	0.031	nonzero	0.000	0.000	0.000	0.000	0.112	my8027.cy8
l.x
- l.x: create secondary indexes
- Legend for results is here.
- Each entry lists the percentage of responses that fit in that bucket (slower than max time for previous bucket, faster than min time for next bucket).
TODO - determine whether there is data for create index response time
l.i1
- l.i1: continue load after secondary indexes created
- Legend for results is here.
- Each entry lists the percentage of responses that fit in that bucket (slower than max time for previous bucket, faster than min time for next bucket).
Insert response time histogram
256us	1ms	4ms	16ms	64ms	256ms	1s	4s	16s	gt	max	tag
0.000	0.000	71.762	14.226	11.828	1.761	0.422	0.000	0.000	0.000	0.571	my5649.cy8
0.000	0.000	67.054	22.146	9.653	0.864	0.283	0.000	0.000	0.000	0.643	my5735.cy8
0.000	0.000	60.388	23.460	11.995	3.774	0.383	0.000	0.000	0.000	0.667	my8020.cy8
0.000	0.000	62.238	23.598	10.797	3.101	0.265	0.000	0.000	0.000	0.615	my8022.cy8
0.000	0.000	61.922	26.968	9.741	1.121	0.248	0.000	0.000	0.000	0.751	my8023.cy8
0.000	0.000	61.715	27.402	9.945	0.694	0.246	0.000	0.000	0.000	0.809	my8026.cy8
0.000	0.000	69.830	19.443	9.639	0.656	0.432	0.000	0.000	0.000	0.734	my8027.cy8
q100.1
- q100.1: range queries with 100 insert/s per client
- Legend for results is here.
- Each entry lists the percentage of responses that fit in that bucket (slower than max time for previous bucket, faster than min time for next bucket).
Query response time histogram
256us	1ms	4ms	16ms	64ms	256ms	1s	4s	16s	gt	max	tag
3.981	56.679	38.770	0.471	0.097	0.002	0.000	0.000	0.000	0.000	0.091	my5649.cy8
6.414	51.881	41.157	0.443	0.105	0.001	0.000	0.000	0.000	0.000	0.105	my5735.cy8
3.511	45.525	50.278	0.589	0.097	nonzero	0.000	0.000	0.000	0.000	0.096	my8020.cy8
8.791	47.752	42.991	0.379	0.086	nonzero	0.000	0.000	0.000	0.000	0.112	my8022.cy8
8.538	49.522	41.458	0.386	0.096	nonzero	0.000	0.000	0.000	0.000	0.088	my8023.cy8
7.901	50.468	41.166	0.371	0.094	0.001	0.000	0.000	0.000	0.000	0.112	my8026.cy8
7.996	49.300	42.214	0.400	0.090	nonzero	0.000	0.000	0.000	0.000	0.118	my8027.cy8
Insert response time histogram
256us	1ms	4ms	16ms	64ms	256ms	1s	4s	16s	gt	max	tag
0.000	0.000	0.257	42.333	56.528	0.882	0.000	0.000	0.000	0.000	0.111	my5649.cy8
0.000	0.000	0.354	52.493	47.104	0.049	0.000	0.000	0.000	0.000	0.094	my5735.cy8
0.000	0.000	0.076	43.188	56.736	0.000	0.000	0.000	0.000	0.000	0.064	my8020.cy8
0.000	0.000	0.368	56.785	42.847	0.000	0.000	0.000	0.000	0.000	0.061	my8022.cy8
0.000	0.000	0.361	63.458	36.076	0.104	0.000	0.000	0.000	0.000	0.097	my8023.cy8
0.000	0.000	0.264	65.014	34.632	0.090	0.000	0.000	0.000	0.000	0.078	my8026.cy8
0.000	0.000	0.375	74.007	25.611	0.007	0.000	0.000	0.000	0.000	0.074	my8027.cy8
q500.1
- q500.1: range queries with 500 insert/s per client
- Legend for results is here.
- Each entry lists the percentage of responses that fit in that bucket (slower than max time for previous bucket, faster than min time for next bucket).
Query response time histogram
256us	1ms	4ms	16ms	64ms	256ms	1s	4s	16s	gt	max	tag
9.104	50.423	40.093	0.289	0.091	0.000	0.000	0.000	0.000	0.000	0.046	my5649.cy8
16.537	41.557	41.545	0.260	0.101	0.000	0.000	0.000	0.000	0.000	0.046	my5735.cy8
8.145	40.338	51.131	0.272	0.114	0.000	0.000	0.000	0.000	0.000	0.041	my8020.cy8
17.780	38.609	43.280	0.238	0.093	0.000	0.000	0.000	0.000	0.000	0.054	my8022.cy8
15.651	41.619	42.363	0.273	0.095	0.000	0.000	0.000	0.000	0.000	0.044	my8023.cy8
14.441	43.019	42.183	0.260	0.097	0.000	0.000	0.000	0.000	0.000	0.044	my8026.cy8
14.610	42.812	42.224	0.257	0.097	0.000	0.000	0.000	0.000	0.000	0.050	my8027.cy8
Insert response time histogram
256us	1ms	4ms	16ms	64ms	256ms	1s	4s	16s	gt	max	tag
0.000	0.000	54.825	40.603	4.572	0.000	0.000	0.000	0.000	0.000	0.064	my5649.cy8
0.000	0.000	57.632	41.926	0.442	0.000	0.000	0.000	0.000	0.000	0.053	my5735.cy8
0.000	0.000	22.271	76.921	0.807	0.001	0.000	0.000	0.000	0.000	0.068	my8020.cy8
0.000	0.000	43.019	56.354	0.625	0.001	0.000	0.000	0.000	0.000	0.070	my8022.cy8
0.000	0.000	41.839	57.510	0.650	0.001	0.000	0.000	0.000	0.000	0.066	my8023.cy8
0.000	0.000	38.638	60.731	0.631	0.001	0.000	0.000	0.000	0.000	0.067	my8026.cy8
0.000	0.000	46.972	52.515	0.513	0.000	0.000	0.000	0.000	0.000	0.057	my8027.cy8
q1000.1
- q1000.1: range queries with 1000 insert/s per client
- Legend for results is here.
- Each entry lists the percentage of responses that fit in that bucket (slower than max time for previous bucket, faster than min time for next bucket).
Query response time histogram
256us	1ms	4ms	16ms	64ms	256ms	1s	4s	16s	gt	max	tag
10.695	46.290	42.572	0.303	0.140	nonzero	0.000	0.000	0.000	0.000	0.233	my5649.cy8
19.955	36.039	43.544	0.324	0.138	nonzero	0.000	0.000	0.000	0.000	0.077	my5735.cy8
10.071	36.134	53.192	0.446	0.157	nonzero	0.000	0.000	0.000	0.000	0.085	my8020.cy8
19.295	35.171	45.107	0.307	0.120	nonzero	0.000	0.000	0.000	0.000	0.078	my8022.cy8
18.239	37.215	44.132	0.295	0.118	nonzero	0.000	0.000	0.000	0.000	0.096	my8023.cy8
16.835	38.434	44.304	0.301	0.126	nonzero	0.000	0.000	0.000	0.000	0.090	my8026.cy8
17.076	38.409	44.084	0.309	0.122	nonzero	0.000	0.000	0.000	0.000	0.082	my8027.cy8
Insert response time histogram
256us	1ms	4ms	16ms	64ms	256ms	1s	4s	16s	gt	max	tag
0.000	0.000	60.691	33.989	5.315	0.006	0.000	0.000	0.000	0.000	0.170	my5649.cy8
0.000	0.000	66.779	32.381	0.836	0.003	0.000	0.000	0.000	0.000	0.151	my5735.cy8
0.000	0.000	45.181	53.933	0.881	0.005	0.000	0.000	0.000	0.000	0.181	my8020.cy8
0.000	0.000	51.873	47.352	0.770	0.005	0.000	0.000	0.000	0.000	0.182	my8022.cy8
0.000	0.000	55.902	43.398	0.696	0.004	0.000	0.000	0.000	0.000	0.170	my8023.cy8
0.000	0.000	47.568	51.480	0.945	0.007	0.000	0.000	0.000	0.000	0.159	my8026.cy8
0.000	0.000	63.088	36.320	0.588	0.003	0.000	0.000	0.000	0.000	0.170	my8027.cy8