Introduction
This is a report for the insert benchmark with 500M docs and 1 client(s). It is generated by scripts (bash, awk, sed) and Tufte might not be impressed. An overview of the insert benchmark is here and a short update is here. Below, by DBMS, I mean DBMS+version.config. An example is my8020.c10b40 where my means MySQL, 8020 is version 8.0.20 and c10b40 is the name for the configuration file.
The test server is an Intel NUC with 4 cores, 16G RAM and a Samsung 970 EVO. More details are here. Clients and the DBMS share one server. The per-database configs are in the per-database subdirectories here.
The tested DBMS are:
- fbmy5635.cy9c - FB MySQL 5.6.35, MyRocks and the cy9c config
- fbmy8020.cy9c - FB MySQL 8.0.20, MyRocks and the cy9c config
- fbmy5635.cy9a - FB MySQL 5.6.35, MyRocks and the cy9a config
- fbmy5635.cy9b - FB MySQL 5.6.35, MyRocks and the cy9b config
- fbmy5635.cy9c0 - FB MySQL 5.6.35, MyRocks and the cy9c0 config
- fbmy5635.cy9c1 - FB MySQL 5.6.35, MyRocks and the cy9c1 config
- fbmy5635.cy9c2 - FB MySQL 5.6.35, MyRocks and the cy9c2 config
- fbmy5635.cy13a - FB MySQL 5.6.35, MyRocks and the cy13a config
- fbmy5635.cy13b - FB MySQL 5.6.35, MyRocks and the cy13b config
Contents
- Summary
- l.i0: load without secondary indexes
- l.x: create secondary indexes
- l.i1: continue load after secondary indexes created
- q100.1: range queries with 100 insert/s per client
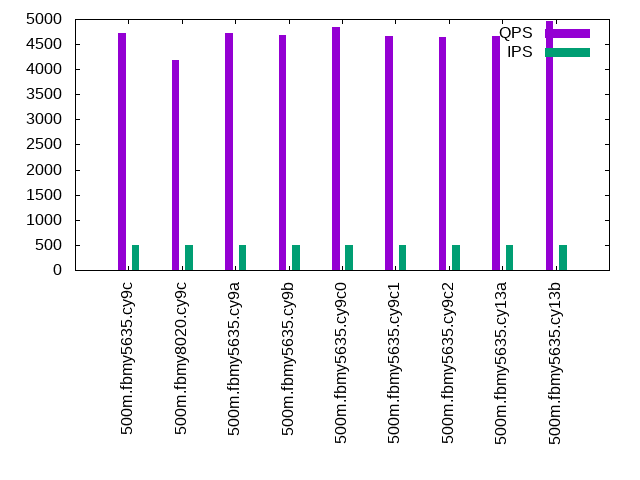
- q500.1: range queries with 500 insert/s per client
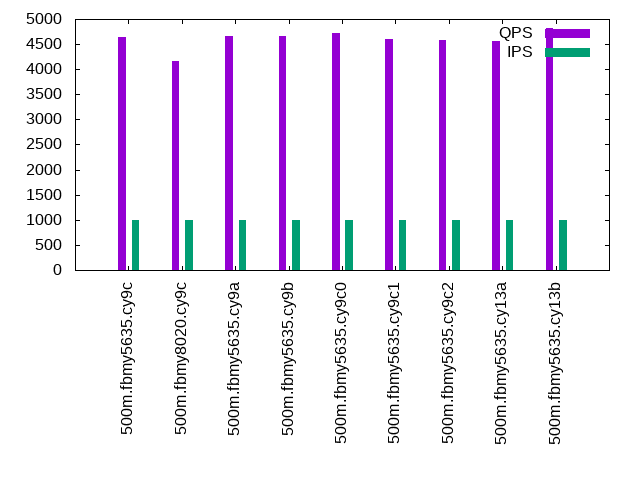
- q1000.1: range queries with 1000 insert/s per client
Summary
The numbers are inserts/s for l.i0 and l.i1, indexed docs (or rows) /s for l.x and queries/s for q*.2. The values are the average rate over the entire test for inserts (IPS) and queries (QPS). The range of values for IPS and QPS is split into 3 parts: bottom 25%, middle 50%, top 25%. Values in the bottom 25% have a red background, values in the top 25% have a green background and values in the middle have no color. A gray background is used for values that can be ignored because the DBMS did not sustain the target insert rate. Red backgrounds are not used when the minimum value is within 80% of the max value.
| dbms | l.i0 | l.x | l.i1 | q100.1 | q500.1 | q1000.1 |
|---|---|---|---|---|---|---|
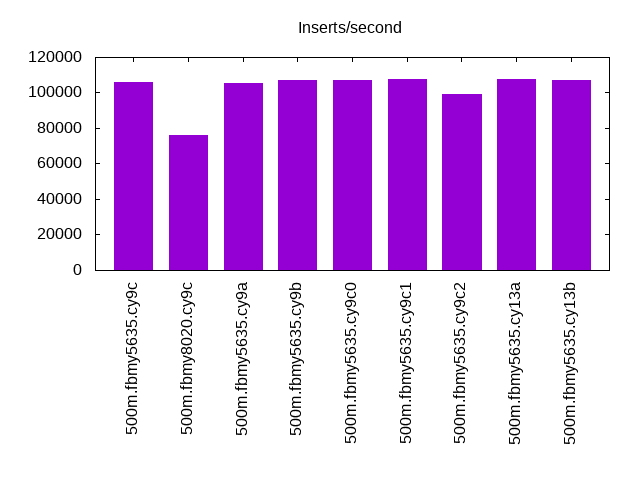
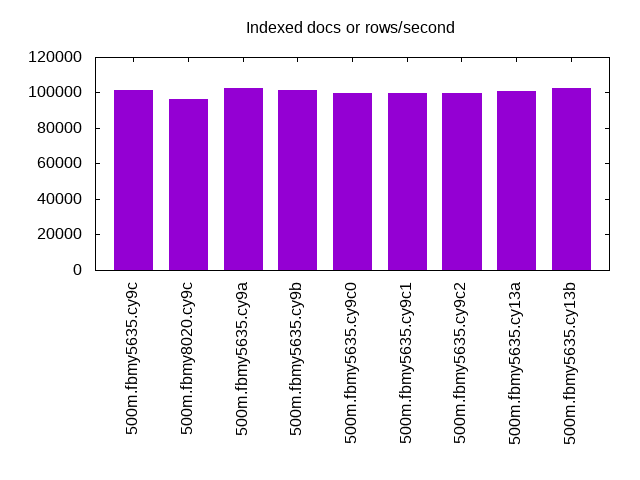
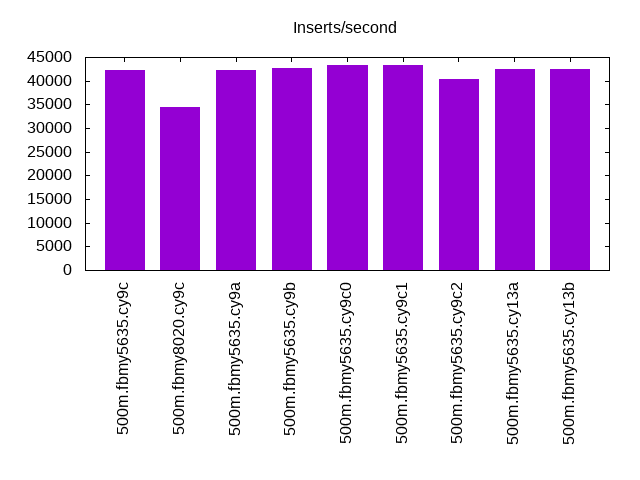
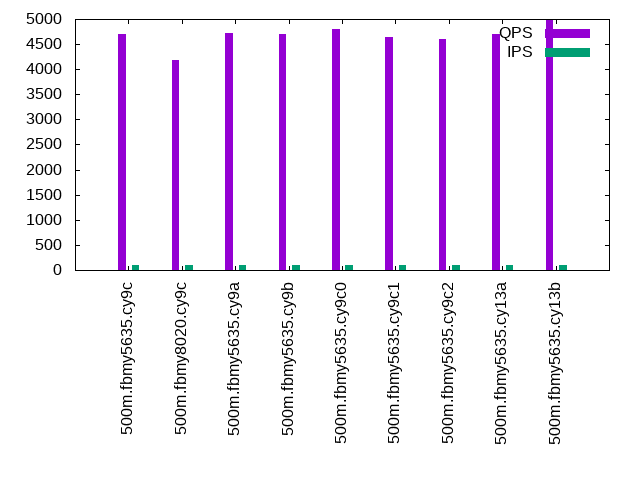
| 500m.fbmy5635.cy9c | 105820 | 101605 | 42194 | 4699 | 4724 | 4648 |
| 500m.fbmy8020.cy9c | 75930 | 96099 | 34483 | 4181 | 4193 | 4158 |
| 500m.fbmy5635.cy9a | 105374 | 102522 | 42194 | 4726 | 4712 | 4667 |
| 500m.fbmy5635.cy9b | 107319 | 101214 | 42735 | 4709 | 4683 | 4670 |
| 500m.fbmy5635.cy9c0 | 106838 | 99920 | 43290 | 4792 | 4832 | 4728 |
| 500m.fbmy5635.cy9c1 | 107643 | 99661 | 43290 | 4642 | 4653 | 4602 |
| 500m.fbmy5635.cy9c2 | 99423 | 99900 | 40322 | 4596 | 4646 | 4591 |
| 500m.fbmy5635.cy13a | 107643 | 101051 | 42553 | 4698 | 4666 | 4562 |
| 500m.fbmy5635.cy13b | 106838 | 102291 | 42373 | 4993 | 4959 | 4820 |
This lists the average rate of inserts/s for the tests that do inserts concurrent with queries. For such tests the query rate is listed in the table above. The read+write tests are setup so that the insert rate should match the target rate every second. Cells that are not at least 95% of the target have a red background to indicate a failure to satisfy the target.
| dbms | q100.1 | q500.1 | q1000.1 |
|---|---|---|---|
| fbmy5635.cy9c | 100 | 500 | 999 |
| fbmy8020.cy9c | 100 | 499 | 999 |
| fbmy5635.cy9a | 100 | 500 | 999 |
| fbmy5635.cy9b | 100 | 499 | 999 |
| fbmy5635.cy9c0 | 100 | 500 | 999 |
| fbmy5635.cy9c1 | 100 | 500 | 999 |
| fbmy5635.cy9c2 | 100 | 500 | 999 |
| fbmy5635.cy13a | 100 | 500 | 999 |
| fbmy5635.cy13b | 100 | 499 | 999 |
| target | 100 | 500 | 1000 |
l.i0
l.i0: load without secondary indexes. Graphs for performance per 1-second interval are here.
Average throughput:
Insert response time histogram: each cell has the percentage of responses that take <= the time in the header and max is the max response time in seconds. For the max column values in the top 25% of the range have a red background and in the bottom 25% of the range have a green background. The red background is not used when the min value is within 80% of the max value.
| dbms | 256us | 1ms | 4ms | 16ms | 64ms | 256ms | 1s | 4s | 16s | gt | max |
|---|---|---|---|---|---|---|---|---|---|---|---|
| fbmy5635.cy9c | 98.015 | 1.933 | 0.049 | nonzero | 0.004 | 0.198 | |||||
| fbmy8020.cy9c | 99.826 | 0.157 | 0.017 | nonzero | 0.066 | ||||||
| fbmy5635.cy9a | 97.637 | 2.312 | 0.047 | nonzero | 0.004 | 0.183 | |||||
| fbmy5635.cy9b | 98.343 | 1.602 | 0.051 | nonzero | 0.004 | 0.132 | |||||
| fbmy5635.cy9c0 | 98.283 | 1.663 | 0.051 | nonzero | 0.004 | 0.165 | |||||
| fbmy5635.cy9c1 | 98.523 | 1.425 | 0.048 | nonzero | 0.004 | 0.175 | |||||
| fbmy5635.cy9c2 | 81.785 | 18.157 | 0.054 | nonzero | 0.004 | 0.129 | |||||
| fbmy5635.cy13a | 98.752 | 1.196 | 0.048 | nonzero | 0.004 | 0.148 | |||||
| fbmy5635.cy13b | 98.045 | 1.902 | 0.050 | 0.003 | 0.001 | 0.112 |
Performance metrics for the DBMS listed above. Some are normalized by throughput, others are not. Legend for results is here.
ips	qps	rps	rmbps	wps	wmbps	rpq	rkbpq	wpi	wkbpi	csps	cpups	cspq	cpupq	dbgb1	dbgb2	rss	maxop	p50	p99	tag
105820	0	0	0.0	55.4	19.0	0.000	0.000	0.001	0.184	10969	47.6	0.104	18	15.7	16.1	1.1	0.198	106422	93534	500m.fbmy5635.cy9c
75930	0	0	0.0	58.7	17.5	0.000	0.000	0.001	0.235	8228	42.7	0.108	22	15.7	16.3	1.5	0.066	76119	70752	500m.fbmy8020.cy9c
105374	0	0	0.0	56.0	18.9	0.000	0.000	0.001	0.184	10930	46.9	0.104	18	15.7	16.1	1.1	0.183	105924	93497	500m.fbmy5635.cy9a
107319	0	0	0.0	56.0	19.3	0.000	0.000	0.001	0.184	11110	47.7	0.104	18	15.7	16.1	1.1	0.132	108013	95295	500m.fbmy5635.cy9b
106838	0	0	0.0	56.3	19.2	0.000	0.000	0.001	0.184	11059	47.3	0.104	18	15.7	16.1	1.1	0.165	107424	94897	500m.fbmy5635.cy9c0
107643	0	0	0.0	56.1	19.3	0.000	0.000	0.001	0.184	11139	47.7	0.103	18	15.7	16.1	1.1	0.175	108282	95294	500m.fbmy5635.cy9c1
99423	0	0	0.0	52.3	17.9	0.000	0.000	0.001	0.184	10316	46.4	0.104	19	15.7	16.1	1.1	0.129	99990	88106	500m.fbmy5635.cy9c2
107643	0	12	5.2	55.9	19.3	0.000	0.050	0.001	0.184	10880	47.9	0.101	18	15.7	16.1	1.1	0.148	108281	95198	500m.fbmy5635.cy13a
106838	0	0	0.0	53.1	19.0	0.000	0.000	0.000	0.182	10625	47.2	0.099	18	16.4	28.7	13.0	0.112	107283	95496	500m.fbmy5635.cy13b
l.x
l.x: create secondary indexes.
Average throughput:
Performance metrics for the DBMS listed above. Some are normalized by throughput, others are not. Legend for results is here.
ips	qps	rps	rmbps	wps	wmbps	rpq	rkbpq	wpi	wkbpi	csps	cpups	cspq	cpupq	dbgb1	dbgb2	rss	maxop	p50	p99	tag
101605	0	67	21.6	38.7	14.9	0.001	0.218	0.000	0.150	687	24.8	0.007	10	32.3	32.7	10.7	0.008	NA	NA	500m.fbmy5635.cy9c
96099	0	71	23.7	36.6	14.1	0.001	0.252	0.000	0.150	829	24.9	0.009	10	32.2	32.8	12.9	0.008	NA	NA	500m.fbmy8020.cy9c
102522	0	69	21.8	39.4	15.1	0.001	0.218	0.000	0.150	729	24.8	0.007	10	32.3	32.7	10.7	0.009	NA	NA	500m.fbmy5635.cy9a
101214	0	68	21.5	38.2	14.9	0.001	0.218	0.000	0.150	728	24.8	0.007	10	32.3	32.7	10.8	0.010	NA	NA	500m.fbmy5635.cy9b
99920	0	66	21.2	36.9	14.7	0.001	0.218	0.000	0.150	717	24.8	0.007	10	32.3	32.7	10.7	0.008	NA	NA	500m.fbmy5635.cy9c0
99661	0	66	21.2	38.0	14.6	0.001	0.218	0.000	0.150	672	24.8	0.007	10	32.3	32.7	10.7	0.005	NA	NA	500m.fbmy5635.cy9c1
99900	0	66	21.2	37.4	14.7	0.001	0.218	0.000	0.150	715	24.8	0.007	10	32.3	32.7	10.7	0.007	NA	NA	500m.fbmy5635.cy9c2
101051	0	58	21.5	23.7	14.8	0.001	0.218	0.000	0.150	730	24.4	0.007	10	32.3	32.7	11.7	0.009	NA	NA	500m.fbmy5635.cy13a
102291	0	77	25.7	50.1	15.0	0.001	0.258	0.000	0.150	534	24.6	0.005	10	32.8	45.1	12.9	0.004	NA	NA	500m.fbmy5635.cy13b
l.i1
l.i1: continue load after secondary indexes created. Graphs for performance per 1-second interval are here.
Average throughput:
Insert response time histogram: each cell has the percentage of responses that take <= the time in the header and max is the max response time in seconds. For the max column values in the top 25% of the range have a red background and in the bottom 25% of the range have a green background. The red background is not used when the min value is within 80% of the max value.
| dbms | 256us | 1ms | 4ms | 16ms | 64ms | 256ms | 1s | 4s | 16s | gt | max |
|---|---|---|---|---|---|---|---|---|---|---|---|
| fbmy5635.cy9c | 6.562 | 93.314 | 0.116 | 0.007 | 0.001 | 0.084 | |||||
| fbmy8020.cy9c | 99.825 | 0.163 | 0.011 | 0.001 | 0.121 | ||||||
| fbmy5635.cy9a | 7.111 | 92.769 | 0.112 | 0.009 | 0.001 | 0.069 | |||||
| fbmy5635.cy9b | 7.635 | 92.221 | 0.138 | 0.006 | 0.001 | 0.081 | |||||
| fbmy5635.cy9c0 | 8.713 | 91.179 | 0.103 | 0.005 | 0.051 | ||||||
| fbmy5635.cy9c1 | 8.153 | 91.748 | 0.092 | 0.005 | 0.001 | 0.067 | |||||
| fbmy5635.cy9c2 | 0.776 | 99.124 | 0.096 | 0.003 | 0.051 | ||||||
| fbmy5635.cy13a | 7.271 | 92.593 | 0.092 | 0.042 | 0.002 | 0.155 | |||||
| fbmy5635.cy13b | 4.805 | 95.112 | 0.073 | 0.009 | 0.001 | 0.071 |
Performance metrics for the DBMS listed above. Some are normalized by throughput, others are not. Legend for results is here.
ips	qps	rps	rmbps	wps	wmbps	rpq	rkbpq	wpi	wkbpi	csps	cpups	cspq	cpupq	dbgb1	dbgb2	rss	maxop	p50	p99	tag
42194	0	26	3.1	171.5	75.2	0.001	0.075	0.004	1.825	10433	57.4	0.247	54	33.6	35.3	10.6	0.084	42353	33264	500m.fbmy5635.cy9c
34483	0	0	0.0	170.0	61.4	0.000	0.000	0.005	1.823	9089	54.5	0.264	63	33.5	35.3	10.9	0.121	34425	30428	500m.fbmy8020.cy9c
42194	0	24	2.9	170.8	74.8	0.001	0.071	0.004	1.815	10452	57.1	0.248	54	33.5	35.2	10.6	0.069	42403	35775	500m.fbmy5635.cy9a
42735	0	24	3.0	170.9	75.0	0.001	0.071	0.004	1.796	10710	57.5	0.251	54	33.5	35.2	10.6	0.081	42869	35325	500m.fbmy5635.cy9b
43290	0	40	4.4	129.8	55.4	0.001	0.104	0.003	1.310	10187	51.1	0.235	47	34.0	35.7	10.6	0.051	43753	36260	500m.fbmy5635.cy9c0
43290	0	1	0.1	105.8	43.7	0.000	0.002	0.002	1.034	9671	46.7	0.223	43	33.5	35.1	10.6	0.067	43554	35411	500m.fbmy5635.cy9c1
40322	0	1	0.1	93.7	38.5	0.000	0.002	0.002	0.978	8993	44.7	0.223	44	33.5	35.1	10.6	0.051	40455	33213	500m.fbmy5635.cy9c2
42553	0	121	58.9	168.6	74.4	0.003	1.417	0.004	1.791	8541	56.5	0.201	53	33.5	35.2	11.7	0.155	42804	34523	500m.fbmy5635.cy13a
42373	0	32	11.2	112.8	37.2	0.001	0.270	0.003	0.899	8388	44.3	0.198	42	33.8	47.3	13.1	0.071	42003	38258	500m.fbmy5635.cy13b
q100.1
q100.1: range queries with 100 insert/s per client. Graphs for performance per 1-second interval are here.
Average throughput:
Query response time histogram: each cell has the percentage of responses that take <= the time in the header and max is the max response time in seconds. For max values in the top 25% of the range have a red background and in the bottom 25% of the range have a green background. The red background is not used when the min value is within 80% of the max value.
| dbms | 256us | 1ms | 4ms | 16ms | 64ms | 256ms | 1s | 4s | 16s | gt | max |
|---|---|---|---|---|---|---|---|---|---|---|---|
| fbmy5635.cy9c | 97.813 | 2.184 | 0.002 | nonzero | 0.015 | ||||||
| fbmy8020.cy9c | 95.955 | 4.042 | 0.003 | nonzero | nonzero | 0.016 | |||||
| fbmy5635.cy9a | 97.768 | 2.229 | 0.003 | nonzero | 0.015 | ||||||
| fbmy5635.cy9b | 97.774 | 2.222 | 0.004 | nonzero | 0.015 | ||||||
| fbmy5635.cy9c0 | 97.654 | 2.344 | 0.002 | nonzero | nonzero | 0.017 | |||||
| fbmy5635.cy9c1 | 97.646 | 2.351 | 0.003 | nonzero | nonzero | 0.019 | |||||
| fbmy5635.cy9c2 | 97.864 | 2.134 | 0.002 | nonzero | nonzero | 0.016 | |||||
| fbmy5635.cy13a | 97.529 | 2.457 | 0.013 | 0.001 | 0.016 | ||||||
| fbmy5635.cy13b | 97.611 | 2.382 | 0.007 | nonzero | nonzero | 0.021 |
Insert response time histogram: each cell has the percentage of responses that take <= the time in the header and max is the max response time in seconds. For max values in the top 25% of the range have a red background and in the bottom 25% of the range have a green background. The red background is not used when the min value is within 80% of the max value.
| dbms | 256us | 1ms | 4ms | 16ms | 64ms | 256ms | 1s | 4s | 16s | gt | max |
|---|---|---|---|---|---|---|---|---|---|---|---|
| fbmy5635.cy9c | 0.139 | 99.792 | 0.069 | 0.013 | |||||||
| fbmy8020.cy9c | 99.882 | 0.097 | 0.021 | 0.019 | |||||||
| fbmy5635.cy9a | 0.076 | 99.903 | 0.021 | 0.004 | |||||||
| fbmy5635.cy9b | 0.681 | 99.271 | 0.049 | 0.004 | |||||||
| fbmy5635.cy9c0 | 1.007 | 98.979 | 0.007 | 0.007 | 0.016 | ||||||
| fbmy5635.cy9c1 | 1.007 | 98.958 | 0.035 | 0.010 | |||||||
| fbmy5635.cy9c2 | 99.931 | 0.069 | 0.005 | ||||||||
| fbmy5635.cy13a | 0.535 | 99.396 | 0.069 | 0.009 | |||||||
| fbmy5635.cy13b | 0.194 | 99.799 | 0.007 | 0.015 |
Performance metrics for the DBMS listed above. Some are normalized by throughput, others are not. Legend for results is here.
ips	qps	rps	rmbps	wps	wmbps	rpq	rkbpq	wpi	wkbpi	csps	cpups	cspq	cpupq	dbgb1	dbgb2	rss	maxop	p50	p99	tag
100	4699	22	0.2	4.1	0.4	0.005	0.038	0.041	3.829	18126	25.9	3.858	220	33.5	35.3	10.6	0.015	4715	4171	500m.fbmy5635.cy9c
100	4181	22	0.2	3.7	0.3	0.005	0.043	0.037	2.658	16286	25.9	3.895	248	33.5	35.5	10.9	0.016	4187	3740	500m.fbmy8020.cy9c
100	4726	22	0.2	3.7	0.2	0.005	0.040	0.037	2.405	18225	26.0	3.856	220	33.5	35.3	10.6	0.015	4733	4219	500m.fbmy5635.cy9a
100	4709	22	0.2	3.7	0.2	0.005	0.040	0.038	2.513	18163	25.9	3.857	220	33.5	35.3	10.6	0.015	4717	4139	500m.fbmy5635.cy9b
100	4792	22	0.2	4.0	0.4	0.005	0.038	0.041	3.652	18484	25.9	3.857	216	33.5	35.3	10.6	0.017	4779	4123	500m.fbmy5635.cy9c0
100	4642	22	0.2	3.7	0.2	0.005	0.039	0.037	2.144	17912	25.8	3.859	222	33.5	35.3	10.6	0.019	4621	4011	500m.fbmy5635.cy9c1
100	4596	22	0.2	3.7	0.2	0.005	0.039	0.037	2.291	17725	25.8	3.857	225	33.5	35.3	10.6	0.016	4603	3902	500m.fbmy5635.cy9c2
100	4698	43	0.5	3.8	0.3	0.009	0.105	0.038	3.269	18149	25.9	3.863	221	33.5	35.3	11.6	0.016	4731	3868	500m.fbmy5635.cy13a
100	4993	35	0.3	3.6	0.2	0.007	0.064	0.036	2.045	19259	26.1	3.857	209	33.9	47.5	12.9	0.021	5021	4043	500m.fbmy5635.cy13b
q500.1
q500.1: range queries with 500 insert/s per client. Graphs for performance per 1-second interval are here.
Average throughput:
Query response time histogram: each cell has the percentage of responses that take <= the time in the header and max is the max response time in seconds. For max values in the top 25% of the range have a red background and in the bottom 25% of the range have a green background. The red background is not used when the min value is within 80% of the max value.
| dbms | 256us | 1ms | 4ms | 16ms | 64ms | 256ms | 1s | 4s | 16s | gt | max |
|---|---|---|---|---|---|---|---|---|---|---|---|
| fbmy5635.cy9c | 97.805 | 2.194 | 0.001 | nonzero | 0.011 | ||||||
| fbmy8020.cy9c | 95.896 | 4.101 | 0.003 | nonzero | 0.010 | ||||||
| fbmy5635.cy9a | 97.802 | 2.197 | 0.001 | nonzero | 0.009 | ||||||
| fbmy5635.cy9b | 97.727 | 2.272 | 0.001 | nonzero | 0.009 | ||||||
| fbmy5635.cy9c0 | 97.930 | 2.068 | 0.001 | nonzero | nonzero | 0.020 | |||||
| fbmy5635.cy9c1 | 97.707 | 2.292 | 0.001 | nonzero | 0.013 | ||||||
| fbmy5635.cy9c2 | 97.816 | 2.182 | 0.001 | nonzero | 0.013 | ||||||
| fbmy5635.cy13a | 96.743 | 3.250 | 0.006 | 0.001 | nonzero | 0.016 | |||||
| fbmy5635.cy13b | 97.700 | 2.296 | 0.004 | nonzero | nonzero | 0.019 |
Insert response time histogram: each cell has the percentage of responses that take <= the time in the header and max is the max response time in seconds. For max values in the top 25% of the range have a red background and in the bottom 25% of the range have a green background. The red background is not used when the min value is within 80% of the max value.
| dbms | 256us | 1ms | 4ms | 16ms | 64ms | 256ms | 1s | 4s | 16s | gt | max |
|---|---|---|---|---|---|---|---|---|---|---|---|
| fbmy5635.cy9c | 0.331 | 99.633 | 0.035 | 0.001 | 0.048 | ||||||
| fbmy8020.cy9c | 99.904 | 0.079 | 0.017 | 0.029 | |||||||
| fbmy5635.cy9a | 0.643 | 99.321 | 0.035 | 0.001 | 0.033 | ||||||
| fbmy5635.cy9b | 2.860 | 97.119 | 0.019 | 0.001 | 0.022 | ||||||
| fbmy5635.cy9c0 | 3.378 | 96.600 | 0.018 | 0.004 | 0.053 | ||||||
| fbmy5635.cy9c1 | 1.722 | 98.253 | 0.024 | 0.001 | 0.033 | ||||||
| fbmy5635.cy9c2 | 0.129 | 99.833 | 0.036 | 0.001 | 0.022 | ||||||
| fbmy5635.cy13a | 1.471 | 98.474 | 0.054 | 0.001 | 0.028 | ||||||
| fbmy5635.cy13b | 0.439 | 99.528 | 0.031 | 0.003 | 0.023 |
Performance metrics for the DBMS listed above. Some are normalized by throughput, others are not. Legend for results is here.
ips	qps	rps	rmbps	wps	wmbps	rpq	rkbpq	wpi	wkbpi	csps	cpups	cspq	cpupq	dbgb1	dbgb2	rss	maxop	p50	p99	tag
500	4724	0	0.0	5.8	1.1	0.000	0.000	0.012	2.210	18269	26.6	3.867	225	34.0	34.2	10.6	0.011	4731	4539	500m.fbmy5635.cy9c
499	4193	0	0.0	6.2	1.2	0.000	0.000	0.012	2.452	16392	26.8	3.910	256	34.0	34.4	10.9	0.010	4187	4075	500m.fbmy8020.cy9c
500	4712	0	0.0	6.3	1.2	0.000	0.000	0.013	2.517	18229	26.7	3.869	227	34.0	34.2	10.6	0.009	4715	4523	500m.fbmy5635.cy9a
499	4683	0	0.0	5.7	1.1	0.000	0.000	0.011	2.278	18126	26.6	3.870	227	34.0	34.2	10.6	0.009	4683	4491	500m.fbmy5635.cy9b
500	4832	0	0.0	5.6	1.0	0.000	0.000	0.011	2.115	18678	26.5	3.865	219	33.9	34.2	10.6	0.020	4843	4571	500m.fbmy5635.cy9c0
500	4653	0	0.0	4.6	0.6	0.000	0.000	0.009	1.258	17975	26.3	3.863	226	33.9	34.2	10.6	0.013	4667	4379	500m.fbmy5635.cy9c1
500	4646	0	0.0	4.5	0.6	0.000	0.000	0.009	1.172	17941	26.3	3.862	226	34.0	34.2	10.6	0.013	4667	4379	500m.fbmy5635.cy9c2
500	4666	53	1.1	5.7	1.1	0.011	0.241	0.011	2.318	18100	26.4	3.880	226	34.0	34.2	11.6	0.016	4684	3853	500m.fbmy5635.cy13a
499	4959	23	0.3	4.3	0.5	0.005	0.067	0.009	1.017	19163	26.4	3.865	213	34.3	48.4	12.9	0.019	4970	4635	500m.fbmy5635.cy13b
q1000.1
q1000.1: range queries with 1000 insert/s per client. Graphs for performance per 1-second interval are here.
Average throughput:
Query response time histogram: each cell has the percentage of responses that take <= the time in the header and max is the max response time in seconds. For max values in the top 25% of the range have a red background and in the bottom 25% of the range have a green background. The red background is not used when the min value is within 80% of the max value.
| dbms | 256us | 1ms | 4ms | 16ms | 64ms | 256ms | 1s | 4s | 16s | gt | max |
|---|---|---|---|---|---|---|---|---|---|---|---|
| fbmy5635.cy9c | 97.154 | 2.843 | 0.003 | nonzero | 0.012 | ||||||
| fbmy8020.cy9c | 94.069 | 5.921 | 0.010 | nonzero | 0.010 | ||||||
| fbmy5635.cy9a | 97.165 | 2.832 | 0.003 | nonzero | 0.009 | ||||||
| fbmy5635.cy9b | 97.272 | 2.725 | 0.003 | nonzero | 0.016 | ||||||
| fbmy5635.cy9c0 | 97.039 | 2.956 | 0.005 | nonzero | nonzero | 0.018 | |||||
| fbmy5635.cy9c1 | 97.076 | 2.920 | 0.003 | nonzero | 0.008 | ||||||
| fbmy5635.cy9c2 | 97.090 | 2.907 | 0.003 | nonzero | 0.007 | ||||||
| fbmy5635.cy13a | 94.211 | 5.771 | 0.017 | 0.002 | nonzero | 0.017 | |||||
| fbmy5635.cy13b | 96.428 | 3.562 | 0.010 | 0.001 | nonzero | 0.019 |
Insert response time histogram: each cell has the percentage of responses that take <= the time in the header and max is the max response time in seconds. For max values in the top 25% of the range have a red background and in the bottom 25% of the range have a green background. The red background is not used when the min value is within 80% of the max value.
| dbms | 256us | 1ms | 4ms | 16ms | 64ms | 256ms | 1s | 4s | 16s | gt | max |
|---|---|---|---|---|---|---|---|---|---|---|---|
| fbmy5635.cy9c | 0.639 | 99.318 | 0.042 | 0.001 | 0.034 | ||||||
| fbmy8020.cy9c | 99.887 | 0.092 | 0.021 | 0.042 | |||||||
| fbmy5635.cy9a | 0.897 | 99.045 | 0.056 | 0.002 | 0.034 | ||||||
| fbmy5635.cy9b | 1.949 | 98.019 | 0.030 | 0.001 | 0.033 | ||||||
| fbmy5635.cy9c0 | 1.422 | 98.534 | 0.042 | 0.001 | 0.037 | ||||||
| fbmy5635.cy9c1 | 0.811 | 99.149 | 0.037 | 0.002 | 0.039 | ||||||
| fbmy5635.cy9c2 | 0.028 | 99.929 | 0.042 | 0.001 | 0.051 | ||||||
| fbmy5635.cy13a | 0.885 | 99.078 | 0.035 | 0.001 | 0.023 | ||||||
| fbmy5635.cy13b | 0.452 | 99.500 | 0.047 | 0.001 | 0.020 |
Performance metrics for the DBMS listed above. Some are normalized by throughput, others are not. Legend for results is here.
ips	qps	rps	rmbps	wps	wmbps	rpq	rkbpq	wpi	wkbpi	csps	cpups	cspq	cpupq	dbgb1	dbgb2	rss	maxop	p50	p99	tag
999	4648	1	0.1	8.6	2.6	0.000	0.022	0.009	2.614	18123	27.5	3.899	237	34.5	35.7	10.6	0.012	4653	4411	500m.fbmy5635.cy9c
999	4158	1	0.1	8.7	2.5	0.000	0.023	0.009	2.530	16405	27.6	3.945	265	34.6	35.9	10.9	0.010	4157	3981	500m.fbmy8020.cy9c
999	4667	1	0.1	8.7	2.5	0.000	0.020	0.009	2.548	18193	27.5	3.898	236	34.6	35.7	10.7	0.009	4683	4411	500m.fbmy5635.cy9a
999	4670	1	0.1	9.0	2.5	0.000	0.022	0.009	2.597	18213	27.5	3.900	236	34.6	35.7	10.6	0.016	4683	4443	500m.fbmy5635.cy9b
999	4728	15	1.5	11.4	3.5	0.003	0.332	0.011	3.619	18474	29.1	3.907	246	34.4	35.6	10.6	0.018	4717	4429	500m.fbmy5635.cy9c0
999	4602	1	0.1	6.5	1.4	0.000	0.021	0.006	1.404	17898	27.0	3.889	235	34.8	35.9	10.7	0.008	4603	4317	500m.fbmy5635.cy9c1
999	4591	1	0.1	6.2	1.3	0.000	0.027	0.006	1.327	17849	27.0	3.888	235	34.5	35.6	10.7	0.007	4587	4317	500m.fbmy5635.cy9c2
999	4562	144	2.5	8.6	2.5	0.032	0.558	0.009	2.564	17964	27.1	3.937	238	34.6	35.7	11.6	0.017	4619	3612	500m.fbmy5635.cy13a
999	4820	49	1.0	6.2	1.2	0.010	0.210	0.006	1.241	18767	27.0	3.894	224	34.7	35.7	13.0	0.019	4843	4157	500m.fbmy5635.cy13b
l.i0
l.i0: load without secondary indexes
Performance metrics for all DBMS, not just the ones listed above. Some are normalized by throughput, others are not. Legend for results is here.
ips	qps	rps	rmbps	wps	wmbps	rpq	rkbpq	wpi	wkbpi	csps	cpups	cspq	cpupq	dbgb1	dbgb2	rss	maxop	p50	p99	tag
105820	0	0	0.0	55.4	19.0	0.000	0.000	0.001	0.184	10969	47.6	0.104	18	15.7	16.1	1.1	0.198	106422	93534	500m.fbmy5635.cy9c
75930	0	0	0.0	58.7	17.5	0.000	0.000	0.001	0.235	8228	42.7	0.108	22	15.7	16.3	1.5	0.066	76119	70752	500m.fbmy8020.cy9c
105374	0	0	0.0	56.0	18.9	0.000	0.000	0.001	0.184	10930	46.9	0.104	18	15.7	16.1	1.1	0.183	105924	93497	500m.fbmy5635.cy9a
107319	0	0	0.0	56.0	19.3	0.000	0.000	0.001	0.184	11110	47.7	0.104	18	15.7	16.1	1.1	0.132	108013	95295	500m.fbmy5635.cy9b
106838	0	0	0.0	56.3	19.2	0.000	0.000	0.001	0.184	11059	47.3	0.104	18	15.7	16.1	1.1	0.165	107424	94897	500m.fbmy5635.cy9c0
107643	0	0	0.0	56.1	19.3	0.000	0.000	0.001	0.184	11139	47.7	0.103	18	15.7	16.1	1.1	0.175	108282	95294	500m.fbmy5635.cy9c1
99423	0	0	0.0	52.3	17.9	0.000	0.000	0.001	0.184	10316	46.4	0.104	19	15.7	16.1	1.1	0.129	99990	88106	500m.fbmy5635.cy9c2
107643	0	12	5.2	55.9	19.3	0.000	0.050	0.001	0.184	10880	47.9	0.101	18	15.7	16.1	1.1	0.148	108281	95198	500m.fbmy5635.cy13a
106838	0	0	0.0	53.1	19.0	0.000	0.000	0.000	0.182	10625	47.2	0.099	18	16.4	28.7	13.0	0.112	107283	95496	500m.fbmy5635.cy13b
l.x
l.x: create secondary indexes
Performance metrics for all DBMS, not just the ones listed above. Some are normalized by throughput, others are not. Legend for results is here.
ips	qps	rps	rmbps	wps	wmbps	rpq	rkbpq	wpi	wkbpi	csps	cpups	cspq	cpupq	dbgb1	dbgb2	rss	maxop	p50	p99	tag
101605	0	67	21.6	38.7	14.9	0.001	0.218	0.000	0.150	687	24.8	0.007	10	32.3	32.7	10.7	0.008	NA	NA	500m.fbmy5635.cy9c
96099	0	71	23.7	36.6	14.1	0.001	0.252	0.000	0.150	829	24.9	0.009	10	32.2	32.8	12.9	0.008	NA	NA	500m.fbmy8020.cy9c
102522	0	69	21.8	39.4	15.1	0.001	0.218	0.000	0.150	729	24.8	0.007	10	32.3	32.7	10.7	0.009	NA	NA	500m.fbmy5635.cy9a
101214	0	68	21.5	38.2	14.9	0.001	0.218	0.000	0.150	728	24.8	0.007	10	32.3	32.7	10.8	0.010	NA	NA	500m.fbmy5635.cy9b
99920	0	66	21.2	36.9	14.7	0.001	0.218	0.000	0.150	717	24.8	0.007	10	32.3	32.7	10.7	0.008	NA	NA	500m.fbmy5635.cy9c0
99661	0	66	21.2	38.0	14.6	0.001	0.218	0.000	0.150	672	24.8	0.007	10	32.3	32.7	10.7	0.005	NA	NA	500m.fbmy5635.cy9c1
99900	0	66	21.2	37.4	14.7	0.001	0.218	0.000	0.150	715	24.8	0.007	10	32.3	32.7	10.7	0.007	NA	NA	500m.fbmy5635.cy9c2
101051	0	58	21.5	23.7	14.8	0.001	0.218	0.000	0.150	730	24.4	0.007	10	32.3	32.7	11.7	0.009	NA	NA	500m.fbmy5635.cy13a
102291	0	77	25.7	50.1	15.0	0.001	0.258	0.000	0.150	534	24.6	0.005	10	32.8	45.1	12.9	0.004	NA	NA	500m.fbmy5635.cy13b
l.i1
l.i1: continue load after secondary indexes created
Performance metrics for all DBMS, not just the ones listed above. Some are normalized by throughput, others are not. Legend for results is here.
ips	qps	rps	rmbps	wps	wmbps	rpq	rkbpq	wpi	wkbpi	csps	cpups	cspq	cpupq	dbgb1	dbgb2	rss	maxop	p50	p99	tag
42194	0	26	3.1	171.5	75.2	0.001	0.075	0.004	1.825	10433	57.4	0.247	54	33.6	35.3	10.6	0.084	42353	33264	500m.fbmy5635.cy9c
34483	0	0	0.0	170.0	61.4	0.000	0.000	0.005	1.823	9089	54.5	0.264	63	33.5	35.3	10.9	0.121	34425	30428	500m.fbmy8020.cy9c
42194	0	24	2.9	170.8	74.8	0.001	0.071	0.004	1.815	10452	57.1	0.248	54	33.5	35.2	10.6	0.069	42403	35775	500m.fbmy5635.cy9a
42735	0	24	3.0	170.9	75.0	0.001	0.071	0.004	1.796	10710	57.5	0.251	54	33.5	35.2	10.6	0.081	42869	35325	500m.fbmy5635.cy9b
43290	0	40	4.4	129.8	55.4	0.001	0.104	0.003	1.310	10187	51.1	0.235	47	34.0	35.7	10.6	0.051	43753	36260	500m.fbmy5635.cy9c0
43290	0	1	0.1	105.8	43.7	0.000	0.002	0.002	1.034	9671	46.7	0.223	43	33.5	35.1	10.6	0.067	43554	35411	500m.fbmy5635.cy9c1
40322	0	1	0.1	93.7	38.5	0.000	0.002	0.002	0.978	8993	44.7	0.223	44	33.5	35.1	10.6	0.051	40455	33213	500m.fbmy5635.cy9c2
42553	0	121	58.9	168.6	74.4	0.003	1.417	0.004	1.791	8541	56.5	0.201	53	33.5	35.2	11.7	0.155	42804	34523	500m.fbmy5635.cy13a
42373	0	32	11.2	112.8	37.2	0.001	0.270	0.003	0.899	8388	44.3	0.198	42	33.8	47.3	13.1	0.071	42003	38258	500m.fbmy5635.cy13b
q100.1
q100.1: range queries with 100 insert/s per client
Performance metrics for all DBMS, not just the ones listed above. Some are normalized by throughput, others are not. Legend for results is here.
ips	qps	rps	rmbps	wps	wmbps	rpq	rkbpq	wpi	wkbpi	csps	cpups	cspq	cpupq	dbgb1	dbgb2	rss	maxop	p50	p99	tag
100	4699	22	0.2	4.1	0.4	0.005	0.038	0.041	3.829	18126	25.9	3.858	220	33.5	35.3	10.6	0.015	4715	4171	500m.fbmy5635.cy9c
100	4181	22	0.2	3.7	0.3	0.005	0.043	0.037	2.658	16286	25.9	3.895	248	33.5	35.5	10.9	0.016	4187	3740	500m.fbmy8020.cy9c
100	4726	22	0.2	3.7	0.2	0.005	0.040	0.037	2.405	18225	26.0	3.856	220	33.5	35.3	10.6	0.015	4733	4219	500m.fbmy5635.cy9a
100	4709	22	0.2	3.7	0.2	0.005	0.040	0.038	2.513	18163	25.9	3.857	220	33.5	35.3	10.6	0.015	4717	4139	500m.fbmy5635.cy9b
100	4792	22	0.2	4.0	0.4	0.005	0.038	0.041	3.652	18484	25.9	3.857	216	33.5	35.3	10.6	0.017	4779	4123	500m.fbmy5635.cy9c0
100	4642	22	0.2	3.7	0.2	0.005	0.039	0.037	2.144	17912	25.8	3.859	222	33.5	35.3	10.6	0.019	4621	4011	500m.fbmy5635.cy9c1
100	4596	22	0.2	3.7	0.2	0.005	0.039	0.037	2.291	17725	25.8	3.857	225	33.5	35.3	10.6	0.016	4603	3902	500m.fbmy5635.cy9c2
100	4698	43	0.5	3.8	0.3	0.009	0.105	0.038	3.269	18149	25.9	3.863	221	33.5	35.3	11.6	0.016	4731	3868	500m.fbmy5635.cy13a
100	4993	35	0.3	3.6	0.2	0.007	0.064	0.036	2.045	19259	26.1	3.857	209	33.9	47.5	12.9	0.021	5021	4043	500m.fbmy5635.cy13b
q500.1
q500.1: range queries with 500 insert/s per client
Performance metrics for all DBMS, not just the ones listed above. Some are normalized by throughput, others are not. Legend for results is here.
ips	qps	rps	rmbps	wps	wmbps	rpq	rkbpq	wpi	wkbpi	csps	cpups	cspq	cpupq	dbgb1	dbgb2	rss	maxop	p50	p99	tag
500	4724	0	0.0	5.8	1.1	0.000	0.000	0.012	2.210	18269	26.6	3.867	225	34.0	34.2	10.6	0.011	4731	4539	500m.fbmy5635.cy9c
499	4193	0	0.0	6.2	1.2	0.000	0.000	0.012	2.452	16392	26.8	3.910	256	34.0	34.4	10.9	0.010	4187	4075	500m.fbmy8020.cy9c
500	4712	0	0.0	6.3	1.2	0.000	0.000	0.013	2.517	18229	26.7	3.869	227	34.0	34.2	10.6	0.009	4715	4523	500m.fbmy5635.cy9a
499	4683	0	0.0	5.7	1.1	0.000	0.000	0.011	2.278	18126	26.6	3.870	227	34.0	34.2	10.6	0.009	4683	4491	500m.fbmy5635.cy9b
500	4832	0	0.0	5.6	1.0	0.000	0.000	0.011	2.115	18678	26.5	3.865	219	33.9	34.2	10.6	0.020	4843	4571	500m.fbmy5635.cy9c0
500	4653	0	0.0	4.6	0.6	0.000	0.000	0.009	1.258	17975	26.3	3.863	226	33.9	34.2	10.6	0.013	4667	4379	500m.fbmy5635.cy9c1
500	4646	0	0.0	4.5	0.6	0.000	0.000	0.009	1.172	17941	26.3	3.862	226	34.0	34.2	10.6	0.013	4667	4379	500m.fbmy5635.cy9c2
500	4666	53	1.1	5.7	1.1	0.011	0.241	0.011	2.318	18100	26.4	3.880	226	34.0	34.2	11.6	0.016	4684	3853	500m.fbmy5635.cy13a
499	4959	23	0.3	4.3	0.5	0.005	0.067	0.009	1.017	19163	26.4	3.865	213	34.3	48.4	12.9	0.019	4970	4635	500m.fbmy5635.cy13b
q1000.1
q1000.1: range queries with 1000 insert/s per client
Performance metrics for all DBMS, not just the ones listed above. Some are normalized by throughput, others are not. Legend for results is here.
ips	qps	rps	rmbps	wps	wmbps	rpq	rkbpq	wpi	wkbpi	csps	cpups	cspq	cpupq	dbgb1	dbgb2	rss	maxop	p50	p99	tag
999	4648	1	0.1	8.6	2.6	0.000	0.022	0.009	2.614	18123	27.5	3.899	237	34.5	35.7	10.6	0.012	4653	4411	500m.fbmy5635.cy9c
999	4158	1	0.1	8.7	2.5	0.000	0.023	0.009	2.530	16405	27.6	3.945	265	34.6	35.9	10.9	0.010	4157	3981	500m.fbmy8020.cy9c
999	4667	1	0.1	8.7	2.5	0.000	0.020	0.009	2.548	18193	27.5	3.898	236	34.6	35.7	10.7	0.009	4683	4411	500m.fbmy5635.cy9a
999	4670	1	0.1	9.0	2.5	0.000	0.022	0.009	2.597	18213	27.5	3.900	236	34.6	35.7	10.6	0.016	4683	4443	500m.fbmy5635.cy9b
999	4728	15	1.5	11.4	3.5	0.003	0.332	0.011	3.619	18474	29.1	3.907	246	34.4	35.6	10.6	0.018	4717	4429	500m.fbmy5635.cy9c0
999	4602	1	0.1	6.5	1.4	0.000	0.021	0.006	1.404	17898	27.0	3.889	235	34.8	35.9	10.7	0.008	4603	4317	500m.fbmy5635.cy9c1
999	4591	1	0.1	6.2	1.3	0.000	0.027	0.006	1.327	17849	27.0	3.888	235	34.5	35.6	10.7	0.007	4587	4317	500m.fbmy5635.cy9c2
999	4562	144	2.5	8.6	2.5	0.032	0.558	0.009	2.564	17964	27.1	3.937	238	34.6	35.7	11.6	0.017	4619	3612	500m.fbmy5635.cy13a
999	4820	49	1.0	6.2	1.2	0.010	0.210	0.006	1.241	18767	27.0	3.894	224	34.7	35.7	13.0	0.019	4843	4157	500m.fbmy5635.cy13b
l.i0
- l.i0: load without secondary indexes
- Legend for results is here.
- Each entry lists the percentage of responses that fit in that bucket (slower than max time for previous bucket, faster than min time for next bucket).
Insert response time histogram
256us	1ms	4ms	16ms	64ms	256ms	1s	4s	16s	gt	max	tag
0.000	98.015	1.933	0.049	nonzero	0.004	0.000	0.000	0.000	0.000	0.198	fbmy5635.cy9c
0.000	0.000	99.826	0.157	0.017	nonzero	0.000	0.000	0.000	0.000	0.066	fbmy8020.cy9c
0.000	97.637	2.312	0.047	nonzero	0.004	0.000	0.000	0.000	0.000	0.183	fbmy5635.cy9a
0.000	98.343	1.602	0.051	nonzero	0.004	0.000	0.000	0.000	0.000	0.132	fbmy5635.cy9b
0.000	98.283	1.663	0.051	nonzero	0.004	0.000	0.000	0.000	0.000	0.165	fbmy5635.cy9c0
0.000	98.523	1.425	0.048	nonzero	0.004	0.000	0.000	0.000	0.000	0.175	fbmy5635.cy9c1
0.000	81.785	18.157	0.054	nonzero	0.004	0.000	0.000	0.000	0.000	0.129	fbmy5635.cy9c2
0.000	98.752	1.196	0.048	nonzero	0.004	0.000	0.000	0.000	0.000	0.148	fbmy5635.cy13a
0.000	98.045	1.902	0.050	0.003	0.001	0.000	0.000	0.000	0.000	0.112	fbmy5635.cy13b
l.x
- l.x: create secondary indexes
- Legend for results is here.
- Each entry lists the percentage of responses that fit in that bucket (slower than max time for previous bucket, faster than min time for next bucket).
TODO - determine whether there is data for create index response time
l.i1
- l.i1: continue load after secondary indexes created
- Legend for results is here.
- Each entry lists the percentage of responses that fit in that bucket (slower than max time for previous bucket, faster than min time for next bucket).
Insert response time histogram
256us	1ms	4ms	16ms	64ms	256ms	1s	4s	16s	gt	max	tag
0.000	6.562	93.314	0.116	0.007	0.001	0.000	0.000	0.000	0.000	0.084	fbmy5635.cy9c
0.000	0.000	99.825	0.163	0.011	0.001	0.000	0.000	0.000	0.000	0.121	fbmy8020.cy9c
0.000	7.111	92.769	0.112	0.009	0.001	0.000	0.000	0.000	0.000	0.069	fbmy5635.cy9a
0.000	7.635	92.221	0.138	0.006	0.001	0.000	0.000	0.000	0.000	0.081	fbmy5635.cy9b
0.000	8.713	91.179	0.103	0.005	0.000	0.000	0.000	0.000	0.000	0.051	fbmy5635.cy9c0
0.000	8.153	91.748	0.092	0.005	0.001	0.000	0.000	0.000	0.000	0.067	fbmy5635.cy9c1
0.000	0.776	99.124	0.096	0.003	0.000	0.000	0.000	0.000	0.000	0.051	fbmy5635.cy9c2
0.000	7.271	92.593	0.092	0.042	0.002	0.000	0.000	0.000	0.000	0.155	fbmy5635.cy13a
0.000	4.805	95.112	0.073	0.009	0.001	0.000	0.000	0.000	0.000	0.071	fbmy5635.cy13b
q100.1
- q100.1: range queries with 100 insert/s per client
- Legend for results is here.
- Each entry lists the percentage of responses that fit in that bucket (slower than max time for previous bucket, faster than min time for next bucket).
Query response time histogram
256us	1ms	4ms	16ms	64ms	256ms	1s	4s	16s	gt	max	tag
97.813	2.184	0.002	nonzero	0.000	0.000	0.000	0.000	0.000	0.000	0.015	fbmy5635.cy9c
95.955	4.042	0.003	nonzero	nonzero	0.000	0.000	0.000	0.000	0.000	0.016	fbmy8020.cy9c
97.768	2.229	0.003	nonzero	0.000	0.000	0.000	0.000	0.000	0.000	0.015	fbmy5635.cy9a
97.774	2.222	0.004	nonzero	0.000	0.000	0.000	0.000	0.000	0.000	0.015	fbmy5635.cy9b
97.654	2.344	0.002	nonzero	nonzero	0.000	0.000	0.000	0.000	0.000	0.017	fbmy5635.cy9c0
97.646	2.351	0.003	nonzero	nonzero	0.000	0.000	0.000	0.000	0.000	0.019	fbmy5635.cy9c1
97.864	2.134	0.002	nonzero	nonzero	0.000	0.000	0.000	0.000	0.000	0.016	fbmy5635.cy9c2
97.529	2.457	0.013	0.001	0.000	0.000	0.000	0.000	0.000	0.000	0.016	fbmy5635.cy13a
97.611	2.382	0.007	nonzero	nonzero	0.000	0.000	0.000	0.000	0.000	0.021	fbmy5635.cy13b
Insert response time histogram
256us	1ms	4ms	16ms	64ms	256ms	1s	4s	16s	gt	max	tag
0.000	0.139	99.792	0.069	0.000	0.000	0.000	0.000	0.000	0.000	0.013	fbmy5635.cy9c
0.000	0.000	99.882	0.097	0.021	0.000	0.000	0.000	0.000	0.000	0.019	fbmy8020.cy9c
0.000	0.076	99.903	0.021	0.000	0.000	0.000	0.000	0.000	0.000	0.004	fbmy5635.cy9a
0.000	0.681	99.271	0.049	0.000	0.000	0.000	0.000	0.000	0.000	0.004	fbmy5635.cy9b
0.000	1.007	98.979	0.007	0.007	0.000	0.000	0.000	0.000	0.000	0.016	fbmy5635.cy9c0
0.000	1.007	98.958	0.035	0.000	0.000	0.000	0.000	0.000	0.000	0.010	fbmy5635.cy9c1
0.000	0.000	99.931	0.069	0.000	0.000	0.000	0.000	0.000	0.000	0.005	fbmy5635.cy9c2
0.000	0.535	99.396	0.069	0.000	0.000	0.000	0.000	0.000	0.000	0.009	fbmy5635.cy13a
0.000	0.194	99.799	0.007	0.000	0.000	0.000	0.000	0.000	0.000	0.015	fbmy5635.cy13b
q500.1
- q500.1: range queries with 500 insert/s per client
- Legend for results is here.
- Each entry lists the percentage of responses that fit in that bucket (slower than max time for previous bucket, faster than min time for next bucket).
Query response time histogram
256us	1ms	4ms	16ms	64ms	256ms	1s	4s	16s	gt	max	tag
97.805	2.194	0.001	nonzero	0.000	0.000	0.000	0.000	0.000	0.000	0.011	fbmy5635.cy9c
95.896	4.101	0.003	nonzero	0.000	0.000	0.000	0.000	0.000	0.000	0.010	fbmy8020.cy9c
97.802	2.197	0.001	nonzero	0.000	0.000	0.000	0.000	0.000	0.000	0.009	fbmy5635.cy9a
97.727	2.272	0.001	nonzero	0.000	0.000	0.000	0.000	0.000	0.000	0.009	fbmy5635.cy9b
97.930	2.068	0.001	nonzero	nonzero	0.000	0.000	0.000	0.000	0.000	0.020	fbmy5635.cy9c0
97.707	2.292	0.001	nonzero	0.000	0.000	0.000	0.000	0.000	0.000	0.013	fbmy5635.cy9c1
97.816	2.182	0.001	nonzero	0.000	0.000	0.000	0.000	0.000	0.000	0.013	fbmy5635.cy9c2
96.743	3.250	0.006	0.001	nonzero	0.000	0.000	0.000	0.000	0.000	0.016	fbmy5635.cy13a
97.700	2.296	0.004	nonzero	nonzero	0.000	0.000	0.000	0.000	0.000	0.019	fbmy5635.cy13b
Insert response time histogram
256us	1ms	4ms	16ms	64ms	256ms	1s	4s	16s	gt	max	tag
0.000	0.331	99.633	0.035	0.001	0.000	0.000	0.000	0.000	0.000	0.048	fbmy5635.cy9c
0.000	0.000	99.904	0.079	0.017	0.000	0.000	0.000	0.000	0.000	0.029	fbmy8020.cy9c
0.000	0.643	99.321	0.035	0.001	0.000	0.000	0.000	0.000	0.000	0.033	fbmy5635.cy9a
0.000	2.860	97.119	0.019	0.001	0.000	0.000	0.000	0.000	0.000	0.022	fbmy5635.cy9b
0.000	3.378	96.600	0.018	0.004	0.000	0.000	0.000	0.000	0.000	0.053	fbmy5635.cy9c0
0.000	1.722	98.253	0.024	0.001	0.000	0.000	0.000	0.000	0.000	0.033	fbmy5635.cy9c1
0.000	0.129	99.833	0.036	0.001	0.000	0.000	0.000	0.000	0.000	0.022	fbmy5635.cy9c2
0.000	1.471	98.474	0.054	0.001	0.000	0.000	0.000	0.000	0.000	0.028	fbmy5635.cy13a
0.000	0.439	99.528	0.031	0.003	0.000	0.000	0.000	0.000	0.000	0.023	fbmy5635.cy13b
q1000.1
- q1000.1: range queries with 1000 insert/s per client
- Legend for results is here.
- Each entry lists the percentage of responses that fit in that bucket (slower than max time for previous bucket, faster than min time for next bucket).
Query response time histogram
256us	1ms	4ms	16ms	64ms	256ms	1s	4s	16s	gt	max	tag
97.154	2.843	0.003	nonzero	0.000	0.000	0.000	0.000	0.000	0.000	0.012	fbmy5635.cy9c
94.069	5.921	0.010	nonzero	0.000	0.000	0.000	0.000	0.000	0.000	0.010	fbmy8020.cy9c
97.165	2.832	0.003	nonzero	0.000	0.000	0.000	0.000	0.000	0.000	0.009	fbmy5635.cy9a
97.272	2.725	0.003	nonzero	0.000	0.000	0.000	0.000	0.000	0.000	0.016	fbmy5635.cy9b
97.039	2.956	0.005	nonzero	nonzero	0.000	0.000	0.000	0.000	0.000	0.018	fbmy5635.cy9c0
97.076	2.920	0.003	nonzero	0.000	0.000	0.000	0.000	0.000	0.000	0.008	fbmy5635.cy9c1
97.090	2.907	0.003	nonzero	0.000	0.000	0.000	0.000	0.000	0.000	0.007	fbmy5635.cy9c2
94.211	5.771	0.017	0.002	nonzero	0.000	0.000	0.000	0.000	0.000	0.017	fbmy5635.cy13a
96.428	3.562	0.010	0.001	nonzero	0.000	0.000	0.000	0.000	0.000	0.019	fbmy5635.cy13b
Insert response time histogram
256us	1ms	4ms	16ms	64ms	256ms	1s	4s	16s	gt	max	tag
0.000	0.639	99.318	0.042	0.001	0.000	0.000	0.000	0.000	0.000	0.034	fbmy5635.cy9c
0.000	0.000	99.887	0.092	0.021	0.000	0.000	0.000	0.000	0.000	0.042	fbmy8020.cy9c
0.000	0.897	99.045	0.056	0.002	0.000	0.000	0.000	0.000	0.000	0.034	fbmy5635.cy9a
0.000	1.949	98.019	0.030	0.001	0.000	0.000	0.000	0.000	0.000	0.033	fbmy5635.cy9b
0.000	1.422	98.534	0.042	0.001	0.000	0.000	0.000	0.000	0.000	0.037	fbmy5635.cy9c0
0.000	0.811	99.149	0.037	0.002	0.000	0.000	0.000	0.000	0.000	0.039	fbmy5635.cy9c1
0.000	0.028	99.929	0.042	0.001	0.000	0.000	0.000	0.000	0.000	0.051	fbmy5635.cy9c2
0.000	0.885	99.078	0.035	0.001	0.000	0.000	0.000	0.000	0.000	0.023	fbmy5635.cy13a
0.000	0.452	99.500	0.047	0.001	0.000	0.000	0.000	0.000	0.000	0.020	fbmy5635.cy13b