Introduction
This is a report for the insert benchmark with 20M docs and 1 client(s). It is generated by scripts (bash, awk, sed) and Tufte might not be impressed. An overview of the insert benchmark is here and a short update is here. Below, by DBMS, I mean DBMS+version.config. An example is my8020.c10b40 where my means MySQL, 8020 is version 8.0.20 and c10b40 is the name for the configuration file.
The test server is an Intel NUC with 4 cores, 16G RAM and a Samsung 970 EVO. More details are here. Clients and the DBMS share one server. The per-database configs are in the per-database subdirectories here.
The tested DBMS are:
- pg124.cx5 - Postgres 12.4 and the cx5 config
- pg134.cx5 - Postgres 13.4 and the cx5 config
- pg140.cx5 - Postgres 14.0 and the cx5 config
Contents
- Summary
- l.i0: load without secondary indexes
- l.x: create secondary indexes
- l.i1: continue load after secondary indexes created
- q100.1: range queries with 100 insert/s per client
- q500.1: range queries with 500 insert/s per client
- q1000.1: range queries with 1000 insert/s per client
Summary
The numbers are inserts/s for l.i0 and l.i1, indexed docs (or rows) /s for l.x and queries/s for q*.2. The values are the average rate over the entire test for inserts (IPS) and queries (QPS). The range of values for IPS and QPS is split into 3 parts: bottom 25%, middle 50%, top 25%. Values in the bottom 25% have a red background, values in the top 25% have a green background and values in the middle have no color. A gray background is used for values that can be ignored because the DBMS did not sustain the target insert rate. Red backgrounds are not used when the minimum value is within 80% of the max value.
| dbms | l.i0 | l.x | l.i1 | q100.1 | q500.1 | q1000.1 |
|---|---|---|---|---|---|---|
| 20m.pg124.cx5 | 102564 | 300000 | 38685 | 7591 | 7525 | 7534 |
| 20m.pg134.cx5 | 106952 | 304545 | 38986 | 7662 | 7572 | 7555 |
| 20m.pg140.cx5 | 100502 | 295588 | 37879 | 7581 | 7559 | 7510 |
This lists the average rate of inserts/s for the tests that do inserts concurrent with queries. For such tests the query rate is listed in the table above. The read+write tests are setup so that the insert rate should match the target rate every second. Cells that are not at least 95% of the target have a red background to indicate a failure to satisfy the target.
| dbms | q100.1 | q500.1 | q1000.1 |
|---|---|---|---|
| pg124.cx5 | 100 | 500 | 999 |
| pg134.cx5 | 100 | 499 | 999 |
| pg140.cx5 | 100 | 499 | 999 |
| target | 100 | 500 | 1000 |
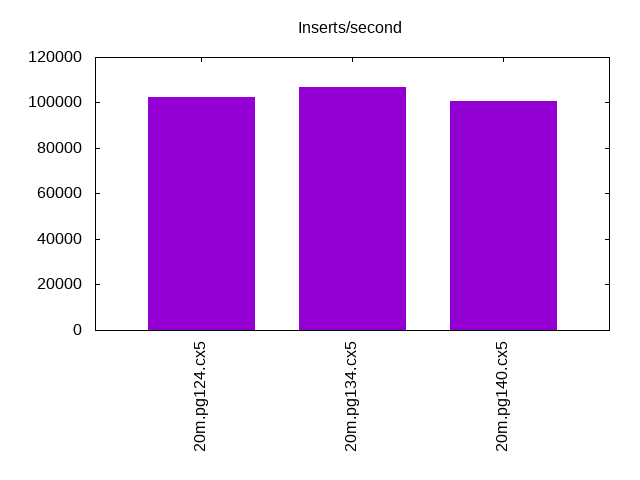
l.i0
l.i0: load without secondary indexes. Graphs for performance per 1-second interval are here.
Average throughput:
Insert response time histogram: each cell has the percentage of responses that take <= the time in the header and max is the max response time in seconds. For the max column values in the top 25% of the range have a red background and in the bottom 25% of the range have a green background. The red background is not used when the min value is within 80% of the max value.
| dbms | 256us | 1ms | 4ms | 16ms | 64ms | 256ms | 1s | 4s | 16s | gt | max |
|---|---|---|---|---|---|---|---|---|---|---|---|
| pg124.cx5 | 91.436 | 8.563 | 0.003 | ||||||||
| pg134.cx5 | 98.272 | 1.728 | 0.002 | ||||||||
| pg140.cx5 | 79.843 | 20.156 | 0.002 | 0.004 |
Performance metrics for the DBMS listed above. Some are normalized by throughput, others are not. Legend for results is here.
ips	qps	rps	rmbps	wps	wmbps	rpq	rkbpq	wpi	wkbpi	csps	cpups	cspq	cpupq	dbgb1	dbgb2	rss	maxop	p50	p99	tag
102564	0	0	0.0	77.3	44.0	0.000	0.000	0.001	0.439	12511	42.3	0.122	16	1.9	5.2	0.0	0.003	102788	81750	20m.pg124.cx5
106952	0	0	0.0	70.3	44.7	0.000	0.000	0.001	0.428	12962	43.8	0.121	16	1.9	5.2	0.0	0.002	107586	86108	20m.pg134.cx5
100502	0	0	0.0	67.2	42.8	0.000	0.000	0.001	0.437	12260	44.8	0.122	18	1.9	5.2	0.0	0.004	100929	81111	20m.pg140.cx5
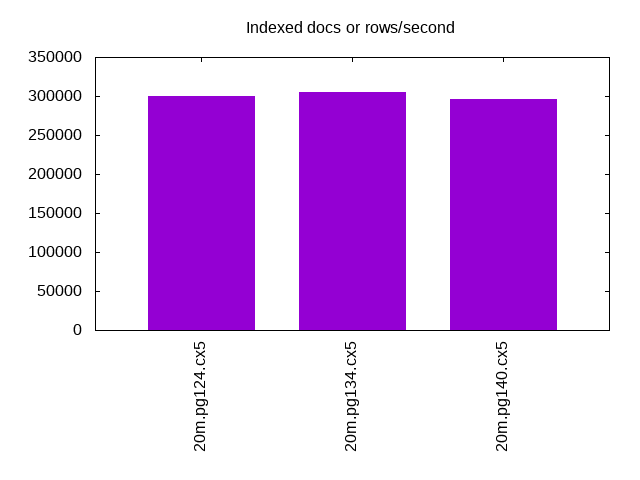
l.x
l.x: create secondary indexes.
Average throughput:
Performance metrics for the DBMS listed above. Some are normalized by throughput, others are not. Legend for results is here.
ips	qps	rps	rmbps	wps	wmbps	rpq	rkbpq	wpi	wkbpi	csps	cpups	cspq	cpupq	dbgb1	dbgb2	rss	maxop	p50	p99	tag
300000	0	0	0.0	60.0	62.3	0.000	0.000	0.000	0.213	1970	24.4	0.007	3	3.7	8.6	0.0	0.002	NA	NA	20m.pg124.cx5
304545	0	0	0.0	68.0	69.3	0.000	0.000	0.000	0.233	2006	24.3	0.007	3	3.7	8.6	0.0	0.002	NA	NA	20m.pg134.cx5
295588	0	0	0.0	54.4	57.2	0.000	0.000	0.000	0.198	1786	24.5	0.006	3	3.7	8.6	0.0	0.002	NA	NA	20m.pg140.cx5
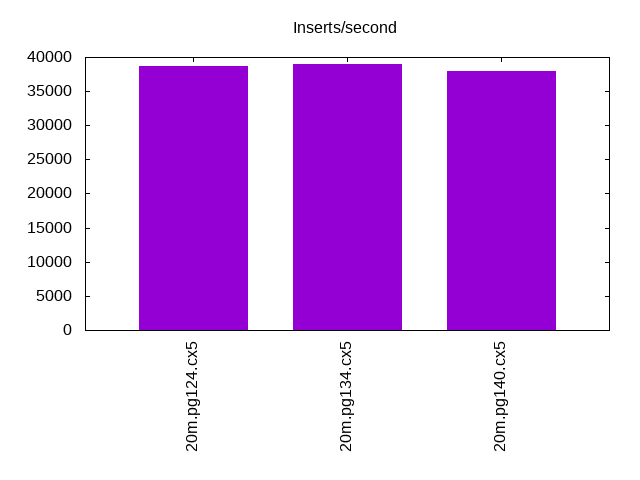
l.i1
l.i1: continue load after secondary indexes created. Graphs for performance per 1-second interval are here.
Average throughput:
Insert response time histogram: each cell has the percentage of responses that take <= the time in the header and max is the max response time in seconds. For the max column values in the top 25% of the range have a red background and in the bottom 25% of the range have a green background. The red background is not used when the min value is within 80% of the max value.
| dbms | 256us | 1ms | 4ms | 16ms | 64ms | 256ms | 1s | 4s | 16s | gt | max |
|---|---|---|---|---|---|---|---|---|---|---|---|
| pg124.cx5 | 99.978 | 0.019 | 0.003 | 0.037 | |||||||
| pg134.cx5 | 99.831 | 0.138 | 0.029 | 0.001 | 0.001 | 0.321 | |||||
| pg140.cx5 | 99.866 | 0.105 | 0.026 | 0.002 | nonzero | 0.696 |
Performance metrics for the DBMS listed above. Some are normalized by throughput, others are not. Legend for results is here.
ips	qps	rps	rmbps	wps	wmbps	rpq	rkbpq	wpi	wkbpi	csps	cpups	cspq	cpupq	dbgb1	dbgb2	rss	maxop	p50	p99	tag
38685	0	0	0.0	207.8	66.1	0.000	0.000	0.005	1.750	9960	35.9	0.257	37	8.2	19.5	0.0	0.037	39707	26369	20m.pg124.cx5
38986	0	0	0.0	202.5	68.0	0.000	0.000	0.005	1.787	9931	35.6	0.255	37	8.2	19.9	0.0	0.321	40506	8139	20m.pg134.cx5
37879	0	0	0.0	156.3	63.9	0.000	0.000	0.004	1.726	9597	36.0	0.253	38	8.2	20.8	0.0	0.696	39558	11534	20m.pg140.cx5
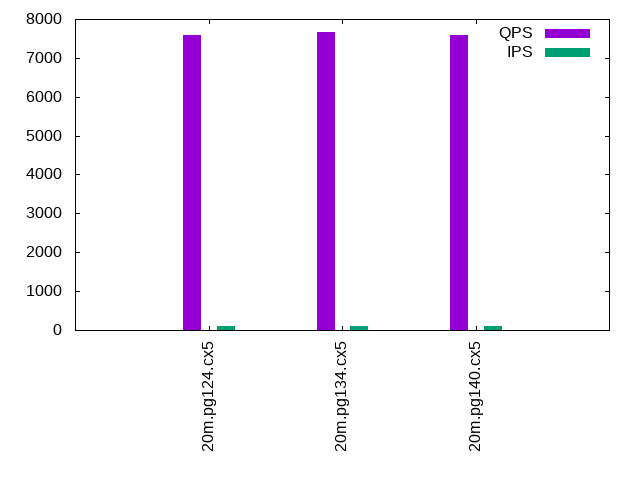
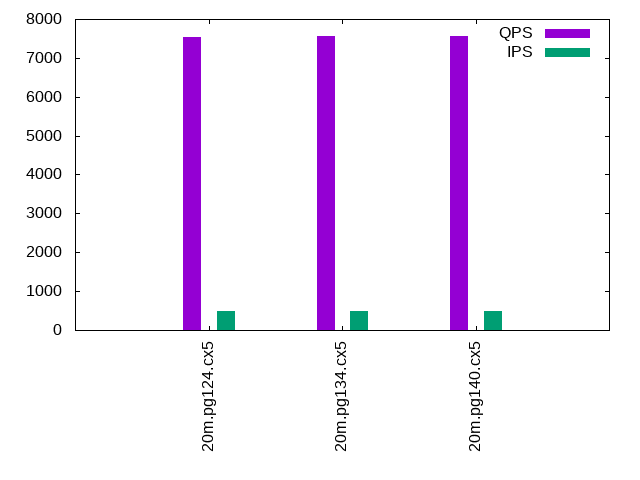
q100.1
q100.1: range queries with 100 insert/s per client. Graphs for performance per 1-second interval are here.
Average throughput:
Query response time histogram: each cell has the percentage of responses that take <= the time in the header and max is the max response time in seconds. For max values in the top 25% of the range have a red background and in the bottom 25% of the range have a green background. The red background is not used when the min value is within 80% of the max value.
| dbms | 256us | 1ms | 4ms | 16ms | 64ms | 256ms | 1s | 4s | 16s | gt | max |
|---|---|---|---|---|---|---|---|---|---|---|---|
| pg124.cx5 | 99.959 | 0.041 | 0.001 | nonzero | 0.007 | ||||||
| pg134.cx5 | 99.966 | 0.033 | 0.001 | nonzero | 0.004 | ||||||
| pg140.cx5 | 99.947 | 0.052 | 0.001 | 0.003 |
Insert response time histogram: each cell has the percentage of responses that take <= the time in the header and max is the max response time in seconds. For max values in the top 25% of the range have a red background and in the bottom 25% of the range have a green background. The red background is not used when the min value is within 80% of the max value.
| dbms | 256us | 1ms | 4ms | 16ms | 64ms | 256ms | 1s | 4s | 16s | gt | max |
|---|---|---|---|---|---|---|---|---|---|---|---|
| pg124.cx5 | 99.986 | 0.014 | 0.005 | ||||||||
| pg134.cx5 | 99.993 | 0.007 | 0.005 | ||||||||
| pg140.cx5 | 99.986 | 0.014 | 0.009 |
Performance metrics for the DBMS listed above. Some are normalized by throughput, others are not. Legend for results is here.
ips	qps	rps	rmbps	wps	wmbps	rpq	rkbpq	wpi	wkbpi	csps	cpups	cspq	cpupq	dbgb1	dbgb2	rss	maxop	p50	p99	tag
100	7591	0	0.0	204.6	4.6	0.000	0.000	2.048	47.351	29267	27.7	3.855	146	8.3	10.3	0.0	0.007	7592	7480	20m.pg124.cx5
100	7662	0	0.0	205.0	4.3	0.000	0.000	2.052	44.005	29552	27.8	3.857	145	8.3	10.2	0.0	0.004	7656	7544	20m.pg134.cx5
100	7581	0	0.0	196.9	4.4	0.000	0.000	1.971	44.670	29165	26.3	3.847	139	8.3	10.8	0.0	0.003	7578	7464	20m.pg140.cx5
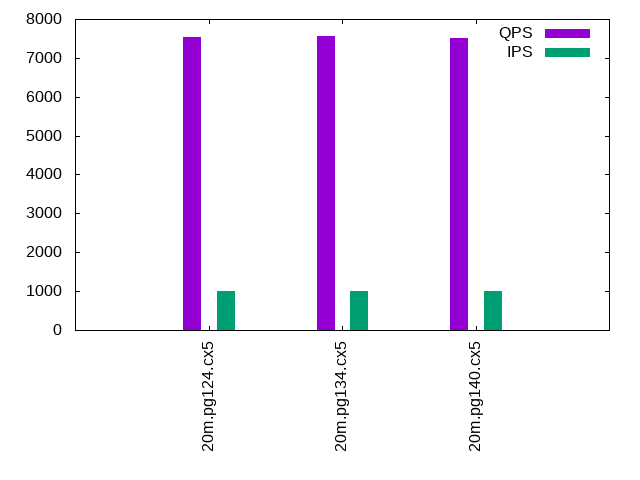
q500.1
q500.1: range queries with 500 insert/s per client. Graphs for performance per 1-second interval are here.
Average throughput:
Query response time histogram: each cell has the percentage of responses that take <= the time in the header and max is the max response time in seconds. For max values in the top 25% of the range have a red background and in the bottom 25% of the range have a green background. The red background is not used when the min value is within 80% of the max value.
| dbms | 256us | 1ms | 4ms | 16ms | 64ms | 256ms | 1s | 4s | 16s | gt | max |
|---|---|---|---|---|---|---|---|---|---|---|---|
| pg124.cx5 | 99.925 | 0.069 | 0.006 | nonzero | 0.004 | ||||||
| pg134.cx5 | 99.930 | 0.064 | 0.006 | nonzero | 0.010 | ||||||
| pg140.cx5 | 99.907 | 0.086 | 0.007 | nonzero | 0.005 |
Insert response time histogram: each cell has the percentage of responses that take <= the time in the header and max is the max response time in seconds. For max values in the top 25% of the range have a red background and in the bottom 25% of the range have a green background. The red background is not used when the min value is within 80% of the max value.
| dbms | 256us | 1ms | 4ms | 16ms | 64ms | 256ms | 1s | 4s | 16s | gt | max |
|---|---|---|---|---|---|---|---|---|---|---|---|
| pg124.cx5 | 99.986 | 0.014 | 0.010 | ||||||||
| pg134.cx5 | 99.978 | 0.022 | 0.010 | ||||||||
| pg140.cx5 | 99.981 | 0.018 | 0.001 | 0.016 |
Performance metrics for the DBMS listed above. Some are normalized by throughput, others are not. Legend for results is here.
ips	qps	rps	rmbps	wps	wmbps	rpq	rkbpq	wpi	wkbpi	csps	cpups	cspq	cpupq	dbgb1	dbgb2	rss	maxop	p50	p99	tag
500	7525	0	0.0	375.7	13.0	0.000	0.000	0.752	26.698	29120	28.2	3.870	150	9.7	12.7	0.0	0.004	7528	7384	20m.pg124.cx5
499	7572	0	0.0	377.1	13.1	0.000	0.000	0.755	26.781	29311	28.3	3.871	150	9.7	12.7	0.0	0.010	7576	7432	20m.pg134.cx5
499	7559	0	0.0	376.9	12.4	0.000	0.000	0.755	25.398	29199	26.8	3.863	142	9.7	13.3	0.0	0.005	7560	7448	20m.pg140.cx5
q1000.1
q1000.1: range queries with 1000 insert/s per client. Graphs for performance per 1-second interval are here.
Average throughput:
Query response time histogram: each cell has the percentage of responses that take <= the time in the header and max is the max response time in seconds. For max values in the top 25% of the range have a red background and in the bottom 25% of the range have a green background. The red background is not used when the min value is within 80% of the max value.
| dbms | 256us | 1ms | 4ms | 16ms | 64ms | 256ms | 1s | 4s | 16s | gt | max |
|---|---|---|---|---|---|---|---|---|---|---|---|
| pg124.cx5 | 99.877 | 0.109 | 0.014 | nonzero | 0.009 | ||||||
| pg134.cx5 | 99.881 | 0.105 | 0.014 | nonzero | 0.008 | ||||||
| pg140.cx5 | 99.841 | 0.144 | 0.015 | nonzero | 0.007 |
Insert response time histogram: each cell has the percentage of responses that take <= the time in the header and max is the max response time in seconds. For max values in the top 25% of the range have a red background and in the bottom 25% of the range have a green background. The red background is not used when the min value is within 80% of the max value.
| dbms | 256us | 1ms | 4ms | 16ms | 64ms | 256ms | 1s | 4s | 16s | gt | max |
|---|---|---|---|---|---|---|---|---|---|---|---|
| pg124.cx5 | 98.209 | 1.778 | 0.013 | 0.036 | |||||||
| pg134.cx5 | 98.164 | 1.810 | 0.026 | 0.035 | |||||||
| pg140.cx5 | 98.247 | 1.738 | 0.015 | 0.036 |
Performance metrics for the DBMS listed above. Some are normalized by throughput, others are not. Legend for results is here.
ips	qps	rps	rmbps	wps	wmbps	rpq	rkbpq	wpi	wkbpi	csps	cpups	cspq	cpupq	dbgb1	dbgb2	rss	maxop	p50	p99	tag
999	7534	7	0.1	485.2	18.8	0.001	0.008	0.486	19.275	29296	28.6	3.888	152	12.0	15.8	0.0	0.009	7544	7400	20m.pg124.cx5
999	7555	7	0.1	483.1	18.8	0.001	0.009	0.484	19.287	29383	28.6	3.889	151	12.0	15.8	0.0	0.008	7560	7416	20m.pg134.cx5
999	7510	7	0.1	513.2	17.5	0.001	0.008	0.514	17.941	29133	27.3	3.879	145	12.0	16.7	0.0	0.007	7512	7384	20m.pg140.cx5
l.i0
l.i0: load without secondary indexes
Performance metrics for all DBMS, not just the ones listed above. Some are normalized by throughput, others are not. Legend for results is here.
ips	qps	rps	rmbps	wps	wmbps	rpq	rkbpq	wpi	wkbpi	csps	cpups	cspq	cpupq	dbgb1	dbgb2	rss	maxop	p50	p99	tag
102564	0	0	0.0	77.3	44.0	0.000	0.000	0.001	0.439	12511	42.3	0.122	16	1.9	5.2	0.0	0.003	102788	81750	20m.pg124.cx5
106952	0	0	0.0	70.3	44.7	0.000	0.000	0.001	0.428	12962	43.8	0.121	16	1.9	5.2	0.0	0.002	107586	86108	20m.pg134.cx5
100502	0	0	0.0	67.2	42.8	0.000	0.000	0.001	0.437	12260	44.8	0.122	18	1.9	5.2	0.0	0.004	100929	81111	20m.pg140.cx5
l.x
l.x: create secondary indexes
Performance metrics for all DBMS, not just the ones listed above. Some are normalized by throughput, others are not. Legend for results is here.
ips	qps	rps	rmbps	wps	wmbps	rpq	rkbpq	wpi	wkbpi	csps	cpups	cspq	cpupq	dbgb1	dbgb2	rss	maxop	p50	p99	tag
300000	0	0	0.0	60.0	62.3	0.000	0.000	0.000	0.213	1970	24.4	0.007	3	3.7	8.6	0.0	0.002	NA	NA	20m.pg124.cx5
304545	0	0	0.0	68.0	69.3	0.000	0.000	0.000	0.233	2006	24.3	0.007	3	3.7	8.6	0.0	0.002	NA	NA	20m.pg134.cx5
295588	0	0	0.0	54.4	57.2	0.000	0.000	0.000	0.198	1786	24.5	0.006	3	3.7	8.6	0.0	0.002	NA	NA	20m.pg140.cx5
l.i1
l.i1: continue load after secondary indexes created
Performance metrics for all DBMS, not just the ones listed above. Some are normalized by throughput, others are not. Legend for results is here.
ips	qps	rps	rmbps	wps	wmbps	rpq	rkbpq	wpi	wkbpi	csps	cpups	cspq	cpupq	dbgb1	dbgb2	rss	maxop	p50	p99	tag
38685	0	0	0.0	207.8	66.1	0.000	0.000	0.005	1.750	9960	35.9	0.257	37	8.2	19.5	0.0	0.037	39707	26369	20m.pg124.cx5
38986	0	0	0.0	202.5	68.0	0.000	0.000	0.005	1.787	9931	35.6	0.255	37	8.2	19.9	0.0	0.321	40506	8139	20m.pg134.cx5
37879	0	0	0.0	156.3	63.9	0.000	0.000	0.004	1.726	9597	36.0	0.253	38	8.2	20.8	0.0	0.696	39558	11534	20m.pg140.cx5
q100.1
q100.1: range queries with 100 insert/s per client
Performance metrics for all DBMS, not just the ones listed above. Some are normalized by throughput, others are not. Legend for results is here.
ips	qps	rps	rmbps	wps	wmbps	rpq	rkbpq	wpi	wkbpi	csps	cpups	cspq	cpupq	dbgb1	dbgb2	rss	maxop	p50	p99	tag
100	7591	0	0.0	204.6	4.6	0.000	0.000	2.048	47.351	29267	27.7	3.855	146	8.3	10.3	0.0	0.007	7592	7480	20m.pg124.cx5
100	7662	0	0.0	205.0	4.3	0.000	0.000	2.052	44.005	29552	27.8	3.857	145	8.3	10.2	0.0	0.004	7656	7544	20m.pg134.cx5
100	7581	0	0.0	196.9	4.4	0.000	0.000	1.971	44.670	29165	26.3	3.847	139	8.3	10.8	0.0	0.003	7578	7464	20m.pg140.cx5
q500.1
q500.1: range queries with 500 insert/s per client
Performance metrics for all DBMS, not just the ones listed above. Some are normalized by throughput, others are not. Legend for results is here.
ips	qps	rps	rmbps	wps	wmbps	rpq	rkbpq	wpi	wkbpi	csps	cpups	cspq	cpupq	dbgb1	dbgb2	rss	maxop	p50	p99	tag
500	7525	0	0.0	375.7	13.0	0.000	0.000	0.752	26.698	29120	28.2	3.870	150	9.7	12.7	0.0	0.004	7528	7384	20m.pg124.cx5
499	7572	0	0.0	377.1	13.1	0.000	0.000	0.755	26.781	29311	28.3	3.871	150	9.7	12.7	0.0	0.010	7576	7432	20m.pg134.cx5
499	7559	0	0.0	376.9	12.4	0.000	0.000	0.755	25.398	29199	26.8	3.863	142	9.7	13.3	0.0	0.005	7560	7448	20m.pg140.cx5
q1000.1
q1000.1: range queries with 1000 insert/s per client
Performance metrics for all DBMS, not just the ones listed above. Some are normalized by throughput, others are not. Legend for results is here.
ips	qps	rps	rmbps	wps	wmbps	rpq	rkbpq	wpi	wkbpi	csps	cpups	cspq	cpupq	dbgb1	dbgb2	rss	maxop	p50	p99	tag
999	7534	7	0.1	485.2	18.8	0.001	0.008	0.486	19.275	29296	28.6	3.888	152	12.0	15.8	0.0	0.009	7544	7400	20m.pg124.cx5
999	7555	7	0.1	483.1	18.8	0.001	0.009	0.484	19.287	29383	28.6	3.889	151	12.0	15.8	0.0	0.008	7560	7416	20m.pg134.cx5
999	7510	7	0.1	513.2	17.5	0.001	0.008	0.514	17.941	29133	27.3	3.879	145	12.0	16.7	0.0	0.007	7512	7384	20m.pg140.cx5
l.i0
- l.i0: load without secondary indexes
- Legend for results is here.
- Each entry lists the percentage of responses that fit in that bucket (slower than max time for previous bucket, faster than min time for next bucket).
Insert response time histogram
256us	1ms	4ms	16ms	64ms	256ms	1s	4s	16s	gt	max	tag
0.000	91.436	8.563	0.000	0.000	0.000	0.000	0.000	0.000	0.000	0.003	pg124.cx5
0.000	98.272	1.728	0.000	0.000	0.000	0.000	0.000	0.000	0.000	0.002	pg134.cx5
0.000	79.843	20.156	0.002	0.000	0.000	0.000	0.000	0.000	0.000	0.004	pg140.cx5
l.x
- l.x: create secondary indexes
- Legend for results is here.
- Each entry lists the percentage of responses that fit in that bucket (slower than max time for previous bucket, faster than min time for next bucket).
TODO - determine whether there is data for create index response time
l.i1
- l.i1: continue load after secondary indexes created
- Legend for results is here.
- Each entry lists the percentage of responses that fit in that bucket (slower than max time for previous bucket, faster than min time for next bucket).
Insert response time histogram
256us	1ms	4ms	16ms	64ms	256ms	1s	4s	16s	gt	max	tag
0.000	0.000	99.978	0.019	0.003	0.000	0.000	0.000	0.000	0.000	0.037	pg124.cx5
0.000	0.000	99.831	0.138	0.029	0.001	0.001	0.000	0.000	0.000	0.321	pg134.cx5
0.000	0.000	99.866	0.105	0.026	0.002	nonzero	0.000	0.000	0.000	0.696	pg140.cx5
q100.1
- q100.1: range queries with 100 insert/s per client
- Legend for results is here.
- Each entry lists the percentage of responses that fit in that bucket (slower than max time for previous bucket, faster than min time for next bucket).
Query response time histogram
256us	1ms	4ms	16ms	64ms	256ms	1s	4s	16s	gt	max	tag
99.959	0.041	0.001	nonzero	0.000	0.000	0.000	0.000	0.000	0.000	0.007	pg124.cx5
99.966	0.033	0.001	nonzero	0.000	0.000	0.000	0.000	0.000	0.000	0.004	pg134.cx5
99.947	0.052	0.001	0.000	0.000	0.000	0.000	0.000	0.000	0.000	0.003	pg140.cx5
Insert response time histogram
256us	1ms	4ms	16ms	64ms	256ms	1s	4s	16s	gt	max	tag
0.000	0.000	99.986	0.014	0.000	0.000	0.000	0.000	0.000	0.000	0.005	pg124.cx5
0.000	0.000	99.993	0.007	0.000	0.000	0.000	0.000	0.000	0.000	0.005	pg134.cx5
0.000	0.000	99.986	0.014	0.000	0.000	0.000	0.000	0.000	0.000	0.009	pg140.cx5
q500.1
- q500.1: range queries with 500 insert/s per client
- Legend for results is here.
- Each entry lists the percentage of responses that fit in that bucket (slower than max time for previous bucket, faster than min time for next bucket).
Query response time histogram
256us	1ms	4ms	16ms	64ms	256ms	1s	4s	16s	gt	max	tag
99.925	0.069	0.006	nonzero	0.000	0.000	0.000	0.000	0.000	0.000	0.004	pg124.cx5
99.930	0.064	0.006	nonzero	0.000	0.000	0.000	0.000	0.000	0.000	0.010	pg134.cx5
99.907	0.086	0.007	nonzero	0.000	0.000	0.000	0.000	0.000	0.000	0.005	pg140.cx5
Insert response time histogram
256us	1ms	4ms	16ms	64ms	256ms	1s	4s	16s	gt	max	tag
0.000	0.000	99.986	0.014	0.000	0.000	0.000	0.000	0.000	0.000	0.010	pg124.cx5
0.000	0.000	99.978	0.022	0.000	0.000	0.000	0.000	0.000	0.000	0.010	pg134.cx5
0.000	0.000	99.981	0.018	0.001	0.000	0.000	0.000	0.000	0.000	0.016	pg140.cx5
q1000.1
- q1000.1: range queries with 1000 insert/s per client
- Legend for results is here.
- Each entry lists the percentage of responses that fit in that bucket (slower than max time for previous bucket, faster than min time for next bucket).
Query response time histogram
256us	1ms	4ms	16ms	64ms	256ms	1s	4s	16s	gt	max	tag
99.877	0.109	0.014	nonzero	0.000	0.000	0.000	0.000	0.000	0.000	0.009	pg124.cx5
99.881	0.105	0.014	nonzero	0.000	0.000	0.000	0.000	0.000	0.000	0.008	pg134.cx5
99.841	0.144	0.015	nonzero	0.000	0.000	0.000	0.000	0.000	0.000	0.007	pg140.cx5
Insert response time histogram
256us	1ms	4ms	16ms	64ms	256ms	1s	4s	16s	gt	max	tag
0.000	0.000	98.209	1.778	0.013	0.000	0.000	0.000	0.000	0.000	0.036	pg124.cx5
0.000	0.000	98.164	1.810	0.026	0.000	0.000	0.000	0.000	0.000	0.035	pg134.cx5
0.000	0.000	98.247	1.738	0.015	0.000	0.000	0.000	0.000	0.000	0.036	pg140.cx5