Introduction
This is a report for the insert benchmark with 20M docs and 1 client(s). It is generated by scripts (bash, awk, sed) and Tufte might not be impressed. An overview of the insert benchmark is here and a short update is here. Below, by DBMS, I mean DBMS+version.config. An example is my8020.c10b40 where my means MySQL, 8020 is version 8.0.20 and c10b40 is the name for the configuration file.
The test server is an Intel NUC with 4 cores, 16G RAM and a Samsung 970 EVO. More details are here. Clients and the DBMS share one server. The per-database configs are in the per-database subdirectories here.
The tested DBMS are:
- my5649.cy8 - MySQL 5.6.49, InnoDB and the cy8 config
- my5735.cy8 - MySQL 5.7.35, InnoDB and the cy8 config
- my8020.cy8 - MySQL 8.0.20, InnoDB and the cy8 config
- my8022.cy8 - MySQL 8.0.22, InnoDB and the cy8 config
- my8023.cy8 - MySQL 8.0.23, InnoDB and the cy8 config
- my8026.cy8 - MySQL 8.0.26, InnoDB and the cy8 config
- my8027.cy8 - MySQL 8.0.27, InnoDB and the cy8 config
Contents
- Summary
- l.i0: load without secondary indexes
- l.x: create secondary indexes
- l.i1: continue load after secondary indexes created
- q100.1: range queries with 100 insert/s per client
- q500.1: range queries with 500 insert/s per client
- q1000.1: range queries with 1000 insert/s per client
Summary
The numbers are inserts/s for l.i0 and l.i1, indexed docs (or rows) /s for l.x and queries/s for q*.2. The values are the average rate over the entire test for inserts (IPS) and queries (QPS). The range of values for IPS and QPS is split into 3 parts: bottom 25%, middle 50%, top 25%. Values in the bottom 25% have a red background, values in the top 25% have a green background and values in the middle have no color. A gray background is used for values that can be ignored because the DBMS did not sustain the target insert rate. Red backgrounds are not used when the minimum value is within 80% of the max value.
| dbms | l.i0 | l.x | l.i1 | q100.1 | q500.1 | q1000.1 |
|---|---|---|---|---|---|---|
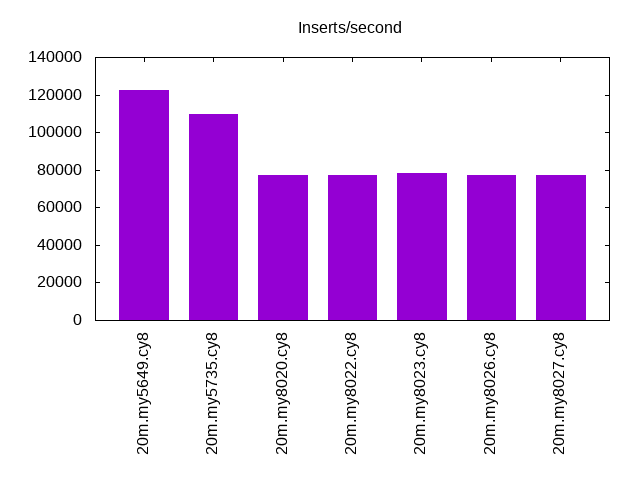
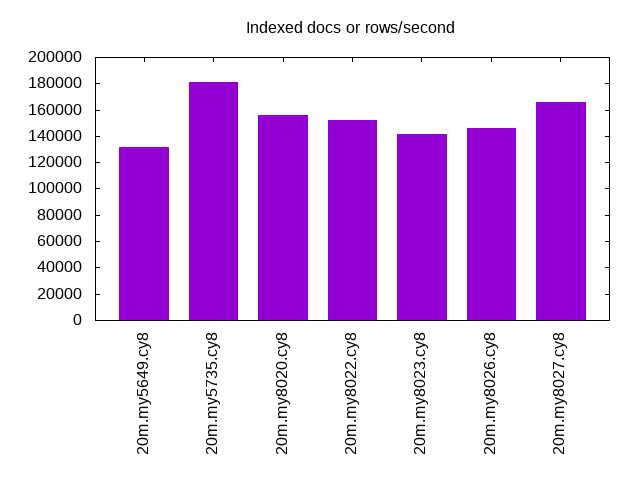
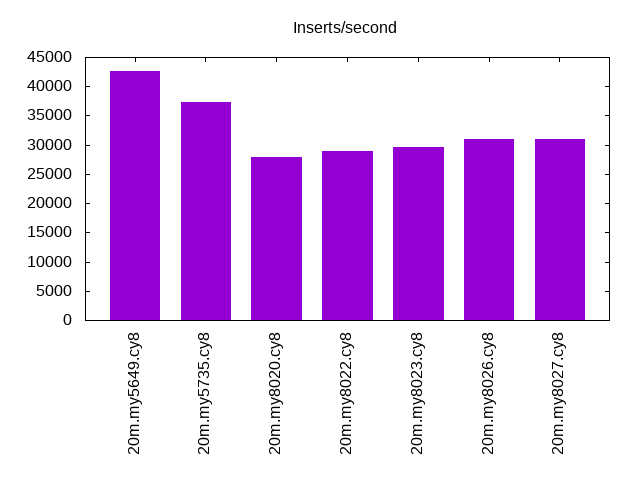
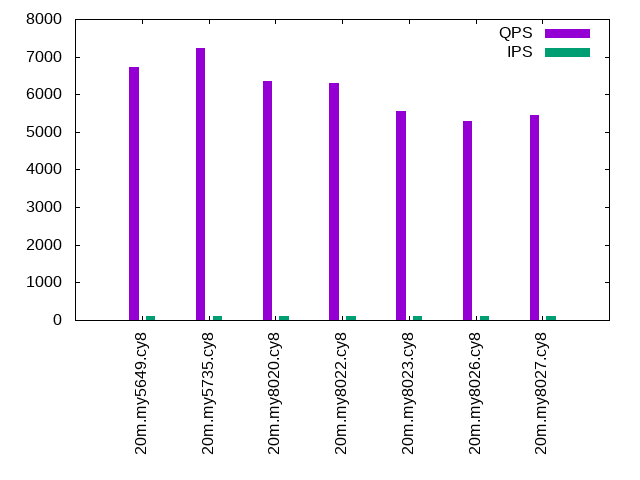
| 20m.my5649.cy8 | 122699 | 131372 | 42553 | 6737 | 7109 | 7249 |
| 20m.my5735.cy8 | 109890 | 181081 | 37383 | 7224 | 7188 | 7057 |
| 20m.my8020.cy8 | 77220 | 155814 | 27816 | 6352 | 6342 | 6228 |
| 20m.my8022.cy8 | 77220 | 152273 | 28944 | 6304 | 6263 | 6198 |
| 20m.my8023.cy8 | 78125 | 141549 | 29586 | 5564 | 5528 | 5396 |
| 20m.my8026.cy8 | 77220 | 145652 | 30960 | 5287 | 5263 | 5196 |
| 20m.my8027.cy8 | 76923 | 166116 | 30912 | 5437 | 5433 | 5340 |
This lists the average rate of inserts/s for the tests that do inserts concurrent with queries. For such tests the query rate is listed in the table above. The read+write tests are setup so that the insert rate should match the target rate every second. Cells that are not at least 95% of the target have a red background to indicate a failure to satisfy the target.
| dbms | q100.1 | q500.1 | q1000.1 |
|---|---|---|---|
| my5649.cy8 | 100 | 500 | 999 |
| my5735.cy8 | 100 | 499 | 999 |
| my8020.cy8 | 100 | 499 | 999 |
| my8022.cy8 | 100 | 499 | 999 |
| my8023.cy8 | 100 | 500 | 999 |
| my8026.cy8 | 100 | 499 | 999 |
| my8027.cy8 | 100 | 500 | 999 |
| target | 100 | 500 | 1000 |
l.i0
l.i0: load without secondary indexes. Graphs for performance per 1-second interval are here.
Average throughput:
Insert response time histogram: each cell has the percentage of responses that take <= the time in the header and max is the max response time in seconds. For the max column values in the top 25% of the range have a red background and in the bottom 25% of the range have a green background. The red background is not used when the min value is within 80% of the max value.
| dbms | 256us | 1ms | 4ms | 16ms | 64ms | 256ms | 1s | 4s | 16s | gt | max |
|---|---|---|---|---|---|---|---|---|---|---|---|
| my5649.cy8 | 98.919 | 0.991 | 0.085 | 0.001 | 0.003 | 0.098 | |||||
| my5735.cy8 | 98.534 | 1.188 | 0.274 | 0.001 | 0.003 | 0.100 | |||||
| my8020.cy8 | 99.572 | 0.390 | 0.037 | 0.001 | 0.103 | ||||||
| my8022.cy8 | 99.697 | 0.223 | 0.079 | 0.001 | 0.108 | ||||||
| my8023.cy8 | 99.712 | 0.222 | 0.066 | 0.001 | 0.085 | ||||||
| my8026.cy8 | 99.682 | 0.284 | 0.034 | 0.054 | |||||||
| my8027.cy8 | 99.686 | 0.278 | 0.036 | 0.045 |
Performance metrics for the DBMS listed above. Some are normalized by throughput, others are not. Legend for results is here.
ips	qps	rps	rmbps	wps	wmbps	rpq	rkbpq	wpi	wkbpi	csps	cpups	cspq	cpupq	dbgb1	dbgb2	rss	maxop	p50	p99	tag
122699	0	1085	4.2	54.6	28.2	0.009	0.035	0.000	0.236	14134	46.3	0.115	15	1.3	41.8	2.1	0.098	124563	108419	20m.my5649.cy8
109890	0	0	0.0	154.3	27.8	0.000	0.000	0.001	0.259	11196	45.9	0.102	17	1.3	42.0	2.4	0.100	110478	94272	20m.my5735.cy8
77220	0	0	0.0	110.5	20.3	0.000	0.000	0.001	0.269	18969	39.9	0.246	21	1.3	41.9	2.6	0.103	77456	68336	20m.my8020.cy8
77220	0	0	0.0	113.0	20.2	0.000	0.000	0.001	0.268	8038	40.8	0.104	21	1.3	41.9	2.6	0.108	77614	68724	20m.my8022.cy8
78125	0	0	0.0	125.7	20.7	0.000	0.000	0.002	0.271	8226	41.1	0.105	21	1.3	41.9	2.6	0.085	78716	72221	20m.my8023.cy8
77220	0	0	0.0	114.0	20.5	0.000	0.000	0.001	0.272	8077	41.0	0.105	21	1.3	41.9	2.6	0.054	77814	72622	20m.my8026.cy8
76923	0	0	0.0	111.2	20.4	0.000	0.000	0.001	0.271	8046	41.1	0.105	21	1.3	41.9	2.6	0.045	77515	70822	20m.my8027.cy8
l.x
l.x: create secondary indexes.
Average throughput:
Performance metrics for the DBMS listed above. Some are normalized by throughput, others are not. Legend for results is here.
ips	qps	rps	rmbps	wps	wmbps	rpq	rkbpq	wpi	wkbpi	csps	cpups	cspq	cpupq	dbgb1	dbgb2	rss	maxop	p50	p99	tag
131372	0	168	57.8	974.3	119.5	0.001	0.451	0.007	0.932	3164	23.7	0.024	7	2.7	43.2	3.5	0.003	NA	NA	20m.my5649.cy8
181081	0	143	54.9	2042.5	159.2	0.001	0.311	0.011	0.900	11104	25.0	0.061	6	3.0	43.6	3.9	0.009	NA	NA	20m.my5735.cy8
155814	0	0	0.0	1320.9	124.9	0.000	0.000	0.008	0.821	8957	24.8	0.057	6	3.0	43.5	3.1	0.017	NA	NA	20m.my8020.cy8
152273	0	0	0.0	1469.7	122.8	0.000	0.000	0.010	0.826	7920	24.5	0.052	6	3.0	43.5	3.1	0.017	NA	NA	20m.my8022.cy8
141549	0	0	0.0	1429.7	115.2	0.000	0.000	0.010	0.833	7434	23.8	0.053	7	3.0	43.5	3.1	0.013	NA	NA	20m.my8023.cy8
145652	0	0	0.0	1371.9	117.9	0.000	0.000	0.009	0.829	7516	24.2	0.052	7	3.0	43.5	3.2	0.021	NA	NA	20m.my8026.cy8
166116	0	982	67.0	3288.4	172.9	0.006	0.413	0.020	1.066	19127	68.5	0.115	16	3.0	43.5	4.0	0.009	NA	NA	20m.my8027.cy8
l.i1
l.i1: continue load after secondary indexes created. Graphs for performance per 1-second interval are here.
Average throughput:
Insert response time histogram: each cell has the percentage of responses that take <= the time in the header and max is the max response time in seconds. For the max column values in the top 25% of the range have a red background and in the bottom 25% of the range have a green background. The red background is not used when the min value is within 80% of the max value.
| dbms | 256us | 1ms | 4ms | 16ms | 64ms | 256ms | 1s | 4s | 16s | gt | max |
|---|---|---|---|---|---|---|---|---|---|---|---|
| my5649.cy8 | 6.321 | 93.253 | 0.421 | 0.005 | 0.001 | 0.133 | |||||
| my5735.cy8 | 99.233 | 0.726 | 0.040 | nonzero | 0.070 | ||||||
| my8020.cy8 | 99.147 | 0.699 | 0.110 | 0.044 | 0.115 | ||||||
| my8022.cy8 | 99.334 | 0.444 | 0.187 | 0.035 | 0.112 | ||||||
| my8023.cy8 | 99.338 | 0.462 | 0.195 | 0.004 | 0.095 | ||||||
| my8026.cy8 | 99.367 | 0.500 | 0.133 | 0.001 | 0.073 | ||||||
| my8027.cy8 | 99.360 | 0.513 | 0.126 | 0.001 | 0.080 |
Performance metrics for the DBMS listed above. Some are normalized by throughput, others are not. Legend for results is here.
ips	qps	rps	rmbps	wps	wmbps	rpq	rkbpq	wpi	wkbpi	csps	cpups	cspq	cpupq	dbgb1	dbgb2	rss	maxop	p50	p99	tag
42553	0	745	2.9	88.4	26.9	0.018	0.070	0.002	0.647	9837	34.1	0.231	32	7.9	48.4	7.9	0.133	43869	6543	20m.my5649.cy8
37383	0	0	0.0	727.0	42.3	0.000	0.000	0.019	1.159	9579	34.1	0.256	36	7.9	48.5	8.3	0.070	38822	4045	20m.my5735.cy8
27816	0	129	2.0	143.1	19.3	0.005	0.074	0.005	0.710	14257	33.2	0.513	48	7.9	48.4	8.5	0.115	29618	599	20m.my8020.cy8
28944	0	134	2.1	145.9	20.0	0.005	0.074	0.005	0.707	6767	32.4	0.234	45	7.9	48.4	8.5	0.112	30816	649	20m.my8022.cy8
29586	0	136	2.1	156.0	20.6	0.005	0.074	0.005	0.714	6750	32.6	0.228	44	7.9	48.4	8.5	0.095	31215	1099	20m.my8023.cy8
30960	0	143	2.2	152.9	21.4	0.005	0.074	0.005	0.709	7036	33.5	0.227	43	7.9	48.4	8.5	0.073	32464	1149	20m.my8026.cy8
30912	0	143	2.2	151.1	21.5	0.005	0.074	0.005	0.711	7024	33.4	0.227	43	7.9	48.4	8.5	0.080	32414	1199	20m.my8027.cy8
q100.1
q100.1: range queries with 100 insert/s per client. Graphs for performance per 1-second interval are here.
Average throughput:
Query response time histogram: each cell has the percentage of responses that take <= the time in the header and max is the max response time in seconds. For max values in the top 25% of the range have a red background and in the bottom 25% of the range have a green background. The red background is not used when the min value is within 80% of the max value.
| dbms | 256us | 1ms | 4ms | 16ms | 64ms | 256ms | 1s | 4s | 16s | gt | max |
|---|---|---|---|---|---|---|---|---|---|---|---|
| my5649.cy8 | 90.205 | 9.791 | 0.001 | 0.002 | nonzero | 0.018 | |||||
| my5735.cy8 | 99.888 | 0.111 | nonzero | nonzero | nonzero | 0.021 | |||||
| my8020.cy8 | 99.328 | 0.671 | nonzero | nonzero | nonzero | 0.020 | |||||
| my8022.cy8 | 99.502 | 0.498 | nonzero | nonzero | nonzero | 0.025 | |||||
| my8023.cy8 | 98.586 | 1.414 | nonzero | nonzero | nonzero | 0.024 | |||||
| my8026.cy8 | 97.844 | 2.156 | nonzero | nonzero | nonzero | 0.021 | |||||
| my8027.cy8 | 98.250 | 1.749 | nonzero | nonzero | nonzero | 0.020 |
Insert response time histogram: each cell has the percentage of responses that take <= the time in the header and max is the max response time in seconds. For max values in the top 25% of the range have a red background and in the bottom 25% of the range have a green background. The red background is not used when the min value is within 80% of the max value.
| dbms | 256us | 1ms | 4ms | 16ms | 64ms | 256ms | 1s | 4s | 16s | gt | max |
|---|---|---|---|---|---|---|---|---|---|---|---|
| my5649.cy8 | 0.021 | 53.694 | 39.125 | 7.160 | 0.020 | ||||||
| my5735.cy8 | 99.271 | 0.500 | 0.229 | 0.027 | |||||||
| my8020.cy8 | 98.896 | 0.965 | 0.139 | 0.025 | |||||||
| my8022.cy8 | 99.285 | 0.458 | 0.257 | 0.028 | |||||||
| my8023.cy8 | 99.181 | 0.688 | 0.132 | 0.028 | |||||||
| my8026.cy8 | 99.222 | 0.681 | 0.097 | 0.024 | |||||||
| my8027.cy8 | 99.208 | 0.646 | 0.146 | 0.025 |
Performance metrics for the DBMS listed above. Some are normalized by throughput, others are not. Legend for results is here.
ips	qps	rps	rmbps	wps	wmbps	rpq	rkbpq	wpi	wkbpi	csps	cpups	cspq	cpupq	dbgb1	dbgb2	rss	maxop	p50	p99	tag
100	6737	2	0.0	6.8	0.2	0.000	0.001	0.068	2.405	25918	25.8	3.847	153	8.2	48.7	8.2	0.018	8284	2621	20m.my5649.cy8
100	7224	0	0.0	16.1	0.5	0.000	0.000	0.161	4.797	27806	27.2	3.849	151	8.2	48.9	8.6	0.021	7224	7128	20m.my5735.cy8
100	6352	0	0.0	46.1	1.1	0.000	0.000	0.462	11.552	25152	29.2	3.960	184	8.2	48.8	8.8	0.020	6361	6188	20m.my8020.cy8
100	6304	0	0.0	45.1	1.1	0.000	0.000	0.452	11.603	24360	26.9	3.864	171	8.2	48.8	8.8	0.025	6313	6185	20m.my8022.cy8
100	5564	0	0.0	56.4	1.3	0.000	0.000	0.564	13.206	21583	26.6	3.879	191	8.2	48.8	8.8	0.024	5562	5434	20m.my8023.cy8
100	5287	0	0.0	56.2	1.3	0.000	0.000	0.564	13.202	20522	26.5	3.882	200	8.2	48.8	8.8	0.021	5290	5178	20m.my8026.cy8
100	5437	0	0.0	56.4	1.3	0.000	0.000	0.565	13.233	21103	26.7	3.881	196	8.2	48.8	8.8	0.020	5434	5322	20m.my8027.cy8
q500.1
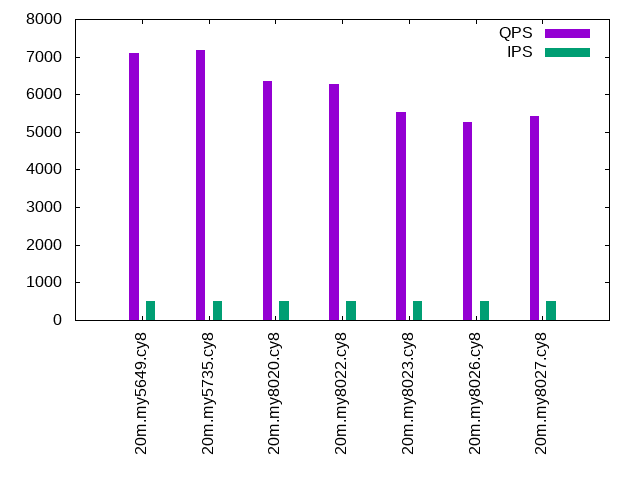
q500.1: range queries with 500 insert/s per client. Graphs for performance per 1-second interval are here.
Average throughput:
Query response time histogram: each cell has the percentage of responses that take <= the time in the header and max is the max response time in seconds. For max values in the top 25% of the range have a red background and in the bottom 25% of the range have a green background. The red background is not used when the min value is within 80% of the max value.
| dbms | 256us | 1ms | 4ms | 16ms | 64ms | 256ms | 1s | 4s | 16s | gt | max |
|---|---|---|---|---|---|---|---|---|---|---|---|
| my5649.cy8 | 93.039 | 6.956 | 0.003 | 0.002 | nonzero | 0.017 | |||||
| my5735.cy8 | 99.791 | 0.207 | 0.002 | nonzero | nonzero | 0.025 | |||||
| my8020.cy8 | 99.270 | 0.728 | 0.001 | nonzero | nonzero | 0.026 | |||||
| my8022.cy8 | 99.311 | 0.687 | 0.002 | nonzero | nonzero | 0.027 | |||||
| my8023.cy8 | 98.274 | 1.724 | 0.002 | nonzero | nonzero | 0.025 | |||||
| my8026.cy8 | 97.505 | 2.493 | 0.002 | nonzero | nonzero | 0.020 | |||||
| my8027.cy8 | 98.005 | 1.992 | 0.002 | nonzero | nonzero | 0.023 |
Insert response time histogram: each cell has the percentage of responses that take <= the time in the header and max is the max response time in seconds. For max values in the top 25% of the range have a red background and in the bottom 25% of the range have a green background. The red background is not used when the min value is within 80% of the max value.
| dbms | 256us | 1ms | 4ms | 16ms | 64ms | 256ms | 1s | 4s | 16s | gt | max |
|---|---|---|---|---|---|---|---|---|---|---|---|
| my5649.cy8 | 0.296 | 90.168 | 9.031 | 0.506 | 0.021 | ||||||
| my5735.cy8 | 99.686 | 0.215 | 0.099 | 0.028 | |||||||
| my8020.cy8 | 99.025 | 0.899 | 0.076 | 0.030 | |||||||
| my8022.cy8 | 99.644 | 0.249 | 0.107 | 0.029 | |||||||
| my8023.cy8 | 99.618 | 0.314 | 0.068 | 0.028 | |||||||
| my8026.cy8 | 99.622 | 0.326 | 0.051 | 0.028 | |||||||
| my8027.cy8 | 99.643 | 0.308 | 0.049 | 0.042 |
Performance metrics for the DBMS listed above. Some are normalized by throughput, others are not. Legend for results is here.
ips	qps	rps	rmbps	wps	wmbps	rpq	rkbpq	wpi	wkbpi	csps	cpups	cspq	cpupq	dbgb1	dbgb2	rss	maxop	p50	p99	tag
500	7109	9	0.0	3.8	0.3	0.001	0.005	0.008	0.655	27391	26.3	3.853	148	9.0	49.5	8.9	0.017	8295	2893	20m.my5649.cy8
499	7188	0	0.0	11.6	0.5	0.000	0.000	0.023	1.015	27724	27.7	3.857	154	9.0	49.6	9.3	0.025	7192	7051	20m.my5735.cy8
499	6342	0	0.0	7.1	0.4	0.000	0.000	0.014	0.747	25163	29.2	3.967	184	9.0	49.5	9.5	0.026	6345	6185	20m.my8020.cy8
499	6263	0	0.0	7.0	0.4	0.000	0.000	0.014	0.752	24184	27.3	3.861	174	9.0	49.5	9.5	0.027	6265	6121	20m.my8022.cy8
500	5528	0	0.0	20.1	0.5	0.000	0.000	0.040	1.105	21404	26.9	3.872	195	9.0	49.5	9.5	0.025	5530	5402	20m.my8023.cy8
499	5263	0	0.0	19.9	0.5	0.000	0.000	0.040	1.105	20395	27.0	3.875	205	9.0	49.6	9.5	0.020	5261	5146	20m.my8026.cy8
500	5433	0	0.0	20.0	0.5	0.000	0.000	0.040	1.105	21042	27.1	3.873	200	9.0	49.5	9.5	0.023	5434	5322	20m.my8027.cy8
q1000.1
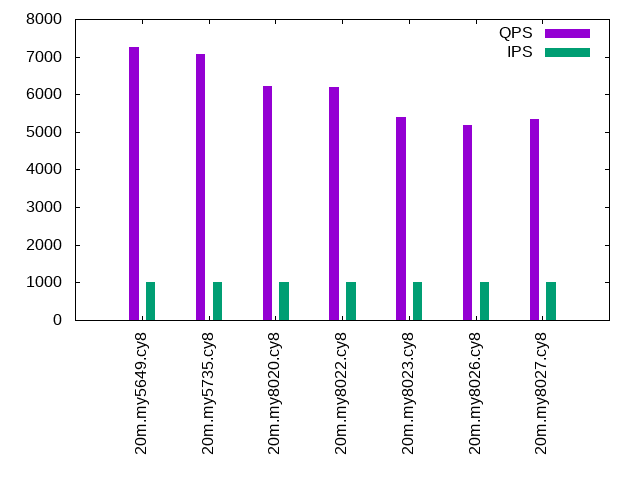
q1000.1: range queries with 1000 insert/s per client. Graphs for performance per 1-second interval are here.
Average throughput:
Query response time histogram: each cell has the percentage of responses that take <= the time in the header and max is the max response time in seconds. For max values in the top 25% of the range have a red background and in the bottom 25% of the range have a green background. The red background is not used when the min value is within 80% of the max value.
| dbms | 256us | 1ms | 4ms | 16ms | 64ms | 256ms | 1s | 4s | 16s | gt | max |
|---|---|---|---|---|---|---|---|---|---|---|---|
| my5649.cy8 | 94.589 | 5.403 | 0.006 | 0.002 | nonzero | 0.019 | |||||
| my5735.cy8 | 99.577 | 0.418 | 0.005 | nonzero | nonzero | 0.023 | |||||
| my8020.cy8 | 99.021 | 0.977 | 0.002 | nonzero | nonzero | 0.022 | |||||
| my8022.cy8 | 98.943 | 1.051 | 0.005 | nonzero | nonzero | 0.027 | |||||
| my8023.cy8 | 97.400 | 2.594 | 0.006 | nonzero | nonzero | 0.027 | |||||
| my8026.cy8 | 96.870 | 3.124 | 0.006 | nonzero | nonzero | 0.020 | |||||
| my8027.cy8 | 97.332 | 2.661 | 0.006 | nonzero | nonzero | 0.023 |
Insert response time histogram: each cell has the percentage of responses that take <= the time in the header and max is the max response time in seconds. For max values in the top 25% of the range have a red background and in the bottom 25% of the range have a green background. The red background is not used when the min value is within 80% of the max value.
| dbms | 256us | 1ms | 4ms | 16ms | 64ms | 256ms | 1s | 4s | 16s | gt | max |
|---|---|---|---|---|---|---|---|---|---|---|---|
| my5649.cy8 | 0.253 | 94.840 | 4.748 | 0.159 | 0.021 | ||||||
| my5735.cy8 | 99.739 | 0.210 | 0.051 | 0.027 | |||||||
| my8020.cy8 | 98.571 | 1.352 | 0.077 | 0.027 | |||||||
| my8022.cy8 | 99.685 | 0.244 | 0.070 | 0.039 | |||||||
| my8023.cy8 | 99.698 | 0.252 | 0.050 | 0.034 | |||||||
| my8026.cy8 | 99.703 | 0.262 | 0.035 | 0.042 | |||||||
| my8027.cy8 | 99.710 | 0.253 | 0.037 | 0.039 |
Performance metrics for the DBMS listed above. Some are normalized by throughput, others are not. Legend for results is here.
ips	qps	rps	rmbps	wps	wmbps	rpq	rkbpq	wpi	wkbpi	csps	cpups	cspq	cpupq	dbgb1	dbgb2	rss	maxop	p50	p99	tag
999	7249	18	0.1	4.1	0.5	0.002	0.010	0.004	0.530	28028	26.9	3.867	148	10.1	50.6	9.9	0.019	8167	2956	20m.my5649.cy8
999	7057	0	0.0	30.2	1.1	0.000	0.000	0.030	1.154	27356	28.0	3.876	159	10.1	50.8	10.3	0.023	7064	6872	20m.my5735.cy8
999	6228	0	0.0	27.6	1.0	0.000	0.000	0.028	0.991	25093	29.8	4.029	191	10.1	50.7	10.5	0.022	6233	6061	20m.my8020.cy8
999	6198	0	0.0	23.7	0.9	0.000	0.000	0.024	0.969	24049	27.8	3.880	179	10.1	50.6	10.5	0.027	6201	6028	20m.my8022.cy8
999	5396	0	0.0	20.8	0.8	0.000	0.000	0.021	0.775	20992	27.3	3.890	202	10.1	50.7	10.5	0.027	5402	5244	20m.my8023.cy8
999	5196	0	0.0	20.5	0.7	0.000	0.000	0.020	0.765	20234	27.2	3.894	209	10.1	50.7	10.5	0.020	5195	5066	20m.my8026.cy8
999	5340	0	0.0	20.4	0.7	0.000	0.000	0.020	0.763	20773	27.4	3.890	205	10.1	50.7	10.5	0.023	5338	5196	20m.my8027.cy8
l.i0
l.i0: load without secondary indexes
Performance metrics for all DBMS, not just the ones listed above. Some are normalized by throughput, others are not. Legend for results is here.
ips	qps	rps	rmbps	wps	wmbps	rpq	rkbpq	wpi	wkbpi	csps	cpups	cspq	cpupq	dbgb1	dbgb2	rss	maxop	p50	p99	tag
122699	0	1085	4.2	54.6	28.2	0.009	0.035	0.000	0.236	14134	46.3	0.115	15	1.3	41.8	2.1	0.098	124563	108419	20m.my5649.cy8
109890	0	0	0.0	154.3	27.8	0.000	0.000	0.001	0.259	11196	45.9	0.102	17	1.3	42.0	2.4	0.100	110478	94272	20m.my5735.cy8
77220	0	0	0.0	110.5	20.3	0.000	0.000	0.001	0.269	18969	39.9	0.246	21	1.3	41.9	2.6	0.103	77456	68336	20m.my8020.cy8
77220	0	0	0.0	113.0	20.2	0.000	0.000	0.001	0.268	8038	40.8	0.104	21	1.3	41.9	2.6	0.108	77614	68724	20m.my8022.cy8
78125	0	0	0.0	125.7	20.7	0.000	0.000	0.002	0.271	8226	41.1	0.105	21	1.3	41.9	2.6	0.085	78716	72221	20m.my8023.cy8
77220	0	0	0.0	114.0	20.5	0.000	0.000	0.001	0.272	8077	41.0	0.105	21	1.3	41.9	2.6	0.054	77814	72622	20m.my8026.cy8
76923	0	0	0.0	111.2	20.4	0.000	0.000	0.001	0.271	8046	41.1	0.105	21	1.3	41.9	2.6	0.045	77515	70822	20m.my8027.cy8
l.x
l.x: create secondary indexes
Performance metrics for all DBMS, not just the ones listed above. Some are normalized by throughput, others are not. Legend for results is here.
ips	qps	rps	rmbps	wps	wmbps	rpq	rkbpq	wpi	wkbpi	csps	cpups	cspq	cpupq	dbgb1	dbgb2	rss	maxop	p50	p99	tag
131372	0	168	57.8	974.3	119.5	0.001	0.451	0.007	0.932	3164	23.7	0.024	7	2.7	43.2	3.5	0.003	NA	NA	20m.my5649.cy8
181081	0	143	54.9	2042.5	159.2	0.001	0.311	0.011	0.900	11104	25.0	0.061	6	3.0	43.6	3.9	0.009	NA	NA	20m.my5735.cy8
155814	0	0	0.0	1320.9	124.9	0.000	0.000	0.008	0.821	8957	24.8	0.057	6	3.0	43.5	3.1	0.017	NA	NA	20m.my8020.cy8
152273	0	0	0.0	1469.7	122.8	0.000	0.000	0.010	0.826	7920	24.5	0.052	6	3.0	43.5	3.1	0.017	NA	NA	20m.my8022.cy8
141549	0	0	0.0	1429.7	115.2	0.000	0.000	0.010	0.833	7434	23.8	0.053	7	3.0	43.5	3.1	0.013	NA	NA	20m.my8023.cy8
145652	0	0	0.0	1371.9	117.9	0.000	0.000	0.009	0.829	7516	24.2	0.052	7	3.0	43.5	3.2	0.021	NA	NA	20m.my8026.cy8
166116	0	982	67.0	3288.4	172.9	0.006	0.413	0.020	1.066	19127	68.5	0.115	16	3.0	43.5	4.0	0.009	NA	NA	20m.my8027.cy8
l.i1
l.i1: continue load after secondary indexes created
Performance metrics for all DBMS, not just the ones listed above. Some are normalized by throughput, others are not. Legend for results is here.
ips	qps	rps	rmbps	wps	wmbps	rpq	rkbpq	wpi	wkbpi	csps	cpups	cspq	cpupq	dbgb1	dbgb2	rss	maxop	p50	p99	tag
42553	0	745	2.9	88.4	26.9	0.018	0.070	0.002	0.647	9837	34.1	0.231	32	7.9	48.4	7.9	0.133	43869	6543	20m.my5649.cy8
37383	0	0	0.0	727.0	42.3	0.000	0.000	0.019	1.159	9579	34.1	0.256	36	7.9	48.5	8.3	0.070	38822	4045	20m.my5735.cy8
27816	0	129	2.0	143.1	19.3	0.005	0.074	0.005	0.710	14257	33.2	0.513	48	7.9	48.4	8.5	0.115	29618	599	20m.my8020.cy8
28944	0	134	2.1	145.9	20.0	0.005	0.074	0.005	0.707	6767	32.4	0.234	45	7.9	48.4	8.5	0.112	30816	649	20m.my8022.cy8
29586	0	136	2.1	156.0	20.6	0.005	0.074	0.005	0.714	6750	32.6	0.228	44	7.9	48.4	8.5	0.095	31215	1099	20m.my8023.cy8
30960	0	143	2.2	152.9	21.4	0.005	0.074	0.005	0.709	7036	33.5	0.227	43	7.9	48.4	8.5	0.073	32464	1149	20m.my8026.cy8
30912	0	143	2.2	151.1	21.5	0.005	0.074	0.005	0.711	7024	33.4	0.227	43	7.9	48.4	8.5	0.080	32414	1199	20m.my8027.cy8
q100.1
q100.1: range queries with 100 insert/s per client
Performance metrics for all DBMS, not just the ones listed above. Some are normalized by throughput, others are not. Legend for results is here.
ips	qps	rps	rmbps	wps	wmbps	rpq	rkbpq	wpi	wkbpi	csps	cpups	cspq	cpupq	dbgb1	dbgb2	rss	maxop	p50	p99	tag
100	6737	2	0.0	6.8	0.2	0.000	0.001	0.068	2.405	25918	25.8	3.847	153	8.2	48.7	8.2	0.018	8284	2621	20m.my5649.cy8
100	7224	0	0.0	16.1	0.5	0.000	0.000	0.161	4.797	27806	27.2	3.849	151	8.2	48.9	8.6	0.021	7224	7128	20m.my5735.cy8
100	6352	0	0.0	46.1	1.1	0.000	0.000	0.462	11.552	25152	29.2	3.960	184	8.2	48.8	8.8	0.020	6361	6188	20m.my8020.cy8
100	6304	0	0.0	45.1	1.1	0.000	0.000	0.452	11.603	24360	26.9	3.864	171	8.2	48.8	8.8	0.025	6313	6185	20m.my8022.cy8
100	5564	0	0.0	56.4	1.3	0.000	0.000	0.564	13.206	21583	26.6	3.879	191	8.2	48.8	8.8	0.024	5562	5434	20m.my8023.cy8
100	5287	0	0.0	56.2	1.3	0.000	0.000	0.564	13.202	20522	26.5	3.882	200	8.2	48.8	8.8	0.021	5290	5178	20m.my8026.cy8
100	5437	0	0.0	56.4	1.3	0.000	0.000	0.565	13.233	21103	26.7	3.881	196	8.2	48.8	8.8	0.020	5434	5322	20m.my8027.cy8
q500.1
q500.1: range queries with 500 insert/s per client
Performance metrics for all DBMS, not just the ones listed above. Some are normalized by throughput, others are not. Legend for results is here.
ips	qps	rps	rmbps	wps	wmbps	rpq	rkbpq	wpi	wkbpi	csps	cpups	cspq	cpupq	dbgb1	dbgb2	rss	maxop	p50	p99	tag
500	7109	9	0.0	3.8	0.3	0.001	0.005	0.008	0.655	27391	26.3	3.853	148	9.0	49.5	8.9	0.017	8295	2893	20m.my5649.cy8
499	7188	0	0.0	11.6	0.5	0.000	0.000	0.023	1.015	27724	27.7	3.857	154	9.0	49.6	9.3	0.025	7192	7051	20m.my5735.cy8
499	6342	0	0.0	7.1	0.4	0.000	0.000	0.014	0.747	25163	29.2	3.967	184	9.0	49.5	9.5	0.026	6345	6185	20m.my8020.cy8
499	6263	0	0.0	7.0	0.4	0.000	0.000	0.014	0.752	24184	27.3	3.861	174	9.0	49.5	9.5	0.027	6265	6121	20m.my8022.cy8
500	5528	0	0.0	20.1	0.5	0.000	0.000	0.040	1.105	21404	26.9	3.872	195	9.0	49.5	9.5	0.025	5530	5402	20m.my8023.cy8
499	5263	0	0.0	19.9	0.5	0.000	0.000	0.040	1.105	20395	27.0	3.875	205	9.0	49.6	9.5	0.020	5261	5146	20m.my8026.cy8
500	5433	0	0.0	20.0	0.5	0.000	0.000	0.040	1.105	21042	27.1	3.873	200	9.0	49.5	9.5	0.023	5434	5322	20m.my8027.cy8
q1000.1
q1000.1: range queries with 1000 insert/s per client
Performance metrics for all DBMS, not just the ones listed above. Some are normalized by throughput, others are not. Legend for results is here.
ips	qps	rps	rmbps	wps	wmbps	rpq	rkbpq	wpi	wkbpi	csps	cpups	cspq	cpupq	dbgb1	dbgb2	rss	maxop	p50	p99	tag
999	7249	18	0.1	4.1	0.5	0.002	0.010	0.004	0.530	28028	26.9	3.867	148	10.1	50.6	9.9	0.019	8167	2956	20m.my5649.cy8
999	7057	0	0.0	30.2	1.1	0.000	0.000	0.030	1.154	27356	28.0	3.876	159	10.1	50.8	10.3	0.023	7064	6872	20m.my5735.cy8
999	6228	0	0.0	27.6	1.0	0.000	0.000	0.028	0.991	25093	29.8	4.029	191	10.1	50.7	10.5	0.022	6233	6061	20m.my8020.cy8
999	6198	0	0.0	23.7	0.9	0.000	0.000	0.024	0.969	24049	27.8	3.880	179	10.1	50.6	10.5	0.027	6201	6028	20m.my8022.cy8
999	5396	0	0.0	20.8	0.8	0.000	0.000	0.021	0.775	20992	27.3	3.890	202	10.1	50.7	10.5	0.027	5402	5244	20m.my8023.cy8
999	5196	0	0.0	20.5	0.7	0.000	0.000	0.020	0.765	20234	27.2	3.894	209	10.1	50.7	10.5	0.020	5195	5066	20m.my8026.cy8
999	5340	0	0.0	20.4	0.7	0.000	0.000	0.020	0.763	20773	27.4	3.890	205	10.1	50.7	10.5	0.023	5338	5196	20m.my8027.cy8
l.i0
- l.i0: load without secondary indexes
- Legend for results is here.
- Each entry lists the percentage of responses that fit in that bucket (slower than max time for previous bucket, faster than min time for next bucket).
Insert response time histogram
256us	1ms	4ms	16ms	64ms	256ms	1s	4s	16s	gt	max	tag
0.000	98.919	0.991	0.085	0.001	0.003	0.000	0.000	0.000	0.000	0.098	my5649.cy8
0.000	98.534	1.188	0.274	0.001	0.003	0.000	0.000	0.000	0.000	0.100	my5735.cy8
0.000	0.000	99.572	0.390	0.037	0.001	0.000	0.000	0.000	0.000	0.103	my8020.cy8
0.000	0.000	99.697	0.223	0.079	0.001	0.000	0.000	0.000	0.000	0.108	my8022.cy8
0.000	0.000	99.712	0.222	0.066	0.001	0.000	0.000	0.000	0.000	0.085	my8023.cy8
0.000	0.000	99.682	0.284	0.034	0.000	0.000	0.000	0.000	0.000	0.054	my8026.cy8
0.000	0.000	99.686	0.278	0.036	0.000	0.000	0.000	0.000	0.000	0.045	my8027.cy8
l.x
- l.x: create secondary indexes
- Legend for results is here.
- Each entry lists the percentage of responses that fit in that bucket (slower than max time for previous bucket, faster than min time for next bucket).
TODO - determine whether there is data for create index response time
l.i1
- l.i1: continue load after secondary indexes created
- Legend for results is here.
- Each entry lists the percentage of responses that fit in that bucket (slower than max time for previous bucket, faster than min time for next bucket).
Insert response time histogram
256us	1ms	4ms	16ms	64ms	256ms	1s	4s	16s	gt	max	tag
0.000	6.321	93.253	0.421	0.005	0.001	0.000	0.000	0.000	0.000	0.133	my5649.cy8
0.000	0.000	99.233	0.726	0.040	nonzero	0.000	0.000	0.000	0.000	0.070	my5735.cy8
0.000	0.000	99.147	0.699	0.110	0.044	0.000	0.000	0.000	0.000	0.115	my8020.cy8
0.000	0.000	99.334	0.444	0.187	0.035	0.000	0.000	0.000	0.000	0.112	my8022.cy8
0.000	0.000	99.338	0.462	0.195	0.004	0.000	0.000	0.000	0.000	0.095	my8023.cy8
0.000	0.000	99.367	0.500	0.133	0.001	0.000	0.000	0.000	0.000	0.073	my8026.cy8
0.000	0.000	99.360	0.513	0.126	0.001	0.000	0.000	0.000	0.000	0.080	my8027.cy8
q100.1
- q100.1: range queries with 100 insert/s per client
- Legend for results is here.
- Each entry lists the percentage of responses that fit in that bucket (slower than max time for previous bucket, faster than min time for next bucket).
Query response time histogram
256us	1ms	4ms	16ms	64ms	256ms	1s	4s	16s	gt	max	tag
90.205	9.791	0.001	0.002	nonzero	0.000	0.000	0.000	0.000	0.000	0.018	my5649.cy8
99.888	0.111	nonzero	nonzero	nonzero	0.000	0.000	0.000	0.000	0.000	0.021	my5735.cy8
99.328	0.671	nonzero	nonzero	nonzero	0.000	0.000	0.000	0.000	0.000	0.020	my8020.cy8
99.502	0.498	nonzero	nonzero	nonzero	0.000	0.000	0.000	0.000	0.000	0.025	my8022.cy8
98.586	1.414	nonzero	nonzero	nonzero	0.000	0.000	0.000	0.000	0.000	0.024	my8023.cy8
97.844	2.156	nonzero	nonzero	nonzero	0.000	0.000	0.000	0.000	0.000	0.021	my8026.cy8
98.250	1.749	nonzero	nonzero	nonzero	0.000	0.000	0.000	0.000	0.000	0.020	my8027.cy8
Insert response time histogram
256us	1ms	4ms	16ms	64ms	256ms	1s	4s	16s	gt	max	tag
0.000	0.021	53.694	39.125	7.160	0.000	0.000	0.000	0.000	0.000	0.020	my5649.cy8
0.000	0.000	99.271	0.500	0.229	0.000	0.000	0.000	0.000	0.000	0.027	my5735.cy8
0.000	0.000	98.896	0.965	0.139	0.000	0.000	0.000	0.000	0.000	0.025	my8020.cy8
0.000	0.000	99.285	0.458	0.257	0.000	0.000	0.000	0.000	0.000	0.028	my8022.cy8
0.000	0.000	99.181	0.688	0.132	0.000	0.000	0.000	0.000	0.000	0.028	my8023.cy8
0.000	0.000	99.222	0.681	0.097	0.000	0.000	0.000	0.000	0.000	0.024	my8026.cy8
0.000	0.000	99.208	0.646	0.146	0.000	0.000	0.000	0.000	0.000	0.025	my8027.cy8
q500.1
- q500.1: range queries with 500 insert/s per client
- Legend for results is here.
- Each entry lists the percentage of responses that fit in that bucket (slower than max time for previous bucket, faster than min time for next bucket).
Query response time histogram
256us	1ms	4ms	16ms	64ms	256ms	1s	4s	16s	gt	max	tag
93.039	6.956	0.003	0.002	nonzero	0.000	0.000	0.000	0.000	0.000	0.017	my5649.cy8
99.791	0.207	0.002	nonzero	nonzero	0.000	0.000	0.000	0.000	0.000	0.025	my5735.cy8
99.270	0.728	0.001	nonzero	nonzero	0.000	0.000	0.000	0.000	0.000	0.026	my8020.cy8
99.311	0.687	0.002	nonzero	nonzero	0.000	0.000	0.000	0.000	0.000	0.027	my8022.cy8
98.274	1.724	0.002	nonzero	nonzero	0.000	0.000	0.000	0.000	0.000	0.025	my8023.cy8
97.505	2.493	0.002	nonzero	nonzero	0.000	0.000	0.000	0.000	0.000	0.020	my8026.cy8
98.005	1.992	0.002	nonzero	nonzero	0.000	0.000	0.000	0.000	0.000	0.023	my8027.cy8
Insert response time histogram
256us	1ms	4ms	16ms	64ms	256ms	1s	4s	16s	gt	max	tag
0.000	0.296	90.168	9.031	0.506	0.000	0.000	0.000	0.000	0.000	0.021	my5649.cy8
0.000	0.000	99.686	0.215	0.099	0.000	0.000	0.000	0.000	0.000	0.028	my5735.cy8
0.000	0.000	99.025	0.899	0.076	0.000	0.000	0.000	0.000	0.000	0.030	my8020.cy8
0.000	0.000	99.644	0.249	0.107	0.000	0.000	0.000	0.000	0.000	0.029	my8022.cy8
0.000	0.000	99.618	0.314	0.068	0.000	0.000	0.000	0.000	0.000	0.028	my8023.cy8
0.000	0.000	99.622	0.326	0.051	0.000	0.000	0.000	0.000	0.000	0.028	my8026.cy8
0.000	0.000	99.643	0.308	0.049	0.000	0.000	0.000	0.000	0.000	0.042	my8027.cy8
q1000.1
- q1000.1: range queries with 1000 insert/s per client
- Legend for results is here.
- Each entry lists the percentage of responses that fit in that bucket (slower than max time for previous bucket, faster than min time for next bucket).
Query response time histogram
256us	1ms	4ms	16ms	64ms	256ms	1s	4s	16s	gt	max	tag
94.589	5.403	0.006	0.002	nonzero	0.000	0.000	0.000	0.000	0.000	0.019	my5649.cy8
99.577	0.418	0.005	nonzero	nonzero	0.000	0.000	0.000	0.000	0.000	0.023	my5735.cy8
99.021	0.977	0.002	nonzero	nonzero	0.000	0.000	0.000	0.000	0.000	0.022	my8020.cy8
98.943	1.051	0.005	nonzero	nonzero	0.000	0.000	0.000	0.000	0.000	0.027	my8022.cy8
97.400	2.594	0.006	nonzero	nonzero	0.000	0.000	0.000	0.000	0.000	0.027	my8023.cy8
96.870	3.124	0.006	nonzero	nonzero	0.000	0.000	0.000	0.000	0.000	0.020	my8026.cy8
97.332	2.661	0.006	nonzero	nonzero	0.000	0.000	0.000	0.000	0.000	0.023	my8027.cy8
Insert response time histogram
256us	1ms	4ms	16ms	64ms	256ms	1s	4s	16s	gt	max	tag
0.000	0.253	94.840	4.748	0.159	0.000	0.000	0.000	0.000	0.000	0.021	my5649.cy8
0.000	0.000	99.739	0.210	0.051	0.000	0.000	0.000	0.000	0.000	0.027	my5735.cy8
0.000	0.000	98.571	1.352	0.077	0.000	0.000	0.000	0.000	0.000	0.027	my8020.cy8
0.000	0.000	99.685	0.244	0.070	0.000	0.000	0.000	0.000	0.000	0.039	my8022.cy8
0.000	0.000	99.698	0.252	0.050	0.000	0.000	0.000	0.000	0.000	0.034	my8023.cy8
0.000	0.000	99.703	0.262	0.035	0.000	0.000	0.000	0.000	0.000	0.042	my8026.cy8
0.000	0.000	99.710	0.253	0.037	0.000	0.000	0.000	0.000	0.000	0.039	my8027.cy8