Introduction
This is a report for the insert benchmark with 20M docs and 1 client(s). It is generated by scripts (bash, awk, sed) and Tufte might not be impressed. An overview of the insert benchmark is here and a short update is here. Below, by DBMS, I mean DBMS+version.config. An example is my8020.c10b40 where my means MySQL, 8020 is version 8.0.20 and c10b40 is the name for the configuration file.
The test server is an Intel NUC with 4 cores, 16G RAM and a Samsung 970 EVO. More details are here. Clients and the DBMS share one server. The per-database configs are in the per-database subdirectories here.
The tested DBMS are:
- fbmy5635.cy9c - FB MySQL 5.6.35, MyRocks and the cy9c config
- fbmy8020.cy9c - FB MySQL 8.0.20, MyRocks and the cy9c config
Contents
- Summary
- l.i0: load without secondary indexes
- l.x: create secondary indexes
- l.i1: continue load after secondary indexes created
- q100.1: range queries with 100 insert/s per client
- q500.1: range queries with 500 insert/s per client
- q1000.1: range queries with 1000 insert/s per client
Summary
The numbers are inserts/s for l.i0 and l.i1, indexed docs (or rows) /s for l.x and queries/s for q*.2. The values are the average rate over the entire test for inserts (IPS) and queries (QPS). The range of values for IPS and QPS is split into 3 parts: bottom 25%, middle 50%, top 25%. Values in the bottom 25% have a red background, values in the top 25% have a green background and values in the middle have no color. A gray background is used for values that can be ignored because the DBMS did not sustain the target insert rate. Red backgrounds are not used when the minimum value is within 80% of the max value.
| dbms | l.i0 | l.x | l.i1 | q100.1 | q500.1 | q1000.1 |
|---|---|---|---|---|---|---|
| 20m.fbmy5635.cy9c | 108696 | 110440 | 42017 | 4974 | 4951 | 4917 |
| 20m.fbmy8020.cy9c | 77519 | 103077 | 32733 | 4503 | 4478 | 4435 |
This lists the average rate of inserts/s for the tests that do inserts concurrent with queries. For such tests the query rate is listed in the table above. The read+write tests are setup so that the insert rate should match the target rate every second. Cells that are not at least 95% of the target have a red background to indicate a failure to satisfy the target.
| dbms | q100.1 | q500.1 | q1000.1 |
|---|---|---|---|
| fbmy5635.cy9c | 100 | 500 | 999 |
| fbmy8020.cy9c | 100 | 500 | 999 |
| target | 100 | 500 | 1000 |
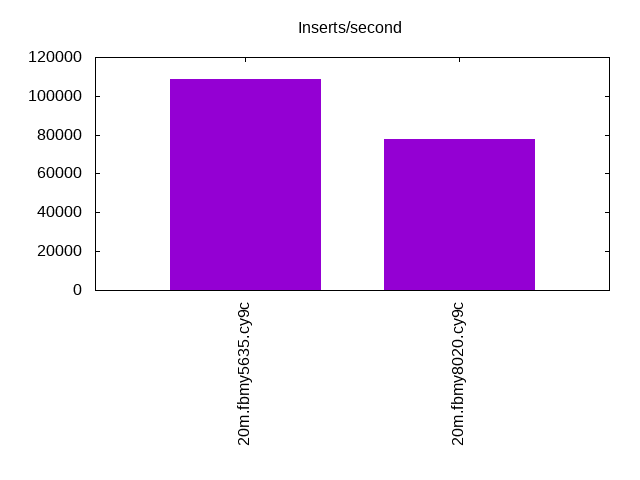
l.i0
l.i0: load without secondary indexes. Graphs for performance per 1-second interval are here.
Average throughput:
Insert response time histogram: each cell has the percentage of responses that take <= the time in the header and max is the max response time in seconds. For the max column values in the top 25% of the range have a red background and in the bottom 25% of the range have a green background. The red background is not used when the min value is within 80% of the max value.
| dbms | 256us | 1ms | 4ms | 16ms | 64ms | 256ms | 1s | 4s | 16s | gt | max |
|---|---|---|---|---|---|---|---|---|---|---|---|
| fbmy5635.cy9c | 98.391 | 1.559 | 0.046 | 0.001 | 0.003 | 0.113 | |||||
| fbmy8020.cy9c | 99.823 | 0.159 | 0.017 | 0.001 | 0.117 |
Performance metrics for the DBMS listed above. Some are normalized by throughput, others are not. Legend for results is here.
ips	qps	rps	rmbps	wps	wmbps	rpq	rkbpq	wpi	wkbpi	csps	cpups	cspq	cpupq	dbgb1	dbgb2	rss	maxop	p50	p99	tag
108696	0	0	0.0	43.9	18.5	0.000	0.000	0.000	0.174	11150	48.2	0.103	18	0.7	1.8	0.2	0.113	110882	94499	20m.fbmy5635.cy9c
77519	0	0	0.0	43.2	15.1	0.000	0.000	0.001	0.200	8293	42.9	0.107	22	0.7	1.9	0.6	0.117	78652	67626	20m.fbmy8020.cy9c
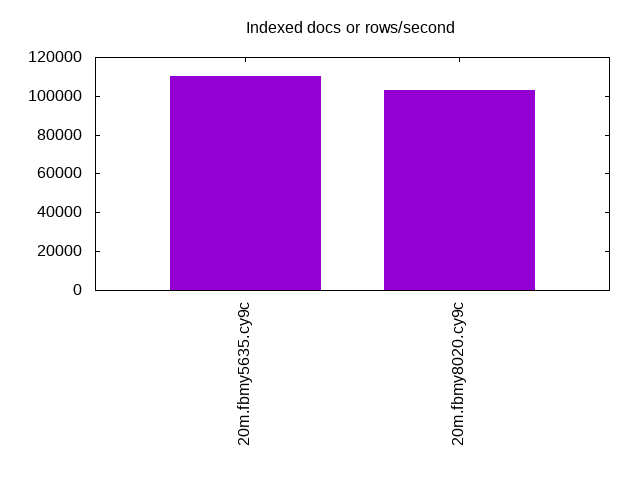
l.x
l.x: create secondary indexes.
Average throughput:
Performance metrics for the DBMS listed above. Some are normalized by throughput, others are not. Legend for results is here.
ips	qps	rps	rmbps	wps	wmbps	rpq	rkbpq	wpi	wkbpi	csps	cpups	cspq	cpupq	dbgb1	dbgb2	rss	maxop	p50	p99	tag
110440	0	0	0.0	27.5	16.8	0.000	0.000	0.000	0.155	747	25.1	0.007	9	1.5	2.5	1.3	0.016	NA	NA	20m.fbmy5635.cy9c
103077	0	0	0.0	25.0	15.7	0.000	0.000	0.000	0.156	886	25.3	0.009	10	1.4	2.6	1.8	0.006	NA	NA	20m.fbmy8020.cy9c
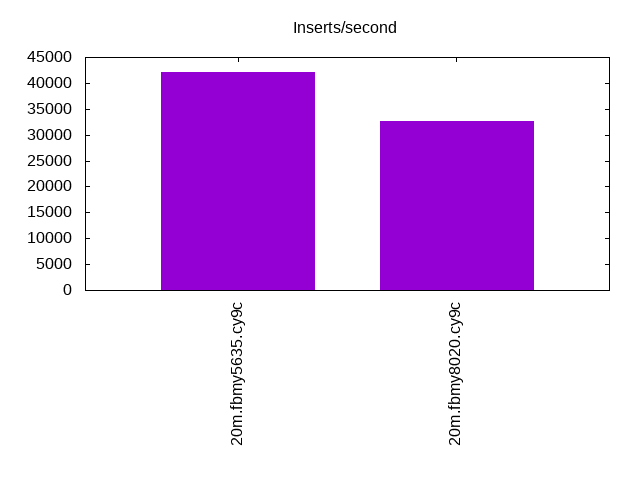
l.i1
l.i1: continue load after secondary indexes created. Graphs for performance per 1-second interval are here.
Average throughput:
Insert response time histogram: each cell has the percentage of responses that take <= the time in the header and max is the max response time in seconds. For the max column values in the top 25% of the range have a red background and in the bottom 25% of the range have a green background. The red background is not used when the min value is within 80% of the max value.
| dbms | 256us | 1ms | 4ms | 16ms | 64ms | 256ms | 1s | 4s | 16s | gt | max |
|---|---|---|---|---|---|---|---|---|---|---|---|
| fbmy5635.cy9c | 8.788 | 91.117 | 0.091 | 0.004 | 0.056 | ||||||
| fbmy8020.cy9c | 99.819 | 0.168 | 0.013 | 0.064 |
Performance metrics for the DBMS listed above. Some are normalized by throughput, others are not. Legend for results is here.
ips	qps	rps	rmbps	wps	wmbps	rpq	rkbpq	wpi	wkbpi	csps	cpups	cspq	cpupq	dbgb1	dbgb2	rss	maxop	p50	p99	tag
42017	0	13	1.6	95.1	54.2	0.000	0.038	0.002	1.320	9563	58.0	0.228	55	2.9	4.7	2.1	0.056	41653	34562	20m.fbmy5635.cy9c
32733	0	10	1.2	88.3	51.9	0.000	0.038	0.003	1.624	8242	56.4	0.252	69	2.9	4.8	2.7	0.064	32315	28968	20m.fbmy8020.cy9c
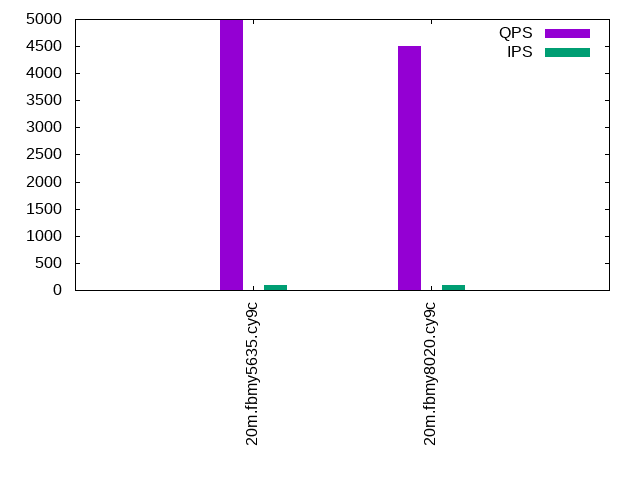
q100.1
q100.1: range queries with 100 insert/s per client. Graphs for performance per 1-second interval are here.
Average throughput:
Query response time histogram: each cell has the percentage of responses that take <= the time in the header and max is the max response time in seconds. For max values in the top 25% of the range have a red background and in the bottom 25% of the range have a green background. The red background is not used when the min value is within 80% of the max value.
| dbms | 256us | 1ms | 4ms | 16ms | 64ms | 256ms | 1s | 4s | 16s | gt | max |
|---|---|---|---|---|---|---|---|---|---|---|---|
| fbmy5635.cy9c | 98.389 | 1.611 | nonzero | 0.004 | |||||||
| fbmy8020.cy9c | 97.861 | 2.138 | nonzero | nonzero | 0.004 |
Insert response time histogram: each cell has the percentage of responses that take <= the time in the header and max is the max response time in seconds. For max values in the top 25% of the range have a red background and in the bottom 25% of the range have a green background. The red background is not used when the min value is within 80% of the max value.
| dbms | 256us | 1ms | 4ms | 16ms | 64ms | 256ms | 1s | 4s | 16s | gt | max |
|---|---|---|---|---|---|---|---|---|---|---|---|
| fbmy5635.cy9c | 0.083 | 99.896 | 0.021 | 0.004 | |||||||
| fbmy8020.cy9c | 99.875 | 0.125 | 0.008 |
Performance metrics for the DBMS listed above. Some are normalized by throughput, others are not. Legend for results is here.
ips	qps	rps	rmbps	wps	wmbps	rpq	rkbpq	wpi	wkbpi	csps	cpups	cspq	cpupq	dbgb1	dbgb2	rss	maxop	p50	p99	tag
100	4974	0	0.0	3.2	0.1	0.000	0.000	0.032	0.944	19123	26.0	3.845	209	2.9	4.7	3.6	0.004	4986	4858	20m.fbmy5635.cy9c
100	4503	0	0.0	3.4	0.1	0.000	0.000	0.034	1.424	17475	27.0	3.881	240	2.9	4.9	4.3	0.004	4507	4411	20m.fbmy8020.cy9c
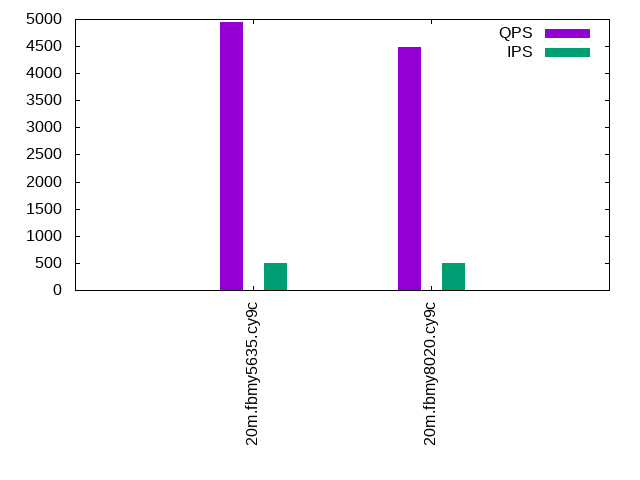
q500.1
q500.1: range queries with 500 insert/s per client. Graphs for performance per 1-second interval are here.
Average throughput:
Query response time histogram: each cell has the percentage of responses that take <= the time in the header and max is the max response time in seconds. For max values in the top 25% of the range have a red background and in the bottom 25% of the range have a green background. The red background is not used when the min value is within 80% of the max value.
| dbms | 256us | 1ms | 4ms | 16ms | 64ms | 256ms | 1s | 4s | 16s | gt | max |
|---|---|---|---|---|---|---|---|---|---|---|---|
| fbmy5635.cy9c | 98.107 | 1.892 | 0.001 | nonzero | 0.012 | ||||||
| fbmy8020.cy9c | 97.297 | 2.700 | 0.003 | nonzero | 0.006 |
Insert response time histogram: each cell has the percentage of responses that take <= the time in the header and max is the max response time in seconds. For max values in the top 25% of the range have a red background and in the bottom 25% of the range have a green background. The red background is not used when the min value is within 80% of the max value.
| dbms | 256us | 1ms | 4ms | 16ms | 64ms | 256ms | 1s | 4s | 16s | gt | max |
|---|---|---|---|---|---|---|---|---|---|---|---|
| fbmy5635.cy9c | 0.481 | 99.494 | 0.024 | 0.001 | 0.033 | ||||||
| fbmy8020.cy9c | 99.883 | 0.100 | 0.017 | 0.039 |
Performance metrics for the DBMS listed above. Some are normalized by throughput, others are not. Legend for results is here.
ips	qps	rps	rmbps	wps	wmbps	rpq	rkbpq	wpi	wkbpi	csps	cpups	cspq	cpupq	dbgb1	dbgb2	rss	maxop	p50	p99	tag
500	4951	0	0.0	4.1	0.7	0.000	0.000	0.008	1.451	19112	26.5	3.860	214	3.2	3.5	6.1	0.012	4955	4780	20m.fbmy5635.cy9c
500	4478	0	0.0	4.6	1.1	0.000	0.000	0.009	2.240	17472	27.7	3.902	247	3.2	3.6	8.5	0.006	4475	4316	20m.fbmy8020.cy9c
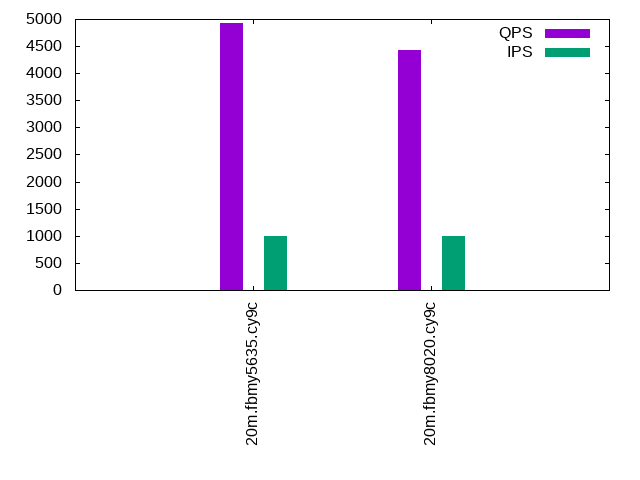
q1000.1
q1000.1: range queries with 1000 insert/s per client. Graphs for performance per 1-second interval are here.
Average throughput:
Query response time histogram: each cell has the percentage of responses that take <= the time in the header and max is the max response time in seconds. For max values in the top 25% of the range have a red background and in the bottom 25% of the range have a green background. The red background is not used when the min value is within 80% of the max value.
| dbms | 256us | 1ms | 4ms | 16ms | 64ms | 256ms | 1s | 4s | 16s | gt | max |
|---|---|---|---|---|---|---|---|---|---|---|---|
| fbmy5635.cy9c | 97.591 | 2.406 | 0.003 | nonzero | 0.013 | ||||||
| fbmy8020.cy9c | 96.292 | 3.701 | 0.007 | nonzero | 0.009 |
Insert response time histogram: each cell has the percentage of responses that take <= the time in the header and max is the max response time in seconds. For max values in the top 25% of the range have a red background and in the bottom 25% of the range have a green background. The red background is not used when the min value is within 80% of the max value.
| dbms | 256us | 1ms | 4ms | 16ms | 64ms | 256ms | 1s | 4s | 16s | gt | max |
|---|---|---|---|---|---|---|---|---|---|---|---|
| fbmy5635.cy9c | 0.565 | 99.392 | 0.042 | 0.001 | 0.033 | ||||||
| fbmy8020.cy9c | 99.865 | 0.115 | 0.021 | 0.039 |
Performance metrics for the DBMS listed above. Some are normalized by throughput, others are not. Legend for results is here.
ips	qps	rps	rmbps	wps	wmbps	rpq	rkbpq	wpi	wkbpi	csps	cpups	cspq	cpupq	dbgb1	dbgb2	rss	maxop	p50	p99	tag
999	4917	0	0.0	5.4	1.6	0.000	0.000	0.005	1.677	19106	27.3	3.885	222	3.7	4.9	10.5	0.013	4923	4699	20m.fbmy5635.cy9c
999	4435	4	0.1	6.8	2.6	0.001	0.016	0.007	2.627	17453	28.8	3.935	260	3.6	5.0	10.8	0.009	4443	4235	20m.fbmy8020.cy9c
l.i0
l.i0: load without secondary indexes
Performance metrics for all DBMS, not just the ones listed above. Some are normalized by throughput, others are not. Legend for results is here.
ips	qps	rps	rmbps	wps	wmbps	rpq	rkbpq	wpi	wkbpi	csps	cpups	cspq	cpupq	dbgb1	dbgb2	rss	maxop	p50	p99	tag
108696	0	0	0.0	43.9	18.5	0.000	0.000	0.000	0.174	11150	48.2	0.103	18	0.7	1.8	0.2	0.113	110882	94499	20m.fbmy5635.cy9c
77519	0	0	0.0	43.2	15.1	0.000	0.000	0.001	0.200	8293	42.9	0.107	22	0.7	1.9	0.6	0.117	78652	67626	20m.fbmy8020.cy9c
l.x
l.x: create secondary indexes
Performance metrics for all DBMS, not just the ones listed above. Some are normalized by throughput, others are not. Legend for results is here.
ips	qps	rps	rmbps	wps	wmbps	rpq	rkbpq	wpi	wkbpi	csps	cpups	cspq	cpupq	dbgb1	dbgb2	rss	maxop	p50	p99	tag
110440	0	0	0.0	27.5	16.8	0.000	0.000	0.000	0.155	747	25.1	0.007	9	1.5	2.5	1.3	0.016	NA	NA	20m.fbmy5635.cy9c
103077	0	0	0.0	25.0	15.7	0.000	0.000	0.000	0.156	886	25.3	0.009	10	1.4	2.6	1.8	0.006	NA	NA	20m.fbmy8020.cy9c
l.i1
l.i1: continue load after secondary indexes created
Performance metrics for all DBMS, not just the ones listed above. Some are normalized by throughput, others are not. Legend for results is here.
ips	qps	rps	rmbps	wps	wmbps	rpq	rkbpq	wpi	wkbpi	csps	cpups	cspq	cpupq	dbgb1	dbgb2	rss	maxop	p50	p99	tag
42017	0	13	1.6	95.1	54.2	0.000	0.038	0.002	1.320	9563	58.0	0.228	55	2.9	4.7	2.1	0.056	41653	34562	20m.fbmy5635.cy9c
32733	0	10	1.2	88.3	51.9	0.000	0.038	0.003	1.624	8242	56.4	0.252	69	2.9	4.8	2.7	0.064	32315	28968	20m.fbmy8020.cy9c
q100.1
q100.1: range queries with 100 insert/s per client
Performance metrics for all DBMS, not just the ones listed above. Some are normalized by throughput, others are not. Legend for results is here.
ips	qps	rps	rmbps	wps	wmbps	rpq	rkbpq	wpi	wkbpi	csps	cpups	cspq	cpupq	dbgb1	dbgb2	rss	maxop	p50	p99	tag
100	4974	0	0.0	3.2	0.1	0.000	0.000	0.032	0.944	19123	26.0	3.845	209	2.9	4.7	3.6	0.004	4986	4858	20m.fbmy5635.cy9c
100	4503	0	0.0	3.4	0.1	0.000	0.000	0.034	1.424	17475	27.0	3.881	240	2.9	4.9	4.3	0.004	4507	4411	20m.fbmy8020.cy9c
q500.1
q500.1: range queries with 500 insert/s per client
Performance metrics for all DBMS, not just the ones listed above. Some are normalized by throughput, others are not. Legend for results is here.
ips	qps	rps	rmbps	wps	wmbps	rpq	rkbpq	wpi	wkbpi	csps	cpups	cspq	cpupq	dbgb1	dbgb2	rss	maxop	p50	p99	tag
500	4951	0	0.0	4.1	0.7	0.000	0.000	0.008	1.451	19112	26.5	3.860	214	3.2	3.5	6.1	0.012	4955	4780	20m.fbmy5635.cy9c
500	4478	0	0.0	4.6	1.1	0.000	0.000	0.009	2.240	17472	27.7	3.902	247	3.2	3.6	8.5	0.006	4475	4316	20m.fbmy8020.cy9c
q1000.1
q1000.1: range queries with 1000 insert/s per client
Performance metrics for all DBMS, not just the ones listed above. Some are normalized by throughput, others are not. Legend for results is here.
ips	qps	rps	rmbps	wps	wmbps	rpq	rkbpq	wpi	wkbpi	csps	cpups	cspq	cpupq	dbgb1	dbgb2	rss	maxop	p50	p99	tag
999	4917	0	0.0	5.4	1.6	0.000	0.000	0.005	1.677	19106	27.3	3.885	222	3.7	4.9	10.5	0.013	4923	4699	20m.fbmy5635.cy9c
999	4435	4	0.1	6.8	2.6	0.001	0.016	0.007	2.627	17453	28.8	3.935	260	3.6	5.0	10.8	0.009	4443	4235	20m.fbmy8020.cy9c
l.i0
- l.i0: load without secondary indexes
- Legend for results is here.
- Each entry lists the percentage of responses that fit in that bucket (slower than max time for previous bucket, faster than min time for next bucket).
Insert response time histogram
256us	1ms	4ms	16ms	64ms	256ms	1s	4s	16s	gt	max	tag
0.000	98.391	1.559	0.046	0.001	0.003	0.000	0.000	0.000	0.000	0.113	fbmy5635.cy9c
0.000	0.000	99.823	0.159	0.017	0.001	0.000	0.000	0.000	0.000	0.117	fbmy8020.cy9c
l.x
- l.x: create secondary indexes
- Legend for results is here.
- Each entry lists the percentage of responses that fit in that bucket (slower than max time for previous bucket, faster than min time for next bucket).
TODO - determine whether there is data for create index response time
l.i1
- l.i1: continue load after secondary indexes created
- Legend for results is here.
- Each entry lists the percentage of responses that fit in that bucket (slower than max time for previous bucket, faster than min time for next bucket).
Insert response time histogram
256us	1ms	4ms	16ms	64ms	256ms	1s	4s	16s	gt	max	tag
0.000	8.788	91.117	0.091	0.004	0.000	0.000	0.000	0.000	0.000	0.056	fbmy5635.cy9c
0.000	0.000	99.819	0.168	0.013	0.000	0.000	0.000	0.000	0.000	0.064	fbmy8020.cy9c
q100.1
- q100.1: range queries with 100 insert/s per client
- Legend for results is here.
- Each entry lists the percentage of responses that fit in that bucket (slower than max time for previous bucket, faster than min time for next bucket).
Query response time histogram
256us	1ms	4ms	16ms	64ms	256ms	1s	4s	16s	gt	max	tag
98.389	1.611	nonzero	0.000	0.000	0.000	0.000	0.000	0.000	0.000	0.004	fbmy5635.cy9c
97.861	2.138	nonzero	nonzero	0.000	0.000	0.000	0.000	0.000	0.000	0.004	fbmy8020.cy9c
Insert response time histogram
256us	1ms	4ms	16ms	64ms	256ms	1s	4s	16s	gt	max	tag
0.000	0.083	99.896	0.021	0.000	0.000	0.000	0.000	0.000	0.000	0.004	fbmy5635.cy9c
0.000	0.000	99.875	0.125	0.000	0.000	0.000	0.000	0.000	0.000	0.008	fbmy8020.cy9c
q500.1
- q500.1: range queries with 500 insert/s per client
- Legend for results is here.
- Each entry lists the percentage of responses that fit in that bucket (slower than max time for previous bucket, faster than min time for next bucket).
Query response time histogram
256us	1ms	4ms	16ms	64ms	256ms	1s	4s	16s	gt	max	tag
98.107	1.892	0.001	nonzero	0.000	0.000	0.000	0.000	0.000	0.000	0.012	fbmy5635.cy9c
97.297	2.700	0.003	nonzero	0.000	0.000	0.000	0.000	0.000	0.000	0.006	fbmy8020.cy9c
Insert response time histogram
256us	1ms	4ms	16ms	64ms	256ms	1s	4s	16s	gt	max	tag
0.000	0.481	99.494	0.024	0.001	0.000	0.000	0.000	0.000	0.000	0.033	fbmy5635.cy9c
0.000	0.000	99.883	0.100	0.017	0.000	0.000	0.000	0.000	0.000	0.039	fbmy8020.cy9c
q1000.1
- q1000.1: range queries with 1000 insert/s per client
- Legend for results is here.
- Each entry lists the percentage of responses that fit in that bucket (slower than max time for previous bucket, faster than min time for next bucket).
Query response time histogram
256us	1ms	4ms	16ms	64ms	256ms	1s	4s	16s	gt	max	tag
97.591	2.406	0.003	nonzero	0.000	0.000	0.000	0.000	0.000	0.000	0.013	fbmy5635.cy9c
96.292	3.701	0.007	nonzero	0.000	0.000	0.000	0.000	0.000	0.000	0.009	fbmy8020.cy9c
Insert response time histogram
256us	1ms	4ms	16ms	64ms	256ms	1s	4s	16s	gt	max	tag
0.000	0.565	99.392	0.042	0.001	0.000	0.000	0.000	0.000	0.000	0.033	fbmy5635.cy9c
0.000	0.000	99.865	0.115	0.021	0.000	0.000	0.000	0.000	0.000	0.039	fbmy8020.cy9c