Introduction
This is a report for the insert benchmark with 500M docs and 1 client(s). It is generated by scripts (bash, awk, sed) and Tufte might not be impressed. An overview of the insert benchmark is here and a short update is here. Below, by DBMS, I mean DBMS+version.config. An example is my8020.c10b40 where my means MySQL, 8020 is version 8.0.20 and c10b40 is the name for the configuration file.
The test server is an Intel NUC. Clients and the DBMS share one server.
The tested DBMS are:
- pg1110.cx5 - Postgres 11.10 with the cx5 config
- pg124.cx5 - Postgres 12.4 with the cx5 config
- pg131.cx5 - Postgres 13.1 with the cx5 config
- my5649.cx6d - MySQL 5.7.31 with InnoDB and the cx6d config
- my5731.cx6d - MySQL 5.7.31 with InnoDB and the cx6d config
- my8022.cx6d - MySQL 8.0.22 with InnoDB and the cx6d config
- rx56.cx6a - MySQL 5.6.35 with MyRocks and the cx6a config
- rx80.cx6a - MySQL 8.0.17 with MyRocks and the cx6a config
Contents
- Summary
- l.i0: load without secondary indexes
- l.x: create secondary indexes
- l.i1: continue load after secondary indexes created
- q100.2: range queries with 100 insert/s per client, 2nd loop
- q200.2: range queries with 200 insert/s per client, 2nd loop
- q400.2: range queries with 400 insert/s per client, 2nd loop
- q600.2: range queries with 600 insert/s per client, 2nd loop
- q800.2: range queries with 800 insert/s per client, 2nd loop
- q1000.2: range queries with 1000 insert/s per client, 2nd loop
Summary
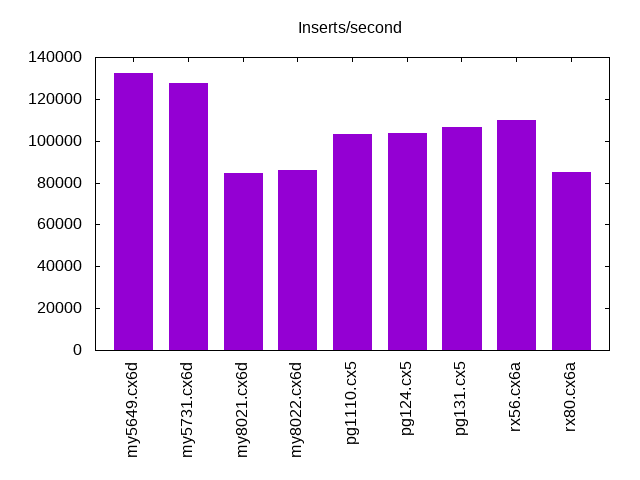
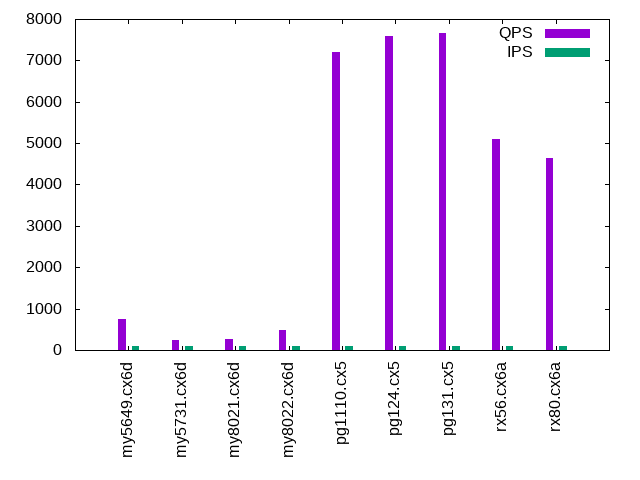
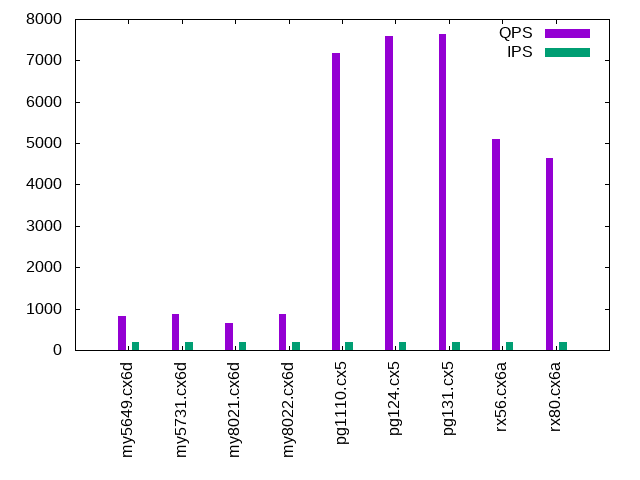
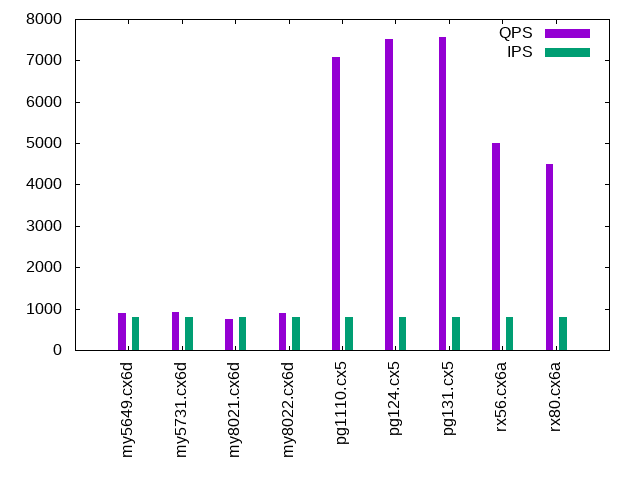
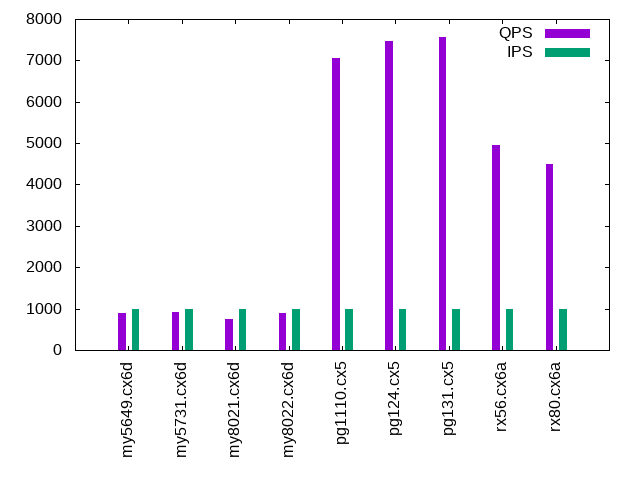
The numbers are inserts/s for l.i0 and l.i1, indexed docs (or rows) /s for l.x and queries/s for q*.2. The values are the average rate over the entire test for inserts (IPS) and queries (QPS). The range of values for IPS and QPS is split into 3 parts: bottom 25%, middle 50%, top 25%. Values in the bottom 25% have a red background, values in the top 25% have a green background and values in the middle have no color. A gray background is used for values that can be ignored because the DBMS did not sustain the target insert rate. Red backgrounds are not used when the minimum value is within 80% of the max value.
| dbms | l.i0 | l.x | l.i1 | q100.2 | q200.2 | q400.2 | q600.2 | q800.2 | q1000.2 |
|---|---|---|---|---|---|---|---|---|---|
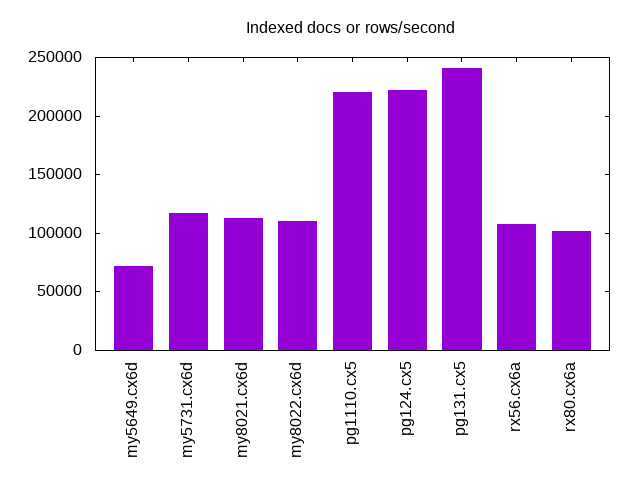
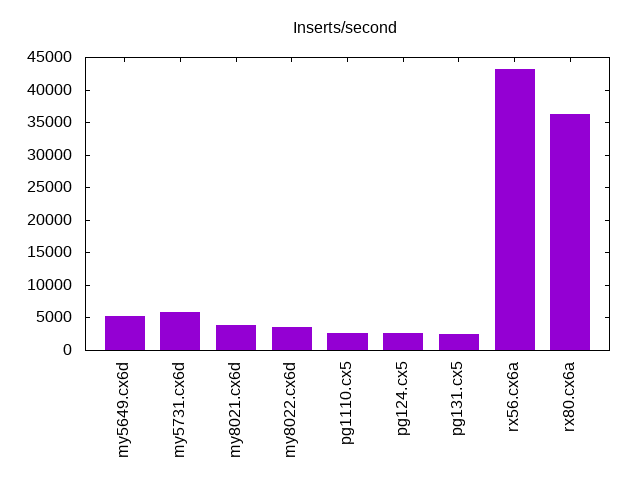
| my5649.cx6d | 132415 | 71433 | 5200 | 759 | 831 | 875 | 877 | 891 | 888 |
| my5731.cx6d | 127714 | 117174 | 5841 | 239 | 871 | 905 | 915 | 920 | 911 |
| my8021.cx6d | 84431 | 112813 | 3858 | 274 | 643 | 734 | 762 | 744 | 748 |
| my8022.cx6d | 86029 | 110349 | 3576 | 478 | 863 | 877 | 872 | 888 | 892 |
| pg1110.cx5 | 103391 | 220211 | 2587 | 7209 | 7175 | 7119 | 7080 | 7089 | 7062 |
| pg124.cx5 | 103455 | 221971 | 2568 | 7584 | 7599 | 7548 | 7540 | 7518 | 7470 |
| pg131.cx5 | 106701 | 240548 | 2481 | 7664 | 7640 | 7598 | 7578 | 7561 | 7558 |
| rx56.cx6a | 109721 | 107827 | 43103 | 5099 | 5104 | 5085 | 5066 | 5013 | 4959 |
| rx80.cx6a | 84918 | 101481 | 36232 | 4651 | 4650 | 4588 | 4602 | 4502 | 4485 |
This lists the average rate of inserts/s for the tests that do inserts concurrent with queries. For such tests the query rate is listed in the table above. The read+write tests are setup so that the insert rate should match the target rate every second. Cells that are not at least 95% of the target have a red background to indicate a failure to satisfy the target.
| dbms | q100.2 | q200.2 | q400.2 | q600.2 | q800.2 | q1000.2 |
|---|---|---|---|---|---|---|
| my5649.cx6d | 100 | 200 | 399 | 599 | 798 | 998 |
| my5731.cx6d | 100 | 200 | 399 | 599 | 799 | 998 |
| my8021.cx6d | 100 | 200 | 399 | 599 | 799 | 998 |
| my8022.cx6d | 100 | 200 | 399 | 599 | 799 | 998 |
| pg1110.cx5 | 100 | 200 | 399 | 599 | 799 | 999 |
| pg124.cx5 | 100 | 200 | 399 | 599 | 799 | 998 |
| pg131.cx5 | 100 | 200 | 399 | 599 | 799 | 998 |
| rx56.cx6a | 100 | 200 | 399 | 599 | 799 | 998 |
| rx80.cx6a | 100 | 200 | 400 | 599 | 799 | 998 |
| target | 100 | 200 | 400 | 600 | 800 | 1000 |
l.i0
l.i0: load without secondary indexes. Graphs for performance per 1-second interval are here.
Average throughput:
Insert response time histogram: each cell has the percentage of responses that take <= the time in the header and max is the max response time in seconds. For the max column values in the top 25% of the range have a red background and in the bottom 25% of the range have a green background. The red background is not used when the min value is within 80% of the max value.
| dbms | 256us | 1ms | 4ms | 16ms | 64ms | 256ms | 1s | 4s | 16s | gt | max |
|---|---|---|---|---|---|---|---|---|---|---|---|
| my5649.cx6d | 97.162 | 2.403 | 0.372 | 0.059 | 0.001 | 0.003 | 0.404 | ||||
| my5731.cx6d | 98.452 | 1.302 | 0.241 | 0.001 | 0.004 | 0.117 | |||||
| my8021.cx6d | 99.595 | 0.373 | 0.030 | 0.002 | 0.127 | ||||||
| my8022.cx6d | 0.009 | 99.740 | 0.130 | 0.117 | 0.003 | 0.122 | |||||
| pg1110.cx5 | 94.162 | 5.836 | 0.001 | 0.001 | 0.034 | ||||||
| pg124.cx5 | 94.458 | 5.541 | 0.001 | nonzero | 0.049 | ||||||
| pg131.cx5 | 96.358 | 3.636 | 0.005 | 0.001 | nonzero | 0.193 | |||||
| rx56.cx6a | 98.597 | 1.351 | 0.049 | nonzero | 0.004 | 0.164 | |||||
| rx80.cx6a | nonzero | 99.835 | 0.147 | 0.015 | 0.002 | 0.178 |
Performance metrics for the DBMS listed above. Some are normalized by throughput, others are not. Legend for results is here.
ips	qps	rps	rmbps	wps	wmbps	rpq	rkbpq	wpi	wkbpi	csps	cpups	cspq	cpupq	dbgb1	dbgb2	rss	maxop	p50	p99	tag
132415	0	1159	4.5	532.5	44.4	0.009	0.035	0.004	0.344	15874	46.1	0.120	14	32.9	73.4	10.6	0.404	134107	87939	my5649.cx6d
127714	0	0	0.0	537.3	43.3	0.000	0.000	0.004	0.347	14464	46.7	0.113	15	32.9	73.4	10.9	0.117	128463	113973	my5731.cx6d
84431	0	0	0.0	436.7	30.0	0.000	0.000	0.005	0.364	19593	41.0	0.232	19	32.8	73.3	11.1	0.127	84861	74832	my8021.cx6d
86029	0	0	0.0	441.2	30.6	0.000	0.000	0.005	0.364	16146	41.6	0.188	19	32.8	73.3	11.1	0.122	86347	76725	my8022.cx6d
103391	0	39	0.3	188.0	39.6	0.000	0.003	0.002	0.393	12355	42.1	0.119	16	47.8	55.8	0.0	0.034	103390	100293	pg1110.cx5
103455	0	44	0.4	197.0	39.8	0.000	0.003	0.002	0.394	12381	42.1	0.120	16	47.8	55.8	0.0	0.049	103586	99090	pg124.cx5
106701	0	65	3.5	167.5	51.2	0.001	0.034	0.002	0.492	12924	43.6	0.121	16	47.8	62.6	7.3	0.193	107218	101484	pg131.cx5
109721	0	0	0.0	47.8	16.5	0.000	0.000	0.000	0.154	11143	46.7	0.102	17	24.9	37.5	2.4	0.164	110582	95295	rx56.cx6a
84918	0	0	0.0	44.1	12.9	0.000	0.000	0.001	0.156	8934	42.4	0.105	20	24.9	37.7	2.8	0.178	85490	74617	rx80.cx6a
l.x
l.x: create secondary indexes.
Average throughput:
Performance metrics for the DBMS listed above. Some are normalized by throughput, others are not. Legend for results is here.
ips	qps	rps	rmbps	wps	wmbps	rpq	rkbpq	wpi	wkbpi	csps	cpups	cspq	cpupq	dbgb1	dbgb2	rss	maxop	p50	p99	tag
71433	0	444	64.3	784.1	87.2	0.006	0.921	0.011	1.250	2680	19.0	0.038	11	67.8	108.3	10.7	0.029	NA	NA	my5649.cx6d
117174	0	694	101.4	1204.8	129.1	0.006	0.886	0.010	1.128	7169	23.0	0.061	8	73.6	114.1	11.1	0.016	NA	NA	my5731.cx6d
112813	0	626	97.9	1238.4	124.2	0.006	0.889	0.011	1.128	7441	22.8	0.066	8	73.3	113.8	11.2	0.019	NA	NA	my8021.cx6d
110349	0	617	95.7	1191.5	121.4	0.006	0.888	0.011	1.127	7016	22.7	0.064	8	73.3	113.8	11.2	0.025	NA	NA	my8022.cx6d
220211	0	566	68.8	461.1	102.8	0.003	0.320	0.002	0.478	1007	23.0	0.005	4	91.9	111.4	0.0	0.003	NA	NA	pg1110.cx5
221971	0	571	69.4	478.5	102.8	0.003	0.320	0.002	0.474	969	22.9	0.004	4	91.9	111.6	0.0	0.003	NA	NA	pg124.cx5
240548	0	599	73.3	209.0	78.2	0.002	0.312	0.001	0.333	589	23.3	0.002	4	91.9	105.7	0.0	0.003	NA	NA	pg131.cx5
107827	0	94	28.7	56.2	18.7	0.001	0.272	0.001	0.178	883	24.8	0.008	9	54.4	67.1	12.1	0.011	NA	NA	rx56.cx6a
101481	0	90	27.5	52.6	17.6	0.001	0.278	0.001	0.178	994	24.8	0.010	10	54.5	67.3	12.6	0.013	NA	NA	rx80.cx6a
l.i1
l.i1: continue load after secondary indexes created. Graphs for performance per 1-second interval are here.
Average throughput:
Insert response time histogram: each cell has the percentage of responses that take <= the time in the header and max is the max response time in seconds. For the max column values in the top 25% of the range have a red background and in the bottom 25% of the range have a green background. The red background is not used when the min value is within 80% of the max value.
| dbms | 256us | 1ms | 4ms | 16ms | 64ms | 256ms | 1s | 4s | 16s | gt | max |
|---|---|---|---|---|---|---|---|---|---|---|---|
| my5649.cx6d | 72.014 | 14.130 | 11.902 | 1.640 | 0.313 | 0.001 | 2.254 | ||||
| my5731.cx6d | 66.857 | 22.391 | 9.595 | 0.923 | 0.234 | 0.607 | |||||
| my8021.cx6d | 62.963 | 21.230 | 11.406 | 4.109 | 0.292 | 0.769 | |||||
| my8022.cx6d | 63.946 | 19.710 | 11.128 | 4.822 | 0.394 | 0.662 | |||||
| pg1110.cx5 | 31.710 | 68.254 | 0.036 | 0.140 | |||||||
| pg124.cx5 | 31.734 | 68.237 | 0.028 | 0.124 | |||||||
| pg131.cx5 | 28.256 | 71.550 | 0.192 | 0.002 | 0.407 | ||||||
| rx56.cx6a | 7.421 | 92.478 | 0.099 | 0.003 | 0.053 | ||||||
| rx80.cx6a | 0.146 | 99.696 | 0.145 | 0.013 | 0.051 |
Performance metrics for the DBMS listed above. Some are normalized by throughput, others are not. Legend for results is here.
ips	qps	rps	rmbps	wps	wmbps	rpq	rkbpq	wpi	wkbpi	csps	cpups	cspq	cpupq	dbgb1	dbgb2	rss	maxop	p50	p99	tag
5200	0	2706	41.2	3722.9	136.1	0.520	8.113	0.716	26.802	15695	19.2	3.018	148	101.8	144.2	10.7	2.254	1448	100	my5649.cx6d
5841	0	2928	45.8	4101.5	147.4	0.501	8.021	0.702	25.842	18917	25.3	3.239	173	101.8	144.3	11.1	0.607	2597	649	my5731.cx6d
3858	0	1957	30.6	3432.3	100.1	0.507	8.114	0.890	26.575	22513	27.7	5.835	287	101.4	143.9	11.2	0.769	999	100	my8021.cx6d
3576	0	1811	28.3	3206.5	93.3	0.506	8.103	0.897	26.727	20200	26.2	5.648	293	101.4	143.9	11.2	0.662	999	150	my8022.cx6d
2587	0	3460	27.7	4345.9	68.7	1.337	10.967	1.680	27.193	8009	22.8	3.096	352	93.6	111.2	0.0	0.140	2647	1549	pg1110.cx5
2568	0	3432	27.5	4330.7	68.4	1.337	10.963	1.686	27.294	7952	22.6	3.096	352	93.6	111.1	0.0	0.124	2646	1498	pg124.cx5
2481	0	3493	39.7	4259.9	70.7	1.408	16.405	1.717	29.170	8091	24.1	3.262	389	93.6	111.0	0.0	0.407	2547	1348	pg131.cx5
43103	0	0	0.0	82.3	30.0	0.000	0.000	0.002	0.714	9145	43.1	0.212	40	55.6	56.1	12.0	0.053	42703	35362	rx56.cx6a
36232	0	0	0.0	74.5	25.6	0.000	0.000	0.002	0.723	8009	41.4	0.221	46	55.7	56.4	12.4	0.051	35912	33164	rx80.cx6a
q100.2
q100.2: range queries with 100 insert/s per client, 2nd loop. Graphs for performance per 1-second interval are here.
Average throughput:
Query response time histogram: each cell has the percentage of responses that take <= the time in the header and max is the max response time in seconds. For max values in the top 25% of the range have a red background and in the bottom 25% of the range have a green background. The red background is not used when the min value is within 80% of the max value.
| dbms | 256us | 1ms | 4ms | 16ms | 64ms | 256ms | 1s | 4s | 16s | gt | max |
|---|---|---|---|---|---|---|---|---|---|---|---|
| my5649.cx6d | 4.290 | 53.978 | 41.224 | 0.466 | 0.041 | nonzero | 0.070 | ||||
| my5731.cx6d | 7.643 | 37.311 | 45.216 | 1.537 | 8.292 | nonzero | 0.088 | ||||
| my8021.cx6d | 2.944 | 37.970 | 51.374 | 1.343 | 6.369 | nonzero | 0.069 | ||||
| my8022.cx6d | 5.968 | 46.593 | 44.016 | 0.877 | 2.546 | 0.063 | |||||
| pg1110.cx5 | 99.906 | 0.094 | nonzero | nonzero | 0.005 | ||||||
| pg124.cx5 | 99.961 | 0.039 | nonzero | nonzero | 0.005 | ||||||
| pg131.cx5 | 99.966 | 0.034 | nonzero | 0.003 | |||||||
| rx56.cx6a | 97.897 | 2.103 | nonzero | nonzero | 0.015 | ||||||
| rx80.cx6a | 98.164 | 1.836 | nonzero | nonzero | 0.015 |
Insert response time histogram: each cell has the percentage of responses that take <= the time in the header and max is the max response time in seconds. For max values in the top 25% of the range have a red background and in the bottom 25% of the range have a green background. The red background is not used when the min value is within 80% of the max value.
| dbms | 256us | 1ms | 4ms | 16ms | 64ms | 256ms | 1s | 4s | 16s | gt | max |
|---|---|---|---|---|---|---|---|---|---|---|---|
| my5649.cx6d | 41.389 | 58.389 | 0.222 | 0.097 | |||||||
| my5731.cx6d | 16.472 | 76.583 | 6.944 | 0.031 | |||||||
| my8021.cx6d | 2.500 | 62.528 | 34.972 | 0.051 | |||||||
| my8022.cx6d | 0.139 | 51.944 | 47.861 | 0.056 | 0.072 | ||||||
| pg1110.cx5 | 84.389 | 15.611 | 0.031 | ||||||||
| pg124.cx5 | 85.028 | 14.972 | 0.026 | ||||||||
| pg131.cx5 | 85.222 | 14.778 | 0.028 | ||||||||
| rx56.cx6a | 2.056 | 97.861 | 0.083 | 0.014 | |||||||
| rx80.cx6a | 99.889 | 0.083 | 0.028 | 0.018 |
Performance metrics for the DBMS listed above. Some are normalized by throughput, others are not. Legend for results is here.
ips	qps	rps	rmbps	wps	wmbps	rpq	rkbpq	wpi	wkbpi	csps	cpups	cspq	cpupq	dbgb1	dbgb2	rss	maxop	p50	p99	tag
100	759	2930	45.7	296.6	9.0	3.858	61.684	2.972	92.421	9268	18.0	12.204	948	101.8	144.3	10.7	0.070	735	575	my5649.cx6d
100	239	976	15.3	251.0	7.6	4.082	65.307	2.516	77.691	3614	7.5	15.108	1254	101.8	144.3	11.1	0.088	80	48	my5731.cx6d
100	274	1101	17.2	226.7	5.6	4.021	64.328	2.271	57.895	5680	11.9	20.739	1738	101.4	143.9	11.2	0.069	80	48	my8021.cx6d
100	478	1878	29.3	295.3	7.4	3.926	62.822	2.959	75.516	7543	14.5	15.766	1212	101.4	143.9	11.2	0.063	639	48	my8022.cx6d
100	7209	128	1.0	276.2	4.2	0.018	0.146	2.767	43.462	28021	27.6	3.887	153	93.7	102.8	0.0	0.005	7211	7048	pg1110.cx5
100	7584	128	1.0	277.0	4.2	0.017	0.139	2.776	43.432	29446	27.7	3.883	146	93.7	103.4	0.0	0.005	7592	7448	pg124.cx5
100	7664	129	1.0	277.8	4.2	0.017	0.139	2.783	43.398	29753	27.7	3.882	145	93.7	104.1	0.0	0.003	7672	7528	pg131.cx5
100	5099	0	0.0	4.5	0.5	0.000	0.000	0.045	5.179	19589	26.0	3.842	204	55.7	56.3	11.8	0.015	5099	5002	rx56.cx6a
100	4651	0	0.0	4.5	0.5	0.000	0.000	0.045	5.183	18023	26.7	3.875	230	55.8	56.6	12.2	0.015	4667	4523	rx80.cx6a
q200.2
q200.2: range queries with 200 insert/s per client, 2nd loop. Graphs for performance per 1-second interval are here.
Average throughput:
Query response time histogram: each cell has the percentage of responses that take <= the time in the header and max is the max response time in seconds. For max values in the top 25% of the range have a red background and in the bottom 25% of the range have a green background. The red background is not used when the min value is within 80% of the max value.
| dbms | 256us | 1ms | 4ms | 16ms | 64ms | 256ms | 1s | 4s | 16s | gt | max |
|---|---|---|---|---|---|---|---|---|---|---|---|
| my5649.cx6d | 5.793 | 52.873 | 40.902 | 0.386 | 0.047 | 0.058 | |||||
| my5731.cx6d | 10.081 | 47.008 | 42.533 | 0.305 | 0.074 | 0.051 | |||||
| my8021.cx6d | 4.556 | 43.785 | 50.682 | 0.312 | 0.665 | 0.056 | |||||
| my8022.cx6d | 7.272 | 49.604 | 42.791 | 0.271 | 0.061 | 0.033 | |||||
| pg1110.cx5 | 99.884 | 0.115 | 0.001 | nonzero | 0.005 | ||||||
| pg124.cx5 | 99.949 | 0.051 | 0.001 | nonzero | 0.004 | ||||||
| pg131.cx5 | 99.952 | 0.047 | 0.001 | nonzero | 0.005 | ||||||
| rx56.cx6a | 98.213 | 1.786 | nonzero | nonzero | 0.006 | ||||||
| rx80.cx6a | 98.296 | 1.703 | nonzero | 0.002 |
Insert response time histogram: each cell has the percentage of responses that take <= the time in the header and max is the max response time in seconds. For max values in the top 25% of the range have a red background and in the bottom 25% of the range have a green background. The red background is not used when the min value is within 80% of the max value.
| dbms | 256us | 1ms | 4ms | 16ms | 64ms | 256ms | 1s | 4s | 16s | gt | max |
|---|---|---|---|---|---|---|---|---|---|---|---|
| my5649.cx6d | 14.347 | 66.264 | 19.389 | 0.057 | |||||||
| my5731.cx6d | 2.208 | 94.042 | 3.750 | 0.042 | |||||||
| my8021.cx6d | 4.806 | 91.208 | 3.986 | 0.041 | |||||||
| my8022.cx6d | 0.236 | 90.333 | 9.431 | 0.046 | |||||||
| pg1110.cx5 | 97.056 | 2.944 | 0.024 | ||||||||
| pg124.cx5 | 97.069 | 2.931 | 0.028 | ||||||||
| pg131.cx5 | 97.264 | 2.736 | 0.029 | ||||||||
| rx56.cx6a | 99.944 | 0.056 | 0.005 | ||||||||
| rx80.cx6a | 99.889 | 0.097 | 0.014 | 0.018 |
Performance metrics for the DBMS listed above. Some are normalized by throughput, others are not. Legend for results is here.
ips	qps	rps	rmbps	wps	wmbps	rpq	rkbpq	wpi	wkbpi	csps	cpups	cspq	cpupq	dbgb1	dbgb2	rss	maxop	p50	p99	tag
200	831	3202	50.0	303.5	9.3	3.854	61.599	1.521	47.782	10096	17.2	12.150	828	101.9	144.3	10.7	0.058	815	591	my5649.cx6d
200	871	3354	52.4	330.0	10.0	3.849	61.583	1.654	51.223	10811	17.4	12.406	799	101.9	144.3	11.1	0.051	847	623	my5731.cx6d
200	643	2489	38.9	361.9	9.1	3.871	61.933	1.813	46.585	11055	21.1	17.193	1313	101.5	143.9	11.2	0.056	703	48	my8021.cx6d
200	863	3316	51.8	373.6	9.4	3.844	61.505	1.872	48.093	12581	21.6	14.585	1002	101.5	144.0	11.2	0.033	847	639	my8022.cx6d
200	7175	256	2.0	505.8	8.1	0.036	0.290	2.534	41.485	28162	27.8	3.925	155	93.8	96.8	0.0	0.005	7176	7000	pg1110.cx5
200	7599	256	2.0	507.2	8.1	0.034	0.273	2.541	41.384	29773	28.0	3.918	147	93.7	96.8	0.0	0.004	7608	7448	pg124.cx5
200	7640	257	2.0	509.1	8.1	0.034	0.273	2.551	41.381	29930	27.9	3.917	146	93.8	96.9	0.0	0.005	7640	7496	pg131.cx5
200	5104	0	0.0	3.1	0.0	0.000	0.000	0.016	0.215	19594	26.0	3.839	204	55.7	56.4	12.0	0.006	5114	5018	rx56.cx6a
200	4650	0	0.0	3.1	0.0	0.000	0.000	0.016	0.218	18004	26.5	3.872	228	55.8	56.7	12.4	0.002	4651	4571	rx80.cx6a
q400.2
q400.2: range queries with 400 insert/s per client, 2nd loop. Graphs for performance per 1-second interval are here.
Average throughput:

Query response time histogram: each cell has the percentage of responses that take <= the time in the header and max is the max response time in seconds. For max values in the top 25% of the range have a red background and in the bottom 25% of the range have a green background. The red background is not used when the min value is within 80% of the max value.
| dbms | 256us | 1ms | 4ms | 16ms | 64ms | 256ms | 1s | 4s | 16s | gt | max |
|---|---|---|---|---|---|---|---|---|---|---|---|
| my5649.cx6d | 8.813 | 49.274 | 41.505 | 0.331 | 0.076 | 0.058 | |||||
| my5731.cx6d | 15.672 | 40.552 | 43.394 | 0.299 | 0.084 | 0.041 | |||||
| my8021.cx6d | 7.270 | 40.535 | 51.625 | 0.398 | 0.172 | nonzero | nonzero | 0.286 | |||
| my8022.cx6d | 10.441 | 45.140 | 44.063 | 0.267 | 0.089 | 0.043 | |||||
| pg1110.cx5 | 99.844 | 0.155 | 0.001 | nonzero | 0.005 | ||||||
| pg124.cx5 | 99.928 | 0.071 | 0.001 | nonzero | 0.005 | ||||||
| pg131.cx5 | 99.932 | 0.067 | 0.001 | nonzero | 0.006 | ||||||
| rx56.cx6a | 98.023 | 1.976 | 0.001 | 0.002 | |||||||
| rx80.cx6a | 97.747 | 2.251 | 0.002 | nonzero | 0.014 |
Insert response time histogram: each cell has the percentage of responses that take <= the time in the header and max is the max response time in seconds. For max values in the top 25% of the range have a red background and in the bottom 25% of the range have a green background. The red background is not used when the min value is within 80% of the max value.
| dbms | 256us | 1ms | 4ms | 16ms | 64ms | 256ms | 1s | 4s | 16s | gt | max |
|---|---|---|---|---|---|---|---|---|---|---|---|
| my5649.cx6d | 50.632 | 43.562 | 5.806 | 0.044 | |||||||
| my5731.cx6d | 40.278 | 59.007 | 0.715 | 0.035 | |||||||
| my8021.cx6d | 16.688 | 82.361 | 0.951 | 0.041 | |||||||
| my8022.cx6d | 20.660 | 78.319 | 1.014 | 0.007 | 0.068 | ||||||
| pg1110.cx5 | 98.069 | 1.931 | 0.027 | ||||||||
| pg124.cx5 | 97.938 | 2.062 | 0.034 | ||||||||
| pg131.cx5 | 98.132 | 1.868 | 0.028 | ||||||||
| rx56.cx6a | 1.458 | 98.465 | 0.076 | 0.014 | |||||||
| rx80.cx6a | 99.882 | 0.097 | 0.021 | 0.019 |
Performance metrics for the DBMS listed above. Some are normalized by throughput, others are not. Legend for results is here.
ips	qps	rps	rmbps	wps	wmbps	rpq	rkbpq	wpi	wkbpi	csps	cpups	cspq	cpupq	dbgb1	dbgb2	rss	maxop	p50	p99	tag
399	875	3394	52.9	378.8	11.8	3.880	61.975	0.949	30.187	10883	16.8	12.441	768	102.0	144.4	10.7	0.058	863	623	my5649.cx6d
399	905	3497	54.6	393.3	12.0	3.863	61.804	0.985	30.869	11510	17.3	12.715	764	102.0	144.4	11.1	0.041	879	639	my5731.cx6d
399	734	2847	44.5	428.7	10.8	3.878	62.048	1.074	27.817	12834	23.6	17.482	1286	101.6	144.0	11.2	0.286	735	64	my8021.cx6d
399	877	3392	53.0	461.8	11.7	3.867	61.864	1.157	29.987	13318	21.7	15.181	989	101.6	144.1	11.2	0.043	863	656	my8022.cx6d
399	7119	524	4.2	907.0	15.2	0.074	0.598	2.271	38.959	28523	28.1	4.007	158	94.1	97.5	0.0	0.005	7128	6968	pg1110.cx5
399	7548	521	4.1	905.5	15.2	0.069	0.560	2.268	38.887	30146	28.2	3.994	149	94.0	97.4	0.0	0.005	7560	7389	pg124.cx5
399	7598	521	4.1	907.4	15.1	0.069	0.557	2.272	38.821	30328	28.1	3.992	148	94.0	97.4	0.0	0.006	7608	7464	pg131.cx5
399	5085	0	0.0	4.5	0.6	0.000	0.000	0.011	1.540	19580	26.3	3.851	207	56.0	56.8	11.9	0.002	5084	4940	rx56.cx6a
400	4588	0	0.0	4.5	0.6	0.000	0.000	0.011	1.543	17820	27.0	3.884	235	56.1	57.1	12.2	0.014	4587	4491	rx80.cx6a
q600.2
q600.2: range queries with 600 insert/s per client, 2nd loop. Graphs for performance per 1-second interval are here.
Average throughput:

Query response time histogram: each cell has the percentage of responses that take <= the time in the header and max is the max response time in seconds. For max values in the top 25% of the range have a red background and in the bottom 25% of the range have a green background. The red background is not used when the min value is within 80% of the max value.
| dbms | 256us | 1ms | 4ms | 16ms | 64ms | 256ms | 1s | 4s | 16s | gt | max |
|---|---|---|---|---|---|---|---|---|---|---|---|
| my5649.cx6d | 10.829 | 46.423 | 42.315 | 0.346 | 0.087 | 0.060 | |||||
| my5731.cx6d | 18.147 | 37.596 | 43.866 | 0.274 | 0.117 | 0.051 | |||||
| my8021.cx6d | 9.283 | 38.683 | 51.558 | 0.350 | 0.127 | 0.051 | |||||
| my8022.cx6d | 10.871 | 44.000 | 44.741 | 0.267 | 0.121 | 0.049 | |||||
| pg1110.cx5 | 99.801 | 0.197 | 0.002 | nonzero | nonzero | 0.017 | |||||
| pg124.cx5 | 99.900 | 0.098 | 0.002 | nonzero | 0.005 | ||||||
| pg131.cx5 | 99.905 | 0.093 | 0.002 | nonzero | 0.015 | ||||||
| rx56.cx6a | 98.007 | 1.992 | 0.002 | 0.002 | |||||||
| rx80.cx6a | 97.700 | 2.296 | 0.003 | 0.003 |
Insert response time histogram: each cell has the percentage of responses that take <= the time in the header and max is the max response time in seconds. For max values in the top 25% of the range have a red background and in the bottom 25% of the range have a green background. The red background is not used when the min value is within 80% of the max value.
| dbms | 256us | 1ms | 4ms | 16ms | 64ms | 256ms | 1s | 4s | 16s | gt | max |
|---|---|---|---|---|---|---|---|---|---|---|---|
| my5649.cx6d | 64.407 | 33.190 | 2.403 | 0.042 | |||||||
| my5731.cx6d | 54.750 | 44.593 | 0.657 | 0.034 | |||||||
| my8021.cx6d | 28.880 | 70.542 | 0.579 | 0.055 | |||||||
| my8022.cx6d | 31.032 | 68.144 | 0.824 | 0.059 | |||||||
| pg1110.cx5 | 96.796 | 3.199 | 0.005 | 0.072 | |||||||
| pg124.cx5 | 96.144 | 3.852 | 0.005 | 0.091 | |||||||
| pg131.cx5 | 96.463 | 3.537 | 0.057 | ||||||||
| rx56.cx6a | 0.185 | 99.745 | 0.065 | 0.005 | 0.048 | ||||||
| rx80.cx6a | 99.921 | 0.069 | 0.009 | 0.018 |
Performance metrics for the DBMS listed above. Some are normalized by throughput, others are not. Legend for results is here.
ips	qps	rps	rmbps	wps	wmbps	rpq	rkbpq	wpi	wkbpi	csps	cpups	cspq	cpupq	dbgb1	dbgb2	rss	maxop	p50	p99	tag
599	877	3464	54.0	476.7	14.9	3.950	63.051	0.796	25.458	11331	17.1	12.922	780	102.1	144.5	10.7	0.060	863	623	my5649.cx6d
599	915	3595	56.2	471.8	14.7	3.928	62.842	0.788	25.134	11932	17.3	13.036	756	102.1	144.6	11.1	0.051	911	639	my5731.cx6d
599	762	3013	47.1	530.4	13.5	3.954	63.270	0.885	23.117	13742	24.1	18.034	1265	101.7	144.2	11.2	0.051	751	591	my8021.cx6d
599	872	3434	53.7	557.1	14.2	3.937	62.986	0.930	24.276	13765	21.9	15.781	1004	101.7	144.2	11.2	0.049	863	655	my8022.cx6d
599	7080	802	6.4	1201.1	21.3	0.113	0.921	2.005	36.341	28978	28.5	4.093	161	94.7	99.5	0.0	0.017	7083	6920	pg1110.cx5
599	7540	808	6.4	1206.6	21.3	0.107	0.871	2.013	36.465	30719	28.6	4.074	152	94.7	99.5	0.0	0.005	7544	7400	pg124.cx5
599	7578	807	6.4	1207.6	21.4	0.107	0.866	2.015	36.489	30855	28.6	4.072	151	94.7	99.5	0.0	0.015	7576	7388	pg131.cx5
599	5066	0	0.0	3.1	0.1	0.000	0.000	0.005	0.193	19513	26.3	3.852	208	56.1	57.3	12.1	0.002	5066	4986	rx56.cx6a
599	4602	0	0.0	3.2	0.1	0.000	0.000	0.005	0.196	17891	27.0	3.887	235	56.2	57.5	12.5	0.003	4603	4523	rx80.cx6a
q800.2
q800.2: range queries with 800 insert/s per client, 2nd loop. Graphs for performance per 1-second interval are here.
Average throughput:
Query response time histogram: each cell has the percentage of responses that take <= the time in the header and max is the max response time in seconds. For max values in the top 25% of the range have a red background and in the bottom 25% of the range have a green background. The red background is not used when the min value is within 80% of the max value.
| dbms | 256us | 1ms | 4ms | 16ms | 64ms | 256ms | 1s | 4s | 16s | gt | max |
|---|---|---|---|---|---|---|---|---|---|---|---|
| my5649.cx6d | 11.540 | 44.905 | 43.119 | 0.318 | 0.118 | 0.052 | |||||
| my5731.cx6d | 19.792 | 35.238 | 44.531 | 0.313 | 0.126 | 0.052 | |||||
| my8021.cx6d | 9.187 | 37.540 | 52.634 | 0.480 | 0.160 | nonzero | 0.069 | ||||
| my8022.cx6d | 13.288 | 40.532 | 45.744 | 0.319 | 0.117 | 0.052 | |||||
| pg1110.cx5 | 99.756 | 0.241 | 0.003 | nonzero | nonzero | 0.017 | |||||
| pg124.cx5 | 99.870 | 0.128 | 0.002 | nonzero | 0.006 | ||||||
| pg131.cx5 | 99.873 | 0.125 | 0.003 | nonzero | 0.012 | ||||||
| rx56.cx6a | 97.960 | 2.038 | 0.002 | nonzero | 0.013 | ||||||
| rx80.cx6a | 96.979 | 3.017 | 0.005 | nonzero | 0.008 |
Insert response time histogram: each cell has the percentage of responses that take <= the time in the header and max is the max response time in seconds. For max values in the top 25% of the range have a red background and in the bottom 25% of the range have a green background. The red background is not used when the min value is within 80% of the max value.
| dbms | 256us | 1ms | 4ms | 16ms | 64ms | 256ms | 1s | 4s | 16s | gt | max |
|---|---|---|---|---|---|---|---|---|---|---|---|
| my5649.cx6d | 64.354 | 30.892 | 4.753 | 0.045 | |||||||
| my5731.cx6d | 60.722 | 38.774 | 0.503 | 0.039 | |||||||
| my8021.cx6d | 32.913 | 65.031 | 2.052 | 0.003 | 0.139 | ||||||
| my8022.cx6d | 36.378 | 62.875 | 0.747 | 0.055 | |||||||
| pg1110.cx5 | 96.010 | 3.990 | 0.051 | ||||||||
| pg124.cx5 | 94.573 | 5.424 | 0.003 | 0.075 | |||||||
| pg131.cx5 | 94.684 | 5.312 | 0.003 | 0.077 | |||||||
| rx56.cx6a | 0.642 | 99.323 | 0.035 | 0.005 | |||||||
| rx80.cx6a | 99.927 | 0.056 | 0.017 | 0.019 |
Performance metrics for the DBMS listed above. Some are normalized by throughput, others are not. Legend for results is here.
ips	qps	rps	rmbps	wps	wmbps	rpq	rkbpq	wpi	wkbpi	csps	cpups	cspq	cpupq	dbgb1	dbgb2	rss	maxop	p50	p99	tag
798	891	3661	57.0	601.3	18.9	4.111	65.570	0.753	24.193	12104	17.1	13.589	768	102.3	144.7	10.7	0.052	895	624	my5649.cx6d
799	920	3736	58.4	602.9	18.8	4.061	64.973	0.755	24.125	12566	17.6	13.658	765	102.3	144.8	11.1	0.052	911	639	my5731.cx6d
799	744	3055	47.7	669.4	17.1	4.106	65.701	0.838	21.974	14215	24.7	19.106	1328	101.9	144.4	11.2	0.069	735	560	my8021.cx6d
799	888	3622	56.6	729.4	18.6	4.081	65.292	0.913	23.889	14658	22.2	16.516	1001	101.9	144.4	11.2	0.052	879	655	my8022.cx6d
799	7089	1031	8.2	1403.7	26.4	0.145	1.186	1.758	33.833	29497	28.8	4.161	163	95.1	101.0	0.0	0.017	7096	6920	pg1110.cx5
799	7518	1030	8.2	1398.5	26.3	0.137	1.116	1.751	33.691	31150	29.0	4.143	154	95.1	101.0	0.0	0.006	7528	7352	pg124.cx5
799	7561	1030	8.2	1400.8	26.3	0.136	1.111	1.754	33.720	31310	29.0	4.141	153	95.1	101.0	0.0	0.012	7576	7384	pg131.cx5
799	5013	0	0.0	4.6	0.7	0.000	0.000	0.006	0.921	19377	26.7	3.865	213	56.5	58.0	12.0	0.013	5018	4827	rx56.cx6a
799	4502	0	0.0	4.8	0.7	0.000	0.000	0.006	0.923	17570	27.4	3.903	243	56.6	58.3	12.4	0.008	4507	4395	rx80.cx6a
q1000.2
q1000.2: range queries with 1000 insert/s per client, 2nd loop. Graphs for performance per 1-second interval are here.
Average throughput:
Query response time histogram: each cell has the percentage of responses that take <= the time in the header and max is the max response time in seconds. For max values in the top 25% of the range have a red background and in the bottom 25% of the range have a green background. The red background is not used when the min value is within 80% of the max value.
| dbms | 256us | 1ms | 4ms | 16ms | 64ms | 256ms | 1s | 4s | 16s | gt | max |
|---|---|---|---|---|---|---|---|---|---|---|---|
| my5649.cx6d | 12.190 | 43.570 | 43.762 | 0.337 | 0.142 | 0.061 | |||||
| my5731.cx6d | 19.959 | 34.193 | 45.354 | 0.367 | 0.127 | nonzero | nonzero | 0.485 | |||
| my8021.cx6d | 10.097 | 36.437 | 52.761 | 0.530 | 0.175 | 0.058 | |||||
| my8022.cx6d | 14.162 | 39.114 | 46.231 | 0.367 | 0.125 | nonzero | nonzero | 0.305 | |||
| pg1110.cx5 | 99.692 | 0.305 | 0.003 | nonzero | nonzero | 0.018 | |||||
| pg124.cx5 | 99.829 | 0.169 | 0.003 | nonzero | 0.006 | ||||||
| pg131.cx5 | 99.848 | 0.149 | 0.003 | nonzero | 0.005 | ||||||
| rx56.cx6a | 97.667 | 2.331 | 0.002 | nonzero | 0.009 | ||||||
| rx80.cx6a | 96.826 | 3.166 | 0.008 | nonzero | 0.013 |
Insert response time histogram: each cell has the percentage of responses that take <= the time in the header and max is the max response time in seconds. For max values in the top 25% of the range have a red background and in the bottom 25% of the range have a green background. The red background is not used when the min value is within 80% of the max value.
| dbms | 256us | 1ms | 4ms | 16ms | 64ms | 256ms | 1s | 4s | 16s | gt | max |
|---|---|---|---|---|---|---|---|---|---|---|---|
| my5649.cx6d | 67.586 | 28.956 | 3.456 | 0.003 | 0.122 | ||||||
| my5731.cx6d | 65.592 | 33.803 | 0.600 | 0.006 | 0.130 | ||||||
| my8021.cx6d | 45.700 | 53.297 | 1.000 | 0.003 | 0.134 | ||||||
| my8022.cx6d | 45.083 | 53.906 | 0.994 | 0.014 | 0.003 | 0.281 | |||||
| pg1110.cx5 | 94.831 | 5.167 | 0.003 | 0.094 | |||||||
| pg124.cx5 | 93.794 | 6.206 | 0.064 | ||||||||
| pg131.cx5 | 94.142 | 5.853 | 0.006 | 0.088 | |||||||
| rx56.cx6a | 0.542 | 99.414 | 0.039 | 0.006 | 0.041 | ||||||
| rx80.cx6a | 99.869 | 0.108 | 0.022 | 0.019 |
Performance metrics for the DBMS listed above. Some are normalized by throughput, others are not. Legend for results is here.
ips	qps	rps	rmbps	wps	wmbps	rpq	rkbpq	wpi	wkbpi	csps	cpups	cspq	cpupq	dbgb1	dbgb2	rss	maxop	p50	p99	tag
998	888	3736	58.2	699.8	22.0	4.205	67.036	0.701	22.595	12466	17.4	14.032	783	102.5	145.2	10.7	0.061	879	623	my5649.cx6d
998	911	3812	59.6	728.8	22.8	4.184	66.942	0.730	23.346	12988	18.2	14.256	799	102.5	145.2	11.1	0.485	895	655	my5731.cx6d
998	748	3167	49.5	821.1	21.1	4.232	67.710	0.823	21.627	14795	25.2	19.769	1347	102.1	144.8	11.2	0.058	736	576	my8021.cx6d
998	892	3768	58.9	906.9	23.3	4.226	67.620	0.908	23.876	15340	22.4	17.205	1005	102.1	145.0	11.2	0.305	879	671	my8022.cx6d
999	7062	1281	10.2	1686.8	32.2	0.181	1.481	1.689	33.053	29935	29.1	4.239	165	95.5	102.8	0.0	0.018	7064	6873	pg1110.cx5
998	7470	1280	10.2	1681.3	32.1	0.171	1.398	1.684	32.945	31527	29.3	4.221	157	95.5	102.7	0.0	0.006	7480	7224	pg124.cx5
998	7558	1281	10.2	1685.3	32.2	0.169	1.383	1.688	32.993	31854	29.4	4.214	156	95.5	102.7	0.0	0.005	7562	7352	pg131.cx5
998	4959	0	0.0	4.5	0.7	0.000	0.000	0.005	0.739	19198	26.8	3.872	216	56.9	58.9	12.0	0.009	4970	4763	rx56.cx6a
998	4485	0	0.0	4.7	0.7	0.000	0.000	0.005	0.741	17536	27.7	3.910	247	57.0	59.2	12.5	0.013	4478	4395	rx80.cx6a
l.i0
l.i0: load without secondary indexes
Performance metrics for all DBMS, not just the ones listed above. Some are normalized by throughput, others are not. Legend for results is here.
ips	qps	rps	rmbps	wps	wmbps	rpq	rkbpq	wpi	wkbpi	csps	cpups	cspq	cpupq	dbgb1	dbgb2	rss	maxop	p50	p99	tag
132415	0	1159	4.5	532.5	44.4	0.009	0.035	0.004	0.344	15874	46.1	0.120	14	32.9	73.4	10.6	0.404	134107	87939	my5649.cx6d
127714	0	0	0.0	537.3	43.3	0.000	0.000	0.004	0.347	14464	46.7	0.113	15	32.9	73.4	10.9	0.117	128463	113973	my5731.cx6d
84431	0	0	0.0	436.7	30.0	0.000	0.000	0.005	0.364	19593	41.0	0.232	19	32.8	73.3	11.1	0.127	84861	74832	my8021.cx6d
86029	0	0	0.0	441.2	30.6	0.000	0.000	0.005	0.364	16146	41.6	0.188	19	32.8	73.3	11.1	0.122	86347	76725	my8022.cx6d
-
103391	0	39	0.3	188.0	39.6	0.000	0.003	0.002	0.393	12355	42.1	0.119	16	47.8	55.8	0.0	0.034	103390	100293	pg1110.cx5
103455	0	44	0.4	197.0	39.8	0.000	0.003	0.002	0.394	12381	42.1	0.120	16	47.8	55.8	0.0	0.049	103586	99090	pg124.cx5
106701	0	65	3.5	167.5	51.2	0.001	0.034	0.002	0.492	12924	43.6	0.121	16	47.8	62.6	7.3	0.193	107218	101484	pg131.cx5
-
109721	0	0	0.0	47.8	16.5	0.000	0.000	0.000	0.154	11143	46.7	0.102	17	24.9	37.5	2.4	0.164	110582	95295	rx56.cx6a
84918	0	0	0.0	44.1	12.9	0.000	0.000	0.001	0.156	8934	42.4	0.105	20	24.9	37.7	2.8	0.178	85490	74617	rx80.cx6a
l.x
l.x: create secondary indexes
Performance metrics for all DBMS, not just the ones listed above. Some are normalized by throughput, others are not. Legend for results is here.
ips	qps	rps	rmbps	wps	wmbps	rpq	rkbpq	wpi	wkbpi	csps	cpups	cspq	cpupq	dbgb1	dbgb2	rss	maxop	p50	p99	tag
71433	0	444	64.3	784.1	87.2	0.006	0.921	0.011	1.250	2680	19.0	0.038	11	67.8	108.3	10.7	0.029	NA	NA	my5649.cx6d
117174	0	694	101.4	1204.8	129.1	0.006	0.886	0.010	1.128	7169	23.0	0.061	8	73.6	114.1	11.1	0.016	NA	NA	my5731.cx6d
112813	0	626	97.9	1238.4	124.2	0.006	0.889	0.011	1.128	7441	22.8	0.066	8	73.3	113.8	11.2	0.019	NA	NA	my8021.cx6d
110349	0	617	95.7	1191.5	121.4	0.006	0.888	0.011	1.127	7016	22.7	0.064	8	73.3	113.8	11.2	0.025	NA	NA	my8022.cx6d
-
220211	0	566	68.8	461.1	102.8	0.003	0.320	0.002	0.478	1007	23.0	0.005	4	91.9	111.4	0.0	0.003	NA	NA	pg1110.cx5
221971	0	571	69.4	478.5	102.8	0.003	0.320	0.002	0.474	969	22.9	0.004	4	91.9	111.6	0.0	0.003	NA	NA	pg124.cx5
240548	0	599	73.3	209.0	78.2	0.002	0.312	0.001	0.333	589	23.3	0.002	4	91.9	105.7	0.0	0.003	NA	NA	pg131.cx5
-
107827	0	94	28.7	56.2	18.7	0.001	0.272	0.001	0.178	883	24.8	0.008	9	54.4	67.1	12.1	0.011	NA	NA	rx56.cx6a
101481	0	90	27.5	52.6	17.6	0.001	0.278	0.001	0.178	994	24.8	0.010	10	54.5	67.3	12.6	0.013	NA	NA	rx80.cx6a
l.i1
l.i1: continue load after secondary indexes created
Performance metrics for all DBMS, not just the ones listed above. Some are normalized by throughput, others are not. Legend for results is here.
ips	qps	rps	rmbps	wps	wmbps	rpq	rkbpq	wpi	wkbpi	csps	cpups	cspq	cpupq	dbgb1	dbgb2	rss	maxop	p50	p99	tag
5200	0	2706	41.2	3722.9	136.1	0.520	8.113	0.716	26.802	15695	19.2	3.018	148	101.8	144.2	10.7	2.254	1448	100	my5649.cx6d
5841	0	2928	45.8	4101.5	147.4	0.501	8.021	0.702	25.842	18917	25.3	3.239	173	101.8	144.3	11.1	0.607	2597	649	my5731.cx6d
3858	0	1957	30.6	3432.3	100.1	0.507	8.114	0.890	26.575	22513	27.7	5.835	287	101.4	143.9	11.2	0.769	999	100	my8021.cx6d
3576	0	1811	28.3	3206.5	93.3	0.506	8.103	0.897	26.727	20200	26.2	5.648	293	101.4	143.9	11.2	0.662	999	150	my8022.cx6d
-
2587	0	3460	27.7	4345.9	68.7	1.337	10.967	1.680	27.193	8009	22.8	3.096	352	93.6	111.2	0.0	0.140	2647	1549	pg1110.cx5
2568	0	3432	27.5	4330.7	68.4	1.337	10.963	1.686	27.294	7952	22.6	3.096	352	93.6	111.1	0.0	0.124	2646	1498	pg124.cx5
2481	0	3493	39.7	4259.9	70.7	1.408	16.405	1.717	29.170	8091	24.1	3.262	389	93.6	111.0	0.0	0.407	2547	1348	pg131.cx5
-
43103	0	0	0.0	82.3	30.0	0.000	0.000	0.002	0.714	9145	43.1	0.212	40	55.6	56.1	12.0	0.053	42703	35362	rx56.cx6a
36232	0	0	0.0	74.5	25.6	0.000	0.000	0.002	0.723	8009	41.4	0.221	46	55.7	56.4	12.4	0.051	35912	33164	rx80.cx6a
q100.2
q100.2: range queries with 100 insert/s per client, 2nd loop
Performance metrics for all DBMS, not just the ones listed above. Some are normalized by throughput, others are not. Legend for results is here.
ips	qps	rps	rmbps	wps	wmbps	rpq	rkbpq	wpi	wkbpi	csps	cpups	cspq	cpupq	dbgb1	dbgb2	rss	maxop	p50	p99	tag
100	759	2930	45.7	296.6	9.0	3.858	61.684	2.972	92.421	9268	18.0	12.204	948	101.8	144.3	10.7	0.070	735	575	my5649.cx6d
100	239	976	15.3	251.0	7.6	4.082	65.307	2.516	77.691	3614	7.5	15.108	1254	101.8	144.3	11.1	0.088	80	48	my5731.cx6d
100	274	1101	17.2	226.7	5.6	4.021	64.328	2.271	57.895	5680	11.9	20.739	1738	101.4	143.9	11.2	0.069	80	48	my8021.cx6d
100	478	1878	29.3	295.3	7.4	3.926	62.822	2.959	75.516	7543	14.5	15.766	1212	101.4	143.9	11.2	0.063	639	48	my8022.cx6d
-
100	7209	128	1.0	276.2	4.2	0.018	0.146	2.767	43.462	28021	27.6	3.887	153	93.7	102.8	0.0	0.005	7211	7048	pg1110.cx5
100	7584	128	1.0	277.0	4.2	0.017	0.139	2.776	43.432	29446	27.7	3.883	146	93.7	103.4	0.0	0.005	7592	7448	pg124.cx5
100	7664	129	1.0	277.8	4.2	0.017	0.139	2.783	43.398	29753	27.7	3.882	145	93.7	104.1	0.0	0.003	7672	7528	pg131.cx5
-
100	5099	0	0.0	4.5	0.5	0.000	0.000	0.045	5.179	19589	26.0	3.842	204	55.7	56.3	11.8	0.015	5099	5002	rx56.cx6a
100	4651	0	0.0	4.5	0.5	0.000	0.000	0.045	5.183	18023	26.7	3.875	230	55.8	56.6	12.2	0.015	4667	4523	rx80.cx6a
q200.2
q200.2: range queries with 200 insert/s per client, 2nd loop
Performance metrics for all DBMS, not just the ones listed above. Some are normalized by throughput, others are not. Legend for results is here.
ips	qps	rps	rmbps	wps	wmbps	rpq	rkbpq	wpi	wkbpi	csps	cpups	cspq	cpupq	dbgb1	dbgb2	rss	maxop	p50	p99	tag
200	831	3202	50.0	303.5	9.3	3.854	61.599	1.521	47.782	10096	17.2	12.150	828	101.9	144.3	10.7	0.058	815	591	my5649.cx6d
200	871	3354	52.4	330.0	10.0	3.849	61.583	1.654	51.223	10811	17.4	12.406	799	101.9	144.3	11.1	0.051	847	623	my5731.cx6d
200	643	2489	38.9	361.9	9.1	3.871	61.933	1.813	46.585	11055	21.1	17.193	1313	101.5	143.9	11.2	0.056	703	48	my8021.cx6d
200	863	3316	51.8	373.6	9.4	3.844	61.505	1.872	48.093	12581	21.6	14.585	1002	101.5	144.0	11.2	0.033	847	639	my8022.cx6d
-
200	7175	256	2.0	505.8	8.1	0.036	0.290	2.534	41.485	28162	27.8	3.925	155	93.8	96.8	0.0	0.005	7176	7000	pg1110.cx5
200	7599	256	2.0	507.2	8.1	0.034	0.273	2.541	41.384	29773	28.0	3.918	147	93.7	96.8	0.0	0.004	7608	7448	pg124.cx5
200	7640	257	2.0	509.1	8.1	0.034	0.273	2.551	41.381	29930	27.9	3.917	146	93.8	96.9	0.0	0.005	7640	7496	pg131.cx5
-
200	5104	0	0.0	3.1	0.0	0.000	0.000	0.016	0.215	19594	26.0	3.839	204	55.7	56.4	12.0	0.006	5114	5018	rx56.cx6a
200	4650	0	0.0	3.1	0.0	0.000	0.000	0.016	0.218	18004	26.5	3.872	228	55.8	56.7	12.4	0.002	4651	4571	rx80.cx6a
q400.2
q400.2: range queries with 400 insert/s per client, 2nd loop
Performance metrics for all DBMS, not just the ones listed above. Some are normalized by throughput, others are not. Legend for results is here.
ips	qps	rps	rmbps	wps	wmbps	rpq	rkbpq	wpi	wkbpi	csps	cpups	cspq	cpupq	dbgb1	dbgb2	rss	maxop	p50	p99	tag
399	875	3394	52.9	378.8	11.8	3.880	61.975	0.949	30.187	10883	16.8	12.441	768	102.0	144.4	10.7	0.058	863	623	my5649.cx6d
399	905	3497	54.6	393.3	12.0	3.863	61.804	0.985	30.869	11510	17.3	12.715	764	102.0	144.4	11.1	0.041	879	639	my5731.cx6d
399	734	2847	44.5	428.7	10.8	3.878	62.048	1.074	27.817	12834	23.6	17.482	1286	101.6	144.0	11.2	0.286	735	64	my8021.cx6d
399	877	3392	53.0	461.8	11.7	3.867	61.864	1.157	29.987	13318	21.7	15.181	989	101.6	144.1	11.2	0.043	863	656	my8022.cx6d
-
399	7119	524	4.2	907.0	15.2	0.074	0.598	2.271	38.959	28523	28.1	4.007	158	94.1	97.5	0.0	0.005	7128	6968	pg1110.cx5
399	7548	521	4.1	905.5	15.2	0.069	0.560	2.268	38.887	30146	28.2	3.994	149	94.0	97.4	0.0	0.005	7560	7389	pg124.cx5
399	7598	521	4.1	907.4	15.1	0.069	0.557	2.272	38.821	30328	28.1	3.992	148	94.0	97.4	0.0	0.006	7608	7464	pg131.cx5
-
399	5085	0	0.0	4.5	0.6	0.000	0.000	0.011	1.540	19580	26.3	3.851	207	56.0	56.8	11.9	0.002	5084	4940	rx56.cx6a
400	4588	0	0.0	4.5	0.6	0.000	0.000	0.011	1.543	17820	27.0	3.884	235	56.1	57.1	12.2	0.014	4587	4491	rx80.cx6a
q600.2
q600.2: range queries with 600 insert/s per client, 2nd loop
Performance metrics for all DBMS, not just the ones listed above. Some are normalized by throughput, others are not. Legend for results is here.
ips	qps	rps	rmbps	wps	wmbps	rpq	rkbpq	wpi	wkbpi	csps	cpups	cspq	cpupq	dbgb1	dbgb2	rss	maxop	p50	p99	tag
599	877	3464	54.0	476.7	14.9	3.950	63.051	0.796	25.458	11331	17.1	12.922	780	102.1	144.5	10.7	0.060	863	623	my5649.cx6d
599	915	3595	56.2	471.8	14.7	3.928	62.842	0.788	25.134	11932	17.3	13.036	756	102.1	144.6	11.1	0.051	911	639	my5731.cx6d
599	762	3013	47.1	530.4	13.5	3.954	63.270	0.885	23.117	13742	24.1	18.034	1265	101.7	144.2	11.2	0.051	751	591	my8021.cx6d
599	872	3434	53.7	557.1	14.2	3.937	62.986	0.930	24.276	13765	21.9	15.781	1004	101.7	144.2	11.2	0.049	863	655	my8022.cx6d
-
599	7080	802	6.4	1201.1	21.3	0.113	0.921	2.005	36.341	28978	28.5	4.093	161	94.7	99.5	0.0	0.017	7083	6920	pg1110.cx5
599	7540	808	6.4	1206.6	21.3	0.107	0.871	2.013	36.465	30719	28.6	4.074	152	94.7	99.5	0.0	0.005	7544	7400	pg124.cx5
599	7578	807	6.4	1207.6	21.4	0.107	0.866	2.015	36.489	30855	28.6	4.072	151	94.7	99.5	0.0	0.015	7576	7388	pg131.cx5
-
599	5066	0	0.0	3.1	0.1	0.000	0.000	0.005	0.193	19513	26.3	3.852	208	56.1	57.3	12.1	0.002	5066	4986	rx56.cx6a
599	4602	0	0.0	3.2	0.1	0.000	0.000	0.005	0.196	17891	27.0	3.887	235	56.2	57.5	12.5	0.003	4603	4523	rx80.cx6a
q800.2
q800.2: range queries with 800 insert/s per client, 2nd loop
Performance metrics for all DBMS, not just the ones listed above. Some are normalized by throughput, others are not. Legend for results is here.
ips	qps	rps	rmbps	wps	wmbps	rpq	rkbpq	wpi	wkbpi	csps	cpups	cspq	cpupq	dbgb1	dbgb2	rss	maxop	p50	p99	tag
798	891	3661	57.0	601.3	18.9	4.111	65.570	0.753	24.193	12104	17.1	13.589	768	102.3	144.7	10.7	0.052	895	624	my5649.cx6d
799	920	3736	58.4	602.9	18.8	4.061	64.973	0.755	24.125	12566	17.6	13.658	765	102.3	144.8	11.1	0.052	911	639	my5731.cx6d
799	744	3055	47.7	669.4	17.1	4.106	65.701	0.838	21.974	14215	24.7	19.106	1328	101.9	144.4	11.2	0.069	735	560	my8021.cx6d
799	888	3622	56.6	729.4	18.6	4.081	65.292	0.913	23.889	14658	22.2	16.516	1001	101.9	144.4	11.2	0.052	879	655	my8022.cx6d
-
799	7089	1031	8.2	1403.7	26.4	0.145	1.186	1.758	33.833	29497	28.8	4.161	163	95.1	101.0	0.0	0.017	7096	6920	pg1110.cx5
799	7518	1030	8.2	1398.5	26.3	0.137	1.116	1.751	33.691	31150	29.0	4.143	154	95.1	101.0	0.0	0.006	7528	7352	pg124.cx5
799	7561	1030	8.2	1400.8	26.3	0.136	1.111	1.754	33.720	31310	29.0	4.141	153	95.1	101.0	0.0	0.012	7576	7384	pg131.cx5
-
799	5013	0	0.0	4.6	0.7	0.000	0.000	0.006	0.921	19377	26.7	3.865	213	56.5	58.0	12.0	0.013	5018	4827	rx56.cx6a
799	4502	0	0.0	4.8	0.7	0.000	0.000	0.006	0.923	17570	27.4	3.903	243	56.6	58.3	12.4	0.008	4507	4395	rx80.cx6a
q1000.2
q1000.2: range queries with 1000 insert/s per client, 2nd loop
Performance metrics for all DBMS, not just the ones listed above. Some are normalized by throughput, others are not. Legend for results is here.
ips	qps	rps	rmbps	wps	wmbps	rpq	rkbpq	wpi	wkbpi	csps	cpups	cspq	cpupq	dbgb1	dbgb2	rss	maxop	p50	p99	tag
998	888	3736	58.2	699.8	22.0	4.205	67.036	0.701	22.595	12466	17.4	14.032	783	102.5	145.2	10.7	0.061	879	623	my5649.cx6d
998	911	3812	59.6	728.8	22.8	4.184	66.942	0.730	23.346	12988	18.2	14.256	799	102.5	145.2	11.1	0.485	895	655	my5731.cx6d
998	748	3167	49.5	821.1	21.1	4.232	67.710	0.823	21.627	14795	25.2	19.769	1347	102.1	144.8	11.2	0.058	736	576	my8021.cx6d
998	892	3768	58.9	906.9	23.3	4.226	67.620	0.908	23.876	15340	22.4	17.205	1005	102.1	145.0	11.2	0.305	879	671	my8022.cx6d
-
999	7062	1281	10.2	1686.8	32.2	0.181	1.481	1.689	33.053	29935	29.1	4.239	165	95.5	102.8	0.0	0.018	7064	6873	pg1110.cx5
998	7470	1280	10.2	1681.3	32.1	0.171	1.398	1.684	32.945	31527	29.3	4.221	157	95.5	102.7	0.0	0.006	7480	7224	pg124.cx5
998	7558	1281	10.2	1685.3	32.2	0.169	1.383	1.688	32.993	31854	29.4	4.214	156	95.5	102.7	0.0	0.005	7562	7352	pg131.cx5
-
998	4959	0	0.0	4.5	0.7	0.000	0.000	0.005	0.739	19198	26.8	3.872	216	56.9	58.9	12.0	0.009	4970	4763	rx56.cx6a
998	4485	0	0.0	4.7	0.7	0.000	0.000	0.005	0.741	17536	27.7	3.910	247	57.0	59.2	12.5	0.013	4478	4395	rx80.cx6a
l.i0
- l.i0: load without secondary indexes
- Legend for results is here.
- Each entry lists the percentage of responses that fit in that bucket (slower than max time for previous bucket, faster than min time for next bucket).
Insert response time histogram
256us	1ms	4ms	16ms	64ms	256ms	1s	4s	16s	gt	max	tag
0.000	97.162	2.403	0.372	0.059	0.001	0.003	0.000	0.000	0.000	0.404	my5649.cx6d
0.000	98.452	1.302	0.241	0.001	0.004	0.000	0.000	0.000	0.000	0.117	my5731.cx6d
0.000	0.000	99.595	0.373	0.030	0.002	0.000	0.000	0.000	0.000	0.127	my8021.cx6d
0.000	0.009	99.740	0.130	0.117	0.003	0.000	0.000	0.000	0.000	0.122	my8022.cx6d
-
0.000	94.162	5.836	0.001	0.001	0.000	0.000	0.000	0.000	0.000	0.034	pg1110.cx5
0.000	94.458	5.541	0.001	nonzero	0.000	0.000	0.000	0.000	0.000	0.049	pg124.cx5
0.000	96.358	3.636	0.005	0.001	nonzero	0.000	0.000	0.000	0.000	0.193	pg131.cx5
-
0.000	98.597	1.351	0.049	nonzero	0.004	0.000	0.000	0.000	0.000	0.164	rx56.cx6a
0.000	nonzero	99.835	0.147	0.015	0.002	0.000	0.000	0.000	0.000	0.178	rx80.cx6a
l.x
- l.x: create secondary indexes
- Legend for results is here.
- Each entry lists the percentage of responses that fit in that bucket (slower than max time for previous bucket, faster than min time for next bucket).
TODO - determine whether there is data for create index response time
l.i1
- l.i1: continue load after secondary indexes created
- Legend for results is here.
- Each entry lists the percentage of responses that fit in that bucket (slower than max time for previous bucket, faster than min time for next bucket).
Insert response time histogram
256us	1ms	4ms	16ms	64ms	256ms	1s	4s	16s	gt	max	tag
0.000	0.000	72.014	14.130	11.902	1.640	0.313	0.001	0.000	0.000	2.254	my5649.cx6d
0.000	0.000	66.857	22.391	9.595	0.923	0.234	0.000	0.000	0.000	0.607	my5731.cx6d
0.000	0.000	62.963	21.230	11.406	4.109	0.292	0.000	0.000	0.000	0.769	my8021.cx6d
0.000	0.000	63.946	19.710	11.128	4.822	0.394	0.000	0.000	0.000	0.662	my8022.cx6d
-
0.000	0.000	0.000	31.710	68.254	0.036	0.000	0.000	0.000	0.000	0.140	pg1110.cx5
0.000	0.000	0.000	31.734	68.237	0.028	0.000	0.000	0.000	0.000	0.124	pg124.cx5
0.000	0.000	0.000	28.256	71.550	0.192	0.002	0.000	0.000	0.000	0.407	pg131.cx5
-
0.000	7.421	92.478	0.099	0.003	0.000	0.000	0.000	0.000	0.000	0.053	rx56.cx6a
0.000	0.146	99.696	0.145	0.013	0.000	0.000	0.000	0.000	0.000	0.051	rx80.cx6a
q100.2
- q100.2: range queries with 100 insert/s per client, 2nd loop
- Legend for results is here.
- Each entry lists the percentage of responses that fit in that bucket (slower than max time for previous bucket, faster than min time for next bucket).
Query response time histogram
256us	1ms	4ms	16ms	64ms	256ms	1s	4s	16s	gt	max	tag
4.290	53.978	41.224	0.466	0.041	nonzero	0.000	0.000	0.000	0.000	0.070	my5649.cx6d
7.643	37.311	45.216	1.537	8.292	nonzero	0.000	0.000	0.000	0.000	0.088	my5731.cx6d
2.944	37.970	51.374	1.343	6.369	nonzero	0.000	0.000	0.000	0.000	0.069	my8021.cx6d
5.968	46.593	44.016	0.877	2.546	0.000	0.000	0.000	0.000	0.000	0.063	my8022.cx6d
-
99.906	0.094	nonzero	nonzero	0.000	0.000	0.000	0.000	0.000	0.000	0.005	pg1110.cx5
99.961	0.039	nonzero	nonzero	0.000	0.000	0.000	0.000	0.000	0.000	0.005	pg124.cx5
99.966	0.034	nonzero	0.000	0.000	0.000	0.000	0.000	0.000	0.000	0.003	pg131.cx5
-
97.897	2.103	nonzero	nonzero	0.000	0.000	0.000	0.000	0.000	0.000	0.015	rx56.cx6a
98.164	1.836	nonzero	nonzero	0.000	0.000	0.000	0.000	0.000	0.000	0.015	rx80.cx6a
Insert response time histogram
256us	1ms	4ms	16ms	64ms	256ms	1s	4s	16s	gt	max	tag
0.000	0.000	0.000	41.389	58.389	0.222	0.000	0.000	0.000	0.000	0.097	my5649.cx6d
0.000	0.000	16.472	76.583	6.944	0.000	0.000	0.000	0.000	0.000	0.031	my5731.cx6d
0.000	0.000	2.500	62.528	34.972	0.000	0.000	0.000	0.000	0.000	0.051	my8021.cx6d
0.000	0.000	0.139	51.944	47.861	0.056	0.000	0.000	0.000	0.000	0.072	my8022.cx6d
-
0.000	0.000	0.000	84.389	15.611	0.000	0.000	0.000	0.000	0.000	0.031	pg1110.cx5
0.000	0.000	0.000	85.028	14.972	0.000	0.000	0.000	0.000	0.000	0.026	pg124.cx5
0.000	0.000	0.000	85.222	14.778	0.000	0.000	0.000	0.000	0.000	0.028	pg131.cx5
-
0.000	2.056	97.861	0.083	0.000	0.000	0.000	0.000	0.000	0.000	0.014	rx56.cx6a
0.000	0.000	99.889	0.083	0.028	0.000	0.000	0.000	0.000	0.000	0.018	rx80.cx6a
q200.2
- q200.2: range queries with 200 insert/s per client, 2nd loop
- Legend for results is here.
- Each entry lists the percentage of responses that fit in that bucket (slower than max time for previous bucket, faster than min time for next bucket).
Query response time histogram
256us	1ms	4ms	16ms	64ms	256ms	1s	4s	16s	gt	max	tag
5.793	52.873	40.902	0.386	0.047	0.000	0.000	0.000	0.000	0.000	0.058	my5649.cx6d
10.081	47.008	42.533	0.305	0.074	0.000	0.000	0.000	0.000	0.000	0.051	my5731.cx6d
4.556	43.785	50.682	0.312	0.665	0.000	0.000	0.000	0.000	0.000	0.056	my8021.cx6d
7.272	49.604	42.791	0.271	0.061	0.000	0.000	0.000	0.000	0.000	0.033	my8022.cx6d
-
99.884	0.115	0.001	nonzero	0.000	0.000	0.000	0.000	0.000	0.000	0.005	pg1110.cx5
99.949	0.051	0.001	nonzero	0.000	0.000	0.000	0.000	0.000	0.000	0.004	pg124.cx5
99.952	0.047	0.001	nonzero	0.000	0.000	0.000	0.000	0.000	0.000	0.005	pg131.cx5
-
98.213	1.786	nonzero	nonzero	0.000	0.000	0.000	0.000	0.000	0.000	0.006	rx56.cx6a
98.296	1.703	nonzero	0.000	0.000	0.000	0.000	0.000	0.000	0.000	0.002	rx80.cx6a
Insert response time histogram
256us	1ms	4ms	16ms	64ms	256ms	1s	4s	16s	gt	max	tag
0.000	0.000	14.347	66.264	19.389	0.000	0.000	0.000	0.000	0.000	0.057	my5649.cx6d
0.000	0.000	2.208	94.042	3.750	0.000	0.000	0.000	0.000	0.000	0.042	my5731.cx6d
0.000	0.000	4.806	91.208	3.986	0.000	0.000	0.000	0.000	0.000	0.041	my8021.cx6d
0.000	0.000	0.236	90.333	9.431	0.000	0.000	0.000	0.000	0.000	0.046	my8022.cx6d
-
0.000	0.000	0.000	97.056	2.944	0.000	0.000	0.000	0.000	0.000	0.024	pg1110.cx5
0.000	0.000	0.000	97.069	2.931	0.000	0.000	0.000	0.000	0.000	0.028	pg124.cx5
0.000	0.000	0.000	97.264	2.736	0.000	0.000	0.000	0.000	0.000	0.029	pg131.cx5
-
0.000	0.000	99.944	0.056	0.000	0.000	0.000	0.000	0.000	0.000	0.005	rx56.cx6a
0.000	0.000	99.889	0.097	0.014	0.000	0.000	0.000	0.000	0.000	0.018	rx80.cx6a
q400.2
- q400.2: range queries with 400 insert/s per client, 2nd loop
- Legend for results is here.
- Each entry lists the percentage of responses that fit in that bucket (slower than max time for previous bucket, faster than min time for next bucket).
Query response time histogram
256us	1ms	4ms	16ms	64ms	256ms	1s	4s	16s	gt	max	tag
8.813	49.274	41.505	0.331	0.076	0.000	0.000	0.000	0.000	0.000	0.058	my5649.cx6d
15.672	40.552	43.394	0.299	0.084	0.000	0.000	0.000	0.000	0.000	0.041	my5731.cx6d
7.270	40.535	51.625	0.398	0.172	nonzero	nonzero	0.000	0.000	0.000	0.286	my8021.cx6d
10.441	45.140	44.063	0.267	0.089	0.000	0.000	0.000	0.000	0.000	0.043	my8022.cx6d
-
99.844	0.155	0.001	nonzero	0.000	0.000	0.000	0.000	0.000	0.000	0.005	pg1110.cx5
99.928	0.071	0.001	nonzero	0.000	0.000	0.000	0.000	0.000	0.000	0.005	pg124.cx5
99.932	0.067	0.001	nonzero	0.000	0.000	0.000	0.000	0.000	0.000	0.006	pg131.cx5
-
98.023	1.976	0.001	0.000	0.000	0.000	0.000	0.000	0.000	0.000	0.002	rx56.cx6a
97.747	2.251	0.002	nonzero	0.000	0.000	0.000	0.000	0.000	0.000	0.014	rx80.cx6a
Insert response time histogram
256us	1ms	4ms	16ms	64ms	256ms	1s	4s	16s	gt	max	tag
0.000	0.000	50.632	43.562	5.806	0.000	0.000	0.000	0.000	0.000	0.044	my5649.cx6d
0.000	0.000	40.278	59.007	0.715	0.000	0.000	0.000	0.000	0.000	0.035	my5731.cx6d
0.000	0.000	16.688	82.361	0.951	0.000	0.000	0.000	0.000	0.000	0.041	my8021.cx6d
0.000	0.000	20.660	78.319	1.014	0.007	0.000	0.000	0.000	0.000	0.068	my8022.cx6d
-
0.000	0.000	0.000	98.069	1.931	0.000	0.000	0.000	0.000	0.000	0.027	pg1110.cx5
0.000	0.000	0.000	97.938	2.062	0.000	0.000	0.000	0.000	0.000	0.034	pg124.cx5
0.000	0.000	0.000	98.132	1.868	0.000	0.000	0.000	0.000	0.000	0.028	pg131.cx5
-
0.000	1.458	98.465	0.076	0.000	0.000	0.000	0.000	0.000	0.000	0.014	rx56.cx6a
0.000	0.000	99.882	0.097	0.021	0.000	0.000	0.000	0.000	0.000	0.019	rx80.cx6a
q600.2
- q600.2: range queries with 600 insert/s per client, 2nd loop
- Legend for results is here.
- Each entry lists the percentage of responses that fit in that bucket (slower than max time for previous bucket, faster than min time for next bucket).
Query response time histogram
256us	1ms	4ms	16ms	64ms	256ms	1s	4s	16s	gt	max	tag
10.829	46.423	42.315	0.346	0.087	0.000	0.000	0.000	0.000	0.000	0.060	my5649.cx6d
18.147	37.596	43.866	0.274	0.117	0.000	0.000	0.000	0.000	0.000	0.051	my5731.cx6d
9.283	38.683	51.558	0.350	0.127	0.000	0.000	0.000	0.000	0.000	0.051	my8021.cx6d
10.871	44.000	44.741	0.267	0.121	0.000	0.000	0.000	0.000	0.000	0.049	my8022.cx6d
-
99.801	0.197	0.002	nonzero	nonzero	0.000	0.000	0.000	0.000	0.000	0.017	pg1110.cx5
99.900	0.098	0.002	nonzero	0.000	0.000	0.000	0.000	0.000	0.000	0.005	pg124.cx5
99.905	0.093	0.002	nonzero	0.000	0.000	0.000	0.000	0.000	0.000	0.015	pg131.cx5
-
98.007	1.992	0.002	0.000	0.000	0.000	0.000	0.000	0.000	0.000	0.002	rx56.cx6a
97.700	2.296	0.003	0.000	0.000	0.000	0.000	0.000	0.000	0.000	0.003	rx80.cx6a
Insert response time histogram
256us	1ms	4ms	16ms	64ms	256ms	1s	4s	16s	gt	max	tag
0.000	0.000	64.407	33.190	2.403	0.000	0.000	0.000	0.000	0.000	0.042	my5649.cx6d
0.000	0.000	54.750	44.593	0.657	0.000	0.000	0.000	0.000	0.000	0.034	my5731.cx6d
0.000	0.000	28.880	70.542	0.579	0.000	0.000	0.000	0.000	0.000	0.055	my8021.cx6d
0.000	0.000	31.032	68.144	0.824	0.000	0.000	0.000	0.000	0.000	0.059	my8022.cx6d
-
0.000	0.000	0.000	96.796	3.199	0.005	0.000	0.000	0.000	0.000	0.072	pg1110.cx5
0.000	0.000	0.000	96.144	3.852	0.005	0.000	0.000	0.000	0.000	0.091	pg124.cx5
0.000	0.000	0.000	96.463	3.537	0.000	0.000	0.000	0.000	0.000	0.057	pg131.cx5
-
0.000	0.185	99.745	0.065	0.005	0.000	0.000	0.000	0.000	0.000	0.048	rx56.cx6a
0.000	0.000	99.921	0.069	0.009	0.000	0.000	0.000	0.000	0.000	0.018	rx80.cx6a
q800.2
- q800.2: range queries with 800 insert/s per client, 2nd loop
- Legend for results is here.
- Each entry lists the percentage of responses that fit in that bucket (slower than max time for previous bucket, faster than min time for next bucket).
Query response time histogram
256us	1ms	4ms	16ms	64ms	256ms	1s	4s	16s	gt	max	tag
11.540	44.905	43.119	0.318	0.118	0.000	0.000	0.000	0.000	0.000	0.052	my5649.cx6d
19.792	35.238	44.531	0.313	0.126	0.000	0.000	0.000	0.000	0.000	0.052	my5731.cx6d
9.187	37.540	52.634	0.480	0.160	nonzero	0.000	0.000	0.000	0.000	0.069	my8021.cx6d
13.288	40.532	45.744	0.319	0.117	0.000	0.000	0.000	0.000	0.000	0.052	my8022.cx6d
-
99.756	0.241	0.003	nonzero	nonzero	0.000	0.000	0.000	0.000	0.000	0.017	pg1110.cx5
99.870	0.128	0.002	nonzero	0.000	0.000	0.000	0.000	0.000	0.000	0.006	pg124.cx5
99.873	0.125	0.003	nonzero	0.000	0.000	0.000	0.000	0.000	0.000	0.012	pg131.cx5
-
97.960	2.038	0.002	nonzero	0.000	0.000	0.000	0.000	0.000	0.000	0.013	rx56.cx6a
96.979	3.017	0.005	nonzero	0.000	0.000	0.000	0.000	0.000	0.000	0.008	rx80.cx6a
Insert response time histogram
256us	1ms	4ms	16ms	64ms	256ms	1s	4s	16s	gt	max	tag
0.000	0.000	64.354	30.892	4.753	0.000	0.000	0.000	0.000	0.000	0.045	my5649.cx6d
0.000	0.000	60.722	38.774	0.503	0.000	0.000	0.000	0.000	0.000	0.039	my5731.cx6d
0.000	0.000	32.913	65.031	2.052	0.003	0.000	0.000	0.000	0.000	0.139	my8021.cx6d
0.000	0.000	36.378	62.875	0.747	0.000	0.000	0.000	0.000	0.000	0.055	my8022.cx6d
-
0.000	0.000	0.000	96.010	3.990	0.000	0.000	0.000	0.000	0.000	0.051	pg1110.cx5
0.000	0.000	0.000	94.573	5.424	0.003	0.000	0.000	0.000	0.000	0.075	pg124.cx5
0.000	0.000	0.000	94.684	5.312	0.003	0.000	0.000	0.000	0.000	0.077	pg131.cx5
-
0.000	0.642	99.323	0.035	0.000	0.000	0.000	0.000	0.000	0.000	0.005	rx56.cx6a
0.000	0.000	99.927	0.056	0.017	0.000	0.000	0.000	0.000	0.000	0.019	rx80.cx6a
q1000.2
- q1000.2: range queries with 1000 insert/s per client, 2nd loop
- Legend for results is here.
- Each entry lists the percentage of responses that fit in that bucket (slower than max time for previous bucket, faster than min time for next bucket).
Query response time histogram
256us	1ms	4ms	16ms	64ms	256ms	1s	4s	16s	gt	max	tag
12.190	43.570	43.762	0.337	0.142	0.000	0.000	0.000	0.000	0.000	0.061	my5649.cx6d
19.959	34.193	45.354	0.367	0.127	nonzero	nonzero	0.000	0.000	0.000	0.485	my5731.cx6d
10.097	36.437	52.761	0.530	0.175	0.000	0.000	0.000	0.000	0.000	0.058	my8021.cx6d
14.162	39.114	46.231	0.367	0.125	nonzero	nonzero	0.000	0.000	0.000	0.305	my8022.cx6d
-
99.692	0.305	0.003	nonzero	nonzero	0.000	0.000	0.000	0.000	0.000	0.018	pg1110.cx5
99.829	0.169	0.003	nonzero	0.000	0.000	0.000	0.000	0.000	0.000	0.006	pg124.cx5
99.848	0.149	0.003	nonzero	0.000	0.000	0.000	0.000	0.000	0.000	0.005	pg131.cx5
-
97.667	2.331	0.002	nonzero	0.000	0.000	0.000	0.000	0.000	0.000	0.009	rx56.cx6a
96.826	3.166	0.008	nonzero	0.000	0.000	0.000	0.000	0.000	0.000	0.013	rx80.cx6a
Insert response time histogram
256us	1ms	4ms	16ms	64ms	256ms	1s	4s	16s	gt	max	tag
0.000	0.000	67.586	28.956	3.456	0.003	0.000	0.000	0.000	0.000	0.122	my5649.cx6d
0.000	0.000	65.592	33.803	0.600	0.006	0.000	0.000	0.000	0.000	0.130	my5731.cx6d
0.000	0.000	45.700	53.297	1.000	0.003	0.000	0.000	0.000	0.000	0.134	my8021.cx6d
0.000	0.000	45.083	53.906	0.994	0.014	0.003	0.000	0.000	0.000	0.281	my8022.cx6d
-
0.000	0.000	0.000	94.831	5.167	0.003	0.000	0.000	0.000	0.000	0.094	pg1110.cx5
0.000	0.000	0.000	93.794	6.206	0.000	0.000	0.000	0.000	0.000	0.064	pg124.cx5
0.000	0.000	0.000	94.142	5.853	0.006	0.000	0.000	0.000	0.000	0.088	pg131.cx5
-
0.000	0.542	99.414	0.039	0.006	0.000	0.000	0.000	0.000	0.000	0.041	rx56.cx6a
0.000	0.000	99.869	0.108	0.022	0.000	0.000	0.000	0.000	0.000	0.019	rx80.cx6a