Introduction
This is a report for the insert benchmark with 20M docs and 1 client(s). It is generated by scripts (bash, awk, sed) and Tufte might not be impressed. An overview of the insert benchmark is here and a short update is here. Below, by DBMS, I mean DBMS+version.config. An example is my8020.c10b40 where my means MySQL, 8020 is version 8.0.20 and c10b40 is the name for the configuration file.
The test server is an Intel NUC. Clients and the DBMS share one server.
The tested DBMS are:
- pg1110.cx5 - Postgres 11.10 with the cx5 config
- pg124.cx5 - Postgres 12.4 with the cx5 config
- pg131.cx5 - Postgres 13.1 with the cx5 config
- my5649.cx6d - MySQL 5.7.31 with InnoDB and the cx6d config
- my5731.cx6d - MySQL 5.7.31 with InnoDB and the cx6d config
- my8022.cx6d - MySQL 8.0.22 with InnoDB and the cx6d config
- rx56.cx6a - MySQL 5.6.35 with MyRocks and the cx6a config
- rx80.cx6a - MySQL 8.0.17 with MyRocks and the cx6a config
Contents
- Summary
- l.i0: load without secondary indexes
- l.x: create secondary indexes
- l.i1: continue load after secondary indexes created
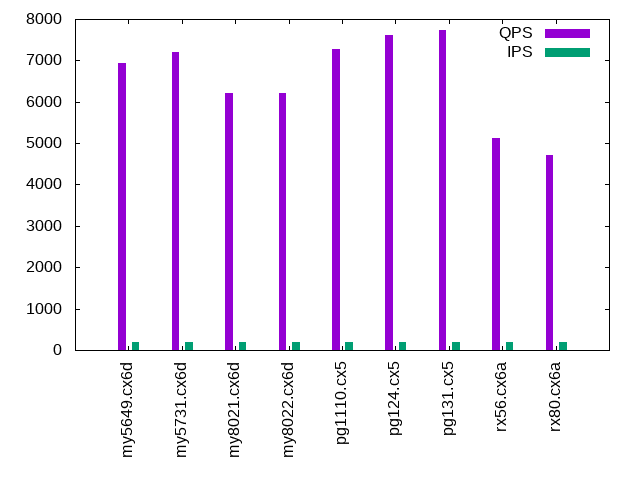
- q100.2: range queries with 100 insert/s per client, 2nd loop
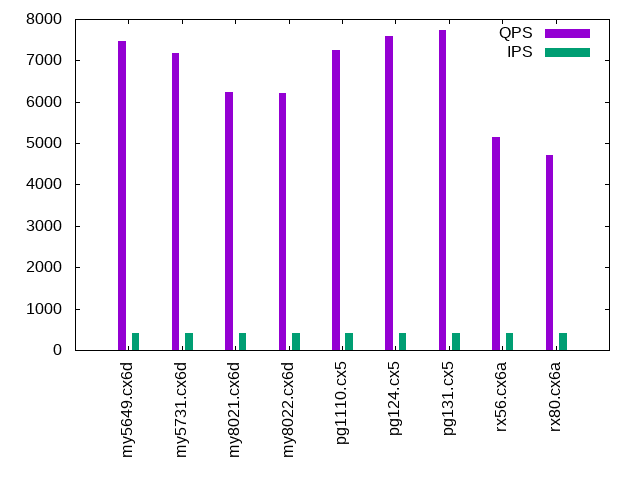
- q200.2: range queries with 200 insert/s per client, 2nd loop
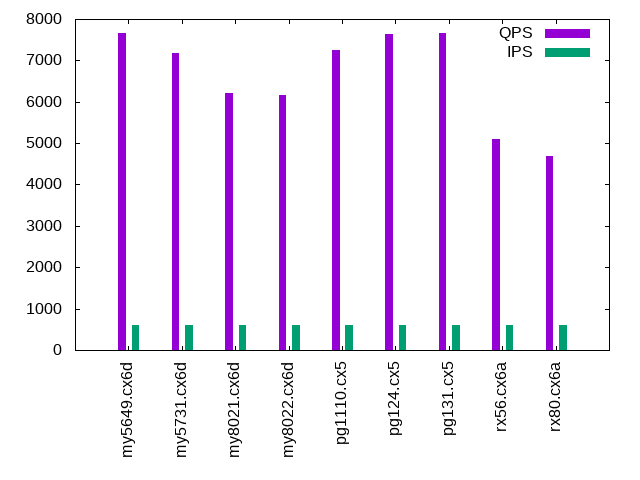
- q400.2: range queries with 400 insert/s per client, 2nd loop
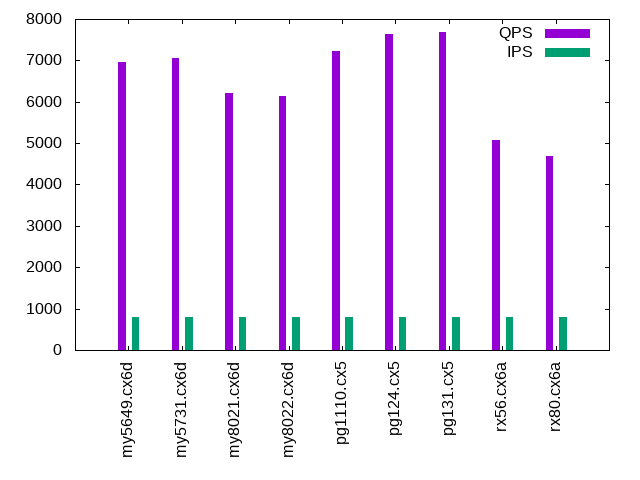
- q600.2: range queries with 600 insert/s per client, 2nd loop
- q800.2: range queries with 800 insert/s per client, 2nd loop
- q1000.2: range queries with 1000 insert/s per client, 2nd loop
Summary
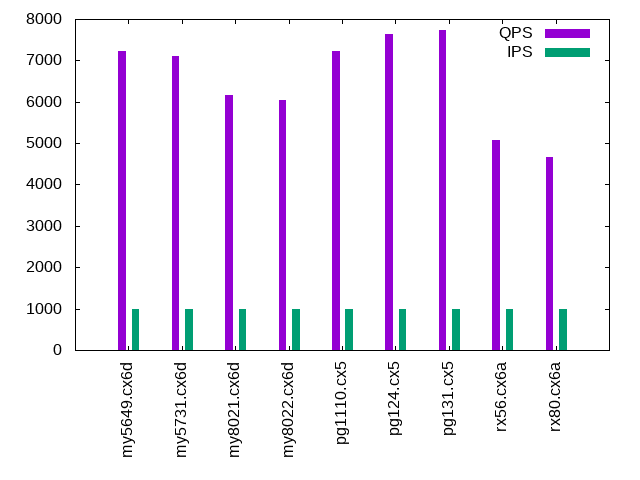
The numbers are inserts/s for l.i0 and l.i1, indexed docs (or rows) /s for l.x and queries/s for q*.2. The values are the average rate over the entire test for inserts (IPS) and queries (QPS). The range of values for IPS and QPS is split into 3 parts: bottom 25%, middle 50%, top 25%. Values in the bottom 25% have a red background, values in the top 25% have a green background and values in the middle have no color. A gray background is used for values that can be ignored because the DBMS did not sustain the target insert rate. Red backgrounds are not used when the minimum value is within 80% of the max value.
| dbms | l.i0 | l.x | l.i1 | q100.2 | q200.2 | q400.2 | q600.2 | q800.2 | q1000.2 |
|---|---|---|---|---|---|---|---|---|---|
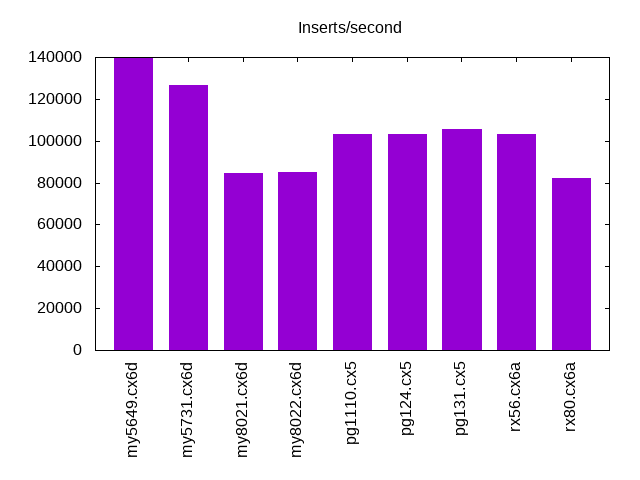
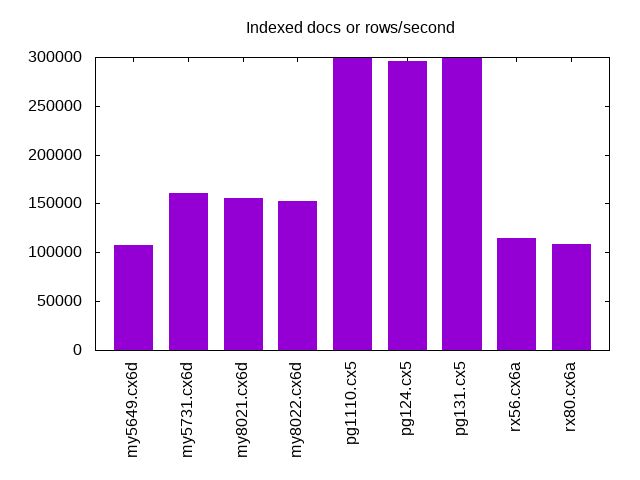
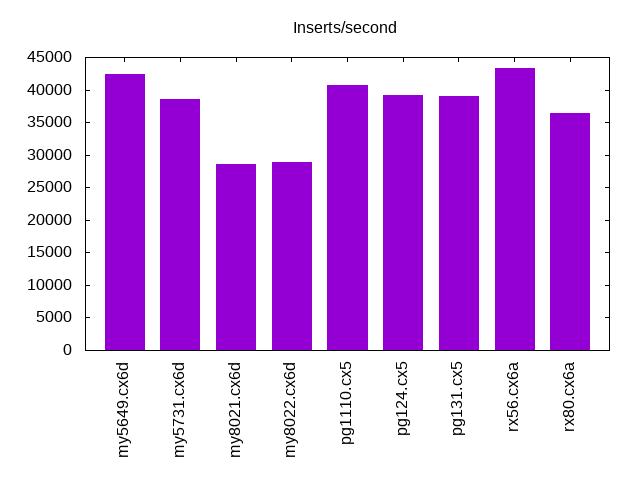
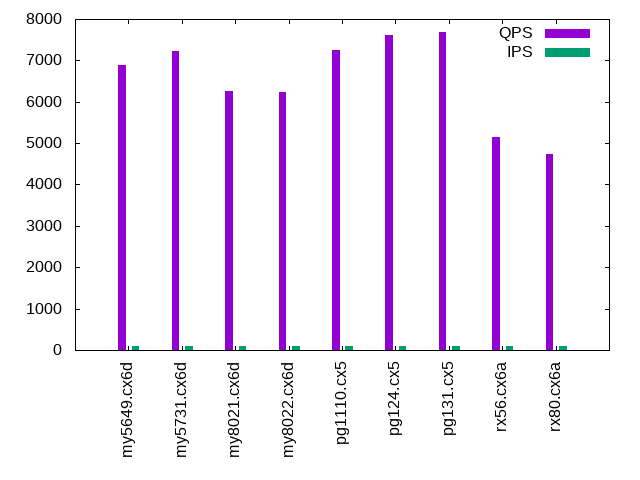
| my5649.cx6d | 139860 | 107487 | 42373 | 6886 | 6938 | 7470 | 7673 | 6961 | 7227 |
| my5731.cx6d | 126582 | 160800 | 38610 | 7238 | 7210 | 7185 | 7175 | 7060 | 7098 |
| my8021.cx6d | 84388 | 155814 | 28490 | 6260 | 6205 | 6235 | 6220 | 6200 | 6157 |
| my8022.cx6d | 85106 | 152273 | 28902 | 6231 | 6208 | 6209 | 6172 | 6132 | 6046 |
| pg1110.cx5 | 103093 | 300000 | 40733 | 7261 | 7278 | 7260 | 7258 | 7229 | 7231 |
| pg124.cx5 | 103093 | 295588 | 39216 | 7611 | 7616 | 7596 | 7626 | 7628 | 7634 |
| pg131.cx5 | 105820 | 300000 | 39062 | 7680 | 7738 | 7733 | 7655 | 7682 | 7744 |
| rx56.cx6a | 103093 | 114857 | 43290 | 5149 | 5123 | 5140 | 5104 | 5086 | 5071 |
| rx80.cx6a | 81967 | 108064 | 36364 | 4743 | 4715 | 4721 | 4690 | 4700 | 4667 |
This lists the average rate of inserts/s for the tests that do inserts concurrent with queries. For such tests the query rate is listed in the table above. The read+write tests are setup so that the insert rate should match the target rate every second. Cells that are not at least 95% of the target have a red background to indicate a failure to satisfy the target.
| dbms | q100.2 | q200.2 | q400.2 | q600.2 | q800.2 | q1000.2 |
|---|---|---|---|---|---|---|
| my5649.cx6d | 100 | 200 | 400 | 599 | 799 | 998 |
| my5731.cx6d | 100 | 200 | 399 | 599 | 799 | 998 |
| my8021.cx6d | 100 | 200 | 399 | 599 | 799 | 998 |
| my8022.cx6d | 100 | 200 | 399 | 599 | 799 | 998 |
| pg1110.cx5 | 100 | 200 | 399 | 599 | 799 | 998 |
| pg124.cx5 | 100 | 200 | 399 | 599 | 799 | 998 |
| pg131.cx5 | 100 | 200 | 399 | 599 | 799 | 999 |
| rx56.cx6a | 100 | 200 | 399 | 599 | 799 | 998 |
| rx80.cx6a | 100 | 200 | 399 | 599 | 799 | 998 |
| target | 100 | 200 | 400 | 600 | 800 | 1000 |
l.i0
l.i0: load without secondary indexes. Graphs for performance per 1-second interval are here.
Average throughput:
Insert response time histogram: each cell has the percentage of responses that take <= the time in the header and max is the max response time in seconds. For the max column values in the top 25% of the range have a red background and in the bottom 25% of the range have a green background. The red background is not used when the min value is within 80% of the max value.
| dbms | 256us | 1ms | 4ms | 16ms | 64ms | 256ms | 1s | 4s | 16s | gt | max |
|---|---|---|---|---|---|---|---|---|---|---|---|
| my5649.cx6d | 99.037 | 0.867 | 0.085 | 0.007 | 0.003 | 0.001 | 0.265 | ||||
| my5731.cx6d | 98.832 | 0.904 | 0.259 | 0.002 | 0.003 | 0.107 | |||||
| my8021.cx6d | 0.001 | 99.602 | 0.357 | 0.038 | 0.002 | 0.106 | |||||
| my8022.cx6d | 99.703 | 0.188 | 0.108 | 0.002 | 0.118 | ||||||
| pg1110.cx5 | 95.257 | 4.743 | 0.001 | 0.005 | |||||||
| pg124.cx5 | 95.678 | 4.322 | 0.003 | ||||||||
| pg131.cx5 | 97.982 | 2.017 | 0.001 | 0.004 | |||||||
| rx56.cx6a | 79.607 | 20.340 | 0.049 | 0.003 | 0.103 | ||||||
| rx80.cx6a | 0.012 | 99.826 | 0.143 | 0.018 | 0.001 | 0.118 |
Performance metrics for the DBMS listed above. Some are normalized by throughput, others are not. Legend for results is here.
ips	qps	rps	rmbps	wps	wmbps	rpq	rkbpq	wpi	wkbpi	csps	cpups	cspq	cpupq	dbgb1	dbgb2	rss	maxop	p50	p99	tag
139860	0	1238	4.8	51.3	32.2	0.009	0.035	0.000	0.236	15177	45.7	0.109	13	1.3	41.8	2.0	0.265	143193	18274	my5649.cx6d
126582	0	0	0.0	164.3	32.1	0.000	0.000	0.001	0.259	13041	45.4	0.103	14	1.3	41.8	2.3	0.107	128609	106054	my5731.cx6d
84388	0	0	0.0	117.0	22.2	0.000	0.000	0.001	0.270	18355	40.4	0.218	19	1.3	41.9	2.5	0.106	85509	50087	my8021.cx6d
85106	0	0	0.0	120.6	22.3	0.000	0.000	0.001	0.269	15506	40.7	0.182	19	1.3	41.9	2.5	0.118	85860	26992	my8022.cx6d
103093	0	0	0.0	73.3	43.2	0.000	0.000	0.001	0.429	12591	42.0	0.122	16	1.9	5.2	0.0	0.005	103490	82210	pg1110.cx5
103093	0	0	0.0	68.4	43.4	0.000	0.000	0.001	0.431	12659	42.3	0.123	16	1.9	5.2	0.0	0.003	103690	94216	pg124.cx5
105820	0	0	0.0	70.7	44.4	0.000	0.000	0.001	0.429	12878	42.8	0.122	16	1.9	5.2	0.0	0.004	106684	101415	pg131.cx5
103093	0	0	0.0	38.3	15.4	0.000	0.000	0.000	0.153	10495	45.5	0.102	18	1.0	2.0	1.1	0.103	101988	83911	rx56.cx6a
81967	0	0	0.0	35.4	12.3	0.000	0.000	0.000	0.153	8420	41.8	0.103	20	1.0	2.2	1.5	0.118	81110	71656	rx80.cx6a
l.x
l.x: create secondary indexes.
Average throughput:
Performance metrics for the DBMS listed above. Some are normalized by throughput, others are not. Legend for results is here.
ips	qps	rps	rmbps	wps	wmbps	rpq	rkbpq	wpi	wkbpi	csps	cpups	cspq	cpupq	dbgb1	dbgb2	rss	maxop	p50	p99	tag
107487	0	115	48.9	1238.7	112.1	0.001	0.465	0.012	1.068	4056	21.2	0.038	8	2.7	43.2	3.5	0.023	NA	NA	my5649.cx6d
160800	0	108	56.9	2031.9	146.8	0.001	0.362	0.013	0.935	10918	23.7	0.068	6	3.0	43.5	3.7	0.012	NA	NA	my5731.cx6d
155814	0	0	0.0	1384.1	125.9	0.000	0.000	0.009	0.827	9111	24.4	0.058	6	3.0	43.5	3.0	0.022	NA	NA	my8021.cx6d
152273	0	0	0.0	1507.1	123.6	0.000	0.000	0.010	0.831	8919	24.2	0.059	6	3.0	43.5	3.0	0.017	NA	NA	my8022.cx6d
300000	0	0	0.0	60.5	64.8	0.000	0.000	0.000	0.221	2027	23.6	0.007	3	3.7	8.6	0.0	0.002	NA	NA	pg1110.cx5
295588	0	0	0.0	57.4	60.7	0.000	0.000	0.000	0.210	1937	23.7	0.007	3	3.7	8.6	0.0	0.002	NA	NA	pg124.cx5
300000	0	0	0.0	65.3	66.7	0.000	0.000	0.000	0.228	2020	23.6	0.007	3	3.7	8.6	0.0	0.003	NA	NA	pg131.cx5
114857	0	0	0.0	41.2	20.9	0.000	0.000	0.000	0.186	819	24.5	0.007	9	2.3	3.3	2.2	0.009	NA	NA	rx56.cx6a
108064	0	0	0.0	33.3	19.7	0.000	0.000	0.000	0.187	923	24.7	0.009	9	2.3	3.5	2.6	0.008	NA	NA	rx80.cx6a
l.i1
l.i1: continue load after secondary indexes created. Graphs for performance per 1-second interval are here.
Average throughput:
Insert response time histogram: each cell has the percentage of responses that take <= the time in the header and max is the max response time in seconds. For the max column values in the top 25% of the range have a red background and in the bottom 25% of the range have a green background. The red background is not used when the min value is within 80% of the max value.
| dbms | 256us | 1ms | 4ms | 16ms | 64ms | 256ms | 1s | 4s | 16s | gt | max |
|---|---|---|---|---|---|---|---|---|---|---|---|
| my5649.cx6d | 29.170 | 69.875 | 0.819 | 0.130 | 0.005 | nonzero | 0.280 | ||||
| my5731.cx6d | 99.200 | 0.676 | 0.122 | 0.002 | 0.092 | ||||||
| my8021.cx6d | 99.167 | 0.683 | 0.110 | 0.040 | 0.103 | ||||||
| my8022.cx6d | 99.296 | 0.451 | 0.212 | 0.042 | 0.128 | ||||||
| pg1110.cx5 | 99.972 | 0.025 | 0.003 | 0.029 | |||||||
| pg124.cx5 | 99.981 | 0.017 | 0.003 | 0.050 | |||||||
| pg131.cx5 | 99.850 | 0.123 | 0.024 | 0.003 | 0.242 | ||||||
| rx56.cx6a | 7.865 | 92.041 | 0.091 | 0.003 | 0.001 | 0.070 | |||||
| rx80.cx6a | 0.088 | 99.757 | 0.140 | 0.015 | 0.053 |
Performance metrics for the DBMS listed above. Some are normalized by throughput, others are not. Legend for results is here.
ips	qps	rps	rmbps	wps	wmbps	rpq	rkbpq	wpi	wkbpi	csps	cpups	cspq	cpupq	dbgb1	dbgb2	rss	maxop	p50	p99	tag
42373	0	742	2.9	85.5	26.7	0.018	0.070	0.002	0.646	9777	33.3	0.231	31	7.9	48.4	7.9	0.280	44401	5796	my5649.cx6d
38610	0	0	0.0	779.1	45.0	0.000	0.000	0.020	1.194	10088	34.3	0.261	36	7.9	48.4	8.2	0.092	40755	2497	my5731.cx6d
28490	0	132	2.1	137.4	19.6	0.005	0.074	0.005	0.705	14518	33.3	0.510	47	7.9	48.4	8.3	0.103	30316	600	my8021.cx6d
28902	0	134	2.1	141.9	19.9	0.005	0.074	0.005	0.706	12112	34.2	0.419	47	7.9	48.4	8.3	0.128	30867	550	my8022.cx6d
40733	0	0	0.0	215.3	71.8	0.000	0.000	0.005	1.805	10519	35.7	0.258	35	8.3	20.3	0.0	0.029	41205	27181	pg1110.cx5
39216	0	0	0.0	206.5	67.5	0.000	0.000	0.005	1.762	10276	35.7	0.262	36	8.2	19.7	0.0	0.050	40306	26434	pg124.cx5
39062	0	0	0.0	203.7	68.2	0.000	0.000	0.005	1.789	9986	35.7	0.256	37	8.2	19.9	0.0	0.242	40470	11037	pg131.cx5
43290	0	9	1.2	65.0	42.7	0.000	0.028	0.002	1.010	9451	48.8	0.218	45	4.9	8.5	3.0	0.070	42705	37160	rx56.cx6a
36364	0	7	0.8	56.9	36.1	0.000	0.024	0.002	1.016	8120	45.7	0.223	50	4.9	8.7	3.4	0.053	36175	32314	rx80.cx6a
q100.2
q100.2: range queries with 100 insert/s per client, 2nd loop. Graphs for performance per 1-second interval are here.
Average throughput:
Query response time histogram: each cell has the percentage of responses that take <= the time in the header and max is the max response time in seconds. For max values in the top 25% of the range have a red background and in the bottom 25% of the range have a green background. The red background is not used when the min value is within 80% of the max value.
| dbms | 256us | 1ms | 4ms | 16ms | 64ms | 256ms | 1s | 4s | 16s | gt | max |
|---|---|---|---|---|---|---|---|---|---|---|---|
| my5649.cx6d | 90.945 | 9.052 | 0.002 | 0.002 | nonzero | 0.017 | |||||
| my5731.cx6d | 99.892 | 0.108 | nonzero | nonzero | nonzero | 0.019 | |||||
| my8021.cx6d | 99.272 | 0.728 | nonzero | nonzero | nonzero | 0.018 | |||||
| my8022.cx6d | 99.383 | 0.617 | nonzero | nonzero | nonzero | 0.024 | |||||
| pg1110.cx5 | 99.912 | 0.087 | 0.001 | 0.003 | |||||||
| pg124.cx5 | 99.963 | 0.037 | 0.001 | 0.002 | |||||||
| pg131.cx5 | 99.963 | 0.036 | 0.001 | nonzero | 0.007 | ||||||
| rx56.cx6a | 97.516 | 2.484 | nonzero | 0.002 | |||||||
| rx80.cx6a | 97.900 | 2.100 | nonzero | 0.002 |
Insert response time histogram: each cell has the percentage of responses that take <= the time in the header and max is the max response time in seconds. For max values in the top 25% of the range have a red background and in the bottom 25% of the range have a green background. The red background is not used when the min value is within 80% of the max value.
| dbms | 256us | 1ms | 4ms | 16ms | 64ms | 256ms | 1s | 4s | 16s | gt | max |
|---|---|---|---|---|---|---|---|---|---|---|---|
| my5649.cx6d | 0.111 | 53.111 | 39.639 | 7.139 | 0.021 | ||||||
| my5731.cx6d | 99.250 | 0.444 | 0.306 | 0.023 | |||||||
| my8021.cx6d | 98.667 | 1.167 | 0.167 | 0.023 | |||||||
| my8022.cx6d | 98.167 | 1.667 | 0.167 | 0.028 | |||||||
| pg1110.cx5 | 99.944 | 0.056 | 0.006 | ||||||||
| pg124.cx5 | 99.944 | 0.056 | 0.006 | ||||||||
| pg131.cx5 | 99.972 | 0.028 | 0.006 | ||||||||
| rx56.cx6a | 100.000 | 0.004 | |||||||||
| rx80.cx6a | 99.917 | 0.083 | 0.004 |
Performance metrics for the DBMS listed above. Some are normalized by throughput, others are not. Legend for results is here.
ips	qps	rps	rmbps	wps	wmbps	rpq	rkbpq	wpi	wkbpi	csps	cpups	cspq	cpupq	dbgb1	dbgb2	rss	maxop	p50	p99	tag
100	6886	2	0.0	2.5	0.1	0.000	0.001	0.025	1.058	26428	25.8	3.838	150	8.1	48.6	8.0	0.017	8439	2541	my5649.cx6d
100	7238	0	0.0	6.0	0.2	0.000	0.000	0.061	1.884	27789	27.0	3.839	149	8.1	48.6	8.3	0.019	7240	7144	my5731.cx6d
100	6260	0	0.0	45.3	1.1	0.000	0.000	0.454	11.069	24782	29.2	3.958	187	8.1	48.6	8.5	0.018	6265	6105	my8021.cx6d
100	6231	0	0.0	41.0	1.0	0.000	0.000	0.411	10.351	24303	27.6	3.900	177	8.1	48.6	8.5	0.024	6233	6105	my8022.cx6d
100	7261	0	0.0	212.4	3.9	0.000	0.000	2.128	39.734	27963	27.6	3.851	152	8.4	14.5	0.0	0.003	7272	7128	pg1110.cx5
100	7611	0	0.0	209.4	3.9	0.000	0.000	2.098	39.557	29298	27.6	3.849	145	8.2	14.2	0.0	0.002	7624	7496	pg124.cx5
100	7680	0	0.0	210.0	3.9	0.000	0.000	2.104	39.547	29564	27.6	3.850	144	8.2	13.8	0.0	0.007	7687	7544	pg131.cx5
100	5149	0	0.0	3.1	0.0	0.000	0.000	0.031	0.247	19770	25.9	3.839	201	4.6	8.3	4.3	0.002	5148	5066	rx56.cx6a
100	4743	0	0.0	3.1	0.0	0.000	0.000	0.031	0.251	18354	26.8	3.870	226	4.6	8.4	4.8	0.002	4747	4683	rx80.cx6a
q200.2
q200.2: range queries with 200 insert/s per client, 2nd loop. Graphs for performance per 1-second interval are here.
Average throughput:
Query response time histogram: each cell has the percentage of responses that take <= the time in the header and max is the max response time in seconds. For max values in the top 25% of the range have a red background and in the bottom 25% of the range have a green background. The red background is not used when the min value is within 80% of the max value.
| dbms | 256us | 1ms | 4ms | 16ms | 64ms | 256ms | 1s | 4s | 16s | gt | max |
|---|---|---|---|---|---|---|---|---|---|---|---|
| my5649.cx6d | 91.279 | 8.716 | 0.002 | 0.003 | nonzero | 0.017 | |||||
| my5731.cx6d | 99.876 | 0.124 | nonzero | nonzero | nonzero | 0.020 | |||||
| my8021.cx6d | 99.302 | 0.697 | nonzero | nonzero | 0.015 | ||||||
| my8022.cx6d | 99.389 | 0.610 | 0.001 | nonzero | nonzero | 0.020 | |||||
| pg1110.cx5 | 99.913 | 0.085 | 0.002 | 0.002 | |||||||
| pg124.cx5 | 99.965 | 0.034 | 0.002 | 0.004 | |||||||
| pg131.cx5 | 99.967 | 0.031 | 0.002 | 0.003 | |||||||
| rx56.cx6a | 97.333 | 2.667 | nonzero | nonzero | 0.010 | ||||||
| rx80.cx6a | 97.878 | 2.121 | nonzero | 0.003 |
Insert response time histogram: each cell has the percentage of responses that take <= the time in the header and max is the max response time in seconds. For max values in the top 25% of the range have a red background and in the bottom 25% of the range have a green background. The red background is not used when the min value is within 80% of the max value.
| dbms | 256us | 1ms | 4ms | 16ms | 64ms | 256ms | 1s | 4s | 16s | gt | max |
|---|---|---|---|---|---|---|---|---|---|---|---|
| my5649.cx6d | 0.278 | 75.903 | 20.708 | 3.111 | 0.021 | ||||||
| my5731.cx6d | 99.417 | 0.389 | 0.194 | 0.022 | |||||||
| my8021.cx6d | 99.181 | 0.694 | 0.125 | 0.023 | |||||||
| my8022.cx6d | 97.486 | 2.389 | 0.125 | 0.029 | |||||||
| pg1110.cx5 | 99.972 | 0.028 | 0.006 | ||||||||
| pg124.cx5 | 99.986 | 0.014 | 0.006 | ||||||||
| pg131.cx5 | 99.986 | 0.014 | 0.006 | ||||||||
| rx56.cx6a | 3.472 | 96.500 | 0.028 | 0.004 | |||||||
| rx80.cx6a | 0.014 | 99.931 | 0.056 | 0.011 |
Performance metrics for the DBMS listed above. Some are normalized by throughput, others are not. Legend for results is here.
ips	qps	rps	rmbps	wps	wmbps	rpq	rkbpq	wpi	wkbpi	csps	cpups	cspq	cpupq	dbgb1	dbgb2	rss	maxop	p50	p99	tag
200	6938	4	0.0	2.6	0.2	0.001	0.002	0.013	0.880	26617	25.9	3.837	149	8.4	48.9	8.3	0.017	8455	2685	my5649.cx6d
200	7210	0	0.0	8.1	0.3	0.000	0.000	0.040	1.530	27701	27.1	3.842	150	8.4	48.9	8.6	0.020	7224	6936	my5731.cx6d
200	6205	0	0.0	5.0	0.2	0.000	0.000	0.025	1.069	24441	28.8	3.939	186	8.4	48.9	8.8	0.015	6217	6043	my8021.cx6d
200	6208	0	0.0	5.0	0.2	0.000	0.000	0.025	1.062	24181	27.7	3.895	178	8.4	48.9	8.8	0.020	6217	6089	my8022.cx6d
200	7278	0	0.0	311.0	6.9	0.000	0.000	1.558	35.268	28047	27.6	3.854	152	8.6	11.0	0.0	0.002	7288	7147	pg1110.cx5
200	7616	0	0.0	298.7	6.8	0.000	0.000	1.496	35.087	29338	27.9	3.852	147	8.4	10.9	0.0	0.004	7624	7480	pg124.cx5
200	7738	0	0.0	300.8	6.8	0.000	0.000	1.507	35.096	29804	27.7	3.851	143	8.4	10.8	0.0	0.003	7736	7592	pg131.cx5
200	5123	0	0.0	3.9	0.7	0.000	0.000	0.019	3.705	19698	26.3	3.845	205	4.8	8.5	4.7	0.010	5130	5018	rx56.cx6a
200	4715	0	0.0	3.9	0.7	0.000	0.000	0.019	3.714	18285	27.1	3.878	230	4.8	8.7	5.2	0.003	4715	4607	rx80.cx6a
q400.2
q400.2: range queries with 400 insert/s per client, 2nd loop. Graphs for performance per 1-second interval are here.
Average throughput:
Query response time histogram: each cell has the percentage of responses that take <= the time in the header and max is the max response time in seconds. For max values in the top 25% of the range have a red background and in the bottom 25% of the range have a green background. The red background is not used when the min value is within 80% of the max value.
| dbms | 256us | 1ms | 4ms | 16ms | 64ms | 256ms | 1s | 4s | 16s | gt | max |
|---|---|---|---|---|---|---|---|---|---|---|---|
| my5649.cx6d | 94.887 | 5.109 | 0.002 | 0.002 | nonzero | 0.017 | |||||
| my5731.cx6d | 99.822 | 0.176 | 0.001 | nonzero | nonzero | 0.020 | |||||
| my8021.cx6d | 99.249 | 0.750 | 0.001 | nonzero | nonzero | 0.020 | |||||
| my8022.cx6d | 99.342 | 0.657 | 0.001 | nonzero | nonzero | 0.024 | |||||
| pg1110.cx5 | 99.885 | 0.110 | 0.005 | 0.003 | |||||||
| pg124.cx5 | 99.943 | 0.052 | 0.004 | nonzero | 0.006 | ||||||
| pg131.cx5 | 99.953 | 0.043 | 0.004 | nonzero | 0.007 | ||||||
| rx56.cx6a | 97.391 | 2.608 | 0.001 | nonzero | 0.009 | ||||||
| rx80.cx6a | 97.670 | 2.329 | 0.002 | nonzero | 0.006 |
Insert response time histogram: each cell has the percentage of responses that take <= the time in the header and max is the max response time in seconds. For max values in the top 25% of the range have a red background and in the bottom 25% of the range have a green background. The red background is not used when the min value is within 80% of the max value.
| dbms | 256us | 1ms | 4ms | 16ms | 64ms | 256ms | 1s | 4s | 16s | gt | max |
|---|---|---|---|---|---|---|---|---|---|---|---|
| my5649.cx6d | 2.361 | 86.167 | 10.757 | 0.715 | 0.021 | ||||||
| my5731.cx6d | 99.688 | 0.215 | 0.097 | 0.024 | |||||||
| my8021.cx6d | 99.319 | 0.611 | 0.069 | 0.025 | |||||||
| my8022.cx6d | 97.889 | 2.042 | 0.069 | 0.025 | |||||||
| pg1110.cx5 | 99.965 | 0.028 | 0.007 | 0.017 | |||||||
| pg124.cx5 | 99.993 | 0.007 | 0.006 | ||||||||
| pg131.cx5 | 99.993 | 0.007 | 0.006 | ||||||||
| rx56.cx6a | 3.403 | 96.562 | 0.035 | 0.011 | |||||||
| rx80.cx6a | 99.896 | 0.083 | 0.021 | 0.019 |
Performance metrics for the DBMS listed above. Some are normalized by throughput, others are not. Legend for results is here.
ips	qps	rps	rmbps	wps	wmbps	rpq	rkbpq	wpi	wkbpi	csps	cpups	cspq	cpupq	dbgb1	dbgb2	rss	maxop	p50	p99	tag
400	7470	7	0.0	2.6	0.2	0.001	0.004	0.006	0.594	28690	26.3	3.841	141	8.8	49.3	8.7	0.017	8423	2925	my5649.cx6d
399	7185	0	0.0	11.7	0.4	0.000	0.000	0.029	1.132	27649	27.3	3.848	152	8.8	49.3	9.0	0.020	7192	7064	my5731.cx6d
399	6235	0	0.0	5.9	0.3	0.000	0.000	0.015	0.744	24647	28.9	3.953	185	8.8	49.3	9.2	0.020	6249	6074	my8021.cx6d
399	6209	0	0.0	6.1	0.3	0.000	0.000	0.015	0.771	24272	27.9	3.909	180	8.8	49.3	9.2	0.024	6217	6089	my8022.cx6d
399	7260	0	0.0	392.1	11.3	0.000	0.000	0.982	28.940	28029	27.9	3.861	154	9.1	11.7	0.0	0.003	7272	7096	pg1110.cx5
399	7596	0	0.0	359.2	11.3	0.000	0.000	0.900	28.868	29308	28.0	3.859	147	8.8	11.4	0.0	0.006	7608	7448	pg124.cx5
399	7733	0	0.0	363.6	11.3	0.000	0.000	0.910	28.887	29834	28.0	3.858	145	8.8	11.5	0.0	0.007	7736	7592	pg131.cx5
399	5140	0	0.0	4.4	0.9	0.000	0.000	0.011	2.389	19800	26.5	3.852	206	4.9	8.8	5.3	0.009	5146	5034	rx56.cx6a
399	4721	0	0.0	4.7	1.0	0.000	0.000	0.012	2.497	18347	27.3	3.886	231	4.9	9.0	5.8	0.006	4731	4603	rx80.cx6a
q600.2
q600.2: range queries with 600 insert/s per client, 2nd loop. Graphs for performance per 1-second interval are here.
Average throughput:
Query response time histogram: each cell has the percentage of responses that take <= the time in the header and max is the max response time in seconds. For max values in the top 25% of the range have a red background and in the bottom 25% of the range have a green background. The red background is not used when the min value is within 80% of the max value.
| dbms | 256us | 1ms | 4ms | 16ms | 64ms | 256ms | 1s | 4s | 16s | gt | max |
|---|---|---|---|---|---|---|---|---|---|---|---|
| my5649.cx6d | 96.207 | 3.789 | 0.003 | 0.001 | nonzero | 0.016 | |||||
| my5731.cx6d | 99.813 | 0.184 | 0.003 | nonzero | nonzero | 0.022 | |||||
| my8021.cx6d | 99.249 | 0.749 | 0.001 | nonzero | nonzero | 0.021 | |||||
| my8022.cx6d | 99.292 | 0.707 | 0.002 | nonzero | nonzero | 0.023 | |||||
| pg1110.cx5 | 99.867 | 0.125 | 0.009 | nonzero | 0.008 | ||||||
| pg124.cx5 | 99.934 | 0.058 | 0.009 | nonzero | 0.004 | ||||||
| pg131.cx5 | 99.929 | 0.062 | 0.009 | nonzero | 0.004 | ||||||
| rx56.cx6a | 96.981 | 3.017 | 0.002 | nonzero | 0.011 | ||||||
| rx80.cx6a | 97.560 | 2.436 | 0.004 | nonzero | 0.006 |
Insert response time histogram: each cell has the percentage of responses that take <= the time in the header and max is the max response time in seconds. For max values in the top 25% of the range have a red background and in the bottom 25% of the range have a green background. The red background is not used when the min value is within 80% of the max value.
| dbms | 256us | 1ms | 4ms | 16ms | 64ms | 256ms | 1s | 4s | 16s | gt | max |
|---|---|---|---|---|---|---|---|---|---|---|---|
| my5649.cx6d | 4.380 | 88.167 | 7.236 | 0.218 | 0.020 | ||||||
| my5731.cx6d | 99.833 | 0.116 | 0.051 | 0.025 | |||||||
| my8021.cx6d | 99.060 | 0.898 | 0.042 | 0.024 | |||||||
| my8022.cx6d | 98.801 | 1.144 | 0.056 | 0.027 | |||||||
| pg1110.cx5 | 99.222 | 0.736 | 0.042 | 0.035 | |||||||
| pg124.cx5 | 99.986 | 0.014 | 0.006 | ||||||||
| pg131.cx5 | 99.977 | 0.023 | 0.006 | ||||||||
| rx56.cx6a | 2.162 | 97.801 | 0.037 | 0.004 | |||||||
| rx80.cx6a | 99.903 | 0.074 | 0.023 | 0.021 |
Performance metrics for the DBMS listed above. Some are normalized by throughput, others are not. Legend for results is here.
ips	qps	rps	rmbps	wps	wmbps	rpq	rkbpq	wpi	wkbpi	csps	cpups	cspq	cpupq	dbgb1	dbgb2	rss	maxop	p50	p99	tag
599	7673	10	0.0	2.5	0.2	0.001	0.005	0.004	0.423	29541	26.6	3.850	139	9.0	49.5	8.9	0.016	8394	3005	my5649.cx6d
599	7175	0	0.0	14.8	0.5	0.000	0.000	0.025	0.924	27651	27.5	3.854	153	9.0	49.6	9.2	0.022	7176	7080	my5731.cx6d
599	6220	0	0.0	9.2	0.4	0.000	0.000	0.015	0.647	24698	29.1	3.971	187	9.0	49.6	9.4	0.021	6233	6073	my8021.cx6d
599	6172	0	0.0	10.2	0.4	0.000	0.000	0.017	0.706	24211	28.1	3.923	182	9.0	49.6	9.4	0.023	6171	6057	my8022.cx6d
599	7258	1	0.0	451.2	14.4	0.000	0.001	0.753	24.602	28072	27.9	3.868	154	10.1	13.3	0.0	0.008	7272	7112	pg1110.cx5
599	7626	0	0.0	436.3	14.6	0.000	0.000	0.728	25.004	29478	28.2	3.866	148	10.0	13.3	0.0	0.004	7626	7480	pg124.cx5
599	7655	0	0.0	436.7	14.6	0.000	0.000	0.729	24.962	29576	28.3	3.864	148	10.0	13.2	0.0	0.004	7656	7502	pg131.cx5
599	5104	0	0.0	4.2	0.8	0.000	0.000	0.007	1.299	19688	26.6	3.857	208	5.2	9.3	6.3	0.011	5114	5002	rx56.cx6a
599	4690	0	0.0	4.8	0.9	0.000	0.000	0.008	1.598	18262	27.3	3.893	233	5.2	9.5	6.7	0.006	4699	4571	rx80.cx6a
q800.2
q800.2: range queries with 800 insert/s per client, 2nd loop. Graphs for performance per 1-second interval are here.
Average throughput:
Query response time histogram: each cell has the percentage of responses that take <= the time in the header and max is the max response time in seconds. For max values in the top 25% of the range have a red background and in the bottom 25% of the range have a green background. The red background is not used when the min value is within 80% of the max value.
| dbms | 256us | 1ms | 4ms | 16ms | 64ms | 256ms | 1s | 4s | 16s | gt | max |
|---|---|---|---|---|---|---|---|---|---|---|---|
| my5649.cx6d | 92.634 | 7.359 | 0.005 | 0.002 | nonzero | 0.017 | |||||
| my5731.cx6d | 99.727 | 0.269 | 0.004 | nonzero | nonzero | 0.018 | |||||
| my8021.cx6d | 99.129 | 0.870 | 0.002 | nonzero | nonzero | 0.022 | |||||
| my8022.cx6d | 99.165 | 0.833 | 0.002 | nonzero | nonzero | 0.023 | |||||
| pg1110.cx5 | 99.842 | 0.146 | 0.012 | 0.004 | |||||||
| pg124.cx5 | 99.906 | 0.083 | 0.011 | 0.004 | |||||||
| pg131.cx5 | 99.908 | 0.082 | 0.011 | nonzero | 0.017 | ||||||
| rx56.cx6a | 96.901 | 3.096 | 0.002 | nonzero | 0.007 | ||||||
| rx80.cx6a | 97.213 | 2.780 | 0.007 | nonzero | 0.015 |
Insert response time histogram: each cell has the percentage of responses that take <= the time in the header and max is the max response time in seconds. For max values in the top 25% of the range have a red background and in the bottom 25% of the range have a green background. The red background is not used when the min value is within 80% of the max value.
| dbms | 256us | 1ms | 4ms | 16ms | 64ms | 256ms | 1s | 4s | 16s | gt | max |
|---|---|---|---|---|---|---|---|---|---|---|---|
| my5649.cx6d | 3.049 | 91.076 | 5.507 | 0.368 | 0.018 | ||||||
| my5731.cx6d | 99.743 | 0.198 | 0.059 | 0.025 | |||||||
| my8021.cx6d | 98.674 | 1.222 | 0.104 | 0.028 | |||||||
| my8022.cx6d | 99.413 | 0.458 | 0.128 | 0.029 | |||||||
| pg1110.cx5 | 98.365 | 1.618 | 0.017 | 0.019 | |||||||
| pg124.cx5 | 97.531 | 2.451 | 0.017 | 0.018 | |||||||
| pg131.cx5 | 97.611 | 2.365 | 0.024 | 0.020 | |||||||
| rx56.cx6a | 2.660 | 97.271 | 0.069 | 0.013 | |||||||
| rx80.cx6a | 0.007 | 99.878 | 0.097 | 0.017 | 0.022 |
Performance metrics for the DBMS listed above. Some are normalized by throughput, others are not. Legend for results is here.
ips	qps	rps	rmbps	wps	wmbps	rpq	rkbpq	wpi	wkbpi	csps	cpups	cspq	cpupq	dbgb1	dbgb2	rss	maxop	p50	p99	tag
799	6961	14	0.1	2.9	0.4	0.002	0.008	0.004	0.489	26856	26.6	3.858	153	9.4	49.9	9.3	0.017	8199	2701	my5649.cx6d
799	7060	0	0.0	26.4	0.9	0.000	0.000	0.033	1.209	27287	27.7	3.865	157	9.4	49.9	9.5	0.018	7064	6953	my5731.cx6d
799	6200	0	0.0	18.7	0.7	0.000	0.000	0.023	0.923	24777	29.4	3.996	190	9.4	49.9	9.7	0.022	6217	6042	my8021.cx6d
799	6132	0	0.0	19.9	0.8	0.000	0.000	0.025	0.985	24180	28.3	3.943	185	9.4	49.9	9.7	0.023	6137	5993	my8022.cx6d
799	7229	3	0.0	467.4	16.5	0.000	0.004	0.585	21.091	28002	28.1	3.873	155	11.1	14.6	0.0	0.004	7240	7083	pg1110.cx5
799	7628	4	0.0	502.6	16.6	0.001	0.005	0.629	21.317	29541	28.4	3.873	149	11.3	14.8	0.0	0.004	7639	7464	pg124.cx5
799	7682	4	0.0	500.6	16.6	0.001	0.005	0.627	21.322	29751	28.5	3.873	148	11.3	14.8	0.0	0.017	7688	7528	pg131.cx5
799	5086	1	0.1	6.3	1.7	0.000	0.023	0.008	2.136	19702	27.1	3.874	213	5.5	10.1	7.5	0.007	5083	4972	rx56.cx6a
799	4700	1	0.1	6.2	1.7	0.000	0.024	0.008	2.142	18370	28.0	3.909	238	5.5	10.2	7.8	0.015	4702	4539	rx80.cx6a
q1000.2
q1000.2: range queries with 1000 insert/s per client, 2nd loop. Graphs for performance per 1-second interval are here.
Average throughput:
Query response time histogram: each cell has the percentage of responses that take <= the time in the header and max is the max response time in seconds. For max values in the top 25% of the range have a red background and in the bottom 25% of the range have a green background. The red background is not used when the min value is within 80% of the max value.
| dbms | 256us | 1ms | 4ms | 16ms | 64ms | 256ms | 1s | 4s | 16s | gt | max |
|---|---|---|---|---|---|---|---|---|---|---|---|
| my5649.cx6d | 94.421 | 5.570 | 0.006 | 0.003 | 0.015 | ||||||
| my5731.cx6d | 99.677 | 0.318 | 0.005 | nonzero | nonzero | 0.020 | |||||
| my8021.cx6d | 98.982 | 1.016 | 0.002 | nonzero | nonzero | 0.025 | |||||
| my8022.cx6d | 99.055 | 0.943 | 0.002 | nonzero | nonzero | 0.027 | |||||
| pg1110.cx5 | 99.820 | 0.165 | 0.015 | nonzero | 0.005 | ||||||
| pg124.cx5 | 99.901 | 0.085 | 0.014 | nonzero | 0.008 | ||||||
| pg131.cx5 | 99.906 | 0.080 | 0.014 | nonzero | 0.008 | ||||||
| rx56.cx6a | 96.719 | 3.278 | 0.003 | nonzero | 0.012 | ||||||
| rx80.cx6a | 96.964 | 3.028 | 0.008 | nonzero | 0.012 |
Insert response time histogram: each cell has the percentage of responses that take <= the time in the header and max is the max response time in seconds. For max values in the top 25% of the range have a red background and in the bottom 25% of the range have a green background. The red background is not used when the min value is within 80% of the max value.
| dbms | 256us | 1ms | 4ms | 16ms | 64ms | 256ms | 1s | 4s | 16s | gt | max |
|---|---|---|---|---|---|---|---|---|---|---|---|
| my5649.cx6d | 2.747 | 92.522 | 4.569 | 0.161 | 0.019 | ||||||
| my5731.cx6d | 99.736 | 0.219 | 0.044 | 0.022 | |||||||
| my8021.cx6d | 98.767 | 1.136 | 0.097 | 0.027 | |||||||
| my8022.cx6d | 99.033 | 0.850 | 0.117 | 0.029 | |||||||
| pg1110.cx5 | 99.886 | 0.114 | 0.016 | ||||||||
| pg124.cx5 | 99.897 | 0.103 | 0.015 | ||||||||
| pg131.cx5 | 99.875 | 0.125 | 0.016 | ||||||||
| rx56.cx6a | 0.800 | 99.150 | 0.050 | 0.014 | |||||||
| rx80.cx6a | 99.856 | 0.128 | 0.017 | 0.019 |
Performance metrics for the DBMS listed above. Some are normalized by throughput, others are not. Legend for results is here.
ips	qps	rps	rmbps	wps	wmbps	rpq	rkbpq	wpi	wkbpi	csps	cpups	cspq	cpupq	dbgb1	dbgb2	rss	maxop	p50	p99	tag
998	7227	18	0.1	24.6	1.1	0.002	0.010	0.025	1.178	27970	26.9	3.870	149	10.1	50.6	9.9	0.015	8206	3022	my5649.cx6d
998	7098	0	0.0	34.8	1.2	0.000	0.000	0.035	1.263	27492	28.0	3.873	158	10.1	50.6	10.1	0.020	7112	6809	my5731.cx6d
998	6157	0	0.0	30.2	1.1	0.000	0.000	0.030	1.082	24801	29.8	4.028	194	10.0	50.6	10.3	0.025	6169	5929	my8021.cx6d
998	6046	0	0.0	26.5	1.0	0.000	0.000	0.027	1.034	23942	28.4	3.960	188	10.0	50.6	10.3	0.027	6057	5818	my8022.cx6d
998	7231	6	0.1	488.8	19.1	0.001	0.007	0.490	19.623	28095	28.4	3.886	157	11.9	15.9	0.0	0.005	7240	7032	pg1110.cx5
998	7634	0	0.0	505.0	18.7	0.000	0.000	0.506	19.232	29610	28.6	3.879	150	12.0	15.8	0.0	0.008	7640	7464	pg124.cx5
999	7744	0	0.0	501.9	18.8	0.000	0.000	0.503	19.295	30015	28.6	3.876	148	12.0	15.7	0.0	0.008	7751	7560	pg131.cx5
998	5071	1	0.0	6.8	1.9	0.000	0.008	0.007	1.909	19680	27.3	3.881	215	5.9	10.9	9.6	0.012	5082	4939	rx56.cx6a
998	4667	1	0.0	6.7	1.9	0.000	0.009	0.007	1.915	18283	28.1	3.917	241	5.9	11.1	9.9	0.012	4669	4491	rx80.cx6a
l.i0
l.i0: load without secondary indexes
Performance metrics for all DBMS, not just the ones listed above. Some are normalized by throughput, others are not. Legend for results is here.
ips	qps	rps	rmbps	wps	wmbps	rpq	rkbpq	wpi	wkbpi	csps	cpups	cspq	cpupq	dbgb1	dbgb2	rss	maxop	p50	p99	tag
139860	0	1238	4.8	51.3	32.2	0.009	0.035	0.000	0.236	15177	45.7	0.109	13	1.3	41.8	2.0	0.265	143193	18274	my5649.cx6d
126582	0	0	0.0	164.3	32.1	0.000	0.000	0.001	0.259	13041	45.4	0.103	14	1.3	41.8	2.3	0.107	128609	106054	my5731.cx6d
84388	0	0	0.0	117.0	22.2	0.000	0.000	0.001	0.270	18355	40.4	0.218	19	1.3	41.9	2.5	0.106	85509	50087	my8021.cx6d
85106	0	0	0.0	120.6	22.3	0.000	0.000	0.001	0.269	15506	40.7	0.182	19	1.3	41.9	2.5	0.118	85860	26992	my8022.cx6d
-
103093	0	0	0.0	73.3	43.2	0.000	0.000	0.001	0.429	12591	42.0	0.122	16	1.9	5.2	0.0	0.005	103490	82210	pg1110.cx5
103093	0	0	0.0	68.4	43.4	0.000	0.000	0.001	0.431	12659	42.3	0.123	16	1.9	5.2	0.0	0.003	103690	94216	pg124.cx5
105820	0	0	0.0	70.7	44.4	0.000	0.000	0.001	0.429	12878	42.8	0.122	16	1.9	5.2	0.0	0.004	106684	101415	pg131.cx5
-
103093	0	0	0.0	38.3	15.4	0.000	0.000	0.000	0.153	10495	45.5	0.102	18	1.0	2.0	1.1	0.103	101988	83911	rx56.cx6a
81967	0	0	0.0	35.4	12.3	0.000	0.000	0.000	0.153	8420	41.8	0.103	20	1.0	2.2	1.5	0.118	81110	71656	rx80.cx6a
l.x
l.x: create secondary indexes
Performance metrics for all DBMS, not just the ones listed above. Some are normalized by throughput, others are not. Legend for results is here.
ips	qps	rps	rmbps	wps	wmbps	rpq	rkbpq	wpi	wkbpi	csps	cpups	cspq	cpupq	dbgb1	dbgb2	rss	maxop	p50	p99	tag
107487	0	115	48.9	1238.7	112.1	0.001	0.465	0.012	1.068	4056	21.2	0.038	8	2.7	43.2	3.5	0.023	NA	NA	my5649.cx6d
160800	0	108	56.9	2031.9	146.8	0.001	0.362	0.013	0.935	10918	23.7	0.068	6	3.0	43.5	3.7	0.012	NA	NA	my5731.cx6d
155814	0	0	0.0	1384.1	125.9	0.000	0.000	0.009	0.827	9111	24.4	0.058	6	3.0	43.5	3.0	0.022	NA	NA	my8021.cx6d
152273	0	0	0.0	1507.1	123.6	0.000	0.000	0.010	0.831	8919	24.2	0.059	6	3.0	43.5	3.0	0.017	NA	NA	my8022.cx6d
-
300000	0	0	0.0	60.5	64.8	0.000	0.000	0.000	0.221	2027	23.6	0.007	3	3.7	8.6	0.0	0.002	NA	NA	pg1110.cx5
295588	0	0	0.0	57.4	60.7	0.000	0.000	0.000	0.210	1937	23.7	0.007	3	3.7	8.6	0.0	0.002	NA	NA	pg124.cx5
300000	0	0	0.0	65.3	66.7	0.000	0.000	0.000	0.228	2020	23.6	0.007	3	3.7	8.6	0.0	0.003	NA	NA	pg131.cx5
-
114857	0	0	0.0	41.2	20.9	0.000	0.000	0.000	0.186	819	24.5	0.007	9	2.3	3.3	2.2	0.009	NA	NA	rx56.cx6a
108064	0	0	0.0	33.3	19.7	0.000	0.000	0.000	0.187	923	24.7	0.009	9	2.3	3.5	2.6	0.008	NA	NA	rx80.cx6a
l.i1
l.i1: continue load after secondary indexes created
Performance metrics for all DBMS, not just the ones listed above. Some are normalized by throughput, others are not. Legend for results is here.
ips	qps	rps	rmbps	wps	wmbps	rpq	rkbpq	wpi	wkbpi	csps	cpups	cspq	cpupq	dbgb1	dbgb2	rss	maxop	p50	p99	tag
42373	0	742	2.9	85.5	26.7	0.018	0.070	0.002	0.646	9777	33.3	0.231	31	7.9	48.4	7.9	0.280	44401	5796	my5649.cx6d
38610	0	0	0.0	779.1	45.0	0.000	0.000	0.020	1.194	10088	34.3	0.261	36	7.9	48.4	8.2	0.092	40755	2497	my5731.cx6d
28490	0	132	2.1	137.4	19.6	0.005	0.074	0.005	0.705	14518	33.3	0.510	47	7.9	48.4	8.3	0.103	30316	600	my8021.cx6d
28902	0	134	2.1	141.9	19.9	0.005	0.074	0.005	0.706	12112	34.2	0.419	47	7.9	48.4	8.3	0.128	30867	550	my8022.cx6d
-
40733	0	0	0.0	215.3	71.8	0.000	0.000	0.005	1.805	10519	35.7	0.258	35	8.3	20.3	0.0	0.029	41205	27181	pg1110.cx5
39216	0	0	0.0	206.5	67.5	0.000	0.000	0.005	1.762	10276	35.7	0.262	36	8.2	19.7	0.0	0.050	40306	26434	pg124.cx5
39062	0	0	0.0	203.7	68.2	0.000	0.000	0.005	1.789	9986	35.7	0.256	37	8.2	19.9	0.0	0.242	40470	11037	pg131.cx5
-
43290	0	9	1.2	65.0	42.7	0.000	0.028	0.002	1.010	9451	48.8	0.218	45	4.9	8.5	3.0	0.070	42705	37160	rx56.cx6a
36364	0	7	0.8	56.9	36.1	0.000	0.024	0.002	1.016	8120	45.7	0.223	50	4.9	8.7	3.4	0.053	36175	32314	rx80.cx6a
q100.2
q100.2: range queries with 100 insert/s per client, 2nd loop
Performance metrics for all DBMS, not just the ones listed above. Some are normalized by throughput, others are not. Legend for results is here.
ips	qps	rps	rmbps	wps	wmbps	rpq	rkbpq	wpi	wkbpi	csps	cpups	cspq	cpupq	dbgb1	dbgb2	rss	maxop	p50	p99	tag
100	6886	2	0.0	2.5	0.1	0.000	0.001	0.025	1.058	26428	25.8	3.838	150	8.1	48.6	8.0	0.017	8439	2541	my5649.cx6d
100	7238	0	0.0	6.0	0.2	0.000	0.000	0.061	1.884	27789	27.0	3.839	149	8.1	48.6	8.3	0.019	7240	7144	my5731.cx6d
100	6260	0	0.0	45.3	1.1	0.000	0.000	0.454	11.069	24782	29.2	3.958	187	8.1	48.6	8.5	0.018	6265	6105	my8021.cx6d
100	6231	0	0.0	41.0	1.0	0.000	0.000	0.411	10.351	24303	27.6	3.900	177	8.1	48.6	8.5	0.024	6233	6105	my8022.cx6d
-
100	7261	0	0.0	212.4	3.9	0.000	0.000	2.128	39.734	27963	27.6	3.851	152	8.4	14.5	0.0	0.003	7272	7128	pg1110.cx5
100	7611	0	0.0	209.4	3.9	0.000	0.000	2.098	39.557	29298	27.6	3.849	145	8.2	14.2	0.0	0.002	7624	7496	pg124.cx5
100	7680	0	0.0	210.0	3.9	0.000	0.000	2.104	39.547	29564	27.6	3.850	144	8.2	13.8	0.0	0.007	7687	7544	pg131.cx5
-
100	5149	0	0.0	3.1	0.0	0.000	0.000	0.031	0.247	19770	25.9	3.839	201	4.6	8.3	4.3	0.002	5148	5066	rx56.cx6a
100	4743	0	0.0	3.1	0.0	0.000	0.000	0.031	0.251	18354	26.8	3.870	226	4.6	8.4	4.8	0.002	4747	4683	rx80.cx6a
q200.2
q200.2: range queries with 200 insert/s per client, 2nd loop
Performance metrics for all DBMS, not just the ones listed above. Some are normalized by throughput, others are not. Legend for results is here.
ips	qps	rps	rmbps	wps	wmbps	rpq	rkbpq	wpi	wkbpi	csps	cpups	cspq	cpupq	dbgb1	dbgb2	rss	maxop	p50	p99	tag
200	6938	4	0.0	2.6	0.2	0.001	0.002	0.013	0.880	26617	25.9	3.837	149	8.4	48.9	8.3	0.017	8455	2685	my5649.cx6d
200	7210	0	0.0	8.1	0.3	0.000	0.000	0.040	1.530	27701	27.1	3.842	150	8.4	48.9	8.6	0.020	7224	6936	my5731.cx6d
200	6205	0	0.0	5.0	0.2	0.000	0.000	0.025	1.069	24441	28.8	3.939	186	8.4	48.9	8.8	0.015	6217	6043	my8021.cx6d
200	6208	0	0.0	5.0	0.2	0.000	0.000	0.025	1.062	24181	27.7	3.895	178	8.4	48.9	8.8	0.020	6217	6089	my8022.cx6d
-
200	7278	0	0.0	311.0	6.9	0.000	0.000	1.558	35.268	28047	27.6	3.854	152	8.6	11.0	0.0	0.002	7288	7147	pg1110.cx5
200	7616	0	0.0	298.7	6.8	0.000	0.000	1.496	35.087	29338	27.9	3.852	147	8.4	10.9	0.0	0.004	7624	7480	pg124.cx5
200	7738	0	0.0	300.8	6.8	0.000	0.000	1.507	35.096	29804	27.7	3.851	143	8.4	10.8	0.0	0.003	7736	7592	pg131.cx5
-
200	5123	0	0.0	3.9	0.7	0.000	0.000	0.019	3.705	19698	26.3	3.845	205	4.8	8.5	4.7	0.010	5130	5018	rx56.cx6a
200	4715	0	0.0	3.9	0.7	0.000	0.000	0.019	3.714	18285	27.1	3.878	230	4.8	8.7	5.2	0.003	4715	4607	rx80.cx6a
q400.2
q400.2: range queries with 400 insert/s per client, 2nd loop
Performance metrics for all DBMS, not just the ones listed above. Some are normalized by throughput, others are not. Legend for results is here.
ips	qps	rps	rmbps	wps	wmbps	rpq	rkbpq	wpi	wkbpi	csps	cpups	cspq	cpupq	dbgb1	dbgb2	rss	maxop	p50	p99	tag
400	7470	7	0.0	2.6	0.2	0.001	0.004	0.006	0.594	28690	26.3	3.841	141	8.8	49.3	8.7	0.017	8423	2925	my5649.cx6d
399	7185	0	0.0	11.7	0.4	0.000	0.000	0.029	1.132	27649	27.3	3.848	152	8.8	49.3	9.0	0.020	7192	7064	my5731.cx6d
399	6235	0	0.0	5.9	0.3	0.000	0.000	0.015	0.744	24647	28.9	3.953	185	8.8	49.3	9.2	0.020	6249	6074	my8021.cx6d
399	6209	0	0.0	6.1	0.3	0.000	0.000	0.015	0.771	24272	27.9	3.909	180	8.8	49.3	9.2	0.024	6217	6089	my8022.cx6d
-
399	7260	0	0.0	392.1	11.3	0.000	0.000	0.982	28.940	28029	27.9	3.861	154	9.1	11.7	0.0	0.003	7272	7096	pg1110.cx5
399	7596	0	0.0	359.2	11.3	0.000	0.000	0.900	28.868	29308	28.0	3.859	147	8.8	11.4	0.0	0.006	7608	7448	pg124.cx5
399	7733	0	0.0	363.6	11.3	0.000	0.000	0.910	28.887	29834	28.0	3.858	145	8.8	11.5	0.0	0.007	7736	7592	pg131.cx5
-
399	5140	0	0.0	4.4	0.9	0.000	0.000	0.011	2.389	19800	26.5	3.852	206	4.9	8.8	5.3	0.009	5146	5034	rx56.cx6a
399	4721	0	0.0	4.7	1.0	0.000	0.000	0.012	2.497	18347	27.3	3.886	231	4.9	9.0	5.8	0.006	4731	4603	rx80.cx6a
q600.2
q600.2: range queries with 600 insert/s per client, 2nd loop
Performance metrics for all DBMS, not just the ones listed above. Some are normalized by throughput, others are not. Legend for results is here.
ips	qps	rps	rmbps	wps	wmbps	rpq	rkbpq	wpi	wkbpi	csps	cpups	cspq	cpupq	dbgb1	dbgb2	rss	maxop	p50	p99	tag
599	7673	10	0.0	2.5	0.2	0.001	0.005	0.004	0.423	29541	26.6	3.850	139	9.0	49.5	8.9	0.016	8394	3005	my5649.cx6d
599	7175	0	0.0	14.8	0.5	0.000	0.000	0.025	0.924	27651	27.5	3.854	153	9.0	49.6	9.2	0.022	7176	7080	my5731.cx6d
599	6220	0	0.0	9.2	0.4	0.000	0.000	0.015	0.647	24698	29.1	3.971	187	9.0	49.6	9.4	0.021	6233	6073	my8021.cx6d
599	6172	0	0.0	10.2	0.4	0.000	0.000	0.017	0.706	24211	28.1	3.923	182	9.0	49.6	9.4	0.023	6171	6057	my8022.cx6d
-
599	7258	1	0.0	451.2	14.4	0.000	0.001	0.753	24.602	28072	27.9	3.868	154	10.1	13.3	0.0	0.008	7272	7112	pg1110.cx5
599	7626	0	0.0	436.3	14.6	0.000	0.000	0.728	25.004	29478	28.2	3.866	148	10.0	13.3	0.0	0.004	7626	7480	pg124.cx5
599	7655	0	0.0	436.7	14.6	0.000	0.000	0.729	24.962	29576	28.3	3.864	148	10.0	13.2	0.0	0.004	7656	7502	pg131.cx5
-
599	5104	0	0.0	4.2	0.8	0.000	0.000	0.007	1.299	19688	26.6	3.857	208	5.2	9.3	6.3	0.011	5114	5002	rx56.cx6a
599	4690	0	0.0	4.8	0.9	0.000	0.000	0.008	1.598	18262	27.3	3.893	233	5.2	9.5	6.7	0.006	4699	4571	rx80.cx6a
q800.2
q800.2: range queries with 800 insert/s per client, 2nd loop
Performance metrics for all DBMS, not just the ones listed above. Some are normalized by throughput, others are not. Legend for results is here.
ips	qps	rps	rmbps	wps	wmbps	rpq	rkbpq	wpi	wkbpi	csps	cpups	cspq	cpupq	dbgb1	dbgb2	rss	maxop	p50	p99	tag
799	6961	14	0.1	2.9	0.4	0.002	0.008	0.004	0.489	26856	26.6	3.858	153	9.4	49.9	9.3	0.017	8199	2701	my5649.cx6d
799	7060	0	0.0	26.4	0.9	0.000	0.000	0.033	1.209	27287	27.7	3.865	157	9.4	49.9	9.5	0.018	7064	6953	my5731.cx6d
799	6200	0	0.0	18.7	0.7	0.000	0.000	0.023	0.923	24777	29.4	3.996	190	9.4	49.9	9.7	0.022	6217	6042	my8021.cx6d
799	6132	0	0.0	19.9	0.8	0.000	0.000	0.025	0.985	24180	28.3	3.943	185	9.4	49.9	9.7	0.023	6137	5993	my8022.cx6d
-
799	7229	3	0.0	467.4	16.5	0.000	0.004	0.585	21.091	28002	28.1	3.873	155	11.1	14.6	0.0	0.004	7240	7083	pg1110.cx5
799	7628	4	0.0	502.6	16.6	0.001	0.005	0.629	21.317	29541	28.4	3.873	149	11.3	14.8	0.0	0.004	7639	7464	pg124.cx5
799	7682	4	0.0	500.6	16.6	0.001	0.005	0.627	21.322	29751	28.5	3.873	148	11.3	14.8	0.0	0.017	7688	7528	pg131.cx5
-
799	5086	1	0.1	6.3	1.7	0.000	0.023	0.008	2.136	19702	27.1	3.874	213	5.5	10.1	7.5	0.007	5083	4972	rx56.cx6a
799	4700	1	0.1	6.2	1.7	0.000	0.024	0.008	2.142	18370	28.0	3.909	238	5.5	10.2	7.8	0.015	4702	4539	rx80.cx6a
q1000.2
q1000.2: range queries with 1000 insert/s per client, 2nd loop
Performance metrics for all DBMS, not just the ones listed above. Some are normalized by throughput, others are not. Legend for results is here.
ips	qps	rps	rmbps	wps	wmbps	rpq	rkbpq	wpi	wkbpi	csps	cpups	cspq	cpupq	dbgb1	dbgb2	rss	maxop	p50	p99	tag
998	7227	18	0.1	24.6	1.1	0.002	0.010	0.025	1.178	27970	26.9	3.870	149	10.1	50.6	9.9	0.015	8206	3022	my5649.cx6d
998	7098	0	0.0	34.8	1.2	0.000	0.000	0.035	1.263	27492	28.0	3.873	158	10.1	50.6	10.1	0.020	7112	6809	my5731.cx6d
998	6157	0	0.0	30.2	1.1	0.000	0.000	0.030	1.082	24801	29.8	4.028	194	10.0	50.6	10.3	0.025	6169	5929	my8021.cx6d
998	6046	0	0.0	26.5	1.0	0.000	0.000	0.027	1.034	23942	28.4	3.960	188	10.0	50.6	10.3	0.027	6057	5818	my8022.cx6d
-
998	7231	6	0.1	488.8	19.1	0.001	0.007	0.490	19.623	28095	28.4	3.886	157	11.9	15.9	0.0	0.005	7240	7032	pg1110.cx5
998	7634	0	0.0	505.0	18.7	0.000	0.000	0.506	19.232	29610	28.6	3.879	150	12.0	15.8	0.0	0.008	7640	7464	pg124.cx5
999	7744	0	0.0	501.9	18.8	0.000	0.000	0.503	19.295	30015	28.6	3.876	148	12.0	15.7	0.0	0.008	7751	7560	pg131.cx5
-
998	5071	1	0.0	6.8	1.9	0.000	0.008	0.007	1.909	19680	27.3	3.881	215	5.9	10.9	9.6	0.012	5082	4939	rx56.cx6a
998	4667	1	0.0	6.7	1.9	0.000	0.009	0.007	1.915	18283	28.1	3.917	241	5.9	11.1	9.9	0.012	4669	4491	rx80.cx6a
l.i0
- l.i0: load without secondary indexes
- Legend for results is here.
- Each entry lists the percentage of responses that fit in that bucket (slower than max time for previous bucket, faster than min time for next bucket).
Insert response time histogram
256us	1ms	4ms	16ms	64ms	256ms	1s	4s	16s	gt	max	tag
0.000	99.037	0.867	0.085	0.007	0.003	0.001	0.000	0.000	0.000	0.265	my5649.cx6d
0.000	98.832	0.904	0.259	0.002	0.003	0.000	0.000	0.000	0.000	0.107	my5731.cx6d
0.000	0.001	99.602	0.357	0.038	0.002	0.000	0.000	0.000	0.000	0.106	my8021.cx6d
0.000	0.000	99.703	0.188	0.108	0.002	0.000	0.000	0.000	0.000	0.118	my8022.cx6d
-
0.000	95.257	4.743	0.001	0.000	0.000	0.000	0.000	0.000	0.000	0.005	pg1110.cx5
0.000	95.678	4.322	0.000	0.000	0.000	0.000	0.000	0.000	0.000	0.003	pg124.cx5
0.000	97.982	2.017	0.001	0.000	0.000	0.000	0.000	0.000	0.000	0.004	pg131.cx5
-
0.000	79.607	20.340	0.049	0.000	0.003	0.000	0.000	0.000	0.000	0.103	rx56.cx6a
0.000	0.012	99.826	0.143	0.018	0.001	0.000	0.000	0.000	0.000	0.118	rx80.cx6a
l.x
- l.x: create secondary indexes
- Legend for results is here.
- Each entry lists the percentage of responses that fit in that bucket (slower than max time for previous bucket, faster than min time for next bucket).
TODO - determine whether there is data for create index response time
l.i1
- l.i1: continue load after secondary indexes created
- Legend for results is here.
- Each entry lists the percentage of responses that fit in that bucket (slower than max time for previous bucket, faster than min time for next bucket).
Insert response time histogram
256us	1ms	4ms	16ms	64ms	256ms	1s	4s	16s	gt	max	tag
0.000	29.170	69.875	0.819	0.130	0.005	nonzero	0.000	0.000	0.000	0.280	my5649.cx6d
0.000	0.000	99.200	0.676	0.122	0.002	0.000	0.000	0.000	0.000	0.092	my5731.cx6d
0.000	0.000	99.167	0.683	0.110	0.040	0.000	0.000	0.000	0.000	0.103	my8021.cx6d
0.000	0.000	99.296	0.451	0.212	0.042	0.000	0.000	0.000	0.000	0.128	my8022.cx6d
-
0.000	0.000	99.972	0.025	0.003	0.000	0.000	0.000	0.000	0.000	0.029	pg1110.cx5
0.000	0.000	99.981	0.017	0.003	0.000	0.000	0.000	0.000	0.000	0.050	pg124.cx5
0.000	0.000	99.850	0.123	0.024	0.003	0.000	0.000	0.000	0.000	0.242	pg131.cx5
-
0.000	7.865	92.041	0.091	0.003	0.001	0.000	0.000	0.000	0.000	0.070	rx56.cx6a
0.000	0.088	99.757	0.140	0.015	0.000	0.000	0.000	0.000	0.000	0.053	rx80.cx6a
q100.2
- q100.2: range queries with 100 insert/s per client, 2nd loop
- Legend for results is here.
- Each entry lists the percentage of responses that fit in that bucket (slower than max time for previous bucket, faster than min time for next bucket).
Query response time histogram
256us	1ms	4ms	16ms	64ms	256ms	1s	4s	16s	gt	max	tag
90.945	9.052	0.002	0.002	nonzero	0.000	0.000	0.000	0.000	0.000	0.017	my5649.cx6d
99.892	0.108	nonzero	nonzero	nonzero	0.000	0.000	0.000	0.000	0.000	0.019	my5731.cx6d
99.272	0.728	nonzero	nonzero	nonzero	0.000	0.000	0.000	0.000	0.000	0.018	my8021.cx6d
99.383	0.617	nonzero	nonzero	nonzero	0.000	0.000	0.000	0.000	0.000	0.024	my8022.cx6d
-
99.912	0.087	0.001	0.000	0.000	0.000	0.000	0.000	0.000	0.000	0.003	pg1110.cx5
99.963	0.037	0.001	0.000	0.000	0.000	0.000	0.000	0.000	0.000	0.002	pg124.cx5
99.963	0.036	0.001	nonzero	0.000	0.000	0.000	0.000	0.000	0.000	0.007	pg131.cx5
-
97.516	2.484	nonzero	0.000	0.000	0.000	0.000	0.000	0.000	0.000	0.002	rx56.cx6a
97.900	2.100	nonzero	0.000	0.000	0.000	0.000	0.000	0.000	0.000	0.002	rx80.cx6a
Insert response time histogram
256us	1ms	4ms	16ms	64ms	256ms	1s	4s	16s	gt	max	tag
0.000	0.111	53.111	39.639	7.139	0.000	0.000	0.000	0.000	0.000	0.021	my5649.cx6d
0.000	0.000	99.250	0.444	0.306	0.000	0.000	0.000	0.000	0.000	0.023	my5731.cx6d
0.000	0.000	98.667	1.167	0.167	0.000	0.000	0.000	0.000	0.000	0.023	my8021.cx6d
0.000	0.000	98.167	1.667	0.167	0.000	0.000	0.000	0.000	0.000	0.028	my8022.cx6d
-
0.000	0.000	99.944	0.056	0.000	0.000	0.000	0.000	0.000	0.000	0.006	pg1110.cx5
0.000	0.000	99.944	0.056	0.000	0.000	0.000	0.000	0.000	0.000	0.006	pg124.cx5
0.000	0.000	99.972	0.028	0.000	0.000	0.000	0.000	0.000	0.000	0.006	pg131.cx5
-
0.000	0.000	100.000	0.000	0.000	0.000	0.000	0.000	0.000	0.000	0.004	rx56.cx6a
0.000	0.000	99.917	0.083	0.000	0.000	0.000	0.000	0.000	0.000	0.004	rx80.cx6a
q200.2
- q200.2: range queries with 200 insert/s per client, 2nd loop
- Legend for results is here.
- Each entry lists the percentage of responses that fit in that bucket (slower than max time for previous bucket, faster than min time for next bucket).
Query response time histogram
256us	1ms	4ms	16ms	64ms	256ms	1s	4s	16s	gt	max	tag
91.279	8.716	0.002	0.003	nonzero	0.000	0.000	0.000	0.000	0.000	0.017	my5649.cx6d
99.876	0.124	nonzero	nonzero	nonzero	0.000	0.000	0.000	0.000	0.000	0.020	my5731.cx6d
99.302	0.697	nonzero	nonzero	0.000	0.000	0.000	0.000	0.000	0.000	0.015	my8021.cx6d
99.389	0.610	0.001	nonzero	nonzero	0.000	0.000	0.000	0.000	0.000	0.020	my8022.cx6d
-
99.913	0.085	0.002	0.000	0.000	0.000	0.000	0.000	0.000	0.000	0.002	pg1110.cx5
99.965	0.034	0.002	0.000	0.000	0.000	0.000	0.000	0.000	0.000	0.004	pg124.cx5
99.967	0.031	0.002	0.000	0.000	0.000	0.000	0.000	0.000	0.000	0.003	pg131.cx5
-
97.333	2.667	nonzero	nonzero	0.000	0.000	0.000	0.000	0.000	0.000	0.010	rx56.cx6a
97.878	2.121	nonzero	0.000	0.000	0.000	0.000	0.000	0.000	0.000	0.003	rx80.cx6a
Insert response time histogram
256us	1ms	4ms	16ms	64ms	256ms	1s	4s	16s	gt	max	tag
0.000	0.278	75.903	20.708	3.111	0.000	0.000	0.000	0.000	0.000	0.021	my5649.cx6d
0.000	0.000	99.417	0.389	0.194	0.000	0.000	0.000	0.000	0.000	0.022	my5731.cx6d
0.000	0.000	99.181	0.694	0.125	0.000	0.000	0.000	0.000	0.000	0.023	my8021.cx6d
0.000	0.000	97.486	2.389	0.125	0.000	0.000	0.000	0.000	0.000	0.029	my8022.cx6d
-
0.000	0.000	99.972	0.028	0.000	0.000	0.000	0.000	0.000	0.000	0.006	pg1110.cx5
0.000	0.000	99.986	0.014	0.000	0.000	0.000	0.000	0.000	0.000	0.006	pg124.cx5
0.000	0.000	99.986	0.014	0.000	0.000	0.000	0.000	0.000	0.000	0.006	pg131.cx5
-
0.000	3.472	96.500	0.028	0.000	0.000	0.000	0.000	0.000	0.000	0.004	rx56.cx6a
0.000	0.014	99.931	0.056	0.000	0.000	0.000	0.000	0.000	0.000	0.011	rx80.cx6a
q400.2
- q400.2: range queries with 400 insert/s per client, 2nd loop
- Legend for results is here.
- Each entry lists the percentage of responses that fit in that bucket (slower than max time for previous bucket, faster than min time for next bucket).
Query response time histogram
256us	1ms	4ms	16ms	64ms	256ms	1s	4s	16s	gt	max	tag
94.887	5.109	0.002	0.002	nonzero	0.000	0.000	0.000	0.000	0.000	0.017	my5649.cx6d
99.822	0.176	0.001	nonzero	nonzero	0.000	0.000	0.000	0.000	0.000	0.020	my5731.cx6d
99.249	0.750	0.001	nonzero	nonzero	0.000	0.000	0.000	0.000	0.000	0.020	my8021.cx6d
99.342	0.657	0.001	nonzero	nonzero	0.000	0.000	0.000	0.000	0.000	0.024	my8022.cx6d
-
99.885	0.110	0.005	0.000	0.000	0.000	0.000	0.000	0.000	0.000	0.003	pg1110.cx5
99.943	0.052	0.004	nonzero	0.000	0.000	0.000	0.000	0.000	0.000	0.006	pg124.cx5
99.953	0.043	0.004	nonzero	0.000	0.000	0.000	0.000	0.000	0.000	0.007	pg131.cx5
-
97.391	2.608	0.001	nonzero	0.000	0.000	0.000	0.000	0.000	0.000	0.009	rx56.cx6a
97.670	2.329	0.002	nonzero	0.000	0.000	0.000	0.000	0.000	0.000	0.006	rx80.cx6a
Insert response time histogram
256us	1ms	4ms	16ms	64ms	256ms	1s	4s	16s	gt	max	tag
0.000	2.361	86.167	10.757	0.715	0.000	0.000	0.000	0.000	0.000	0.021	my5649.cx6d
0.000	0.000	99.688	0.215	0.097	0.000	0.000	0.000	0.000	0.000	0.024	my5731.cx6d
0.000	0.000	99.319	0.611	0.069	0.000	0.000	0.000	0.000	0.000	0.025	my8021.cx6d
0.000	0.000	97.889	2.042	0.069	0.000	0.000	0.000	0.000	0.000	0.025	my8022.cx6d
-
0.000	0.000	99.965	0.028	0.007	0.000	0.000	0.000	0.000	0.000	0.017	pg1110.cx5
0.000	0.000	99.993	0.007	0.000	0.000	0.000	0.000	0.000	0.000	0.006	pg124.cx5
0.000	0.000	99.993	0.007	0.000	0.000	0.000	0.000	0.000	0.000	0.006	pg131.cx5
-
0.000	3.403	96.562	0.035	0.000	0.000	0.000	0.000	0.000	0.000	0.011	rx56.cx6a
0.000	0.000	99.896	0.083	0.021	0.000	0.000	0.000	0.000	0.000	0.019	rx80.cx6a
q600.2
- q600.2: range queries with 600 insert/s per client, 2nd loop
- Legend for results is here.
- Each entry lists the percentage of responses that fit in that bucket (slower than max time for previous bucket, faster than min time for next bucket).
Query response time histogram
256us	1ms	4ms	16ms	64ms	256ms	1s	4s	16s	gt	max	tag
96.207	3.789	0.003	0.001	nonzero	0.000	0.000	0.000	0.000	0.000	0.016	my5649.cx6d
99.813	0.184	0.003	nonzero	nonzero	0.000	0.000	0.000	0.000	0.000	0.022	my5731.cx6d
99.249	0.749	0.001	nonzero	nonzero	0.000	0.000	0.000	0.000	0.000	0.021	my8021.cx6d
99.292	0.707	0.002	nonzero	nonzero	0.000	0.000	0.000	0.000	0.000	0.023	my8022.cx6d
-
99.867	0.125	0.009	nonzero	0.000	0.000	0.000	0.000	0.000	0.000	0.008	pg1110.cx5
99.934	0.058	0.009	nonzero	0.000	0.000	0.000	0.000	0.000	0.000	0.004	pg124.cx5
99.929	0.062	0.009	nonzero	0.000	0.000	0.000	0.000	0.000	0.000	0.004	pg131.cx5
-
96.981	3.017	0.002	nonzero	0.000	0.000	0.000	0.000	0.000	0.000	0.011	rx56.cx6a
97.560	2.436	0.004	nonzero	0.000	0.000	0.000	0.000	0.000	0.000	0.006	rx80.cx6a
Insert response time histogram
256us	1ms	4ms	16ms	64ms	256ms	1s	4s	16s	gt	max	tag
0.000	4.380	88.167	7.236	0.218	0.000	0.000	0.000	0.000	0.000	0.020	my5649.cx6d
0.000	0.000	99.833	0.116	0.051	0.000	0.000	0.000	0.000	0.000	0.025	my5731.cx6d
0.000	0.000	99.060	0.898	0.042	0.000	0.000	0.000	0.000	0.000	0.024	my8021.cx6d
0.000	0.000	98.801	1.144	0.056	0.000	0.000	0.000	0.000	0.000	0.027	my8022.cx6d
-
0.000	0.000	99.222	0.736	0.042	0.000	0.000	0.000	0.000	0.000	0.035	pg1110.cx5
0.000	0.000	99.986	0.014	0.000	0.000	0.000	0.000	0.000	0.000	0.006	pg124.cx5
0.000	0.000	99.977	0.023	0.000	0.000	0.000	0.000	0.000	0.000	0.006	pg131.cx5
-
0.000	2.162	97.801	0.037	0.000	0.000	0.000	0.000	0.000	0.000	0.004	rx56.cx6a
0.000	0.000	99.903	0.074	0.023	0.000	0.000	0.000	0.000	0.000	0.021	rx80.cx6a
q800.2
- q800.2: range queries with 800 insert/s per client, 2nd loop
- Legend for results is here.
- Each entry lists the percentage of responses that fit in that bucket (slower than max time for previous bucket, faster than min time for next bucket).
Query response time histogram
256us	1ms	4ms	16ms	64ms	256ms	1s	4s	16s	gt	max	tag
92.634	7.359	0.005	0.002	nonzero	0.000	0.000	0.000	0.000	0.000	0.017	my5649.cx6d
99.727	0.269	0.004	nonzero	nonzero	0.000	0.000	0.000	0.000	0.000	0.018	my5731.cx6d
99.129	0.870	0.002	nonzero	nonzero	0.000	0.000	0.000	0.000	0.000	0.022	my8021.cx6d
99.165	0.833	0.002	nonzero	nonzero	0.000	0.000	0.000	0.000	0.000	0.023	my8022.cx6d
-
99.842	0.146	0.012	0.000	0.000	0.000	0.000	0.000	0.000	0.000	0.004	pg1110.cx5
99.906	0.083	0.011	0.000	0.000	0.000	0.000	0.000	0.000	0.000	0.004	pg124.cx5
99.908	0.082	0.011	0.000	nonzero	0.000	0.000	0.000	0.000	0.000	0.017	pg131.cx5
-
96.901	3.096	0.002	nonzero	0.000	0.000	0.000	0.000	0.000	0.000	0.007	rx56.cx6a
97.213	2.780	0.007	nonzero	0.000	0.000	0.000	0.000	0.000	0.000	0.015	rx80.cx6a
Insert response time histogram
256us	1ms	4ms	16ms	64ms	256ms	1s	4s	16s	gt	max	tag
0.000	3.049	91.076	5.507	0.368	0.000	0.000	0.000	0.000	0.000	0.018	my5649.cx6d
0.000	0.000	99.743	0.198	0.059	0.000	0.000	0.000	0.000	0.000	0.025	my5731.cx6d
0.000	0.000	98.674	1.222	0.104	0.000	0.000	0.000	0.000	0.000	0.028	my8021.cx6d
0.000	0.000	99.413	0.458	0.128	0.000	0.000	0.000	0.000	0.000	0.029	my8022.cx6d
-
0.000	0.000	98.365	1.618	0.017	0.000	0.000	0.000	0.000	0.000	0.019	pg1110.cx5
0.000	0.000	97.531	2.451	0.017	0.000	0.000	0.000	0.000	0.000	0.018	pg124.cx5
0.000	0.000	97.611	2.365	0.024	0.000	0.000	0.000	0.000	0.000	0.020	pg131.cx5
-
0.000	2.660	97.271	0.069	0.000	0.000	0.000	0.000	0.000	0.000	0.013	rx56.cx6a
0.000	0.007	99.878	0.097	0.017	0.000	0.000	0.000	0.000	0.000	0.022	rx80.cx6a
q1000.2
- q1000.2: range queries with 1000 insert/s per client, 2nd loop
- Legend for results is here.
- Each entry lists the percentage of responses that fit in that bucket (slower than max time for previous bucket, faster than min time for next bucket).
Query response time histogram
256us	1ms	4ms	16ms	64ms	256ms	1s	4s	16s	gt	max	tag
94.421	5.570	0.006	0.003	0.000	0.000	0.000	0.000	0.000	0.000	0.015	my5649.cx6d
99.677	0.318	0.005	nonzero	nonzero	0.000	0.000	0.000	0.000	0.000	0.020	my5731.cx6d
98.982	1.016	0.002	nonzero	nonzero	0.000	0.000	0.000	0.000	0.000	0.025	my8021.cx6d
99.055	0.943	0.002	nonzero	nonzero	0.000	0.000	0.000	0.000	0.000	0.027	my8022.cx6d
-
99.820	0.165	0.015	nonzero	0.000	0.000	0.000	0.000	0.000	0.000	0.005	pg1110.cx5
99.901	0.085	0.014	nonzero	0.000	0.000	0.000	0.000	0.000	0.000	0.008	pg124.cx5
99.906	0.080	0.014	nonzero	0.000	0.000	0.000	0.000	0.000	0.000	0.008	pg131.cx5
-
96.719	3.278	0.003	nonzero	0.000	0.000	0.000	0.000	0.000	0.000	0.012	rx56.cx6a
96.964	3.028	0.008	nonzero	0.000	0.000	0.000	0.000	0.000	0.000	0.012	rx80.cx6a
Insert response time histogram
256us	1ms	4ms	16ms	64ms	256ms	1s	4s	16s	gt	max	tag
0.000	2.747	92.522	4.569	0.161	0.000	0.000	0.000	0.000	0.000	0.019	my5649.cx6d
0.000	0.000	99.736	0.219	0.044	0.000	0.000	0.000	0.000	0.000	0.022	my5731.cx6d
0.000	0.000	98.767	1.136	0.097	0.000	0.000	0.000	0.000	0.000	0.027	my8021.cx6d
0.000	0.000	99.033	0.850	0.117	0.000	0.000	0.000	0.000	0.000	0.029	my8022.cx6d
-
0.000	0.000	99.886	0.114	0.000	0.000	0.000	0.000	0.000	0.000	0.016	pg1110.cx5
0.000	0.000	99.897	0.103	0.000	0.000	0.000	0.000	0.000	0.000	0.015	pg124.cx5
0.000	0.000	99.875	0.125	0.000	0.000	0.000	0.000	0.000	0.000	0.016	pg131.cx5
-
0.000	0.800	99.150	0.050	0.000	0.000	0.000	0.000	0.000	0.000	0.014	rx56.cx6a
0.000	0.000	99.856	0.128	0.017	0.000	0.000	0.000	0.000	0.000	0.019	rx80.cx6a