Introduction
This is a report for the insert benchmark with 100M docs and 1 client(s). It is generated by scripts (bash, awk, sed) and Tufte might not be impressed. An overview of the insert benchmark is here and a short update is here. Below, by DBMS, I mean DBMS+version.config. An example is my8020.c10b40 where my means MySQL, 8020 is version 8.0.20 and c10b40 is the name for the configuration file.
The test server is an Intel NUC. Clients and the DBMS share one server.
The tested DBMS are:
- pg1110.cx5 - Postgres 11.10 with the cx5 config
- pg124.cx5 - Postgres 12.4 with the cx5 config
- pg131.cx5 - Postgres 13.1 with the cx5 config
- my5649.cx6d - MySQL 5.7.31 with InnoDB and the cx6d config
- my5731.cx6d - MySQL 5.7.31 with InnoDB and the cx6d config
- my8022.cx6d - MySQL 8.0.22 with InnoDB and the cx6d config
- rx56.cx6a - MySQL 5.6.35 with MyRocks and the cx6a config
- rx80.cx6a - MySQL 8.0.17 with MyRocks and the cx6a config
Contents
- Summary
- l.i0: load without secondary indexes
- l.x: create secondary indexes
- l.i1: continue load after secondary indexes created
- q100.2: range queries with 100 insert/s per client, 2nd loop
- q200.2: range queries with 200 insert/s per client, 2nd loop
- q400.2: range queries with 400 insert/s per client, 2nd loop
- q600.2: range queries with 600 insert/s per client, 2nd loop
- q800.2: range queries with 800 insert/s per client, 2nd loop
- q1000.2: range queries with 1000 insert/s per client, 2nd loop
Summary
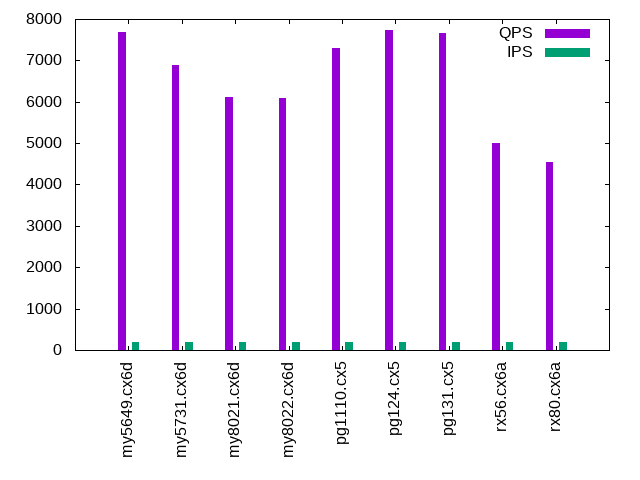
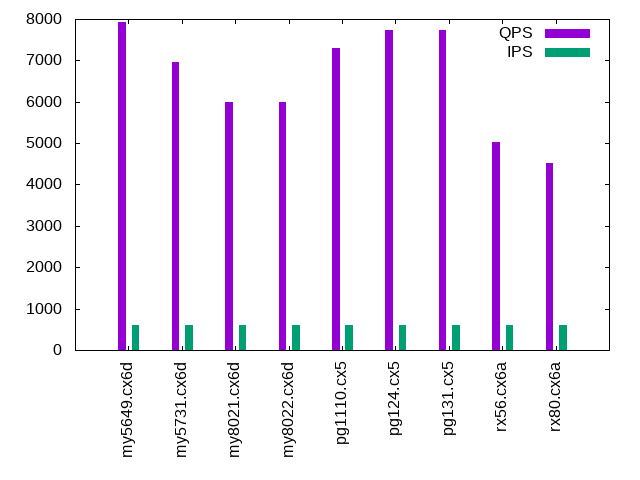
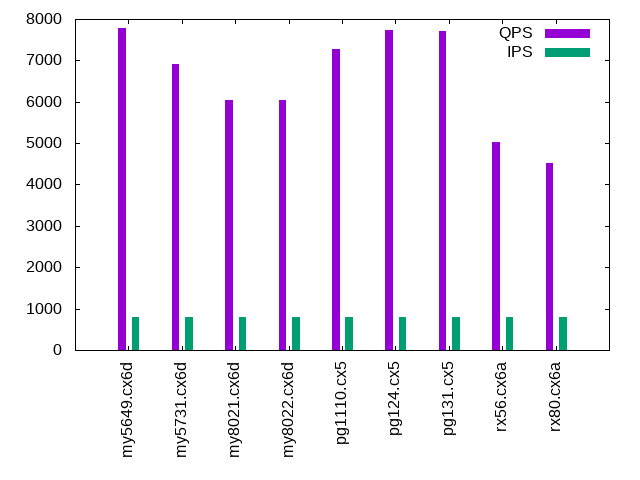
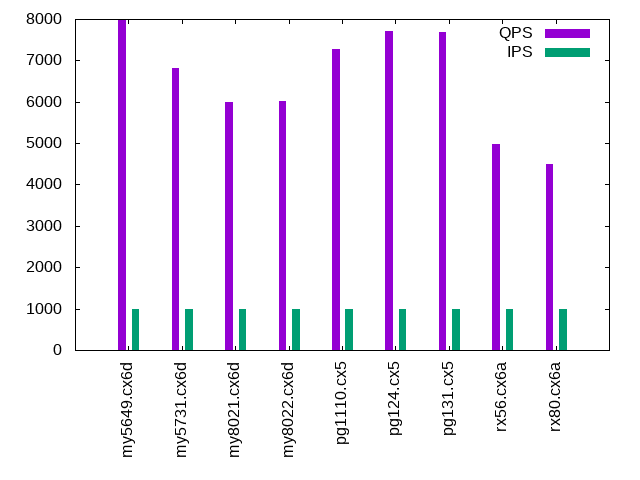
The numbers are inserts/s for l.i0 and l.i1, indexed docs (or rows) /s for l.x and queries/s for q*.2. The values are the average rate over the entire test for inserts (IPS) and queries (QPS). The range of values for IPS and QPS is split into 3 parts: bottom 25%, middle 50%, top 25%. Values in the bottom 25% have a red background, values in the top 25% have a green background and values in the middle have no color. A gray background is used for values that can be ignored because the DBMS did not sustain the target insert rate. Red backgrounds are not used when the minimum value is within 80% of the max value.
| dbms | l.i0 | l.x | l.i1 | q100.2 | q200.2 | q400.2 | q600.2 | q800.2 | q1000.2 |
|---|---|---|---|---|---|---|---|---|---|
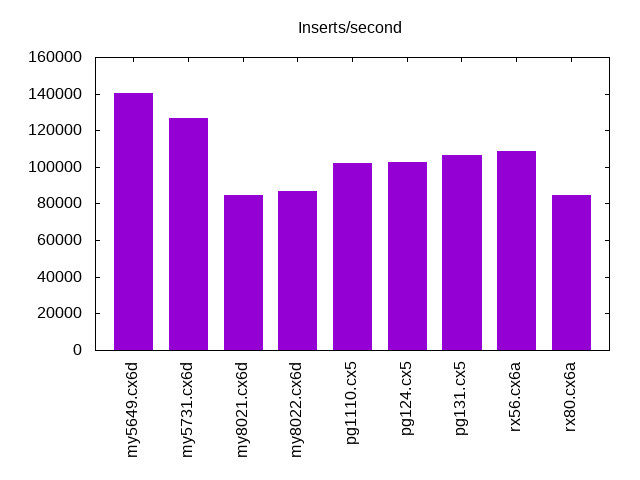
| my5649.cx6d | 140449 | 91166 | 23148 | 7898 | 7680 | 7809 | 7917 | 7775 | 7967 |
| my5731.cx6d | 126904 | 161192 | 20790 | 7002 | 6891 | 6903 | 6962 | 6902 | 6818 |
| my8021.cx6d | 84890 | 110730 | 12438 | 6134 | 6103 | 6102 | 5991 | 6047 | 5998 |
| my8022.cx6d | 86580 | 108686 | 12970 | 6087 | 6098 | 6068 | 5997 | 6053 | 6027 |
| pg1110.cx5 | 102354 | 278056 | 24630 | 7296 | 7295 | 7280 | 7291 | 7282 | 7283 |
| pg124.cx5 | 102459 | 272752 | 22472 | 7720 | 7736 | 7716 | 7746 | 7744 | 7720 |
| pg131.cx5 | 106724 | 287644 | 20661 | 7685 | 7659 | 7729 | 7736 | 7712 | 7675 |
| rx56.cx6a | 108460 | 112220 | 42553 | 5065 | 5009 | 5046 | 5022 | 5016 | 4975 |
| rx80.cx6a | 84459 | 107173 | 35842 | 4582 | 4544 | 4575 | 4514 | 4529 | 4496 |
This lists the average rate of inserts/s for the tests that do inserts concurrent with queries. For such tests the query rate is listed in the table above. The read+write tests are setup so that the insert rate should match the target rate every second. Cells that are not at least 95% of the target have a red background to indicate a failure to satisfy the target.
| dbms | q100.2 | q200.2 | q400.2 | q600.2 | q800.2 | q1000.2 |
|---|---|---|---|---|---|---|
| my5649.cx6d | 100 | 200 | 399 | 599 | 799 | 998 |
| my5731.cx6d | 100 | 200 | 399 | 599 | 799 | 998 |
| my8021.cx6d | 100 | 200 | 399 | 599 | 799 | 998 |
| my8022.cx6d | 100 | 200 | 399 | 599 | 799 | 998 |
| pg1110.cx5 | 100 | 200 | 399 | 599 | 799 | 999 |
| pg124.cx5 | 100 | 200 | 399 | 599 | 799 | 999 |
| pg131.cx5 | 100 | 200 | 399 | 599 | 799 | 998 |
| rx56.cx6a | 100 | 200 | 399 | 599 | 799 | 998 |
| rx80.cx6a | 100 | 200 | 399 | 599 | 799 | 998 |
| target | 100 | 200 | 400 | 600 | 800 | 1000 |
l.i0
l.i0: load without secondary indexes. Graphs for performance per 1-second interval are here.
Average throughput:
Insert response time histogram: each cell has the percentage of responses that take <= the time in the header and max is the max response time in seconds. For the max column values in the top 25% of the range have a red background and in the bottom 25% of the range have a green background. The red background is not used when the min value is within 80% of the max value.
| dbms | 256us | 1ms | 4ms | 16ms | 64ms | 256ms | 1s | 4s | 16s | gt | max |
|---|---|---|---|---|---|---|---|---|---|---|---|
| my5649.cx6d | 98.374 | 1.449 | 0.136 | 0.037 | 0.002 | 0.002 | 0.344 | ||||
| my5731.cx6d | 98.619 | 1.132 | 0.244 | 0.001 | 0.003 | 0.110 | |||||
| my8021.cx6d | 99.594 | 0.371 | 0.033 | 0.003 | 0.129 | ||||||
| my8022.cx6d | 0.339 | 99.405 | 0.136 | 0.117 | 0.003 | 0.117 | |||||
| pg1110.cx5 | 92.186 | 7.813 | 0.001 | 0.006 | |||||||
| pg124.cx5 | 91.988 | 8.011 | 0.001 | nonzero | 0.057 | ||||||
| pg131.cx5 | 97.670 | 2.328 | 0.001 | 0.001 | 0.041 | ||||||
| rx56.cx6a | 96.182 | 3.766 | 0.048 | nonzero | 0.004 | 0.156 | |||||
| rx80.cx6a | nonzero | 99.832 | 0.150 | 0.015 | 0.002 | 0.178 |
Performance metrics for the DBMS listed above. Some are normalized by throughput, others are not. Legend for results is here.
ips	qps	rps	rmbps	wps	wmbps	rpq	rkbpq	wpi	wkbpi	csps	cpups	cspq	cpupq	dbgb1	dbgb2	rss	maxop	p50	p99	tag
140449	0	1230	4.8	221.4	37.2	0.009	0.035	0.002	0.271	15746	47.2	0.112	13	6.6	47.1	7.2	0.344	140850	96693	my5649.cx6d
126904	0	0	0.0	267.3	35.2	0.000	0.000	0.002	0.284	13497	46.3	0.106	15	6.6	47.1	7.5	0.110	127963	112378	my5731.cx6d
84890	0	0	0.0	211.4	24.7	0.000	0.000	0.002	0.298	18911	40.6	0.223	19	6.6	47.1	7.7	0.129	85340	74834	my8021.cx6d
86580	0	0	0.0	215.3	25.2	0.000	0.000	0.002	0.298	15181	41.2	0.175	19	6.6	47.1	7.7	0.117	86964	77116	my8022.cx6d
102354	0	0	0.0	166.6	43.8	0.000	0.000	0.002	0.438	12365	41.7	0.121	16	9.6	17.4	0.7	0.006	102430	99492	pg1110.cx5
102459	0	0	0.0	166.0	44.0	0.000	0.000	0.002	0.440	12329	41.5	0.120	16	9.6	17.5	0.0	0.057	102620	97193	pg124.cx5
106724	0	0	0.0	102.2	45.3	0.000	0.000	0.001	0.434	12826	43.2	0.120	16	9.6	18.0	0.0	0.041	107019	102004	pg131.cx5
108460	0	0	0.0	38.1	16.2	0.000	0.000	0.000	0.153	11003	46.3	0.101	17	4.8	10.0	1.5	0.156	110279	92499	rx56.cx6a
84459	0	0	0.0	36.2	12.6	0.000	0.000	0.000	0.153	8833	42.5	0.105	20	4.8	10.2	1.9	0.178	85809	72053	rx80.cx6a
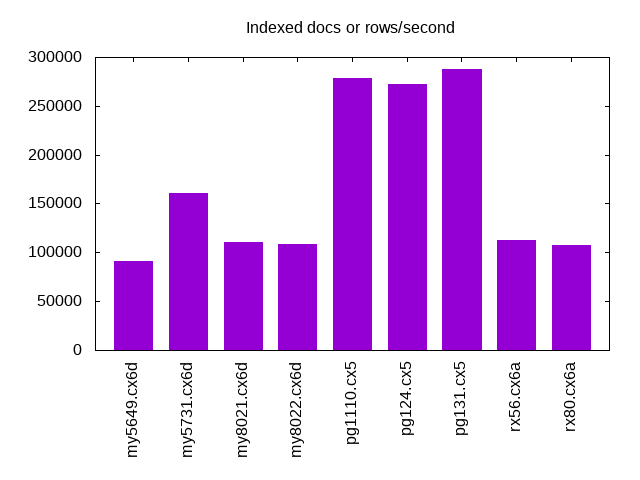
l.x
l.x: create secondary indexes.
Average throughput:
Performance metrics for the DBMS listed above. Some are normalized by throughput, others are not. Legend for results is here.
ips	qps	rps	rmbps	wps	wmbps	rpq	rkbpq	wpi	wkbpi	csps	cpups	cspq	cpupq	dbgb1	dbgb2	rss	maxop	p50	p99	tag
91166	0	181	58.7	1108.3	104.5	0.002	0.660	0.012	1.174	3681	20.4	0.040	9	13.6	54.1	10.7	0.006	NA	NA	my5649.cx6d
161192	0	257	105.4	1936.8	165.4	0.002	0.669	0.012	1.051	11008	25.1	0.068	6	14.7	55.3	10.9	0.016	NA	NA	my5731.cx6d
110730	0	152	72.1	1210.8	106.0	0.001	0.666	0.011	0.980	7150	24.3	0.065	9	14.7	55.2	10.3	0.017	NA	NA	my8021.cx6d
108686	0	132	71.7	1195.3	104.1	0.001	0.676	0.011	0.981	6854	24.1	0.063	9	14.7	55.2	10.3	0.022	NA	NA	my8022.cx6d
278056	0	126	15.4	631.7	126.9	0.000	0.057	0.002	0.468	1643	24.0	0.006	3	18.4	32.8	0.0	0.003	NA	NA	pg1110.cx5
272752	0	116	14.2	635.9	122.2	0.000	0.053	0.002	0.459	1492	23.7	0.005	3	18.4	32.6	0.0	0.002	NA	NA	pg124.cx5
287644	0	82	9.9	190.7	81.9	0.000	0.035	0.001	0.292	593	23.7	0.002	3	18.4	27.5	0.0	0.004	NA	NA	pg131.cx5
112220	0	32	8.7	46.4	19.9	0.000	0.079	0.000	0.181	789	24.5	0.007	9	11.1	16.3	6.7	0.010	NA	NA	rx56.cx6a
107173	0	31	8.3	47.2	18.9	0.000	0.080	0.000	0.181	887	24.6	0.008	9	11.1	16.5	7.1	0.011	NA	NA	rx80.cx6a
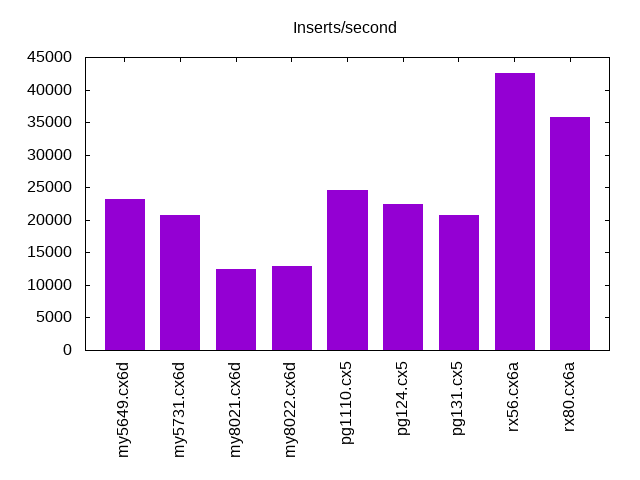
l.i1
l.i1: continue load after secondary indexes created. Graphs for performance per 1-second interval are here.
Average throughput:
Insert response time histogram: each cell has the percentage of responses that take <= the time in the header and max is the max response time in seconds. For the max column values in the top 25% of the range have a red background and in the bottom 25% of the range have a green background. The red background is not used when the min value is within 80% of the max value.
| dbms | 256us | 1ms | 4ms | 16ms | 64ms | 256ms | 1s | 4s | 16s | gt | max |
|---|---|---|---|---|---|---|---|---|---|---|---|
| my5649.cx6d | 93.913 | 5.168 | 0.838 | 0.079 | 0.002 | 0.672 | |||||
| my5731.cx6d | 95.605 | 3.575 | 0.726 | 0.095 | 0.208 | ||||||
| my8021.cx6d | 94.111 | 3.145 | 1.833 | 0.874 | 0.036 | 0.388 | |||||
| my8022.cx6d | 94.596 | 2.633 | 1.880 | 0.882 | 0.009 | 0.331 | |||||
| pg1110.cx5 | 92.692 | 6.792 | 0.513 | 0.003 | 0.146 | ||||||
| pg124.cx5 | 90.691 | 8.412 | 0.886 | 0.011 | 0.200 | ||||||
| pg131.cx5 | 90.115 | 8.117 | 1.748 | 0.021 | 0.239 | ||||||
| rx56.cx6a | 4.490 | 95.427 | 0.079 | 0.003 | 0.001 | 0.068 | |||||
| rx80.cx6a | 0.163 | 99.689 | 0.129 | 0.019 | 0.049 |
Performance metrics for the DBMS listed above. Some are normalized by throughput, others are not. Legend for results is here.
ips	qps	rps	rmbps	wps	wmbps	rpq	rkbpq	wpi	wkbpi	csps	cpups	cspq	cpupq	dbgb1	dbgb2	rss	maxop	p50	p99	tag
23148	0	954	10.2	1933.1	88.8	0.041	0.449	0.084	3.927	11388	27.4	0.492	47	22.3	62.8	10.7	0.672	28319	1747	my5649.cx6d
20790	0	493	7.7	1883.4	81.7	0.024	0.379	0.091	4.025	10901	29.6	0.524	57	22.3	62.8	11.0	0.208	24223	499	my5731.cx6d
12438	0	1004	15.7	2116.5	67.4	0.081	1.291	0.170	5.548	19266	27.6	1.549	89	22.2	62.8	11.2	0.388	18033	200	my8021.cx6d
12970	0	1045	16.3	2060.4	66.5	0.081	1.289	0.159	5.252	16829	28.9	1.297	89	22.2	62.8	11.2	0.331	21737	250	my8022.cx6d
24630	0	2149	20.0	697.5	63.1	0.087	0.830	0.028	2.622	9959	29.5	0.404	48	21.4	36.7	0.0	0.146	30017	1898	pg1110.cx5
22472	0	1992	18.5	638.6	55.6	0.089	0.842	0.028	2.534	9135	28.5	0.407	51	21.4	36.2	0.0	0.200	24472	1198	pg124.cx5
20661	0	1858	17.1	639.2	70.5	0.090	0.847	0.031	3.492	9264	27.8	0.448	54	21.4	36.4	0.0	0.239	22125	1448	pg131.cx5
42553	0	0	0.0	55.9	24.6	0.000	0.000	0.001	0.593	8853	40.9	0.208	38	12.3	18.8	6.8	0.068	42405	37159	rx56.cx6a
35842	0	0	0.0	51.5	20.8	0.000	0.000	0.001	0.594	7752	39.6	0.216	44	12.3	19.0	7.3	0.049	35723	32914	rx80.cx6a
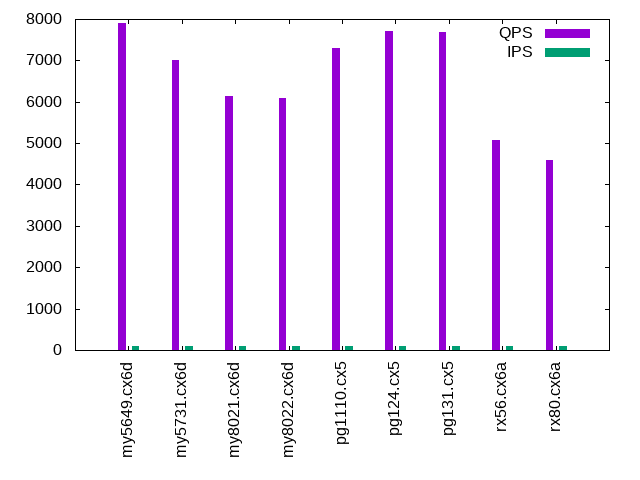
q100.2
q100.2: range queries with 100 insert/s per client, 2nd loop. Graphs for performance per 1-second interval are here.
Average throughput:
Query response time histogram: each cell has the percentage of responses that take <= the time in the header and max is the max response time in seconds. For max values in the top 25% of the range have a red background and in the bottom 25% of the range have a green background. The red background is not used when the min value is within 80% of the max value.
| dbms | 256us | 1ms | 4ms | 16ms | 64ms | 256ms | 1s | 4s | 16s | gt | max |
|---|---|---|---|---|---|---|---|---|---|---|---|
| my5649.cx6d | 98.533 | 1.464 | 0.001 | 0.002 | nonzero | 0.019 | |||||
| my5731.cx6d | 99.836 | 0.163 | nonzero | nonzero | 0.006 | ||||||
| my8021.cx6d | 99.042 | 0.958 | nonzero | nonzero | 0.006 | ||||||
| my8022.cx6d | 99.160 | 0.839 | nonzero | nonzero | 0.007 | ||||||
| pg1110.cx5 | 99.915 | 0.084 | 0.001 | nonzero | 0.004 | ||||||
| pg124.cx5 | 99.966 | 0.033 | 0.001 | nonzero | 0.004 | ||||||
| pg131.cx5 | 99.971 | 0.028 | 0.001 | 0.003 | |||||||
| rx56.cx6a | 98.607 | 1.392 | nonzero | 0.002 | |||||||
| rx80.cx6a | 98.057 | 1.943 | nonzero | nonzero | 0.014 |
Insert response time histogram: each cell has the percentage of responses that take <= the time in the header and max is the max response time in seconds. For max values in the top 25% of the range have a red background and in the bottom 25% of the range have a green background. The red background is not used when the min value is within 80% of the max value.
| dbms | 256us | 1ms | 4ms | 16ms | 64ms | 256ms | 1s | 4s | 16s | gt | max |
|---|---|---|---|---|---|---|---|---|---|---|---|
| my5649.cx6d | 63.639 | 35.667 | 0.694 | 0.018 | |||||||
| my5731.cx6d | 99.167 | 0.750 | 0.083 | 0.021 | |||||||
| my8021.cx6d | 99.056 | 0.944 | 0.010 | ||||||||
| my8022.cx6d | 98.972 | 1.000 | 0.028 | 0.019 | |||||||
| pg1110.cx5 | 99.722 | 0.250 | 0.028 | 0.016 | |||||||
| pg124.cx5 | 99.806 | 0.194 | 0.006 | ||||||||
| pg131.cx5 | 99.833 | 0.167 | 0.013 | ||||||||
| rx56.cx6a | 99.944 | 0.056 | 0.004 | ||||||||
| rx80.cx6a | 99.944 | 0.056 | 0.005 |
Performance metrics for the DBMS listed above. Some are normalized by throughput, others are not. Legend for results is here.
ips	qps	rps	rmbps	wps	wmbps	rpq	rkbpq	wpi	wkbpi	csps	cpups	cspq	cpupq	dbgb1	dbgb2	rss	maxop	p50	p99	tag
100	7898	53	0.8	81.2	2.5	0.007	0.104	0.813	25.269	30557	26.3	3.869	133	22.3	62.8	10.7	0.019	8199	3468	my5649.cx6d
100	7002	50	0.8	54.8	1.7	0.007	0.115	0.549	17.109	27072	26.9	3.866	154	22.3	62.9	11.0	0.006	7003	6904	my5731.cx6d
100	6134	51	0.8	70.1	1.7	0.008	0.133	0.702	17.263	24380	29.1	3.974	190	22.3	62.8	11.2	0.006	6137	5962	my8021.cx6d
100	6087	51	0.8	70.1	1.7	0.008	0.135	0.702	17.294	23901	28.0	3.927	184	22.3	62.8	11.2	0.007	6089	5961	my8022.cx6d
100	7296	0	0.0	263.3	4.4	0.000	0.000	2.639	45.571	28097	27.5	3.851	151	21.8	31.0	0.0	0.004	7304	7160	pg1110.cx5
100	7720	0	0.0	264.1	4.4	0.000	0.000	2.646	45.510	29724	27.8	3.850	144	21.8	31.0	0.0	0.004	7720	7583	pg124.cx5
100	7685	0	0.0	265.1	4.4	0.000	0.000	2.656	45.549	29585	27.7	3.850	144	21.8	30.9	0.0	0.003	7688	7544	pg131.cx5
100	5065	0	0.0	3.1	0.0	0.000	0.000	0.031	0.246	19442	25.9	3.838	205	12.4	18.9	8.2	0.002	5066	5002	rx56.cx6a
100	4582	0	0.0	3.1	0.0	0.000	0.000	0.031	0.252	17742	26.6	3.872	232	12.5	19.1	8.6	0.014	4574	4507	rx80.cx6a
q200.2
q200.2: range queries with 200 insert/s per client, 2nd loop. Graphs for performance per 1-second interval are here.
Average throughput:
Query response time histogram: each cell has the percentage of responses that take <= the time in the header and max is the max response time in seconds. For max values in the top 25% of the range have a red background and in the bottom 25% of the range have a green background. The red background is not used when the min value is within 80% of the max value.
| dbms | 256us | 1ms | 4ms | 16ms | 64ms | 256ms | 1s | 4s | 16s | gt | max |
|---|---|---|---|---|---|---|---|---|---|---|---|
| my5649.cx6d | 97.244 | 2.752 | 0.002 | 0.002 | nonzero | 0.021 | |||||
| my5731.cx6d | 99.837 | 0.163 | nonzero | nonzero | nonzero | 0.016 | |||||
| my8021.cx6d | 99.007 | 0.992 | 0.001 | nonzero | nonzero | 0.018 | |||||
| my8022.cx6d | 99.149 | 0.851 | 0.001 | nonzero | 0.007 | ||||||
| pg1110.cx5 | 99.904 | 0.093 | 0.003 | nonzero | 0.005 | ||||||
| pg124.cx5 | 99.964 | 0.034 | 0.002 | nonzero | 0.004 | ||||||
| pg131.cx5 | 99.959 | 0.038 | 0.002 | nonzero | 0.006 | ||||||
| rx56.cx6a | 98.992 | 1.007 | nonzero | 0.002 | |||||||
| rx80.cx6a | 98.071 | 1.928 | nonzero | 0.004 |
Insert response time histogram: each cell has the percentage of responses that take <= the time in the header and max is the max response time in seconds. For max values in the top 25% of the range have a red background and in the bottom 25% of the range have a green background. The red background is not used when the min value is within 80% of the max value.
| dbms | 256us | 1ms | 4ms | 16ms | 64ms | 256ms | 1s | 4s | 16s | gt | max |
|---|---|---|---|---|---|---|---|---|---|---|---|
| my5649.cx6d | 79.667 | 19.222 | 1.111 | 0.021 | |||||||
| my5731.cx6d | 95.569 | 4.153 | 0.278 | 0.023 | |||||||
| my8021.cx6d | 95.986 | 3.500 | 0.514 | 0.021 | |||||||
| my8022.cx6d | 96.625 | 3.264 | 0.111 | 0.022 | |||||||
| pg1110.cx5 | 93.875 | 4.667 | 1.458 | 0.019 | |||||||
| pg124.cx5 | 96.806 | 2.236 | 0.958 | 0.019 | |||||||
| pg131.cx5 | 96.639 | 2.556 | 0.806 | 0.019 | |||||||
| rx56.cx6a | 99.986 | 0.014 | 0.004 | ||||||||
| rx80.cx6a | 99.917 | 0.056 | 0.028 | 0.019 |
Performance metrics for the DBMS listed above. Some are normalized by throughput, others are not. Legend for results is here.
ips	qps	rps	rmbps	wps	wmbps	rpq	rkbpq	wpi	wkbpi	csps	cpups	cspq	cpupq	dbgb1	dbgb2	rss	maxop	p50	p99	tag
200	7680	56	0.8	83.1	2.6	0.007	0.111	0.416	13.214	29724	26.4	3.870	137	22.4	62.9	10.7	0.021	8199	2989	my5649.cx6d
200	6891	52	0.8	57.0	1.8	0.008	0.121	0.286	9.075	26664	27.2	3.869	158	22.4	62.9	11.0	0.016	6891	6795	my5731.cx6d
200	6103	53	0.8	72.2	1.8	0.009	0.138	0.362	9.118	24293	29.0	3.980	190	22.3	62.9	11.2	0.018	6105	5962	my8021.cx6d
200	6098	53	0.8	73.0	1.8	0.009	0.140	0.366	9.203	23983	28.1	3.933	184	22.3	62.9	11.2	0.007	6105	5980	my8022.cx6d
200	7295	1	0.0	454.2	8.2	0.000	0.001	2.276	41.894	28116	27.7	3.854	152	22.6	25.5	0.0	0.005	7304	7128	pg1110.cx5
200	7736	0	0.0	454.1	8.1	0.000	0.000	2.275	41.626	29796	27.8	3.852	144	22.6	25.5	0.0	0.004	7736	7563	pg124.cx5
200	7659	0	0.0	455.6	8.1	0.000	0.000	2.283	41.703	29508	27.8	3.853	145	22.6	25.5	0.0	0.006	7659	7512	pg131.cx5
200	5009	0	0.0	3.1	0.0	0.000	0.000	0.016	0.215	19232	26.0	3.840	208	12.4	19.0	8.4	0.002	5018	4954	rx56.cx6a
200	4544	0	0.0	3.1	0.0	0.000	0.000	0.016	0.218	17623	26.8	3.878	236	12.5	19.2	8.8	0.004	4539	4475	rx80.cx6a
q400.2
q400.2: range queries with 400 insert/s per client, 2nd loop. Graphs for performance per 1-second interval are here.
Average throughput:

Query response time histogram: each cell has the percentage of responses that take <= the time in the header and max is the max response time in seconds. For max values in the top 25% of the range have a red background and in the bottom 25% of the range have a green background. The red background is not used when the min value is within 80% of the max value.
| dbms | 256us | 1ms | 4ms | 16ms | 64ms | 256ms | 1s | 4s | 16s | gt | max |
|---|---|---|---|---|---|---|---|---|---|---|---|
| my5649.cx6d | 98.167 | 1.829 | 0.003 | 0.002 | nonzero | 0.019 | |||||
| my5731.cx6d | 99.752 | 0.246 | 0.002 | nonzero | nonzero | 0.018 | |||||
| my8021.cx6d | 98.882 | 1.117 | 0.001 | nonzero | nonzero | 0.018 | |||||
| my8022.cx6d | 99.003 | 0.996 | 0.001 | nonzero | nonzero | 0.017 | |||||
| pg1110.cx5 | 99.874 | 0.124 | 0.002 | nonzero | 0.008 | ||||||
| pg124.cx5 | 99.941 | 0.057 | 0.002 | nonzero | 0.005 | ||||||
| pg131.cx5 | 99.951 | 0.048 | 0.002 | nonzero | 0.004 | ||||||
| rx56.cx6a | 98.344 | 1.655 | 0.001 | nonzero | 0.007 | ||||||
| rx80.cx6a | 97.669 | 2.329 | 0.001 | nonzero | 0.008 |
Insert response time histogram: each cell has the percentage of responses that take <= the time in the header and max is the max response time in seconds. For max values in the top 25% of the range have a red background and in the bottom 25% of the range have a green background. The red background is not used when the min value is within 80% of the max value.
| dbms | 256us | 1ms | 4ms | 16ms | 64ms | 256ms | 1s | 4s | 16s | gt | max |
|---|---|---|---|---|---|---|---|---|---|---|---|
| my5649.cx6d | 88.833 | 10.660 | 0.507 | 0.020 | |||||||
| my5731.cx6d | 95.250 | 4.611 | 0.139 | 0.021 | |||||||
| my8021.cx6d | 94.486 | 4.771 | 0.743 | 0.021 | |||||||
| my8022.cx6d | 93.889 | 5.535 | 0.576 | 0.027 | |||||||
| pg1110.cx5 | 79.396 | 19.674 | 0.931 | 0.021 | |||||||
| pg124.cx5 | 73.653 | 25.500 | 0.847 | 0.022 | |||||||
| pg131.cx5 | 73.681 | 25.431 | 0.889 | 0.029 | |||||||
| rx56.cx6a | 1.799 | 98.153 | 0.049 | 0.014 | |||||||
| rx80.cx6a | 99.882 | 0.097 | 0.021 | 0.019 |
Performance metrics for the DBMS listed above. Some are normalized by throughput, others are not. Legend for results is here.
ips	qps	rps	rmbps	wps	wmbps	rpq	rkbpq	wpi	wkbpi	csps	cpups	cspq	cpupq	dbgb1	dbgb2	rss	maxop	p50	p99	tag
399	7809	61	0.9	146.8	4.6	0.008	0.113	0.368	11.824	30461	26.8	3.901	137	22.5	63.0	10.7	0.019	8167	3519	my5649.cx6d
399	6903	53	0.8	103.3	3.0	0.008	0.124	0.259	7.620	26901	27.5	3.897	159	22.5	63.0	11.0	0.018	6905	6824	my5731.cx6d
399	6102	54	0.8	96.5	2.4	0.009	0.142	0.242	6.121	24542	29.5	4.022	193	22.4	63.0	11.2	0.018	6107	5945	my8021.cx6d
399	6068	54	0.8	109.9	2.7	0.009	0.142	0.275	6.938	24060	28.5	3.965	188	22.4	63.0	11.2	0.017	6073	5930	my8022.cx6d
399	7280	56	0.5	747.6	14.0	0.008	0.066	1.872	35.859	28226	27.9	3.877	153	24.2	27.1	0.0	0.008	7288	7112	pg1110.cx5
399	7716	56	0.5	746.0	14.0	0.007	0.063	1.868	35.775	29906	28.4	3.876	147	24.1	27.0	0.0	0.005	7720	7496	pg124.cx5
399	7729	56	0.5	750.6	14.0	0.007	0.062	1.880	35.829	29943	28.2	3.874	146	24.1	27.0	0.0	0.004	7736	7560	pg131.cx5
399	5046	0	0.0	4.5	0.6	0.000	0.000	0.011	1.556	19430	26.4	3.851	209	12.7	19.5	9.2	0.007	5050	4923	rx56.cx6a
399	4575	0	0.0	4.4	0.6	0.000	0.000	0.011	1.559	17781	27.0	3.887	236	12.7	19.7	9.6	0.008	4571	4459	rx80.cx6a
q600.2
q600.2: range queries with 600 insert/s per client, 2nd loop. Graphs for performance per 1-second interval are here.
Average throughput:
Query response time histogram: each cell has the percentage of responses that take <= the time in the header and max is the max response time in seconds. For max values in the top 25% of the range have a red background and in the bottom 25% of the range have a green background. The red background is not used when the min value is within 80% of the max value.
| dbms | 256us | 1ms | 4ms | 16ms | 64ms | 256ms | 1s | 4s | 16s | gt | max |
|---|---|---|---|---|---|---|---|---|---|---|---|
| my5649.cx6d | 98.598 | 1.395 | 0.005 | 0.002 | nonzero | 0.019 | |||||
| my5731.cx6d | 99.675 | 0.322 | 0.003 | nonzero | nonzero | 0.017 | |||||
| my8021.cx6d | 98.823 | 1.175 | 0.002 | nonzero | nonzero | 0.018 | |||||
| my8022.cx6d | 99.004 | 0.995 | 0.002 | nonzero | nonzero | 0.018 | |||||
| pg1110.cx5 | 99.855 | 0.143 | 0.002 | nonzero | 0.005 | ||||||
| pg124.cx5 | 99.923 | 0.075 | 0.002 | nonzero | 0.013 | ||||||
| pg131.cx5 | 99.922 | 0.077 | 0.002 | nonzero | 0.004 | ||||||
| rx56.cx6a | 98.212 | 1.786 | 0.002 | 0.004 | |||||||
| rx80.cx6a | 97.350 | 2.647 | 0.003 | nonzero | 0.012 |
Insert response time histogram: each cell has the percentage of responses that take <= the time in the header and max is the max response time in seconds. For max values in the top 25% of the range have a red background and in the bottom 25% of the range have a green background. The red background is not used when the min value is within 80% of the max value.
| dbms | 256us | 1ms | 4ms | 16ms | 64ms | 256ms | 1s | 4s | 16s | gt | max |
|---|---|---|---|---|---|---|---|---|---|---|---|
| my5649.cx6d | 92.120 | 7.556 | 0.324 | 0.019 | |||||||
| my5731.cx6d | 95.236 | 4.278 | 0.486 | 0.021 | |||||||
| my8021.cx6d | 93.824 | 3.509 | 2.667 | 0.025 | |||||||
| my8022.cx6d | 95.542 | 3.241 | 1.218 | 0.027 | |||||||
| pg1110.cx5 | 64.282 | 35.032 | 0.685 | 0.020 | |||||||
| pg124.cx5 | 59.468 | 39.602 | 0.931 | 0.048 | |||||||
| pg131.cx5 | 59.032 | 40.097 | 0.870 | 0.027 | |||||||
| rx56.cx6a | 1.287 | 98.671 | 0.042 | 0.013 | |||||||
| rx80.cx6a | 99.917 | 0.069 | 0.014 | 0.019 |
Performance metrics for the DBMS listed above. Some are normalized by throughput, others are not. Legend for results is here.
ips	qps	rps	rmbps	wps	wmbps	rpq	rkbpq	wpi	wkbpi	csps	cpups	cspq	cpupq	dbgb1	dbgb2	rss	maxop	p50	p99	tag
599	7917	65	0.9	78.8	2.6	0.008	0.115	0.132	4.485	30665	26.9	3.873	136	22.6	63.1	10.7	0.019	8183	3916	my5649.cx6d
599	6962	54	0.8	76.6	2.4	0.008	0.124	0.128	4.152	27047	27.7	3.885	159	22.6	63.2	11.0	0.017	6968	6857	my5731.cx6d
599	5991	54	0.9	98.6	2.6	0.009	0.146	0.165	4.377	24160	29.4	4.033	196	22.6	63.1	11.2	0.018	5994	5849	my8021.cx6d
599	5997	54	0.9	94.1	2.5	0.009	0.145	0.157	4.244	23749	28.3	3.960	189	22.6	63.1	11.2	0.018	5994	5881	my8022.cx6d
599	7291	163	1.4	954.7	17.5	0.022	0.194	1.594	29.959	28514	28.2	3.911	155	25.9	29.4	0.0	0.005	7293	7144	pg1110.cx5
599	7746	167	1.4	954.3	17.6	0.022	0.187	1.593	30.023	30269	28.5	3.908	147	25.9	29.4	0.0	0.013	7752	7576	pg124.cx5
599	7736	168	1.4	957.1	17.5	0.022	0.188	1.598	29.950	30222	28.4	3.906	147	25.9	29.4	0.0	0.004	7751	7544	pg131.cx5
599	5022	0	0.0	3.9	0.4	0.000	0.000	0.007	0.743	19358	26.4	3.855	210	13.0	20.0	10.1	0.004	5019	4939	rx56.cx6a
599	4514	0	0.0	4.0	0.4	0.000	0.000	0.007	0.746	17575	27.2	3.893	241	13.0	20.2	10.5	0.012	4509	4413	rx80.cx6a
q800.2
q800.2: range queries with 800 insert/s per client, 2nd loop. Graphs for performance per 1-second interval are here.
Average throughput:
Query response time histogram: each cell has the percentage of responses that take <= the time in the header and max is the max response time in seconds. For max values in the top 25% of the range have a red background and in the bottom 25% of the range have a green background. The red background is not used when the min value is within 80% of the max value.
| dbms | 256us | 1ms | 4ms | 16ms | 64ms | 256ms | 1s | 4s | 16s | gt | max |
|---|---|---|---|---|---|---|---|---|---|---|---|
| my5649.cx6d | 98.511 | 1.480 | 0.006 | 0.002 | nonzero | 0.017 | |||||
| my5731.cx6d | 99.589 | 0.407 | 0.004 | nonzero | nonzero | 0.020 | |||||
| my8021.cx6d | 98.693 | 1.304 | 0.002 | nonzero | nonzero | 0.021 | |||||
| my8022.cx6d | 98.906 | 1.091 | 0.002 | nonzero | nonzero | 0.017 | |||||
| pg1110.cx5 | 99.831 | 0.167 | 0.002 | nonzero | 0.004 | ||||||
| pg124.cx5 | 99.901 | 0.097 | 0.002 | nonzero | 0.004 | ||||||
| pg131.cx5 | 99.897 | 0.101 | 0.002 | nonzero | 0.006 | ||||||
| rx56.cx6a | 98.063 | 1.934 | 0.003 | nonzero | 0.006 | ||||||
| rx80.cx6a | 97.059 | 2.936 | 0.004 | nonzero | 0.007 |
Insert response time histogram: each cell has the percentage of responses that take <= the time in the header and max is the max response time in seconds. For max values in the top 25% of the range have a red background and in the bottom 25% of the range have a green background. The red background is not used when the min value is within 80% of the max value.
| dbms | 256us | 1ms | 4ms | 16ms | 64ms | 256ms | 1s | 4s | 16s | gt | max |
|---|---|---|---|---|---|---|---|---|---|---|---|
| my5649.cx6d | 94.604 | 5.125 | 0.271 | 0.021 | |||||||
| my5731.cx6d | 95.521 | 3.615 | 0.865 | 0.024 | |||||||
| my8021.cx6d | 94.472 | 4.590 | 0.938 | 0.023 | |||||||
| my8022.cx6d | 94.590 | 4.181 | 1.229 | 0.025 | |||||||
| pg1110.cx5 | 74.681 | 23.899 | 1.420 | 0.021 | |||||||
| pg124.cx5 | 72.719 | 25.740 | 1.542 | 0.042 | |||||||
| pg131.cx5 | 72.205 | 26.260 | 1.535 | 0.027 | |||||||
| rx56.cx6a | 0.781 | 99.156 | 0.062 | 0.014 | |||||||
| rx80.cx6a | 99.910 | 0.062 | 0.028 | 0.019 |
Performance metrics for the DBMS listed above. Some are normalized by throughput, others are not. Legend for results is here.
ips	qps	rps	rmbps	wps	wmbps	rpq	rkbpq	wpi	wkbpi	csps	cpups	cspq	cpupq	dbgb1	dbgb2	rss	maxop	p50	p99	tag
799	7775	69	0.9	76.7	2.6	0.009	0.120	0.096	3.390	30318	28.0	3.899	144	22.8	63.3	10.7	0.017	8103	3580	my5649.cx6d
799	6902	54	0.9	82.0	2.7	0.008	0.126	0.103	3.417	26872	27.9	3.894	162	22.8	63.3	11.0	0.020	6904	6792	my5731.cx6d
799	6047	55	0.9	118.3	3.0	0.009	0.146	0.148	3.875	24689	30.3	4.083	200	22.7	63.3	11.2	0.021	6057	5881	my8021.cx6d
799	6053	55	0.9	104.0	2.8	0.009	0.146	0.130	3.617	24149	28.9	3.989	191	22.7	63.3	11.2	0.017	6057	5914	my8022.cx6d
799	7282	210	1.8	1033.3	19.9	0.029	0.253	1.294	25.577	28618	28.5	3.930	157	26.6	30.3	0.0	0.004	7288	7144	pg1110.cx5
799	7744	209	1.8	1030.5	19.8	0.027	0.237	1.290	25.429	30386	28.6	3.924	148	26.6	30.3	0.0	0.004	7752	7560	pg124.cx5
799	7712	212	1.8	1031.1	19.8	0.027	0.242	1.291	25.407	30267	28.6	3.925	148	26.6	30.3	0.0	0.006	7720	7528	pg131.cx5
799	5016	0	0.0	4.2	0.6	0.000	0.000	0.005	0.752	19379	26.6	3.863	212	13.2	20.7	11.0	0.006	5019	4859	rx56.cx6a
799	4529	0	0.0	4.3	0.6	0.000	0.000	0.005	0.755	17666	27.3	3.901	241	13.3	20.8	11.4	0.007	4525	4379	rx80.cx6a
q1000.2
q1000.2: range queries with 1000 insert/s per client, 2nd loop. Graphs for performance per 1-second interval are here.
Average throughput:
Query response time histogram: each cell has the percentage of responses that take <= the time in the header and max is the max response time in seconds. For max values in the top 25% of the range have a red background and in the bottom 25% of the range have a green background. The red background is not used when the min value is within 80% of the max value.
| dbms | 256us | 1ms | 4ms | 16ms | 64ms | 256ms | 1s | 4s | 16s | gt | max |
|---|---|---|---|---|---|---|---|---|---|---|---|
| my5649.cx6d | 99.117 | 0.874 | 0.007 | 0.001 | nonzero | 0.017 | |||||
| my5731.cx6d | 99.528 | 0.466 | 0.005 | nonzero | nonzero | 0.018 | |||||
| my8021.cx6d | 98.617 | 1.380 | 0.003 | nonzero | 0.007 | ||||||
| my8022.cx6d | 98.816 | 1.181 | 0.003 | nonzero | 0.007 | ||||||
| pg1110.cx5 | 99.775 | 0.223 | 0.002 | nonzero | 0.004 | ||||||
| pg124.cx5 | 99.882 | 0.116 | 0.002 | nonzero | 0.005 | ||||||
| pg131.cx5 | 99.871 | 0.127 | 0.002 | nonzero | 0.005 | ||||||
| rx56.cx6a | 97.863 | 2.134 | 0.003 | nonzero | nonzero | 0.019 | |||||
| rx80.cx6a | 96.785 | 3.207 | 0.008 | nonzero | 0.007 |
Insert response time histogram: each cell has the percentage of responses that take <= the time in the header and max is the max response time in seconds. For max values in the top 25% of the range have a red background and in the bottom 25% of the range have a green background. The red background is not used when the min value is within 80% of the max value.
| dbms | 256us | 1ms | 4ms | 16ms | 64ms | 256ms | 1s | 4s | 16s | gt | max |
|---|---|---|---|---|---|---|---|---|---|---|---|
| my5649.cx6d | 95.119 | 4.561 | 0.319 | 0.021 | |||||||
| my5731.cx6d | 96.011 | 3.228 | 0.761 | 0.021 | |||||||
| my8021.cx6d | 96.431 | 3.569 | 0.015 | ||||||||
| my8022.cx6d | 95.150 | 4.844 | 0.006 | 0.017 | |||||||
| pg1110.cx5 | 77.886 | 21.717 | 0.397 | 0.040 | |||||||
| pg124.cx5 | 76.967 | 22.469 | 0.564 | 0.043 | |||||||
| pg131.cx5 | 76.256 | 23.147 | 0.597 | 0.050 | |||||||
| rx56.cx6a | 1.181 | 98.753 | 0.067 | 0.014 | |||||||
| rx80.cx6a | 99.875 | 0.100 | 0.025 | 0.019 |
Performance metrics for the DBMS listed above. Some are normalized by throughput, others are not. Legend for results is here.
ips	qps	rps	rmbps	wps	wmbps	rpq	rkbpq	wpi	wkbpi	csps	cpups	cspq	cpupq	dbgb1	dbgb2	rss	maxop	p50	p99	tag
998	7967	73	0.9	95.4	3.3	0.009	0.120	0.096	3.399	30999	27.4	3.891	138	23.1	63.6	10.7	0.017	8135	4107	my5649.cx6d
998	6818	56	0.9	123.4	3.9	0.008	0.130	0.124	3.975	26711	28.3	3.918	166	23.1	63.6	11.0	0.018	6824	6713	my5731.cx6d
998	5998	56	0.9	160.5	4.1	0.009	0.149	0.161	4.251	24726	30.4	4.123	203	23.0	63.5	11.2	0.007	6009	5855	my8021.cx6d
998	6027	56	0.9	149.3	4.0	0.009	0.148	0.150	4.063	24266	29.2	4.026	194	23.0	63.5	11.2	0.007	6028	5913	my8022.cx6d
999	7283	233	2.0	1136.8	23.7	0.032	0.282	1.137	24.275	28681	28.6	3.938	157	27.0	31.5	0.0	0.004	7288	7128	pg1110.cx5
999	7720	247	2.1	1127.7	23.5	0.032	0.282	1.129	24.069	30403	28.8	3.938	149	27.0	31.4	0.0	0.005	7722	7544	pg124.cx5
998	7675	235	2.0	1131.7	23.4	0.031	0.271	1.134	24.053	30221	28.8	3.938	150	27.0	31.4	0.0	0.005	7688	7512	pg131.cx5
998	4975	2	0.1	7.1	1.7	0.000	0.029	0.007	1.767	19315	27.1	3.882	218	13.8	21.7	11.5	0.019	4986	4747	rx56.cx6a
998	4496	2	0.2	7.2	1.7	0.001	0.041	0.007	1.771	17628	27.9	3.921	248	13.8	21.8	11.9	0.007	4491	4349	rx80.cx6a
l.i0
l.i0: load without secondary indexes
Performance metrics for all DBMS, not just the ones listed above. Some are normalized by throughput, others are not. Legend for results is here.
ips	qps	rps	rmbps	wps	wmbps	rpq	rkbpq	wpi	wkbpi	csps	cpups	cspq	cpupq	dbgb1	dbgb2	rss	maxop	p50	p99	tag
140449	0	1230	4.8	221.4	37.2	0.009	0.035	0.002	0.271	15746	47.2	0.112	13	6.6	47.1	7.2	0.344	140850	96693	my5649.cx6d
126904	0	0	0.0	267.3	35.2	0.000	0.000	0.002	0.284	13497	46.3	0.106	15	6.6	47.1	7.5	0.110	127963	112378	my5731.cx6d
84890	0	0	0.0	211.4	24.7	0.000	0.000	0.002	0.298	18911	40.6	0.223	19	6.6	47.1	7.7	0.129	85340	74834	my8021.cx6d
86580	0	0	0.0	215.3	25.2	0.000	0.000	0.002	0.298	15181	41.2	0.175	19	6.6	47.1	7.7	0.117	86964	77116	my8022.cx6d
-
102354	0	0	0.0	166.6	43.8	0.000	0.000	0.002	0.438	12365	41.7	0.121	16	9.6	17.4	0.7	0.006	102430	99492	pg1110.cx5
102459	0	0	0.0	166.0	44.0	0.000	0.000	0.002	0.440	12329	41.5	0.120	16	9.6	17.5	0.0	0.057	102620	97193	pg124.cx5
106724	0	0	0.0	102.2	45.3	0.000	0.000	0.001	0.434	12826	43.2	0.120	16	9.6	18.0	0.0	0.041	107019	102004	pg131.cx5
-
108460	0	0	0.0	38.1	16.2	0.000	0.000	0.000	0.153	11003	46.3	0.101	17	4.8	10.0	1.5	0.156	110279	92499	rx56.cx6a
84459	0	0	0.0	36.2	12.6	0.000	0.000	0.000	0.153	8833	42.5	0.105	20	4.8	10.2	1.9	0.178	85809	72053	rx80.cx6a
l.x
l.x: create secondary indexes
Performance metrics for all DBMS, not just the ones listed above. Some are normalized by throughput, others are not. Legend for results is here.
ips	qps	rps	rmbps	wps	wmbps	rpq	rkbpq	wpi	wkbpi	csps	cpups	cspq	cpupq	dbgb1	dbgb2	rss	maxop	p50	p99	tag
91166	0	181	58.7	1108.3	104.5	0.002	0.660	0.012	1.174	3681	20.4	0.040	9	13.6	54.1	10.7	0.006	NA	NA	my5649.cx6d
161192	0	257	105.4	1936.8	165.4	0.002	0.669	0.012	1.051	11008	25.1	0.068	6	14.7	55.3	10.9	0.016	NA	NA	my5731.cx6d
110730	0	152	72.1	1210.8	106.0	0.001	0.666	0.011	0.980	7150	24.3	0.065	9	14.7	55.2	10.3	0.017	NA	NA	my8021.cx6d
108686	0	132	71.7	1195.3	104.1	0.001	0.676	0.011	0.981	6854	24.1	0.063	9	14.7	55.2	10.3	0.022	NA	NA	my8022.cx6d
-
278056	0	126	15.4	631.7	126.9	0.000	0.057	0.002	0.468	1643	24.0	0.006	3	18.4	32.8	0.0	0.003	NA	NA	pg1110.cx5
272752	0	116	14.2	635.9	122.2	0.000	0.053	0.002	0.459	1492	23.7	0.005	3	18.4	32.6	0.0	0.002	NA	NA	pg124.cx5
287644	0	82	9.9	190.7	81.9	0.000	0.035	0.001	0.292	593	23.7	0.002	3	18.4	27.5	0.0	0.004	NA	NA	pg131.cx5
-
112220	0	32	8.7	46.4	19.9	0.000	0.079	0.000	0.181	789	24.5	0.007	9	11.1	16.3	6.7	0.010	NA	NA	rx56.cx6a
107173	0	31	8.3	47.2	18.9	0.000	0.080	0.000	0.181	887	24.6	0.008	9	11.1	16.5	7.1	0.011	NA	NA	rx80.cx6a
l.i1
l.i1: continue load after secondary indexes created
Performance metrics for all DBMS, not just the ones listed above. Some are normalized by throughput, others are not. Legend for results is here.
ips	qps	rps	rmbps	wps	wmbps	rpq	rkbpq	wpi	wkbpi	csps	cpups	cspq	cpupq	dbgb1	dbgb2	rss	maxop	p50	p99	tag
23148	0	954	10.2	1933.1	88.8	0.041	0.449	0.084	3.927	11388	27.4	0.492	47	22.3	62.8	10.7	0.672	28319	1747	my5649.cx6d
20790	0	493	7.7	1883.4	81.7	0.024	0.379	0.091	4.025	10901	29.6	0.524	57	22.3	62.8	11.0	0.208	24223	499	my5731.cx6d
12438	0	1004	15.7	2116.5	67.4	0.081	1.291	0.170	5.548	19266	27.6	1.549	89	22.2	62.8	11.2	0.388	18033	200	my8021.cx6d
12970	0	1045	16.3	2060.4	66.5	0.081	1.289	0.159	5.252	16829	28.9	1.297	89	22.2	62.8	11.2	0.331	21737	250	my8022.cx6d
-
24630	0	2149	20.0	697.5	63.1	0.087	0.830	0.028	2.622	9959	29.5	0.404	48	21.4	36.7	0.0	0.146	30017	1898	pg1110.cx5
22472	0	1992	18.5	638.6	55.6	0.089	0.842	0.028	2.534	9135	28.5	0.407	51	21.4	36.2	0.0	0.200	24472	1198	pg124.cx5
20661	0	1858	17.1	639.2	70.5	0.090	0.847	0.031	3.492	9264	27.8	0.448	54	21.4	36.4	0.0	0.239	22125	1448	pg131.cx5
-
42553	0	0	0.0	55.9	24.6	0.000	0.000	0.001	0.593	8853	40.9	0.208	38	12.3	18.8	6.8	0.068	42405	37159	rx56.cx6a
35842	0	0	0.0	51.5	20.8	0.000	0.000	0.001	0.594	7752	39.6	0.216	44	12.3	19.0	7.3	0.049	35723	32914	rx80.cx6a
q100.2
q100.2: range queries with 100 insert/s per client, 2nd loop
Performance metrics for all DBMS, not just the ones listed above. Some are normalized by throughput, others are not. Legend for results is here.
ips	qps	rps	rmbps	wps	wmbps	rpq	rkbpq	wpi	wkbpi	csps	cpups	cspq	cpupq	dbgb1	dbgb2	rss	maxop	p50	p99	tag
100	7898	53	0.8	81.2	2.5	0.007	0.104	0.813	25.269	30557	26.3	3.869	133	22.3	62.8	10.7	0.019	8199	3468	my5649.cx6d
100	7002	50	0.8	54.8	1.7	0.007	0.115	0.549	17.109	27072	26.9	3.866	154	22.3	62.9	11.0	0.006	7003	6904	my5731.cx6d
100	6134	51	0.8	70.1	1.7	0.008	0.133	0.702	17.263	24380	29.1	3.974	190	22.3	62.8	11.2	0.006	6137	5962	my8021.cx6d
100	6087	51	0.8	70.1	1.7	0.008	0.135	0.702	17.294	23901	28.0	3.927	184	22.3	62.8	11.2	0.007	6089	5961	my8022.cx6d
-
100	7296	0	0.0	263.3	4.4	0.000	0.000	2.639	45.571	28097	27.5	3.851	151	21.8	31.0	0.0	0.004	7304	7160	pg1110.cx5
100	7720	0	0.0	264.1	4.4	0.000	0.000	2.646	45.510	29724	27.8	3.850	144	21.8	31.0	0.0	0.004	7720	7583	pg124.cx5
100	7685	0	0.0	265.1	4.4	0.000	0.000	2.656	45.549	29585	27.7	3.850	144	21.8	30.9	0.0	0.003	7688	7544	pg131.cx5
-
100	5065	0	0.0	3.1	0.0	0.000	0.000	0.031	0.246	19442	25.9	3.838	205	12.4	18.9	8.2	0.002	5066	5002	rx56.cx6a
100	4582	0	0.0	3.1	0.0	0.000	0.000	0.031	0.252	17742	26.6	3.872	232	12.5	19.1	8.6	0.014	4574	4507	rx80.cx6a
q200.2
q200.2: range queries with 200 insert/s per client, 2nd loop
Performance metrics for all DBMS, not just the ones listed above. Some are normalized by throughput, others are not. Legend for results is here.
ips	qps	rps	rmbps	wps	wmbps	rpq	rkbpq	wpi	wkbpi	csps	cpups	cspq	cpupq	dbgb1	dbgb2	rss	maxop	p50	p99	tag
200	7680	56	0.8	83.1	2.6	0.007	0.111	0.416	13.214	29724	26.4	3.870	137	22.4	62.9	10.7	0.021	8199	2989	my5649.cx6d
200	6891	52	0.8	57.0	1.8	0.008	0.121	0.286	9.075	26664	27.2	3.869	158	22.4	62.9	11.0	0.016	6891	6795	my5731.cx6d
200	6103	53	0.8	72.2	1.8	0.009	0.138	0.362	9.118	24293	29.0	3.980	190	22.3	62.9	11.2	0.018	6105	5962	my8021.cx6d
200	6098	53	0.8	73.0	1.8	0.009	0.140	0.366	9.203	23983	28.1	3.933	184	22.3	62.9	11.2	0.007	6105	5980	my8022.cx6d
-
200	7295	1	0.0	454.2	8.2	0.000	0.001	2.276	41.894	28116	27.7	3.854	152	22.6	25.5	0.0	0.005	7304	7128	pg1110.cx5
200	7736	0	0.0	454.1	8.1	0.000	0.000	2.275	41.626	29796	27.8	3.852	144	22.6	25.5	0.0	0.004	7736	7563	pg124.cx5
200	7659	0	0.0	455.6	8.1	0.000	0.000	2.283	41.703	29508	27.8	3.853	145	22.6	25.5	0.0	0.006	7659	7512	pg131.cx5
-
200	5009	0	0.0	3.1	0.0	0.000	0.000	0.016	0.215	19232	26.0	3.840	208	12.4	19.0	8.4	0.002	5018	4954	rx56.cx6a
200	4544	0	0.0	3.1	0.0	0.000	0.000	0.016	0.218	17623	26.8	3.878	236	12.5	19.2	8.8	0.004	4539	4475	rx80.cx6a
q400.2
q400.2: range queries with 400 insert/s per client, 2nd loop
Performance metrics for all DBMS, not just the ones listed above. Some are normalized by throughput, others are not. Legend for results is here.
ips	qps	rps	rmbps	wps	wmbps	rpq	rkbpq	wpi	wkbpi	csps	cpups	cspq	cpupq	dbgb1	dbgb2	rss	maxop	p50	p99	tag
399	7809	61	0.9	146.8	4.6	0.008	0.113	0.368	11.824	30461	26.8	3.901	137	22.5	63.0	10.7	0.019	8167	3519	my5649.cx6d
399	6903	53	0.8	103.3	3.0	0.008	0.124	0.259	7.620	26901	27.5	3.897	159	22.5	63.0	11.0	0.018	6905	6824	my5731.cx6d
399	6102	54	0.8	96.5	2.4	0.009	0.142	0.242	6.121	24542	29.5	4.022	193	22.4	63.0	11.2	0.018	6107	5945	my8021.cx6d
399	6068	54	0.8	109.9	2.7	0.009	0.142	0.275	6.938	24060	28.5	3.965	188	22.4	63.0	11.2	0.017	6073	5930	my8022.cx6d
-
399	7280	56	0.5	747.6	14.0	0.008	0.066	1.872	35.859	28226	27.9	3.877	153	24.2	27.1	0.0	0.008	7288	7112	pg1110.cx5
399	7716	56	0.5	746.0	14.0	0.007	0.063	1.868	35.775	29906	28.4	3.876	147	24.1	27.0	0.0	0.005	7720	7496	pg124.cx5
399	7729	56	0.5	750.6	14.0	0.007	0.062	1.880	35.829	29943	28.2	3.874	146	24.1	27.0	0.0	0.004	7736	7560	pg131.cx5
-
399	5046	0	0.0	4.5	0.6	0.000	0.000	0.011	1.556	19430	26.4	3.851	209	12.7	19.5	9.2	0.007	5050	4923	rx56.cx6a
399	4575	0	0.0	4.4	0.6	0.000	0.000	0.011	1.559	17781	27.0	3.887	236	12.7	19.7	9.6	0.008	4571	4459	rx80.cx6a
q600.2
q600.2: range queries with 600 insert/s per client, 2nd loop
Performance metrics for all DBMS, not just the ones listed above. Some are normalized by throughput, others are not. Legend for results is here.
ips	qps	rps	rmbps	wps	wmbps	rpq	rkbpq	wpi	wkbpi	csps	cpups	cspq	cpupq	dbgb1	dbgb2	rss	maxop	p50	p99	tag
599	7917	65	0.9	78.8	2.6	0.008	0.115	0.132	4.485	30665	26.9	3.873	136	22.6	63.1	10.7	0.019	8183	3916	my5649.cx6d
599	6962	54	0.8	76.6	2.4	0.008	0.124	0.128	4.152	27047	27.7	3.885	159	22.6	63.2	11.0	0.017	6968	6857	my5731.cx6d
599	5991	54	0.9	98.6	2.6	0.009	0.146	0.165	4.377	24160	29.4	4.033	196	22.6	63.1	11.2	0.018	5994	5849	my8021.cx6d
599	5997	54	0.9	94.1	2.5	0.009	0.145	0.157	4.244	23749	28.3	3.960	189	22.6	63.1	11.2	0.018	5994	5881	my8022.cx6d
-
599	7291	163	1.4	954.7	17.5	0.022	0.194	1.594	29.959	28514	28.2	3.911	155	25.9	29.4	0.0	0.005	7293	7144	pg1110.cx5
599	7746	167	1.4	954.3	17.6	0.022	0.187	1.593	30.023	30269	28.5	3.908	147	25.9	29.4	0.0	0.013	7752	7576	pg124.cx5
599	7736	168	1.4	957.1	17.5	0.022	0.188	1.598	29.950	30222	28.4	3.906	147	25.9	29.4	0.0	0.004	7751	7544	pg131.cx5
-
599	5022	0	0.0	3.9	0.4	0.000	0.000	0.007	0.743	19358	26.4	3.855	210	13.0	20.0	10.1	0.004	5019	4939	rx56.cx6a
599	4514	0	0.0	4.0	0.4	0.000	0.000	0.007	0.746	17575	27.2	3.893	241	13.0	20.2	10.5	0.012	4509	4413	rx80.cx6a
q800.2
q800.2: range queries with 800 insert/s per client, 2nd loop
Performance metrics for all DBMS, not just the ones listed above. Some are normalized by throughput, others are not. Legend for results is here.
ips	qps	rps	rmbps	wps	wmbps	rpq	rkbpq	wpi	wkbpi	csps	cpups	cspq	cpupq	dbgb1	dbgb2	rss	maxop	p50	p99	tag
799	7775	69	0.9	76.7	2.6	0.009	0.120	0.096	3.390	30318	28.0	3.899	144	22.8	63.3	10.7	0.017	8103	3580	my5649.cx6d
799	6902	54	0.9	82.0	2.7	0.008	0.126	0.103	3.417	26872	27.9	3.894	162	22.8	63.3	11.0	0.020	6904	6792	my5731.cx6d
799	6047	55	0.9	118.3	3.0	0.009	0.146	0.148	3.875	24689	30.3	4.083	200	22.7	63.3	11.2	0.021	6057	5881	my8021.cx6d
799	6053	55	0.9	104.0	2.8	0.009	0.146	0.130	3.617	24149	28.9	3.989	191	22.7	63.3	11.2	0.017	6057	5914	my8022.cx6d
-
799	7282	210	1.8	1033.3	19.9	0.029	0.253	1.294	25.577	28618	28.5	3.930	157	26.6	30.3	0.0	0.004	7288	7144	pg1110.cx5
799	7744	209	1.8	1030.5	19.8	0.027	0.237	1.290	25.429	30386	28.6	3.924	148	26.6	30.3	0.0	0.004	7752	7560	pg124.cx5
799	7712	212	1.8	1031.1	19.8	0.027	0.242	1.291	25.407	30267	28.6	3.925	148	26.6	30.3	0.0	0.006	7720	7528	pg131.cx5
-
799	5016	0	0.0	4.2	0.6	0.000	0.000	0.005	0.752	19379	26.6	3.863	212	13.2	20.7	11.0	0.006	5019	4859	rx56.cx6a
799	4529	0	0.0	4.3	0.6	0.000	0.000	0.005	0.755	17666	27.3	3.901	241	13.3	20.8	11.4	0.007	4525	4379	rx80.cx6a
q1000.2
q1000.2: range queries with 1000 insert/s per client, 2nd loop
Performance metrics for all DBMS, not just the ones listed above. Some are normalized by throughput, others are not. Legend for results is here.
ips	qps	rps	rmbps	wps	wmbps	rpq	rkbpq	wpi	wkbpi	csps	cpups	cspq	cpupq	dbgb1	dbgb2	rss	maxop	p50	p99	tag
998	7967	73	0.9	95.4	3.3	0.009	0.120	0.096	3.399	30999	27.4	3.891	138	23.1	63.6	10.7	0.017	8135	4107	my5649.cx6d
998	6818	56	0.9	123.4	3.9	0.008	0.130	0.124	3.975	26711	28.3	3.918	166	23.1	63.6	11.0	0.018	6824	6713	my5731.cx6d
998	5998	56	0.9	160.5	4.1	0.009	0.149	0.161	4.251	24726	30.4	4.123	203	23.0	63.5	11.2	0.007	6009	5855	my8021.cx6d
998	6027	56	0.9	149.3	4.0	0.009	0.148	0.150	4.063	24266	29.2	4.026	194	23.0	63.5	11.2	0.007	6028	5913	my8022.cx6d
-
999	7283	233	2.0	1136.8	23.7	0.032	0.282	1.137	24.275	28681	28.6	3.938	157	27.0	31.5	0.0	0.004	7288	7128	pg1110.cx5
999	7720	247	2.1	1127.7	23.5	0.032	0.282	1.129	24.069	30403	28.8	3.938	149	27.0	31.4	0.0	0.005	7722	7544	pg124.cx5
998	7675	235	2.0	1131.7	23.4	0.031	0.271	1.134	24.053	30221	28.8	3.938	150	27.0	31.4	0.0	0.005	7688	7512	pg131.cx5
-
998	4975	2	0.1	7.1	1.7	0.000	0.029	0.007	1.767	19315	27.1	3.882	218	13.8	21.7	11.5	0.019	4986	4747	rx56.cx6a
998	4496	2	0.2	7.2	1.7	0.001	0.041	0.007	1.771	17628	27.9	3.921	248	13.8	21.8	11.9	0.007	4491	4349	rx80.cx6a
l.i0
- l.i0: load without secondary indexes
- Legend for results is here.
- Each entry lists the percentage of responses that fit in that bucket (slower than max time for previous bucket, faster than min time for next bucket).
Insert response time histogram
256us	1ms	4ms	16ms	64ms	256ms	1s	4s	16s	gt	max	tag
0.000	98.374	1.449	0.136	0.037	0.002	0.002	0.000	0.000	0.000	0.344	my5649.cx6d
0.000	98.619	1.132	0.244	0.001	0.003	0.000	0.000	0.000	0.000	0.110	my5731.cx6d
0.000	0.000	99.594	0.371	0.033	0.003	0.000	0.000	0.000	0.000	0.129	my8021.cx6d
0.000	0.339	99.405	0.136	0.117	0.003	0.000	0.000	0.000	0.000	0.117	my8022.cx6d
-
0.000	92.186	7.813	0.001	0.000	0.000	0.000	0.000	0.000	0.000	0.006	pg1110.cx5
0.000	91.988	8.011	0.001	nonzero	0.000	0.000	0.000	0.000	0.000	0.057	pg124.cx5
0.000	97.670	2.328	0.001	0.001	0.000	0.000	0.000	0.000	0.000	0.041	pg131.cx5
-
0.000	96.182	3.766	0.048	nonzero	0.004	0.000	0.000	0.000	0.000	0.156	rx56.cx6a
0.000	nonzero	99.832	0.150	0.015	0.002	0.000	0.000	0.000	0.000	0.178	rx80.cx6a
l.x
- l.x: create secondary indexes
- Legend for results is here.
- Each entry lists the percentage of responses that fit in that bucket (slower than max time for previous bucket, faster than min time for next bucket).
TODO - determine whether there is data for create index response time
l.i1
- l.i1: continue load after secondary indexes created
- Legend for results is here.
- Each entry lists the percentage of responses that fit in that bucket (slower than max time for previous bucket, faster than min time for next bucket).
Insert response time histogram
256us	1ms	4ms	16ms	64ms	256ms	1s	4s	16s	gt	max	tag
0.000	0.000	93.913	5.168	0.838	0.079	0.002	0.000	0.000	0.000	0.672	my5649.cx6d
0.000	0.000	95.605	3.575	0.726	0.095	0.000	0.000	0.000	0.000	0.208	my5731.cx6d
0.000	0.000	94.111	3.145	1.833	0.874	0.036	0.000	0.000	0.000	0.388	my8021.cx6d
0.000	0.000	94.596	2.633	1.880	0.882	0.009	0.000	0.000	0.000	0.331	my8022.cx6d
-
0.000	0.000	92.692	6.792	0.513	0.003	0.000	0.000	0.000	0.000	0.146	pg1110.cx5
0.000	0.000	90.691	8.412	0.886	0.011	0.000	0.000	0.000	0.000	0.200	pg124.cx5
0.000	0.000	90.115	8.117	1.748	0.021	0.000	0.000	0.000	0.000	0.239	pg131.cx5
-
0.000	4.490	95.427	0.079	0.003	0.001	0.000	0.000	0.000	0.000	0.068	rx56.cx6a
0.000	0.163	99.689	0.129	0.019	0.000	0.000	0.000	0.000	0.000	0.049	rx80.cx6a
q100.2
- q100.2: range queries with 100 insert/s per client, 2nd loop
- Legend for results is here.
- Each entry lists the percentage of responses that fit in that bucket (slower than max time for previous bucket, faster than min time for next bucket).
Query response time histogram
256us	1ms	4ms	16ms	64ms	256ms	1s	4s	16s	gt	max	tag
98.533	1.464	0.001	0.002	nonzero	0.000	0.000	0.000	0.000	0.000	0.019	my5649.cx6d
99.836	0.163	nonzero	nonzero	0.000	0.000	0.000	0.000	0.000	0.000	0.006	my5731.cx6d
99.042	0.958	nonzero	nonzero	0.000	0.000	0.000	0.000	0.000	0.000	0.006	my8021.cx6d
99.160	0.839	nonzero	nonzero	0.000	0.000	0.000	0.000	0.000	0.000	0.007	my8022.cx6d
-
99.915	0.084	0.001	nonzero	0.000	0.000	0.000	0.000	0.000	0.000	0.004	pg1110.cx5
99.966	0.033	0.001	nonzero	0.000	0.000	0.000	0.000	0.000	0.000	0.004	pg124.cx5
99.971	0.028	0.001	0.000	0.000	0.000	0.000	0.000	0.000	0.000	0.003	pg131.cx5
-
98.607	1.392	nonzero	0.000	0.000	0.000	0.000	0.000	0.000	0.000	0.002	rx56.cx6a
98.057	1.943	nonzero	nonzero	0.000	0.000	0.000	0.000	0.000	0.000	0.014	rx80.cx6a
Insert response time histogram
256us	1ms	4ms	16ms	64ms	256ms	1s	4s	16s	gt	max	tag
0.000	0.000	63.639	35.667	0.694	0.000	0.000	0.000	0.000	0.000	0.018	my5649.cx6d
0.000	0.000	99.167	0.750	0.083	0.000	0.000	0.000	0.000	0.000	0.021	my5731.cx6d
0.000	0.000	99.056	0.944	0.000	0.000	0.000	0.000	0.000	0.000	0.010	my8021.cx6d
0.000	0.000	98.972	1.000	0.028	0.000	0.000	0.000	0.000	0.000	0.019	my8022.cx6d
-
0.000	0.000	99.722	0.250	0.028	0.000	0.000	0.000	0.000	0.000	0.016	pg1110.cx5
0.000	0.000	99.806	0.194	0.000	0.000	0.000	0.000	0.000	0.000	0.006	pg124.cx5
0.000	0.000	99.833	0.167	0.000	0.000	0.000	0.000	0.000	0.000	0.013	pg131.cx5
-
0.000	0.000	99.944	0.056	0.000	0.000	0.000	0.000	0.000	0.000	0.004	rx56.cx6a
0.000	0.000	99.944	0.056	0.000	0.000	0.000	0.000	0.000	0.000	0.005	rx80.cx6a
q200.2
- q200.2: range queries with 200 insert/s per client, 2nd loop
- Legend for results is here.
- Each entry lists the percentage of responses that fit in that bucket (slower than max time for previous bucket, faster than min time for next bucket).
Query response time histogram
256us	1ms	4ms	16ms	64ms	256ms	1s	4s	16s	gt	max	tag
97.244	2.752	0.002	0.002	nonzero	0.000	0.000	0.000	0.000	0.000	0.021	my5649.cx6d
99.837	0.163	nonzero	nonzero	nonzero	0.000	0.000	0.000	0.000	0.000	0.016	my5731.cx6d
99.007	0.992	0.001	nonzero	nonzero	0.000	0.000	0.000	0.000	0.000	0.018	my8021.cx6d
99.149	0.851	0.001	nonzero	0.000	0.000	0.000	0.000	0.000	0.000	0.007	my8022.cx6d
-
99.904	0.093	0.003	nonzero	0.000	0.000	0.000	0.000	0.000	0.000	0.005	pg1110.cx5
99.964	0.034	0.002	nonzero	0.000	0.000	0.000	0.000	0.000	0.000	0.004	pg124.cx5
99.959	0.038	0.002	nonzero	0.000	0.000	0.000	0.000	0.000	0.000	0.006	pg131.cx5
-
98.992	1.007	nonzero	0.000	0.000	0.000	0.000	0.000	0.000	0.000	0.002	rx56.cx6a
98.071	1.928	nonzero	0.000	0.000	0.000	0.000	0.000	0.000	0.000	0.004	rx80.cx6a
Insert response time histogram
256us	1ms	4ms	16ms	64ms	256ms	1s	4s	16s	gt	max	tag
0.000	0.000	79.667	19.222	1.111	0.000	0.000	0.000	0.000	0.000	0.021	my5649.cx6d
0.000	0.000	95.569	4.153	0.278	0.000	0.000	0.000	0.000	0.000	0.023	my5731.cx6d
0.000	0.000	95.986	3.500	0.514	0.000	0.000	0.000	0.000	0.000	0.021	my8021.cx6d
0.000	0.000	96.625	3.264	0.111	0.000	0.000	0.000	0.000	0.000	0.022	my8022.cx6d
-
0.000	0.000	93.875	4.667	1.458	0.000	0.000	0.000	0.000	0.000	0.019	pg1110.cx5
0.000	0.000	96.806	2.236	0.958	0.000	0.000	0.000	0.000	0.000	0.019	pg124.cx5
0.000	0.000	96.639	2.556	0.806	0.000	0.000	0.000	0.000	0.000	0.019	pg131.cx5
-
0.000	0.000	99.986	0.014	0.000	0.000	0.000	0.000	0.000	0.000	0.004	rx56.cx6a
0.000	0.000	99.917	0.056	0.028	0.000	0.000	0.000	0.000	0.000	0.019	rx80.cx6a
q400.2
- q400.2: range queries with 400 insert/s per client, 2nd loop
- Legend for results is here.
- Each entry lists the percentage of responses that fit in that bucket (slower than max time for previous bucket, faster than min time for next bucket).
Query response time histogram
256us	1ms	4ms	16ms	64ms	256ms	1s	4s	16s	gt	max	tag
98.167	1.829	0.003	0.002	nonzero	0.000	0.000	0.000	0.000	0.000	0.019	my5649.cx6d
99.752	0.246	0.002	nonzero	nonzero	0.000	0.000	0.000	0.000	0.000	0.018	my5731.cx6d
98.882	1.117	0.001	nonzero	nonzero	0.000	0.000	0.000	0.000	0.000	0.018	my8021.cx6d
99.003	0.996	0.001	nonzero	nonzero	0.000	0.000	0.000	0.000	0.000	0.017	my8022.cx6d
-
99.874	0.124	0.002	nonzero	0.000	0.000	0.000	0.000	0.000	0.000	0.008	pg1110.cx5
99.941	0.057	0.002	nonzero	0.000	0.000	0.000	0.000	0.000	0.000	0.005	pg124.cx5
99.951	0.048	0.002	nonzero	0.000	0.000	0.000	0.000	0.000	0.000	0.004	pg131.cx5
-
98.344	1.655	0.001	nonzero	0.000	0.000	0.000	0.000	0.000	0.000	0.007	rx56.cx6a
97.669	2.329	0.001	nonzero	0.000	0.000	0.000	0.000	0.000	0.000	0.008	rx80.cx6a
Insert response time histogram
256us	1ms	4ms	16ms	64ms	256ms	1s	4s	16s	gt	max	tag
0.000	0.000	88.833	10.660	0.507	0.000	0.000	0.000	0.000	0.000	0.020	my5649.cx6d
0.000	0.000	95.250	4.611	0.139	0.000	0.000	0.000	0.000	0.000	0.021	my5731.cx6d
0.000	0.000	94.486	4.771	0.743	0.000	0.000	0.000	0.000	0.000	0.021	my8021.cx6d
0.000	0.000	93.889	5.535	0.576	0.000	0.000	0.000	0.000	0.000	0.027	my8022.cx6d
-
0.000	0.000	79.396	19.674	0.931	0.000	0.000	0.000	0.000	0.000	0.021	pg1110.cx5
0.000	0.000	73.653	25.500	0.847	0.000	0.000	0.000	0.000	0.000	0.022	pg124.cx5
0.000	0.000	73.681	25.431	0.889	0.000	0.000	0.000	0.000	0.000	0.029	pg131.cx5
-
0.000	1.799	98.153	0.049	0.000	0.000	0.000	0.000	0.000	0.000	0.014	rx56.cx6a
0.000	0.000	99.882	0.097	0.021	0.000	0.000	0.000	0.000	0.000	0.019	rx80.cx6a
q600.2
- q600.2: range queries with 600 insert/s per client, 2nd loop
- Legend for results is here.
- Each entry lists the percentage of responses that fit in that bucket (slower than max time for previous bucket, faster than min time for next bucket).
Query response time histogram
256us	1ms	4ms	16ms	64ms	256ms	1s	4s	16s	gt	max	tag
98.598	1.395	0.005	0.002	nonzero	0.000	0.000	0.000	0.000	0.000	0.019	my5649.cx6d
99.675	0.322	0.003	nonzero	nonzero	0.000	0.000	0.000	0.000	0.000	0.017	my5731.cx6d
98.823	1.175	0.002	nonzero	nonzero	0.000	0.000	0.000	0.000	0.000	0.018	my8021.cx6d
99.004	0.995	0.002	nonzero	nonzero	0.000	0.000	0.000	0.000	0.000	0.018	my8022.cx6d
-
99.855	0.143	0.002	nonzero	0.000	0.000	0.000	0.000	0.000	0.000	0.005	pg1110.cx5
99.923	0.075	0.002	nonzero	0.000	0.000	0.000	0.000	0.000	0.000	0.013	pg124.cx5
99.922	0.077	0.002	nonzero	0.000	0.000	0.000	0.000	0.000	0.000	0.004	pg131.cx5
-
98.212	1.786	0.002	0.000	0.000	0.000	0.000	0.000	0.000	0.000	0.004	rx56.cx6a
97.350	2.647	0.003	nonzero	0.000	0.000	0.000	0.000	0.000	0.000	0.012	rx80.cx6a
Insert response time histogram
256us	1ms	4ms	16ms	64ms	256ms	1s	4s	16s	gt	max	tag
0.000	0.000	92.120	7.556	0.324	0.000	0.000	0.000	0.000	0.000	0.019	my5649.cx6d
0.000	0.000	95.236	4.278	0.486	0.000	0.000	0.000	0.000	0.000	0.021	my5731.cx6d
0.000	0.000	93.824	3.509	2.667	0.000	0.000	0.000	0.000	0.000	0.025	my8021.cx6d
0.000	0.000	95.542	3.241	1.218	0.000	0.000	0.000	0.000	0.000	0.027	my8022.cx6d
-
0.000	0.000	64.282	35.032	0.685	0.000	0.000	0.000	0.000	0.000	0.020	pg1110.cx5
0.000	0.000	59.468	39.602	0.931	0.000	0.000	0.000	0.000	0.000	0.048	pg124.cx5
0.000	0.000	59.032	40.097	0.870	0.000	0.000	0.000	0.000	0.000	0.027	pg131.cx5
-
0.000	1.287	98.671	0.042	0.000	0.000	0.000	0.000	0.000	0.000	0.013	rx56.cx6a
0.000	0.000	99.917	0.069	0.014	0.000	0.000	0.000	0.000	0.000	0.019	rx80.cx6a
q800.2
- q800.2: range queries with 800 insert/s per client, 2nd loop
- Legend for results is here.
- Each entry lists the percentage of responses that fit in that bucket (slower than max time for previous bucket, faster than min time for next bucket).
Query response time histogram
256us	1ms	4ms	16ms	64ms	256ms	1s	4s	16s	gt	max	tag
98.511	1.480	0.006	0.002	nonzero	0.000	0.000	0.000	0.000	0.000	0.017	my5649.cx6d
99.589	0.407	0.004	nonzero	nonzero	0.000	0.000	0.000	0.000	0.000	0.020	my5731.cx6d
98.693	1.304	0.002	nonzero	nonzero	0.000	0.000	0.000	0.000	0.000	0.021	my8021.cx6d
98.906	1.091	0.002	nonzero	nonzero	0.000	0.000	0.000	0.000	0.000	0.017	my8022.cx6d
-
99.831	0.167	0.002	nonzero	0.000	0.000	0.000	0.000	0.000	0.000	0.004	pg1110.cx5
99.901	0.097	0.002	nonzero	0.000	0.000	0.000	0.000	0.000	0.000	0.004	pg124.cx5
99.897	0.101	0.002	nonzero	0.000	0.000	0.000	0.000	0.000	0.000	0.006	pg131.cx5
-
98.063	1.934	0.003	nonzero	0.000	0.000	0.000	0.000	0.000	0.000	0.006	rx56.cx6a
97.059	2.936	0.004	nonzero	0.000	0.000	0.000	0.000	0.000	0.000	0.007	rx80.cx6a
Insert response time histogram
256us	1ms	4ms	16ms	64ms	256ms	1s	4s	16s	gt	max	tag
0.000	0.000	94.604	5.125	0.271	0.000	0.000	0.000	0.000	0.000	0.021	my5649.cx6d
0.000	0.000	95.521	3.615	0.865	0.000	0.000	0.000	0.000	0.000	0.024	my5731.cx6d
0.000	0.000	94.472	4.590	0.938	0.000	0.000	0.000	0.000	0.000	0.023	my8021.cx6d
0.000	0.000	94.590	4.181	1.229	0.000	0.000	0.000	0.000	0.000	0.025	my8022.cx6d
-
0.000	0.000	74.681	23.899	1.420	0.000	0.000	0.000	0.000	0.000	0.021	pg1110.cx5
0.000	0.000	72.719	25.740	1.542	0.000	0.000	0.000	0.000	0.000	0.042	pg124.cx5
0.000	0.000	72.205	26.260	1.535	0.000	0.000	0.000	0.000	0.000	0.027	pg131.cx5
-
0.000	0.781	99.156	0.062	0.000	0.000	0.000	0.000	0.000	0.000	0.014	rx56.cx6a
0.000	0.000	99.910	0.062	0.028	0.000	0.000	0.000	0.000	0.000	0.019	rx80.cx6a
q1000.2
- q1000.2: range queries with 1000 insert/s per client, 2nd loop
- Legend for results is here.
- Each entry lists the percentage of responses that fit in that bucket (slower than max time for previous bucket, faster than min time for next bucket).
Query response time histogram
256us	1ms	4ms	16ms	64ms	256ms	1s	4s	16s	gt	max	tag
99.117	0.874	0.007	0.001	nonzero	0.000	0.000	0.000	0.000	0.000	0.017	my5649.cx6d
99.528	0.466	0.005	nonzero	nonzero	0.000	0.000	0.000	0.000	0.000	0.018	my5731.cx6d
98.617	1.380	0.003	nonzero	0.000	0.000	0.000	0.000	0.000	0.000	0.007	my8021.cx6d
98.816	1.181	0.003	nonzero	0.000	0.000	0.000	0.000	0.000	0.000	0.007	my8022.cx6d
-
99.775	0.223	0.002	nonzero	0.000	0.000	0.000	0.000	0.000	0.000	0.004	pg1110.cx5
99.882	0.116	0.002	nonzero	0.000	0.000	0.000	0.000	0.000	0.000	0.005	pg124.cx5
99.871	0.127	0.002	nonzero	0.000	0.000	0.000	0.000	0.000	0.000	0.005	pg131.cx5
-
97.863	2.134	0.003	nonzero	nonzero	0.000	0.000	0.000	0.000	0.000	0.019	rx56.cx6a
96.785	3.207	0.008	nonzero	0.000	0.000	0.000	0.000	0.000	0.000	0.007	rx80.cx6a
Insert response time histogram
256us	1ms	4ms	16ms	64ms	256ms	1s	4s	16s	gt	max	tag
0.000	0.000	95.119	4.561	0.319	0.000	0.000	0.000	0.000	0.000	0.021	my5649.cx6d
0.000	0.000	96.011	3.228	0.761	0.000	0.000	0.000	0.000	0.000	0.021	my5731.cx6d
0.000	0.000	96.431	3.569	0.000	0.000	0.000	0.000	0.000	0.000	0.015	my8021.cx6d
0.000	0.000	95.150	4.844	0.006	0.000	0.000	0.000	0.000	0.000	0.017	my8022.cx6d
-
0.000	0.000	77.886	21.717	0.397	0.000	0.000	0.000	0.000	0.000	0.040	pg1110.cx5
0.000	0.000	76.967	22.469	0.564	0.000	0.000	0.000	0.000	0.000	0.043	pg124.cx5
0.000	0.000	76.256	23.147	0.597	0.000	0.000	0.000	0.000	0.000	0.050	pg131.cx5
-
0.000	1.181	98.753	0.067	0.000	0.000	0.000	0.000	0.000	0.000	0.014	rx56.cx6a
0.000	0.000	99.875	0.100	0.025	0.000	0.000	0.000	0.000	0.000	0.019	rx80.cx6a