Introduction
This is a report for the insert benchmark with 20M docs and 1 client(s). It is generated by scripts (bash, awk, sed) and Tufte might not be impressed. An overview of the insert benchmark is here and a short update is here. Below, by DBMS, I mean DBMS+version.config. An example is my8020.c10b40 where my means MySQL, 8020 is version 8.0.20 and c10b40 is the name for the configuration file.
The test server is described here. Clients and the DBMS shared the same host running Ubuntu 18.04.5. All tests used Postgres 12.3. The configurations for Postgres are here.
Contents
- Summary
- l.i0: load without secondary indexes
- l.x: create secondary indexes
- l.i1: continue load after secondary indexes created
- q100.2: range queries with 100 insert/s per client, 2nd loop
- q200.2: range queries with 200 insert/s per client, 2nd loop
- q400.2: range queries with 400 insert/s per client, 2nd loop
- q600.2: range queries with 600 insert/s per client, 2nd loop
- q800.2: range queries with 800 insert/s per client, 2nd loop
- q1000.2: range queries with 1000 insert/s per client, 2nd loop
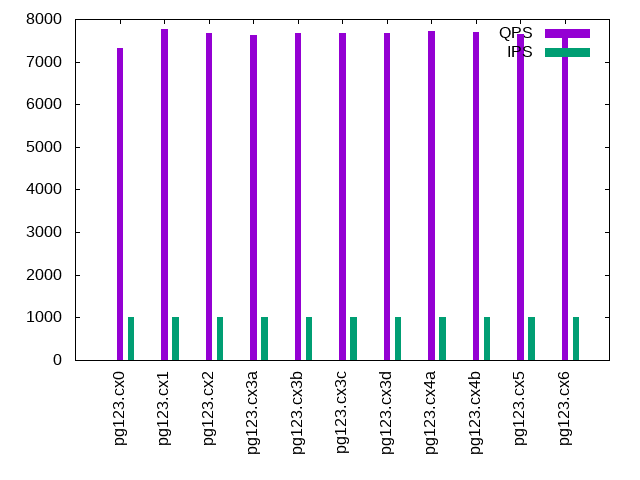
Summary
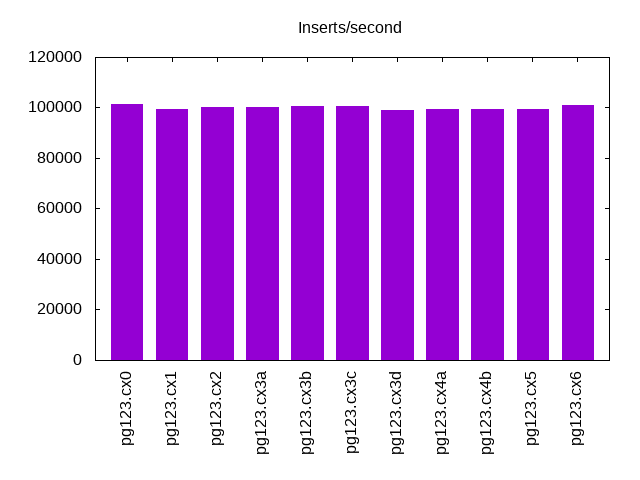
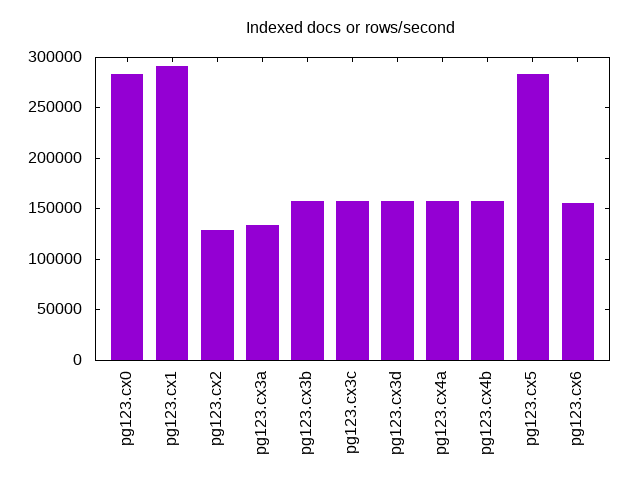
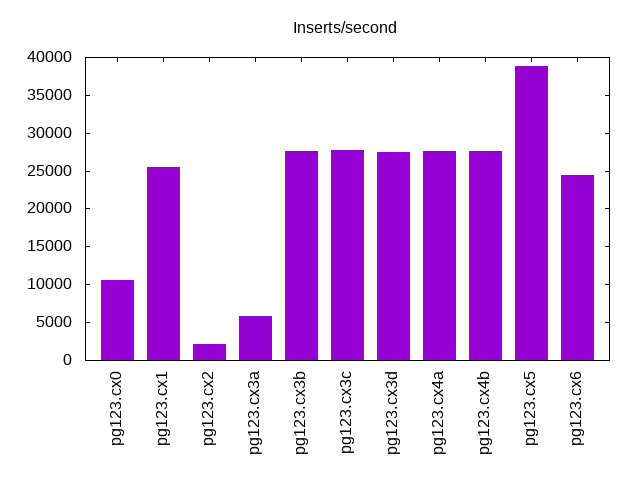
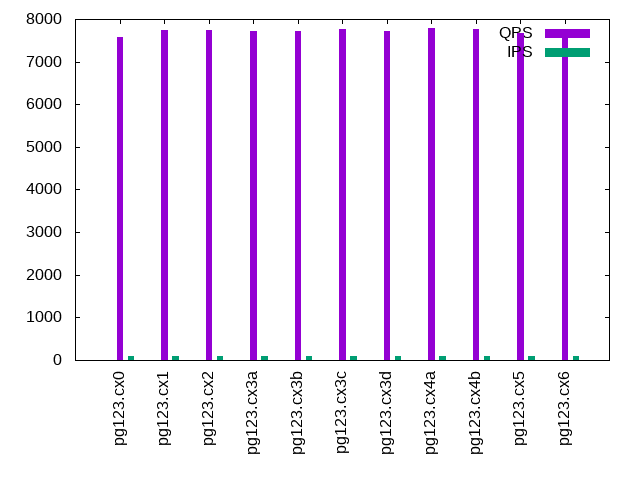
The numbers are inserts/s for l.i0 and l.i1, indexed docs (or rows) /s for l.x and queries/s for q*.2. The values are the average rate over the entire test for inserts (IPS) and queries (QPS). The range of values for IPS and QPS is split into 3 parts: bottom 25%, middle 50%, top 25%. Values in the bottom 25% have a red background, values in the top 25% have a green background and values in the middle have no color. A gray background is used for values that can be ignored because the DBMS did not sustain the target insert rate. Red backgrounds are not used when the minimum value is within 80% of the max value.
| dbms | l.i0 | l.x | l.i1 | q100.2 | q200.2 | q400.2 | q600.2 | q800.2 | q1000.2 |
|---|---|---|---|---|---|---|---|---|---|
| pg123.cx0 | 101523 | 283098 | 10532 | 7578 | 7541 | 7549 | 7391 | 7353 | 7313 |
| pg123.cx1 | 99502 | 291304 | 25413 | 7750 | 7760 | 7720 | 7704 | 7757 | 7763 |
| pg123.cx2 | 100000 | 128846 | 2123 | 7750 | 7679 | 7649 | 7653 | 7670 | 7670 |
| pg123.cx3a | 100000 | 134000 | 5828 | 7715 | 7698 | 7674 | 7650 | 7670 | 7632 |
| pg123.cx3b | 100502 | 157031 | 27624 | 7707 | 7708 | 7688 | 7674 | 7628 | 7660 |
| pg123.cx3c | 100502 | 157031 | 27662 | 7755 | 7729 | 7698 | 7669 | 7701 | 7669 |
| pg123.cx3d | 99010 | 157031 | 27510 | 7710 | 7714 | 7564 | 7644 | 7699 | 7662 |
| pg123.cx4a | 99502 | 157031 | 27548 | 7783 | 7758 | 7730 | 7728 | 7738 | 7712 |
| pg123.cx4b | 99502 | 157031 | 27586 | 7755 | 7689 | 7681 | 7691 | 7690 | 7697 |
| pg123.cx5 | 99502 | 283098 | 38760 | 7666 | 7671 | 7636 | 7652 | 7682 | 7649 |
| pg123.cx6 | 101010 | 155814 | 24420 | 7744 | 7686 | 7696 | 7679 | 7680 | 7690 |
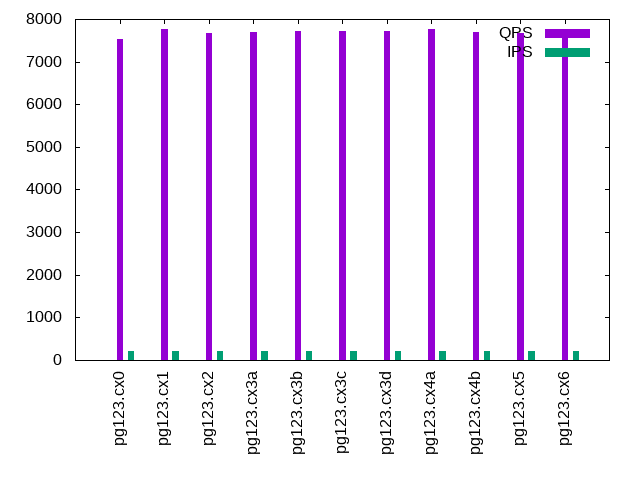
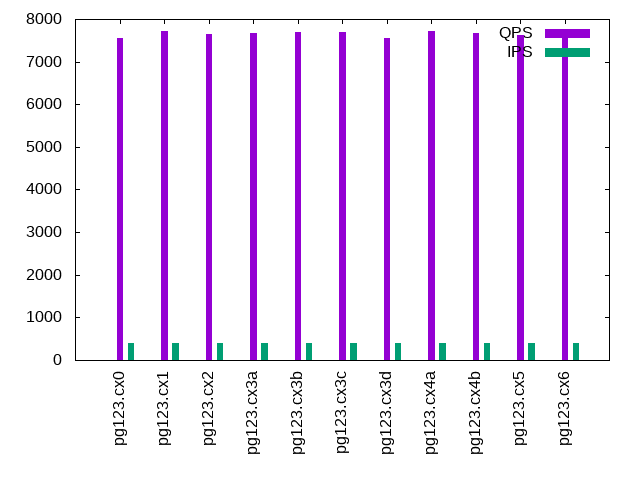
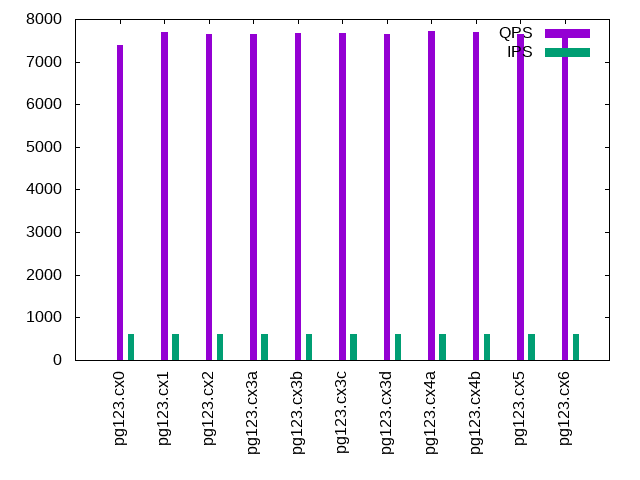
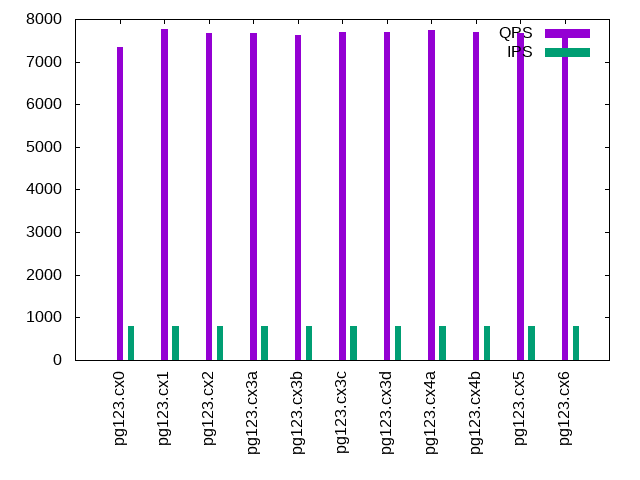
This lists the average rate of inserts/s for the tests that do inserts concurrent with queries. For such tests the query rate is listed in the table above. The read+write tests are setup so that the insert rate should match the target rate every second. Cells that are not at least 95% of the target have a red background to indicate a failure to satisfy the target.
| dbms | q100.2 | q200.2 | q400.2 | q600.2 | q800.2 | q1000.2 |
|---|---|---|---|---|---|---|
| pg123.cx0 | 100 | 200 | 399 | 599 | 799 | 998 |
| pg123.cx1 | 100 | 200 | 399 | 599 | 799 | 998 |
| pg123.cx2 | 100 | 200 | 399 | 599 | 799 | 998 |
| pg123.cx3a | 100 | 200 | 399 | 599 | 799 | 998 |
| pg123.cx3b | 100 | 200 | 399 | 599 | 799 | 998 |
| pg123.cx3c | 100 | 200 | 399 | 599 | 799 | 998 |
| pg123.cx3d | 100 | 200 | 399 | 599 | 799 | 998 |
| pg123.cx4a | 100 | 200 | 399 | 599 | 799 | 998 |
| pg123.cx4b | 100 | 200 | 399 | 599 | 799 | 998 |
| pg123.cx5 | 100 | 200 | 399 | 599 | 799 | 998 |
| pg123.cx6 | 100 | 200 | 399 | 599 | 799 | 999 |
| target | 100 | 200 | 400 | 600 | 800 | 1000 |
l.i0
l.i0: load without secondary indexes. Graphs for performance per 1-second interval are here.
Average throughput:
Insert response time histogram: each cell has the percentage of responses that take <= the time in the header and max is the max response time in seconds. For the max column values in the top 25% of the range have a red background and in the bottom 25% of the range have a green background. The red background is not used when the min value is within 80% of the max value.
| dbms | 256us | 1ms | 4ms | 16ms | 64ms | 256ms | 1s | 4s | 16s | gt | max |
|---|---|---|---|---|---|---|---|---|---|---|---|
| pg123.cx0 | 87.536 | 12.461 | 0.002 | 0.001 | 0.028 | ||||||
| pg123.cx1 | 82.558 | 17.437 | 0.004 | 0.001 | 0.021 | ||||||
| pg123.cx2 | 86.166 | 13.829 | 0.004 | 0.001 | 0.023 | ||||||
| pg123.cx3a | 84.323 | 15.676 | 0.001 | 0.001 | 0.020 | ||||||
| pg123.cx3b | 86.224 | 13.776 | 0.001 | 0.005 | |||||||
| pg123.cx3c | 87.532 | 12.466 | 0.002 | 0.005 | |||||||
| pg123.cx3d | 75.791 | 24.209 | 0.001 | 0.006 | |||||||
| pg123.cx4a | 80.856 | 19.141 | 0.003 | 0.009 | |||||||
| pg123.cx4b | 82.467 | 17.533 | 0.001 | 0.008 | |||||||
| pg123.cx5 | 80.027 | 19.971 | 0.002 | 0.009 | |||||||
| pg123.cx6 | 86.948 | 13.051 | 0.002 | 0.005 |
Performance metrics for the DBMS listed above. Some are normalized by throughput, others are not. Legend for results is here.
ips	qps	rps	rkbps	wkbps	rpq	rkbpq	wkbpi	csps	cpups	cspq	cpupq	dbgb1	dbgb2	rss	maxop	p50	p99	tag
101523	0	0	0	49434	0.000	0.000	0.487	12524	46.7	0.123	18	1.9	3.0	0.0	0.028	101725	96489	pg123.cx0
99502	0	0	0	49799	0.000	0.000	0.500	12211	46.1	0.123	19	1.9	3.0	0.0	0.021	100091	81026	pg123.cx1
100000	0	0	0	47824	0.000	0.000	0.478	12185	48.4	0.122	19	1.9	3.0	0.0	0.023	101189	80811	pg123.cx2
100000	0	0	0	59164	0.000	0.000	0.592	12360	46.9	0.124	19	1.9	4.0	0.0	0.020	100593	79612	pg123.cx3a
100502	0	0	0	64641	0.000	0.000	0.643	12496	46.5	0.124	19	1.9	5.2	0.0	0.005	101190	80252	pg123.cx3b
100502	0	0	0	62545	0.000	0.000	0.622	12490	46.5	0.124	19	1.9	5.2	0.0	0.005	101361	80212	pg123.cx3c
99010	0	0	0	63220	0.000	0.000	0.639	12280	45.6	0.124	18	1.9	5.2	0.0	0.006	99091	84802	pg123.cx3d
99502	0	0	0	64609	0.000	0.000	0.649	12356	45.9	0.124	18	1.9	5.2	0.0	0.009	99789	80712	pg123.cx4a
99502	0	0	0	64878	0.000	0.000	0.652	12454	46.2	0.125	19	1.9	5.2	0.0	0.008	100290	80412	pg123.cx4b
99502	0	0	0	64609	0.000	0.000	0.649	12323	45.8	0.124	18	1.9	5.2	0.0	0.009	99694	80828	pg123.cx5
101010	0	0	0	64851	0.000	0.000	0.642	12534	46.5	0.124	18	1.9	5.2	0.0	0.005	101488	80315	pg123.cx6
l.x
l.x: create secondary indexes.
Average throughput:
Performance metrics for the DBMS listed above. Some are normalized by throughput, others are not. Legend for results is here.
ips	qps	rps	rkbps	wkbps	rpq	rkbpq	wkbpi	csps	cpups	cspq	cpupq	dbgb1	dbgb2	rss	maxop	p50	p99	tag
283098	0	0	0	82377	0.000	0.000	0.291	1400	24.7	0.005	3	3.7	4.7	0.0	0.002	NA	NA	pg123.cx0
291304	0	0	0	99952	0.000	0.000	0.343	1319	25.5	0.005	4	3.7	4.7	0.0	0.002	NA	NA	pg123.cx1
128846	0	0	0	48203	0.000	0.000	0.374	667	24.7	0.005	8	3.7	4.7	0.0	0.002	NA	NA	pg123.cx2
134000	0	0	0	53385	0.000	0.000	0.398	706	24.6	0.005	7	3.7	5.7	0.0	0.002	NA	NA	pg123.cx3a
157031	0	0	0	65624	0.000	0.000	0.418	1104	24.6	0.007	6	3.7	7.9	0.0	0.002	NA	NA	pg123.cx3b
157031	0	0	0	65641	0.000	0.000	0.418	1095	24.7	0.007	6	3.7	7.9	0.0	0.002	NA	NA	pg123.cx3c
157031	0	0	0	68030	0.000	0.000	0.433	1099	24.5	0.007	6	3.7	7.9	0.0	0.002	NA	NA	pg123.cx3d
157031	0	0	0	65806	0.000	0.000	0.419	1095	24.6	0.007	6	3.7	7.9	0.0	0.002	NA	NA	pg123.cx4a
157031	0	0	0	65695	0.000	0.000	0.418	1094	24.8	0.007	6	3.7	7.9	0.0	0.002	NA	NA	pg123.cx4b
283098	0	0	0	106818	0.000	0.000	0.377	2378	24.6	0.008	3	3.7	8.6	0.0	0.002	NA	NA	pg123.cx5
155814	0	0	0	65186	0.000	0.000	0.418	1065	24.5	0.007	6	3.7	7.9	0.0	0.002	NA	NA	pg123.cx6
l.i1
l.i1: continue load after secondary indexes created. Graphs for performance per 1-second interval are here.
Average throughput:
Insert response time histogram: each cell has the percentage of responses that take <= the time in the header and max is the max response time in seconds. For the max column values in the top 25% of the range have a red background and in the bottom 25% of the range have a green background. The red background is not used when the min value is within 80% of the max value.
| dbms | 256us | 1ms | 4ms | 16ms | 64ms | 256ms | 1s | 4s | 16s | gt | max |
|---|---|---|---|---|---|---|---|---|---|---|---|
| pg123.cx0 | 81.159 | 16.611 | 1.736 | 0.493 | 0.244 | ||||||
| pg123.cx1 | 95.796 | 3.341 | 0.786 | 0.076 | nonzero | 0.325 | |||||
| pg123.cx2 | 15.848 | 84.152 | 0.001 | 0.072 | |||||||
| pg123.cx3a | 44.874 | 36.858 | 18.268 | 0.049 | |||||||
| pg123.cx3b | 96.076 | 2.676 | 1.248 | nonzero | nonzero | 0.373 | |||||
| pg123.cx3c | 96.091 | 2.660 | 1.249 | nonzero | 0.171 | ||||||
| pg123.cx3d | 96.085 | 2.671 | 1.244 | 0.058 | |||||||
| pg123.cx4a | 96.106 | 2.646 | 1.248 | 0.001 | nonzero | 0.286 | |||||
| pg123.cx4b | 96.095 | 2.655 | 1.249 | nonzero | 0.147 | ||||||
| pg123.cx5 | 99.863 | 0.111 | 0.024 | 0.001 | nonzero | 0.487 | |||||
| pg123.cx6 | 96.084 | 2.726 | 1.191 | 0.047 |
Performance metrics for the DBMS listed above. Some are normalized by throughput, others are not. Legend for results is here.
ips	qps	rps	rkbps	wkbps	rpq	rkbpq	wkbpi	csps	cpups	cspq	cpupq	dbgb1	dbgb2	rss	maxop	p50	p99	tag
10532	0	0	0	435861	0.000	0.000	41.385	4875	26.5	0.463	101	8.2	9.2	0.0	0.244	11985	2397	pg123.cx0
25413	0	0	0	613312	0.000	0.000	24.134	11619	36.4	0.457	57	8.2	13.0	0.0	0.325	26270	7741	pg123.cx1
2123	0	0	0	49871	0.000	0.000	23.490	941	25.7	0.443	484	8.2	9.2	0.0	0.072	1949	1249	pg123.cx2
5828	0	0	0	48126	0.000	0.000	8.258	1793	26.6	0.308	183	8.2	10.2	0.0	0.049	2949	1249	pg123.cx3a
27624	0	0	0	54060	0.000	0.000	1.957	6931	32.0	0.251	46	8.2	15.5	0.0	0.373	35561	1448	pg123.cx3b
27662	0	0	0	53994	0.000	0.000	1.952	6928	32.0	0.250	46	8.2	15.5	0.0	0.171	35462	1400	pg123.cx3c
27510	0	0	0	53320	0.000	0.000	1.938	6904	32.0	0.251	47	8.2	15.4	0.0	0.058	35311	1448	pg123.cx3d
27548	0	0	0	52705	0.000	0.000	1.913	6923	32.0	0.251	46	8.2	15.4	0.0	0.286	35275	1448	pg123.cx4a
27586	0	0	0	53163	0.000	0.000	1.927	6980	32.1	0.253	47	8.2	15.4	0.0	0.147	35489	1400	pg123.cx4b
38760	0	0	0	89451	0.000	0.000	2.308	9935	34.9	0.256	36	8.2	19.5	0.0	0.487	40356	12734	pg123.cx5
24420	0	28	280	153939	0.001	0.011	6.304	7062	33.7	0.289	55	8.2	14.7	0.0	0.047	30368	1499	pg123.cx6
q100.2
q100.2: range queries with 100 insert/s per client, 2nd loop. Graphs for performance per 1-second interval are here.
Average throughput:
Query response time histogram: each cell has the percentage of responses that take <= the time in the header and max is the max response time in seconds. For max values in the top 25% of the range have a red background and in the bottom 25% of the range have a green background. The red background is not used when the min value is within 80% of the max value.
| dbms | 256us | 1ms | 4ms | 16ms | 64ms | 256ms | 1s | 4s | 16s | gt | max |
|---|---|---|---|---|---|---|---|---|---|---|---|
| pg123.cx0 | 99.978 | 0.021 | 0.001 | nonzero | 0.007 | ||||||
| pg123.cx1 | 99.985 | 0.014 | 0.001 | 0.004 | |||||||
| pg123.cx2 | 99.986 | 0.014 | nonzero | nonzero | 0.015 | ||||||
| pg123.cx3a | 99.985 | 0.014 | nonzero | nonzero | 0.013 | ||||||
| pg123.cx3b | 99.985 | 0.015 | nonzero | nonzero | 0.013 | ||||||
| pg123.cx3c | 99.985 | 0.015 | nonzero | nonzero | 0.013 | ||||||
| pg123.cx3d | 99.984 | 0.016 | nonzero | nonzero | 0.012 | ||||||
| pg123.cx4a | 99.985 | 0.015 | nonzero | nonzero | 0.013 | ||||||
| pg123.cx4b | 99.985 | 0.015 | nonzero | nonzero | 0.014 | ||||||
| pg123.cx5 | 99.986 | 0.014 | 0.001 | 0.004 | |||||||
| pg123.cx6 | 99.986 | 0.014 | nonzero | nonzero | 0.010 |
Insert response time histogram: each cell has the percentage of responses that take <= the time in the header and max is the max response time in seconds. For max values in the top 25% of the range have a red background and in the bottom 25% of the range have a green background. The red background is not used when the min value is within 80% of the max value.
| dbms | 256us | 1ms | 4ms | 16ms | 64ms | 256ms | 1s | 4s | 16s | gt | max |
|---|---|---|---|---|---|---|---|---|---|---|---|
| pg123.cx0 | 99.972 | 0.028 | 0.004 | ||||||||
| pg123.cx1 | 99.944 | 0.056 | 0.006 | ||||||||
| pg123.cx2 | 100.000 | 0.050 | |||||||||
| pg123.cx3a | 100.000 | 0.044 | |||||||||
| pg123.cx3b | 100.000 | 0.044 | |||||||||
| pg123.cx3c | 100.000 | 0.043 | |||||||||
| pg123.cx3d | 100.000 | 0.046 | |||||||||
| pg123.cx4a | 100.000 | 0.043 | |||||||||
| pg123.cx4b | 100.000 | 0.044 | |||||||||
| pg123.cx5 | 99.972 | 0.028 | 0.006 | ||||||||
| pg123.cx6 | 100.000 | 0.043 |
Performance metrics for the DBMS listed above. Some are normalized by throughput, others are not. Legend for results is here.
ips	qps	rps	rkbps	wkbps	rpq	rkbpq	wkbpi	csps	cpups	cspq	cpupq	dbgb1	dbgb2	rss	maxop	p50	p99	tag
100	7578	0	0	4341	0.000	0.000	43.500	29186	25.2	3.851	133	8.2	9.3	0.0	0.007	7576	7496	pg123.cx0
100	7750	0	0	4541	0.000	0.000	45.505	29837	25.1	3.850	130	8.2	9.3	0.0	0.004	7752	7655	pg123.cx1
100	7750	0	0	3283	0.000	0.000	32.899	29850	27.0	3.851	139	8.2	9.0	0.0	0.015	7752	7656	pg123.cx2
100	7715	0	0	3469	0.000	0.000	34.761	29716	27.0	3.852	140	8.2	9.3	0.0	0.013	7720	7624	pg123.cx3a
100	7707	0	0	4289	0.000	0.000	42.978	29684	27.0	3.852	140	8.2	12.5	0.0	0.013	7719	7608	pg123.cx3b
100	7755	0	0	4286	0.000	0.000	42.948	29868	26.9	3.851	139	8.2	12.5	0.0	0.013	7767	7656	pg123.cx3c
100	7710	0	0	4217	0.000	0.000	42.251	29694	27.0	3.851	140	8.2	12.4	0.0	0.012	7719	7608	pg123.cx3d
100	7783	0	0	4223	0.000	0.000	42.313	29976	27.0	3.851	139	8.2	12.4	0.0	0.013	7784	7672	pg123.cx4a
100	7755	0	0	4305	0.000	0.000	43.137	29864	27.0	3.851	139	8.2	12.5	0.0	0.014	7758	7656	pg123.cx4b
100	7666	0	0	5884	0.000	0.000	58.958	29514	25.1	3.850	131	8.2	14.2	0.0	0.004	7672	7576	pg123.cx5
100	7744	0	0	4224	0.000	0.000	42.325	29829	27.1	3.852	140	8.2	11.7	0.0	0.010	7751	7656	pg123.cx6
q200.2
q200.2: range queries with 200 insert/s per client, 2nd loop. Graphs for performance per 1-second interval are here.
Average throughput:
Query response time histogram: each cell has the percentage of responses that take <= the time in the header and max is the max response time in seconds. For max values in the top 25% of the range have a red background and in the bottom 25% of the range have a green background. The red background is not used when the min value is within 80% of the max value.
| dbms | 256us | 1ms | 4ms | 16ms | 64ms | 256ms | 1s | 4s | 16s | gt | max |
|---|---|---|---|---|---|---|---|---|---|---|---|
| pg123.cx0 | 99.974 | 0.024 | 0.002 | 0.004 | |||||||
| pg123.cx1 | 99.985 | 0.014 | 0.001 | nonzero | 0.009 | ||||||
| pg123.cx2 | 99.980 | 0.019 | 0.001 | nonzero | 0.013 | ||||||
| pg123.cx3a | 99.979 | 0.020 | nonzero | nonzero | nonzero | 0.019 | |||||
| pg123.cx3b | 99.981 | 0.019 | nonzero | nonzero | 0.011 | ||||||
| pg123.cx3c | 99.979 | 0.020 | nonzero | nonzero | 0.013 | ||||||
| pg123.cx3d | 99.977 | 0.022 | nonzero | nonzero | 0.014 | ||||||
| pg123.cx4a | 99.980 | 0.019 | nonzero | nonzero | nonzero | 0.018 | |||||
| pg123.cx4b | 99.980 | 0.020 | nonzero | nonzero | 0.012 | ||||||
| pg123.cx5 | 99.983 | 0.015 | 0.002 | nonzero | 0.004 | ||||||
| pg123.cx6 | 99.978 | 0.021 | 0.001 | nonzero | 0.012 |
Insert response time histogram: each cell has the percentage of responses that take <= the time in the header and max is the max response time in seconds. For max values in the top 25% of the range have a red background and in the bottom 25% of the range have a green background. The red background is not used when the min value is within 80% of the max value.
| dbms | 256us | 1ms | 4ms | 16ms | 64ms | 256ms | 1s | 4s | 16s | gt | max |
|---|---|---|---|---|---|---|---|---|---|---|---|
| pg123.cx0 | 99.931 | 0.069 | 0.012 | ||||||||
| pg123.cx1 | 99.986 | 0.014 | 0.006 | ||||||||
| pg123.cx2 | 100.000 | 0.046 | |||||||||
| pg123.cx3a | 100.000 | 0.046 | |||||||||
| pg123.cx3b | 100.000 | 0.047 | |||||||||
| pg123.cx3c | 100.000 | 0.045 | |||||||||
| pg123.cx3d | 100.000 | 0.043 | |||||||||
| pg123.cx4a | 100.000 | 0.044 | |||||||||
| pg123.cx4b | 100.000 | 0.045 | |||||||||
| pg123.cx5 | 99.986 | 0.014 | 0.006 | ||||||||
| pg123.cx6 | 100.000 | 0.044 |
Performance metrics for the DBMS listed above. Some are normalized by throughput, others are not. Legend for results is here.
ips	qps	rps	rkbps	wkbps	rpq	rkbpq	wkbpi	csps	cpups	cspq	cpupq	dbgb1	dbgb2	rss	maxop	p50	p99	tag
200	7541	0	0	8537	0.000	0.000	42.772	29082	25.4	3.857	135	8.4	9.4	0.0	0.004	7544	7464	pg123.cx0
200	7760	0	0	7908	0.000	0.000	39.617	29902	25.3	3.853	130	8.4	9.4	0.0	0.009	7767	7656	pg123.cx1
200	7679	0	0	5594	0.000	0.000	28.027	29611	28.6	3.856	149	8.4	9.3	0.0	0.013	7687	7576	pg123.cx2
200	7698	0	0	5618	0.000	0.000	28.146	29681	28.8	3.856	150	8.4	9.4	0.0	0.019	7703	7599	pg123.cx3a
200	7708	0	0	5864	0.000	0.000	29.380	29724	28.6	3.856	148	8.4	9.9	0.0	0.011	7719	7608	pg123.cx3b
200	7729	0	0	5884	0.000	0.000	29.479	29803	28.5	3.856	147	8.4	9.9	0.0	0.013	7735	7624	pg123.cx3c
200	7714	0	0	5838	0.000	0.000	29.247	29746	28.6	3.856	148	8.4	9.9	0.0	0.014	7719	7608	pg123.cx3d
200	7758	0	0	5869	0.000	0.000	29.405	29909	28.5	3.855	147	8.4	9.9	0.0	0.018	7767	7656	pg123.cx4a
200	7689	0	0	5944	0.000	0.000	29.779	29649	28.5	3.856	148	8.4	9.9	0.0	0.012	7688	7592	pg123.cx4b
200	7671	0	0	7487	0.000	0.000	37.508	29556	25.3	3.853	132	8.4	10.9	0.0	0.004	7672	7565	pg123.cx5
200	7686	0	0	6213	0.000	0.000	31.125	29640	28.8	3.856	150	8.4	9.8	0.0	0.012	7688	7594	pg123.cx6
q400.2
q400.2: range queries with 400 insert/s per client, 2nd loop. Graphs for performance per 1-second interval are here.
Average throughput:
Query response time histogram: each cell has the percentage of responses that take <= the time in the header and max is the max response time in seconds. For max values in the top 25% of the range have a red background and in the bottom 25% of the range have a green background. The red background is not used when the min value is within 80% of the max value.
| dbms | 256us | 1ms | 4ms | 16ms | 64ms | 256ms | 1s | 4s | 16s | gt | max |
|---|---|---|---|---|---|---|---|---|---|---|---|
| pg123.cx0 | 99.931 | 0.065 | 0.004 | nonzero | nonzero | 0.021 | |||||
| pg123.cx1 | 99.966 | 0.030 | 0.004 | nonzero | 0.011 | ||||||
| pg123.cx2 | 99.951 | 0.046 | 0.002 | 0.001 | nonzero | 0.019 | |||||
| pg123.cx3a | 99.961 | 0.036 | 0.002 | 0.001 | 0.013 | ||||||
| pg123.cx3b | 99.959 | 0.038 | 0.003 | 0.001 | 0.015 | ||||||
| pg123.cx3c | 99.958 | 0.038 | 0.003 | 0.001 | nonzero | 0.020 | |||||
| pg123.cx3d | 99.956 | 0.041 | 0.003 | 0.001 | 0.014 | ||||||
| pg123.cx4a | 99.958 | 0.039 | 0.002 | 0.001 | nonzero | 0.018 | |||||
| pg123.cx4b | 99.958 | 0.039 | 0.003 | 0.001 | 0.013 | ||||||
| pg123.cx5 | 99.970 | 0.026 | 0.004 | nonzero | 0.005 | ||||||
| pg123.cx6 | 99.955 | 0.041 | 0.003 | 0.001 | 0.011 |
Insert response time histogram: each cell has the percentage of responses that take <= the time in the header and max is the max response time in seconds. For max values in the top 25% of the range have a red background and in the bottom 25% of the range have a green background. The red background is not used when the min value is within 80% of the max value.
| dbms | 256us | 1ms | 4ms | 16ms | 64ms | 256ms | 1s | 4s | 16s | gt | max |
|---|---|---|---|---|---|---|---|---|---|---|---|
| pg123.cx0 | 92.368 | 7.451 | 0.181 | 0.053 | |||||||
| pg123.cx1 | 99.979 | 0.021 | 0.006 | ||||||||
| pg123.cx2 | 100.000 | 0.048 | |||||||||
| pg123.cx3a | 2.514 | 97.486 | 0.049 | ||||||||
| pg123.cx3b | 3.083 | 96.917 | 0.046 | ||||||||
| pg123.cx3c | 3.319 | 96.681 | 0.045 | ||||||||
| pg123.cx3d | 3.076 | 96.924 | 0.045 | ||||||||
| pg123.cx4a | 3.125 | 96.875 | 0.054 | ||||||||
| pg123.cx4b | 3.153 | 96.847 | 0.045 | ||||||||
| pg123.cx5 | 99.993 | 0.007 | 0.006 | ||||||||
| pg123.cx6 | 2.660 | 97.340 | 0.044 |
Performance metrics for the DBMS listed above. Some are normalized by throughput, others are not. Legend for results is here.
ips	qps	rps	rkbps	wkbps	rpq	rkbpq	wkbpi	csps	cpups	cspq	cpupq	dbgb1	dbgb2	rss	maxop	p50	p99	tag
399	7549	0	0	17131	0.000	0.000	42.902	29229	25.7	3.872	136	8.8	9.9	0.0	0.021	7560	7432	pg123.cx0
399	7720	0	0	15658	0.000	0.000	39.214	29825	25.7	3.864	133	8.8	9.9	0.0	0.011	7720	7624	pg123.cx1
399	7649	0	0	11147	0.000	0.000	27.916	29548	31.8	3.863	166	8.8	9.9	0.0	0.019	7656	7512	pg123.cx2
399	7674	0	0	9213	0.000	0.000	23.073	29646	30.9	3.863	161	8.8	10.4	0.0	0.013	7672	7560	pg123.cx3a
399	7688	0	0	9365	0.000	0.000	23.453	29703	30.8	3.863	160	8.8	10.4	0.0	0.015	7690	7560	pg123.cx3b
399	7698	0	0	9298	0.000	0.000	23.286	29740	30.8	3.863	160	8.8	10.4	0.0	0.020	7704	7566	pg123.cx3c
399	7564	0	0	9270	0.000	0.000	23.215	29234	30.7	3.865	162	8.8	10.4	0.0	0.014	7576	7448	pg123.cx3d
399	7730	0	0	9276	0.000	0.000	23.232	29873	30.8	3.864	159	8.8	10.4	0.0	0.018	7735	7608	pg123.cx4a
399	7681	0	0	9314	0.000	0.000	23.326	29689	30.7	3.865	160	8.8	10.4	0.0	0.013	7688	7544	pg123.cx4b
399	7636	0	0	11608	0.000	0.000	29.070	29477	25.6	3.860	134	8.8	11.4	0.0	0.005	7640	7528	pg123.cx5
399	7696	0	0	10139	0.000	0.000	25.393	29746	30.9	3.865	161	8.8	10.4	0.0	0.011	7703	7592	pg123.cx6
q600.2
q600.2: range queries with 600 insert/s per client, 2nd loop. Graphs for performance per 1-second interval are here.
Average throughput:
Query response time histogram: each cell has the percentage of responses that take <= the time in the header and max is the max response time in seconds. For max values in the top 25% of the range have a red background and in the bottom 25% of the range have a green background. The red background is not used when the min value is within 80% of the max value.
| dbms | 256us | 1ms | 4ms | 16ms | 64ms | 256ms | 1s | 4s | 16s | gt | max |
|---|---|---|---|---|---|---|---|---|---|---|---|
| pg123.cx0 | 99.887 | 0.105 | 0.008 | nonzero | nonzero | 0.038 | |||||
| pg123.cx1 | 99.938 | 0.054 | 0.008 | nonzero | 0.012 | ||||||
| pg123.cx2 | 99.916 | 0.079 | 0.003 | 0.001 | 0.013 | ||||||
| pg123.cx3a | 99.936 | 0.060 | 0.003 | 0.001 | 0.013 | ||||||
| pg123.cx3b | 99.931 | 0.064 | 0.004 | 0.001 | 0.012 | ||||||
| pg123.cx3c | 99.938 | 0.057 | 0.004 | 0.001 | 0.013 | ||||||
| pg123.cx3d | 99.937 | 0.059 | 0.003 | 0.001 | 0.013 | ||||||
| pg123.cx4a | 99.933 | 0.062 | 0.004 | 0.001 | 0.012 | ||||||
| pg123.cx4b | 99.936 | 0.059 | 0.004 | 0.001 | 0.012 | ||||||
| pg123.cx5 | 99.951 | 0.042 | 0.007 | nonzero | 0.006 | ||||||
| pg123.cx6 | 99.936 | 0.059 | 0.004 | 0.001 | 0.013 |
Insert response time histogram: each cell has the percentage of responses that take <= the time in the header and max is the max response time in seconds. For max values in the top 25% of the range have a red background and in the bottom 25% of the range have a green background. The red background is not used when the min value is within 80% of the max value.
| dbms | 256us | 1ms | 4ms | 16ms | 64ms | 256ms | 1s | 4s | 16s | gt | max |
|---|---|---|---|---|---|---|---|---|---|---|---|
| pg123.cx0 | 89.398 | 10.338 | 0.264 | 0.052 | |||||||
| pg123.cx1 | 99.898 | 0.102 | 0.012 | ||||||||
| pg123.cx2 | 0.014 | 99.986 | 0.043 | ||||||||
| pg123.cx3a | 30.778 | 69.222 | 0.042 | ||||||||
| pg123.cx3b | 31.782 | 68.218 | 0.041 | ||||||||
| pg123.cx3c | 32.352 | 67.648 | 0.041 | ||||||||
| pg123.cx3d | 31.204 | 68.796 | 0.049 | ||||||||
| pg123.cx4a | 32.236 | 67.764 | 0.044 | ||||||||
| pg123.cx4b | 32.153 | 67.847 | 0.042 | ||||||||
| pg123.cx5 | 99.944 | 0.056 | 0.007 | ||||||||
| pg123.cx6 | 30.958 | 69.042 | 0.042 |
Performance metrics for the DBMS listed above. Some are normalized by throughput, others are not. Legend for results is here.
ips	qps	rps	rkbps	wkbps	rpq	rkbpq	wkbpi	csps	cpups	cspq	cpupq	dbgb1	dbgb2	rss	maxop	p50	p99	tag
599	7391	0	0	24877	0.000	0.000	41.531	28736	26.0	3.888	141	10.0	11.0	0.0	0.038	7400	7112	pg123.cx0
599	7704	0	0	23412	0.000	0.000	39.085	29857	26.2	3.875	136	10.0	11.0	0.0	0.012	7719	7560	pg123.cx1
599	7653	0	0	17066	0.000	0.000	28.491	29636	34.2	3.872	179	10.0	11.0	0.0	0.013	7659	7528	pg123.cx2
599	7650	0	0	12698	0.000	0.000	21.189	29579	31.9	3.866	167	10.0	11.9	0.0	0.013	7656	7496	pg123.cx3a
599	7674	0	0	12387	0.000	0.000	20.679	29697	31.8	3.870	166	10.0	11.9	0.0	0.012	7688	7528	pg123.cx3b
599	7669	0	0	12423	0.000	0.000	20.740	29678	31.8	3.870	166	10.0	11.9	0.0	0.013	7672	7528	pg123.cx3c
599	7644	0	0	13030	0.000	0.000	21.753	29584	31.8	3.870	166	10.0	11.9	0.0	0.013	7656	7495	pg123.cx3d
599	7728	0	0	12384	0.000	0.000	20.675	29917	31.8	3.871	165	10.0	11.9	0.0	0.012	7736	7576	pg123.cx4a
599	7691	0	0	12487	0.000	0.000	20.846	29778	31.8	3.872	165	10.0	11.9	0.0	0.012	7703	7544	pg123.cx4b
599	7652	0	0	15141	0.000	0.000	25.278	29597	25.9	3.868	135	10.0	13.3	0.0	0.006	7656	7544	pg123.cx5
599	7679	0	0	14773	0.000	0.000	24.662	29767	32.0	3.876	167	10.0	11.9	0.0	0.013	7688	7544	pg123.cx6
q800.2
q800.2: range queries with 800 insert/s per client, 2nd loop. Graphs for performance per 1-second interval are here.
Average throughput:
Query response time histogram: each cell has the percentage of responses that take <= the time in the header and max is the max response time in seconds. For max values in the top 25% of the range have a red background and in the bottom 25% of the range have a green background. The red background is not used when the min value is within 80% of the max value.
| dbms | 256us | 1ms | 4ms | 16ms | 64ms | 256ms | 1s | 4s | 16s | gt | max |
|---|---|---|---|---|---|---|---|---|---|---|---|
| pg123.cx0 | 99.725 | 0.263 | 0.011 | nonzero | 0.001 | 0.043 | |||||
| pg123.cx1 | 99.911 | 0.078 | 0.011 | nonzero | nonzero | 0.017 | |||||
| pg123.cx2 | 99.888 | 0.105 | 0.004 | 0.002 | 0.014 | ||||||
| pg123.cx3a | 99.919 | 0.076 | 0.003 | 0.002 | nonzero | 0.017 | |||||
| pg123.cx3b | 99.919 | 0.076 | 0.004 | 0.001 | 0.013 | ||||||
| pg123.cx3c | 99.920 | 0.075 | 0.004 | 0.001 | nonzero | 0.019 | |||||
| pg123.cx3d | 99.918 | 0.077 | 0.004 | 0.001 | 0.012 | ||||||
| pg123.cx4a | 99.916 | 0.079 | 0.005 | 0.001 | 0.013 | ||||||
| pg123.cx4b | 99.918 | 0.076 | 0.004 | 0.001 | 0.013 | ||||||
| pg123.cx5 | 99.932 | 0.059 | 0.009 | nonzero | 0.006 | ||||||
| pg123.cx6 | 99.915 | 0.080 | 0.004 | 0.001 | 0.012 |
Insert response time histogram: each cell has the percentage of responses that take <= the time in the header and max is the max response time in seconds. For max values in the top 25% of the range have a red background and in the bottom 25% of the range have a green background. The red background is not used when the min value is within 80% of the max value.
| dbms | 256us | 1ms | 4ms | 16ms | 64ms | 256ms | 1s | 4s | 16s | gt | max |
|---|---|---|---|---|---|---|---|---|---|---|---|
| pg123.cx0 | 94.410 | 5.292 | 0.299 | 0.048 | |||||||
| pg123.cx1 | 98.236 | 1.726 | 0.038 | 0.017 | |||||||
| pg123.cx2 | 2.358 | 97.642 | 0.036 | ||||||||
| pg123.cx3a | 53.052 | 46.948 | 0.036 | ||||||||
| pg123.cx3b | 54.774 | 45.226 | 0.033 | ||||||||
| pg123.cx3c | 55.128 | 44.872 | 0.032 | ||||||||
| pg123.cx3d | 54.809 | 45.191 | 0.033 | ||||||||
| pg123.cx4a | 54.542 | 45.458 | 0.037 | ||||||||
| pg123.cx4b | 55.031 | 44.965 | 0.003 | 0.065 | |||||||
| pg123.cx5 | 97.510 | 2.476 | 0.014 | 0.016 | |||||||
| pg123.cx6 | 55.399 | 44.601 | 0.033 |
Performance metrics for the DBMS listed above. Some are normalized by throughput, others are not. Legend for results is here.
ips	qps	rps	rkbps	wkbps	rpq	rkbpq	wkbpi	csps	cpups	cspq	cpupq	dbgb1	dbgb2	rss	maxop	p50	p99	tag
799	7353	0	0	29651	0.000	0.000	37.129	28652	26.2	3.897	143	11.3	12.3	0.0	0.043	7400	5132	pg123.cx0
799	7757	4	36	27929	0.001	0.005	34.973	30136	26.3	3.885	136	11.3	12.3	0.0	0.017	7767	7624	pg123.cx1
799	7670	4	36	20599	0.001	0.005	25.794	29752	34.7	3.879	181	11.3	12.3	0.0	0.014	7688	7495	pg123.cx2
799	7670	4	36	14692	0.001	0.005	18.397	29715	32.1	3.874	167	11.3	13.3	0.0	0.017	7687	7496	pg123.cx3a
799	7628	7	57	14660	0.001	0.007	18.357	29574	32.0	3.877	168	11.3	13.4	0.0	0.013	7640	7464	pg123.cx3b
799	7701	7	57	14446	0.001	0.007	18.089	29854	32.0	3.876	166	11.3	13.4	0.0	0.019	7704	7544	pg123.cx3c
799	7699	4	36	14554	0.001	0.005	18.225	29841	31.9	3.876	166	11.3	13.4	0.0	0.012	7704	7533	pg123.cx3d
799	7738	4	37	14801	0.001	0.005	18.534	29999	32.0	3.877	165	11.3	13.4	0.0	0.013	7751	7560	pg123.cx4a
799	7690	4	36	279115	0.001	0.005	349.287	29820	32.0	3.877	166	11.3	13.4	0.0	0.013	7691	7544	pg123.cx4b
799	7682	4	36	17563	0.001	0.005	21.992	29826	26.2	3.882	136	11.3	14.8	0.0	0.006	7688	7528	pg123.cx5
799	7680	0	1	18705	0.000	0.000	23.408	29803	32.2	3.880	168	11.3	13.4	0.0	0.012	7688	7544	pg123.cx6
q1000.2
q1000.2: range queries with 1000 insert/s per client, 2nd loop. Graphs for performance per 1-second interval are here.
Average throughput:
Query response time histogram: each cell has the percentage of responses that take <= the time in the header and max is the max response time in seconds. For max values in the top 25% of the range have a red background and in the bottom 25% of the range have a green background. The red background is not used when the min value is within 80% of the max value.
| dbms | 256us | 1ms | 4ms | 16ms | 64ms | 256ms | 1s | 4s | 16s | gt | max |
|---|---|---|---|---|---|---|---|---|---|---|---|
| pg123.cx0 | 99.658 | 0.324 | 0.016 | 0.001 | 0.001 | 0.052 | |||||
| pg123.cx1 | 99.881 | 0.102 | 0.016 | 0.001 | 0.013 | ||||||
| pg123.cx2 | 99.850 | 0.143 | 0.005 | 0.003 | 0.013 | ||||||
| pg123.cx3a | 99.896 | 0.097 | 0.004 | 0.003 | 0.013 | ||||||
| pg123.cx3b | 99.894 | 0.099 | 0.005 | 0.002 | 0.013 | ||||||
| pg123.cx3c | 99.894 | 0.099 | 0.005 | 0.002 | 0.012 | ||||||
| pg123.cx3d | 99.894 | 0.099 | 0.005 | 0.002 | 0.013 | ||||||
| pg123.cx4a | 99.895 | 0.098 | 0.005 | 0.002 | 0.013 | ||||||
| pg123.cx4b | 99.897 | 0.096 | 0.005 | 0.002 | 0.013 | ||||||
| pg123.cx5 | 99.913 | 0.075 | 0.012 | nonzero | 0.007 | ||||||
| pg123.cx6 | 99.895 | 0.098 | 0.006 | 0.001 | 0.013 |
Insert response time histogram: each cell has the percentage of responses that take <= the time in the header and max is the max response time in seconds. For max values in the top 25% of the range have a red background and in the bottom 25% of the range have a green background. The red background is not used when the min value is within 80% of the max value.
| dbms | 256us | 1ms | 4ms | 16ms | 64ms | 256ms | 1s | 4s | 16s | gt | max |
|---|---|---|---|---|---|---|---|---|---|---|---|
| pg123.cx0 | 93.467 | 6.217 | 0.289 | 0.028 | 0.172 | ||||||
| pg123.cx1 | 99.897 | 0.103 | 0.014 | ||||||||
| pg123.cx2 | 1.919 | 98.081 | 0.036 | ||||||||
| pg123.cx3a | 61.772 | 38.228 | 0.034 | ||||||||
| pg123.cx3b | 0.003 | 63.047 | 36.950 | 0.031 | |||||||
| pg123.cx3c | 63.031 | 36.969 | 0.031 | ||||||||
| pg123.cx3d | 62.725 | 37.275 | 0.031 | ||||||||
| pg123.cx4a | 62.842 | 37.158 | 0.030 | ||||||||
| pg123.cx4b | 63.083 | 36.917 | 0.031 | ||||||||
| pg123.cx5 | 99.861 | 0.139 | 0.016 | ||||||||
| pg123.cx6 | 62.994 | 37.006 | 0.033 |
Performance metrics for the DBMS listed above. Some are normalized by throughput, others are not. Legend for results is here.
ips	qps	rps	rkbps	wkbps	rpq	rkbpq	wkbpi	csps	cpups	cspq	cpupq	dbgb1	dbgb2	rss	maxop	p50	p99	tag
998	7313	0	0	36757	0.000	0.000	36.819	28621	26.4	3.914	144	12.0	13.0	0.0	0.052	7368	5034	pg123.cx0
998	7763	0	1	33892	0.000	0.000	33.950	30214	26.7	3.892	138	12.0	13.0	0.0	0.013	7768	7608	pg123.cx1
998	7670	6	55	24420	0.001	0.007	24.462	29808	36.9	3.887	192	12.0	13.0	0.0	0.013	7688	7496	pg123.cx2
998	7632	6	53	16642	0.001	0.007	16.671	29618	33.0	3.881	173	12.0	14.0	0.0	0.013	7642	7432	pg123.cx3a
998	7660	0	1	16311	0.000	0.000	16.339	29728	32.8	3.881	171	12.0	14.3	0.0	0.013	7672	7498	pg123.cx3b
998	7669	0	1	16149	0.000	0.000	16.176	29764	32.9	3.881	172	12.0	14.3	0.0	0.012	7674	7512	pg123.cx3c
998	7662	6	56	16329	0.001	0.007	16.357	29753	32.9	3.883	172	12.0	14.3	0.0	0.013	7672	7480	pg123.cx3d
998	7712	6	55	16262	0.001	0.007	16.290	29956	32.9	3.885	171	12.0	14.3	0.0	0.013	7720	7544	pg123.cx4a
998	7697	6	57	16165	0.001	0.007	16.192	29899	32.9	3.885	171	12.0	14.2	0.0	0.013	7704	7512	pg123.cx4b
998	7649	0	1	19468	0.000	0.000	19.501	29693	26.3	3.882	138	12.0	15.8	0.0	0.007	7656	7528	pg123.cx5
999	7690	0	1	21567	0.000	0.000	21.593	29882	33.2	3.886	173	12.0	14.2	0.0	0.013	7693	7544	pg123.cx6
l.i0
l.i0: load without secondary indexes
Performance metrics for all DBMS, not just the ones listed above. Some are normalized by throughput, others are not. Legend for results is here.
ips	qps	rps	rkbps	wkbps	rpq	rkbpq	wkbpi	csps	cpups	cspq	cpupq	dbgb1	dbgb2	rss	maxop	p50	p99	tag
101523	0	0	0	49434	0.000	0.000	0.487	12524	46.7	0.123	18	1.9	3.0	0.0	0.028	101725	96489	pg123.cx0
99502	0	0	0	49799	0.000	0.000	0.500	12211	46.1	0.123	19	1.9	3.0	0.0	0.021	100091	81026	pg123.cx1
100000	0	0	0	47824	0.000	0.000	0.478	12185	48.4	0.122	19	1.9	3.0	0.0	0.023	101189	80811	pg123.cx2
100000	0	0	0	59164	0.000	0.000	0.592	12360	46.9	0.124	19	1.9	4.0	0.0	0.020	100593	79612	pg123.cx3a
100502	0	0	0	64641	0.000	0.000	0.643	12496	46.5	0.124	19	1.9	5.2	0.0	0.005	101190	80252	pg123.cx3b
100502	0	0	0	62545	0.000	0.000	0.622	12490	46.5	0.124	19	1.9	5.2	0.0	0.005	101361	80212	pg123.cx3c
99010	0	0	0	63220	0.000	0.000	0.639	12280	45.6	0.124	18	1.9	5.2	0.0	0.006	99091	84802	pg123.cx3d
99502	0	0	0	64609	0.000	0.000	0.649	12356	45.9	0.124	18	1.9	5.2	0.0	0.009	99789	80712	pg123.cx4a
99502	0	0	0	64878	0.000	0.000	0.652	12454	46.2	0.125	19	1.9	5.2	0.0	0.008	100290	80412	pg123.cx4b
99502	0	0	0	64609	0.000	0.000	0.649	12323	45.8	0.124	18	1.9	5.2	0.0	0.009	99694	80828	pg123.cx5
101010	0	0	0	64851	0.000	0.000	0.642	12534	46.5	0.124	18	1.9	5.2	0.0	0.005	101488	80315	pg123.cx6
l.x
l.x: create secondary indexes
Performance metrics for all DBMS, not just the ones listed above. Some are normalized by throughput, others are not. Legend for results is here.
ips	qps	rps	rkbps	wkbps	rpq	rkbpq	wkbpi	csps	cpups	cspq	cpupq	dbgb1	dbgb2	rss	maxop	p50	p99	tag
283098	0	0	0	82377	0.000	0.000	0.291	1400	24.7	0.005	3	3.7	4.7	0.0	0.002	NA	NA	pg123.cx0
291304	0	0	0	99952	0.000	0.000	0.343	1319	25.5	0.005	4	3.7	4.7	0.0	0.002	NA	NA	pg123.cx1
128846	0	0	0	48203	0.000	0.000	0.374	667	24.7	0.005	8	3.7	4.7	0.0	0.002	NA	NA	pg123.cx2
134000	0	0	0	53385	0.000	0.000	0.398	706	24.6	0.005	7	3.7	5.7	0.0	0.002	NA	NA	pg123.cx3a
157031	0	0	0	65624	0.000	0.000	0.418	1104	24.6	0.007	6	3.7	7.9	0.0	0.002	NA	NA	pg123.cx3b
157031	0	0	0	65641	0.000	0.000	0.418	1095	24.7	0.007	6	3.7	7.9	0.0	0.002	NA	NA	pg123.cx3c
157031	0	0	0	68030	0.000	0.000	0.433	1099	24.5	0.007	6	3.7	7.9	0.0	0.002	NA	NA	pg123.cx3d
157031	0	0	0	65806	0.000	0.000	0.419	1095	24.6	0.007	6	3.7	7.9	0.0	0.002	NA	NA	pg123.cx4a
157031	0	0	0	65695	0.000	0.000	0.418	1094	24.8	0.007	6	3.7	7.9	0.0	0.002	NA	NA	pg123.cx4b
283098	0	0	0	106818	0.000	0.000	0.377	2378	24.6	0.008	3	3.7	8.6	0.0	0.002	NA	NA	pg123.cx5
155814	0	0	0	65186	0.000	0.000	0.418	1065	24.5	0.007	6	3.7	7.9	0.0	0.002	NA	NA	pg123.cx6
l.i1
l.i1: continue load after secondary indexes created
Performance metrics for all DBMS, not just the ones listed above. Some are normalized by throughput, others are not. Legend for results is here.
ips	qps	rps	rkbps	wkbps	rpq	rkbpq	wkbpi	csps	cpups	cspq	cpupq	dbgb1	dbgb2	rss	maxop	p50	p99	tag
10532	0	0	0	435861	0.000	0.000	41.385	4875	26.5	0.463	101	8.2	9.2	0.0	0.244	11985	2397	pg123.cx0
25413	0	0	0	613312	0.000	0.000	24.134	11619	36.4	0.457	57	8.2	13.0	0.0	0.325	26270	7741	pg123.cx1
2123	0	0	0	49871	0.000	0.000	23.490	941	25.7	0.443	484	8.2	9.2	0.0	0.072	1949	1249	pg123.cx2
5828	0	0	0	48126	0.000	0.000	8.258	1793	26.6	0.308	183	8.2	10.2	0.0	0.049	2949	1249	pg123.cx3a
27624	0	0	0	54060	0.000	0.000	1.957	6931	32.0	0.251	46	8.2	15.5	0.0	0.373	35561	1448	pg123.cx3b
27662	0	0	0	53994	0.000	0.000	1.952	6928	32.0	0.250	46	8.2	15.5	0.0	0.171	35462	1400	pg123.cx3c
27510	0	0	0	53320	0.000	0.000	1.938	6904	32.0	0.251	47	8.2	15.4	0.0	0.058	35311	1448	pg123.cx3d
27548	0	0	0	52705	0.000	0.000	1.913	6923	32.0	0.251	46	8.2	15.4	0.0	0.286	35275	1448	pg123.cx4a
27586	0	0	0	53163	0.000	0.000	1.927	6980	32.1	0.253	47	8.2	15.4	0.0	0.147	35489	1400	pg123.cx4b
38760	0	0	0	89451	0.000	0.000	2.308	9935	34.9	0.256	36	8.2	19.5	0.0	0.487	40356	12734	pg123.cx5
24420	0	28	280	153939	0.001	0.011	6.304	7062	33.7	0.289	55	8.2	14.7	0.0	0.047	30368	1499	pg123.cx6
q100.2
q100.2: range queries with 100 insert/s per client, 2nd loop
Performance metrics for all DBMS, not just the ones listed above. Some are normalized by throughput, others are not. Legend for results is here.
ips	qps	rps	rkbps	wkbps	rpq	rkbpq	wkbpi	csps	cpups	cspq	cpupq	dbgb1	dbgb2	rss	maxop	p50	p99	tag
100	7578	0	0	4341	0.000	0.000	43.500	29186	25.2	3.851	133	8.2	9.3	0.0	0.007	7576	7496	pg123.cx0
100	7750	0	0	4541	0.000	0.000	45.505	29837	25.1	3.850	130	8.2	9.3	0.0	0.004	7752	7655	pg123.cx1
100	7750	0	0	3283	0.000	0.000	32.899	29850	27.0	3.851	139	8.2	9.0	0.0	0.015	7752	7656	pg123.cx2
100	7715	0	0	3469	0.000	0.000	34.761	29716	27.0	3.852	140	8.2	9.3	0.0	0.013	7720	7624	pg123.cx3a
100	7707	0	0	4289	0.000	0.000	42.978	29684	27.0	3.852	140	8.2	12.5	0.0	0.013	7719	7608	pg123.cx3b
100	7755	0	0	4286	0.000	0.000	42.948	29868	26.9	3.851	139	8.2	12.5	0.0	0.013	7767	7656	pg123.cx3c
100	7710	0	0	4217	0.000	0.000	42.251	29694	27.0	3.851	140	8.2	12.4	0.0	0.012	7719	7608	pg123.cx3d
100	7783	0	0	4223	0.000	0.000	42.313	29976	27.0	3.851	139	8.2	12.4	0.0	0.013	7784	7672	pg123.cx4a
100	7755	0	0	4305	0.000	0.000	43.137	29864	27.0	3.851	139	8.2	12.5	0.0	0.014	7758	7656	pg123.cx4b
100	7666	0	0	5884	0.000	0.000	58.958	29514	25.1	3.850	131	8.2	14.2	0.0	0.004	7672	7576	pg123.cx5
100	7744	0	0	4224	0.000	0.000	42.325	29829	27.1	3.852	140	8.2	11.7	0.0	0.010	7751	7656	pg123.cx6
q200.2
q200.2: range queries with 200 insert/s per client, 2nd loop
Performance metrics for all DBMS, not just the ones listed above. Some are normalized by throughput, others are not. Legend for results is here.
ips	qps	rps	rkbps	wkbps	rpq	rkbpq	wkbpi	csps	cpups	cspq	cpupq	dbgb1	dbgb2	rss	maxop	p50	p99	tag
200	7541	0	0	8537	0.000	0.000	42.772	29082	25.4	3.857	135	8.4	9.4	0.0	0.004	7544	7464	pg123.cx0
200	7760	0	0	7908	0.000	0.000	39.617	29902	25.3	3.853	130	8.4	9.4	0.0	0.009	7767	7656	pg123.cx1
200	7679	0	0	5594	0.000	0.000	28.027	29611	28.6	3.856	149	8.4	9.3	0.0	0.013	7687	7576	pg123.cx2
200	7698	0	0	5618	0.000	0.000	28.146	29681	28.8	3.856	150	8.4	9.4	0.0	0.019	7703	7599	pg123.cx3a
200	7708	0	0	5864	0.000	0.000	29.380	29724	28.6	3.856	148	8.4	9.9	0.0	0.011	7719	7608	pg123.cx3b
200	7729	0	0	5884	0.000	0.000	29.479	29803	28.5	3.856	147	8.4	9.9	0.0	0.013	7735	7624	pg123.cx3c
200	7714	0	0	5838	0.000	0.000	29.247	29746	28.6	3.856	148	8.4	9.9	0.0	0.014	7719	7608	pg123.cx3d
200	7758	0	0	5869	0.000	0.000	29.405	29909	28.5	3.855	147	8.4	9.9	0.0	0.018	7767	7656	pg123.cx4a
200	7689	0	0	5944	0.000	0.000	29.779	29649	28.5	3.856	148	8.4	9.9	0.0	0.012	7688	7592	pg123.cx4b
200	7671	0	0	7487	0.000	0.000	37.508	29556	25.3	3.853	132	8.4	10.9	0.0	0.004	7672	7565	pg123.cx5
200	7686	0	0	6213	0.000	0.000	31.125	29640	28.8	3.856	150	8.4	9.8	0.0	0.012	7688	7594	pg123.cx6
q400.2
q400.2: range queries with 400 insert/s per client, 2nd loop
Performance metrics for all DBMS, not just the ones listed above. Some are normalized by throughput, others are not. Legend for results is here.
ips	qps	rps	rkbps	wkbps	rpq	rkbpq	wkbpi	csps	cpups	cspq	cpupq	dbgb1	dbgb2	rss	maxop	p50	p99	tag
399	7549	0	0	17131	0.000	0.000	42.902	29229	25.7	3.872	136	8.8	9.9	0.0	0.021	7560	7432	pg123.cx0
399	7720	0	0	15658	0.000	0.000	39.214	29825	25.7	3.864	133	8.8	9.9	0.0	0.011	7720	7624	pg123.cx1
399	7649	0	0	11147	0.000	0.000	27.916	29548	31.8	3.863	166	8.8	9.9	0.0	0.019	7656	7512	pg123.cx2
399	7674	0	0	9213	0.000	0.000	23.073	29646	30.9	3.863	161	8.8	10.4	0.0	0.013	7672	7560	pg123.cx3a
399	7688	0	0	9365	0.000	0.000	23.453	29703	30.8	3.863	160	8.8	10.4	0.0	0.015	7690	7560	pg123.cx3b
399	7698	0	0	9298	0.000	0.000	23.286	29740	30.8	3.863	160	8.8	10.4	0.0	0.020	7704	7566	pg123.cx3c
399	7564	0	0	9270	0.000	0.000	23.215	29234	30.7	3.865	162	8.8	10.4	0.0	0.014	7576	7448	pg123.cx3d
399	7730	0	0	9276	0.000	0.000	23.232	29873	30.8	3.864	159	8.8	10.4	0.0	0.018	7735	7608	pg123.cx4a
399	7681	0	0	9314	0.000	0.000	23.326	29689	30.7	3.865	160	8.8	10.4	0.0	0.013	7688	7544	pg123.cx4b
399	7636	0	0	11608	0.000	0.000	29.070	29477	25.6	3.860	134	8.8	11.4	0.0	0.005	7640	7528	pg123.cx5
399	7696	0	0	10139	0.000	0.000	25.393	29746	30.9	3.865	161	8.8	10.4	0.0	0.011	7703	7592	pg123.cx6
q600.2
q600.2: range queries with 600 insert/s per client, 2nd loop
Performance metrics for all DBMS, not just the ones listed above. Some are normalized by throughput, others are not. Legend for results is here.
ips	qps	rps	rkbps	wkbps	rpq	rkbpq	wkbpi	csps	cpups	cspq	cpupq	dbgb1	dbgb2	rss	maxop	p50	p99	tag
599	7391	0	0	24877	0.000	0.000	41.531	28736	26.0	3.888	141	10.0	11.0	0.0	0.038	7400	7112	pg123.cx0
599	7704	0	0	23412	0.000	0.000	39.085	29857	26.2	3.875	136	10.0	11.0	0.0	0.012	7719	7560	pg123.cx1
599	7653	0	0	17066	0.000	0.000	28.491	29636	34.2	3.872	179	10.0	11.0	0.0	0.013	7659	7528	pg123.cx2
599	7650	0	0	12698	0.000	0.000	21.189	29579	31.9	3.866	167	10.0	11.9	0.0	0.013	7656	7496	pg123.cx3a
599	7674	0	0	12387	0.000	0.000	20.679	29697	31.8	3.870	166	10.0	11.9	0.0	0.012	7688	7528	pg123.cx3b
599	7669	0	0	12423	0.000	0.000	20.740	29678	31.8	3.870	166	10.0	11.9	0.0	0.013	7672	7528	pg123.cx3c
599	7644	0	0	13030	0.000	0.000	21.753	29584	31.8	3.870	166	10.0	11.9	0.0	0.013	7656	7495	pg123.cx3d
599	7728	0	0	12384	0.000	0.000	20.675	29917	31.8	3.871	165	10.0	11.9	0.0	0.012	7736	7576	pg123.cx4a
599	7691	0	0	12487	0.000	0.000	20.846	29778	31.8	3.872	165	10.0	11.9	0.0	0.012	7703	7544	pg123.cx4b
599	7652	0	0	15141	0.000	0.000	25.278	29597	25.9	3.868	135	10.0	13.3	0.0	0.006	7656	7544	pg123.cx5
599	7679	0	0	14773	0.000	0.000	24.662	29767	32.0	3.876	167	10.0	11.9	0.0	0.013	7688	7544	pg123.cx6
q800.2
q800.2: range queries with 800 insert/s per client, 2nd loop
Performance metrics for all DBMS, not just the ones listed above. Some are normalized by throughput, others are not. Legend for results is here.
ips	qps	rps	rkbps	wkbps	rpq	rkbpq	wkbpi	csps	cpups	cspq	cpupq	dbgb1	dbgb2	rss	maxop	p50	p99	tag
799	7353	0	0	29651	0.000	0.000	37.129	28652	26.2	3.897	143	11.3	12.3	0.0	0.043	7400	5132	pg123.cx0
799	7757	4	36	27929	0.001	0.005	34.973	30136	26.3	3.885	136	11.3	12.3	0.0	0.017	7767	7624	pg123.cx1
799	7670	4	36	20599	0.001	0.005	25.794	29752	34.7	3.879	181	11.3	12.3	0.0	0.014	7688	7495	pg123.cx2
799	7670	4	36	14692	0.001	0.005	18.397	29715	32.1	3.874	167	11.3	13.3	0.0	0.017	7687	7496	pg123.cx3a
799	7628	7	57	14660	0.001	0.007	18.357	29574	32.0	3.877	168	11.3	13.4	0.0	0.013	7640	7464	pg123.cx3b
799	7701	7	57	14446	0.001	0.007	18.089	29854	32.0	3.876	166	11.3	13.4	0.0	0.019	7704	7544	pg123.cx3c
799	7699	4	36	14554	0.001	0.005	18.225	29841	31.9	3.876	166	11.3	13.4	0.0	0.012	7704	7533	pg123.cx3d
799	7738	4	37	14801	0.001	0.005	18.534	29999	32.0	3.877	165	11.3	13.4	0.0	0.013	7751	7560	pg123.cx4a
799	7690	4	36	279115	0.001	0.005	349.287	29820	32.0	3.877	166	11.3	13.4	0.0	0.013	7691	7544	pg123.cx4b
799	7682	4	36	17563	0.001	0.005	21.992	29826	26.2	3.882	136	11.3	14.8	0.0	0.006	7688	7528	pg123.cx5
799	7680	0	1	18705	0.000	0.000	23.408	29803	32.2	3.880	168	11.3	13.4	0.0	0.012	7688	7544	pg123.cx6
q1000.2
q1000.2: range queries with 1000 insert/s per client, 2nd loop
Performance metrics for all DBMS, not just the ones listed above. Some are normalized by throughput, others are not. Legend for results is here.
ips	qps	rps	rkbps	wkbps	rpq	rkbpq	wkbpi	csps	cpups	cspq	cpupq	dbgb1	dbgb2	rss	maxop	p50	p99	tag
998	7313	0	0	36757	0.000	0.000	36.819	28621	26.4	3.914	144	12.0	13.0	0.0	0.052	7368	5034	pg123.cx0
998	7763	0	1	33892	0.000	0.000	33.950	30214	26.7	3.892	138	12.0	13.0	0.0	0.013	7768	7608	pg123.cx1
998	7670	6	55	24420	0.001	0.007	24.462	29808	36.9	3.887	192	12.0	13.0	0.0	0.013	7688	7496	pg123.cx2
998	7632	6	53	16642	0.001	0.007	16.671	29618	33.0	3.881	173	12.0	14.0	0.0	0.013	7642	7432	pg123.cx3a
998	7660	0	1	16311	0.000	0.000	16.339	29728	32.8	3.881	171	12.0	14.3	0.0	0.013	7672	7498	pg123.cx3b
998	7669	0	1	16149	0.000	0.000	16.176	29764	32.9	3.881	172	12.0	14.3	0.0	0.012	7674	7512	pg123.cx3c
998	7662	6	56	16329	0.001	0.007	16.357	29753	32.9	3.883	172	12.0	14.3	0.0	0.013	7672	7480	pg123.cx3d
998	7712	6	55	16262	0.001	0.007	16.290	29956	32.9	3.885	171	12.0	14.3	0.0	0.013	7720	7544	pg123.cx4a
998	7697	6	57	16165	0.001	0.007	16.192	29899	32.9	3.885	171	12.0	14.2	0.0	0.013	7704	7512	pg123.cx4b
998	7649	0	1	19468	0.000	0.000	19.501	29693	26.3	3.882	138	12.0	15.8	0.0	0.007	7656	7528	pg123.cx5
999	7690	0	1	21567	0.000	0.000	21.593	29882	33.2	3.886	173	12.0	14.2	0.0	0.013	7693	7544	pg123.cx6
l.i0
- l.i0: load without secondary indexes
- Legend for results is here.
- Each entry lists the percentage of responses that fit in that bucket (slower than max time for previous bucket, faster than min time for next bucket).
Insert response time histogram
256us	1ms	4ms	16ms	64ms	256ms	1s	4s	16s	gt	max	tag
0.000	87.536	12.461	0.002	0.001	0.000	0.000	0.000	0.000	0.000	0.028	pg123.cx0
0.000	82.558	17.437	0.004	0.001	0.000	0.000	0.000	0.000	0.000	0.021	pg123.cx1
0.000	86.166	13.829	0.004	0.001	0.000	0.000	0.000	0.000	0.000	0.023	pg123.cx2
0.000	84.323	15.676	0.001	0.001	0.000	0.000	0.000	0.000	0.000	0.020	pg123.cx3a
0.000	86.224	13.776	0.001	0.000	0.000	0.000	0.000	0.000	0.000	0.005	pg123.cx3b
0.000	87.532	12.466	0.002	0.000	0.000	0.000	0.000	0.000	0.000	0.005	pg123.cx3c
0.000	75.791	24.209	0.001	0.000	0.000	0.000	0.000	0.000	0.000	0.006	pg123.cx3d
0.000	80.856	19.141	0.003	0.000	0.000	0.000	0.000	0.000	0.000	0.009	pg123.cx4a
0.000	82.467	17.533	0.001	0.000	0.000	0.000	0.000	0.000	0.000	0.008	pg123.cx4b
0.000	80.027	19.971	0.002	0.000	0.000	0.000	0.000	0.000	0.000	0.009	pg123.cx5
0.000	86.948	13.051	0.002	0.000	0.000	0.000	0.000	0.000	0.000	0.005	pg123.cx6
l.x
- l.x: create secondary indexes
- Legend for results is here.
- Each entry lists the percentage of responses that fit in that bucket (slower than max time for previous bucket, faster than min time for next bucket).
TODO - determine whether there is data for create index response time
l.i1
- l.i1: continue load after secondary indexes created
- Legend for results is here.
- Each entry lists the percentage of responses that fit in that bucket (slower than max time for previous bucket, faster than min time for next bucket).
Insert response time histogram
256us	1ms	4ms	16ms	64ms	256ms	1s	4s	16s	gt	max	tag
0.000	0.000	81.159	16.611	1.736	0.493	0.000	0.000	0.000	0.000	0.244	pg123.cx0
0.000	0.000	95.796	3.341	0.786	0.076	nonzero	0.000	0.000	0.000	0.325	pg123.cx1
0.000	0.000	0.000	15.848	84.152	0.001	0.000	0.000	0.000	0.000	0.072	pg123.cx2
0.000	0.000	44.874	36.858	18.268	0.000	0.000	0.000	0.000	0.000	0.049	pg123.cx3a
0.000	0.000	96.076	2.676	1.248	nonzero	nonzero	0.000	0.000	0.000	0.373	pg123.cx3b
0.000	0.000	96.091	2.660	1.249	nonzero	0.000	0.000	0.000	0.000	0.171	pg123.cx3c
0.000	0.000	96.085	2.671	1.244	0.000	0.000	0.000	0.000	0.000	0.058	pg123.cx3d
0.000	0.000	96.106	2.646	1.248	0.001	nonzero	0.000	0.000	0.000	0.286	pg123.cx4a
0.000	0.000	96.095	2.655	1.249	nonzero	0.000	0.000	0.000	0.000	0.147	pg123.cx4b
0.000	0.000	99.863	0.111	0.024	0.001	nonzero	0.000	0.000	0.000	0.487	pg123.cx5
0.000	0.000	96.084	2.726	1.191	0.000	0.000	0.000	0.000	0.000	0.047	pg123.cx6
q100.2
- q100.2: range queries with 100 insert/s per client, 2nd loop
- Legend for results is here.
- Each entry lists the percentage of responses that fit in that bucket (slower than max time for previous bucket, faster than min time for next bucket).
Query response time histogram
256us	1ms	4ms	16ms	64ms	256ms	1s	4s	16s	gt	max	tag
99.978	0.021	0.001	nonzero	0.000	0.000	0.000	0.000	0.000	0.000	0.007	pg123.cx0
99.985	0.014	0.001	0.000	0.000	0.000	0.000	0.000	0.000	0.000	0.004	pg123.cx1
99.986	0.014	nonzero	nonzero	0.000	0.000	0.000	0.000	0.000	0.000	0.015	pg123.cx2
99.985	0.014	nonzero	nonzero	0.000	0.000	0.000	0.000	0.000	0.000	0.013	pg123.cx3a
99.985	0.015	nonzero	nonzero	0.000	0.000	0.000	0.000	0.000	0.000	0.013	pg123.cx3b
99.985	0.015	nonzero	nonzero	0.000	0.000	0.000	0.000	0.000	0.000	0.013	pg123.cx3c
99.984	0.016	nonzero	nonzero	0.000	0.000	0.000	0.000	0.000	0.000	0.012	pg123.cx3d
99.985	0.015	nonzero	nonzero	0.000	0.000	0.000	0.000	0.000	0.000	0.013	pg123.cx4a
99.985	0.015	nonzero	nonzero	0.000	0.000	0.000	0.000	0.000	0.000	0.014	pg123.cx4b
99.986	0.014	0.001	0.000	0.000	0.000	0.000	0.000	0.000	0.000	0.004	pg123.cx5
99.986	0.014	nonzero	nonzero	0.000	0.000	0.000	0.000	0.000	0.000	0.010	pg123.cx6
Insert response time histogram
256us	1ms	4ms	16ms	64ms	256ms	1s	4s	16s	gt	max	tag
0.000	0.000	99.972	0.028	0.000	0.000	0.000	0.000	0.000	0.000	0.004	pg123.cx0
0.000	0.000	99.944	0.056	0.000	0.000	0.000	0.000	0.000	0.000	0.006	pg123.cx1
0.000	0.000	0.000	0.000	100.000	0.000	0.000	0.000	0.000	0.000	0.050	pg123.cx2
0.000	0.000	0.000	0.000	100.000	0.000	0.000	0.000	0.000	0.000	0.044	pg123.cx3a
0.000	0.000	0.000	0.000	100.000	0.000	0.000	0.000	0.000	0.000	0.044	pg123.cx3b
0.000	0.000	0.000	0.000	100.000	0.000	0.000	0.000	0.000	0.000	0.043	pg123.cx3c
0.000	0.000	0.000	0.000	100.000	0.000	0.000	0.000	0.000	0.000	0.046	pg123.cx3d
0.000	0.000	0.000	0.000	100.000	0.000	0.000	0.000	0.000	0.000	0.043	pg123.cx4a
0.000	0.000	0.000	0.000	100.000	0.000	0.000	0.000	0.000	0.000	0.044	pg123.cx4b
0.000	0.000	99.972	0.028	0.000	0.000	0.000	0.000	0.000	0.000	0.006	pg123.cx5
0.000	0.000	0.000	0.000	100.000	0.000	0.000	0.000	0.000	0.000	0.043	pg123.cx6
q200.2
- q200.2: range queries with 200 insert/s per client, 2nd loop
- Legend for results is here.
- Each entry lists the percentage of responses that fit in that bucket (slower than max time for previous bucket, faster than min time for next bucket).
Query response time histogram
256us	1ms	4ms	16ms	64ms	256ms	1s	4s	16s	gt	max	tag
99.974	0.024	0.002	0.000	0.000	0.000	0.000	0.000	0.000	0.000	0.004	pg123.cx0
99.985	0.014	0.001	nonzero	0.000	0.000	0.000	0.000	0.000	0.000	0.009	pg123.cx1
99.980	0.019	0.001	nonzero	0.000	0.000	0.000	0.000	0.000	0.000	0.013	pg123.cx2
99.979	0.020	nonzero	nonzero	nonzero	0.000	0.000	0.000	0.000	0.000	0.019	pg123.cx3a
99.981	0.019	nonzero	nonzero	0.000	0.000	0.000	0.000	0.000	0.000	0.011	pg123.cx3b
99.979	0.020	nonzero	nonzero	0.000	0.000	0.000	0.000	0.000	0.000	0.013	pg123.cx3c
99.977	0.022	nonzero	nonzero	0.000	0.000	0.000	0.000	0.000	0.000	0.014	pg123.cx3d
99.980	0.019	nonzero	nonzero	nonzero	0.000	0.000	0.000	0.000	0.000	0.018	pg123.cx4a
99.980	0.020	nonzero	nonzero	0.000	0.000	0.000	0.000	0.000	0.000	0.012	pg123.cx4b
99.983	0.015	0.002	nonzero	0.000	0.000	0.000	0.000	0.000	0.000	0.004	pg123.cx5
99.978	0.021	0.001	nonzero	0.000	0.000	0.000	0.000	0.000	0.000	0.012	pg123.cx6
Insert response time histogram
256us	1ms	4ms	16ms	64ms	256ms	1s	4s	16s	gt	max	tag
0.000	0.000	99.931	0.069	0.000	0.000	0.000	0.000	0.000	0.000	0.012	pg123.cx0
0.000	0.000	99.986	0.014	0.000	0.000	0.000	0.000	0.000	0.000	0.006	pg123.cx1
0.000	0.000	0.000	0.000	100.000	0.000	0.000	0.000	0.000	0.000	0.046	pg123.cx2
0.000	0.000	0.000	0.000	100.000	0.000	0.000	0.000	0.000	0.000	0.046	pg123.cx3a
0.000	0.000	0.000	0.000	100.000	0.000	0.000	0.000	0.000	0.000	0.047	pg123.cx3b
0.000	0.000	0.000	0.000	100.000	0.000	0.000	0.000	0.000	0.000	0.045	pg123.cx3c
0.000	0.000	0.000	0.000	100.000	0.000	0.000	0.000	0.000	0.000	0.043	pg123.cx3d
0.000	0.000	0.000	0.000	100.000	0.000	0.000	0.000	0.000	0.000	0.044	pg123.cx4a
0.000	0.000	0.000	0.000	100.000	0.000	0.000	0.000	0.000	0.000	0.045	pg123.cx4b
0.000	0.000	99.986	0.014	0.000	0.000	0.000	0.000	0.000	0.000	0.006	pg123.cx5
0.000	0.000	0.000	0.000	100.000	0.000	0.000	0.000	0.000	0.000	0.044	pg123.cx6
q400.2
- q400.2: range queries with 400 insert/s per client, 2nd loop
- Legend for results is here.
- Each entry lists the percentage of responses that fit in that bucket (slower than max time for previous bucket, faster than min time for next bucket).
Query response time histogram
256us	1ms	4ms	16ms	64ms	256ms	1s	4s	16s	gt	max	tag
99.931	0.065	0.004	nonzero	nonzero	0.000	0.000	0.000	0.000	0.000	0.021	pg123.cx0
99.966	0.030	0.004	nonzero	0.000	0.000	0.000	0.000	0.000	0.000	0.011	pg123.cx1
99.951	0.046	0.002	0.001	nonzero	0.000	0.000	0.000	0.000	0.000	0.019	pg123.cx2
99.961	0.036	0.002	0.001	0.000	0.000	0.000	0.000	0.000	0.000	0.013	pg123.cx3a
99.959	0.038	0.003	0.001	0.000	0.000	0.000	0.000	0.000	0.000	0.015	pg123.cx3b
99.958	0.038	0.003	0.001	nonzero	0.000	0.000	0.000	0.000	0.000	0.020	pg123.cx3c
99.956	0.041	0.003	0.001	0.000	0.000	0.000	0.000	0.000	0.000	0.014	pg123.cx3d
99.958	0.039	0.002	0.001	nonzero	0.000	0.000	0.000	0.000	0.000	0.018	pg123.cx4a
99.958	0.039	0.003	0.001	0.000	0.000	0.000	0.000	0.000	0.000	0.013	pg123.cx4b
99.970	0.026	0.004	nonzero	0.000	0.000	0.000	0.000	0.000	0.000	0.005	pg123.cx5
99.955	0.041	0.003	0.001	0.000	0.000	0.000	0.000	0.000	0.000	0.011	pg123.cx6
Insert response time histogram
256us	1ms	4ms	16ms	64ms	256ms	1s	4s	16s	gt	max	tag
0.000	0.000	92.368	7.451	0.181	0.000	0.000	0.000	0.000	0.000	0.053	pg123.cx0
0.000	0.000	99.979	0.021	0.000	0.000	0.000	0.000	0.000	0.000	0.006	pg123.cx1
0.000	0.000	0.000	0.000	100.000	0.000	0.000	0.000	0.000	0.000	0.048	pg123.cx2
0.000	0.000	0.000	2.514	97.486	0.000	0.000	0.000	0.000	0.000	0.049	pg123.cx3a
0.000	0.000	0.000	3.083	96.917	0.000	0.000	0.000	0.000	0.000	0.046	pg123.cx3b
0.000	0.000	0.000	3.319	96.681	0.000	0.000	0.000	0.000	0.000	0.045	pg123.cx3c
0.000	0.000	0.000	3.076	96.924	0.000	0.000	0.000	0.000	0.000	0.045	pg123.cx3d
0.000	0.000	0.000	3.125	96.875	0.000	0.000	0.000	0.000	0.000	0.054	pg123.cx4a
0.000	0.000	0.000	3.153	96.847	0.000	0.000	0.000	0.000	0.000	0.045	pg123.cx4b
0.000	0.000	99.993	0.007	0.000	0.000	0.000	0.000	0.000	0.000	0.006	pg123.cx5
0.000	0.000	0.000	2.660	97.340	0.000	0.000	0.000	0.000	0.000	0.044	pg123.cx6
q600.2
- q600.2: range queries with 600 insert/s per client, 2nd loop
- Legend for results is here.
- Each entry lists the percentage of responses that fit in that bucket (slower than max time for previous bucket, faster than min time for next bucket).
Query response time histogram
256us	1ms	4ms	16ms	64ms	256ms	1s	4s	16s	gt	max	tag
99.887	0.105	0.008	nonzero	nonzero	0.000	0.000	0.000	0.000	0.000	0.038	pg123.cx0
99.938	0.054	0.008	nonzero	0.000	0.000	0.000	0.000	0.000	0.000	0.012	pg123.cx1
99.916	0.079	0.003	0.001	0.000	0.000	0.000	0.000	0.000	0.000	0.013	pg123.cx2
99.936	0.060	0.003	0.001	0.000	0.000	0.000	0.000	0.000	0.000	0.013	pg123.cx3a
99.931	0.064	0.004	0.001	0.000	0.000	0.000	0.000	0.000	0.000	0.012	pg123.cx3b
99.938	0.057	0.004	0.001	0.000	0.000	0.000	0.000	0.000	0.000	0.013	pg123.cx3c
99.937	0.059	0.003	0.001	0.000	0.000	0.000	0.000	0.000	0.000	0.013	pg123.cx3d
99.933	0.062	0.004	0.001	0.000	0.000	0.000	0.000	0.000	0.000	0.012	pg123.cx4a
99.936	0.059	0.004	0.001	0.000	0.000	0.000	0.000	0.000	0.000	0.012	pg123.cx4b
99.951	0.042	0.007	nonzero	0.000	0.000	0.000	0.000	0.000	0.000	0.006	pg123.cx5
99.936	0.059	0.004	0.001	0.000	0.000	0.000	0.000	0.000	0.000	0.013	pg123.cx6
Insert response time histogram
256us	1ms	4ms	16ms	64ms	256ms	1s	4s	16s	gt	max	tag
0.000	0.000	89.398	10.338	0.264	0.000	0.000	0.000	0.000	0.000	0.052	pg123.cx0
0.000	0.000	99.898	0.102	0.000	0.000	0.000	0.000	0.000	0.000	0.012	pg123.cx1
0.000	0.000	0.000	0.014	99.986	0.000	0.000	0.000	0.000	0.000	0.043	pg123.cx2
0.000	0.000	0.000	30.778	69.222	0.000	0.000	0.000	0.000	0.000	0.042	pg123.cx3a
0.000	0.000	0.000	31.782	68.218	0.000	0.000	0.000	0.000	0.000	0.041	pg123.cx3b
0.000	0.000	0.000	32.352	67.648	0.000	0.000	0.000	0.000	0.000	0.041	pg123.cx3c
0.000	0.000	0.000	31.204	68.796	0.000	0.000	0.000	0.000	0.000	0.049	pg123.cx3d
0.000	0.000	0.000	32.236	67.764	0.000	0.000	0.000	0.000	0.000	0.044	pg123.cx4a
0.000	0.000	0.000	32.153	67.847	0.000	0.000	0.000	0.000	0.000	0.042	pg123.cx4b
0.000	0.000	99.944	0.056	0.000	0.000	0.000	0.000	0.000	0.000	0.007	pg123.cx5
0.000	0.000	0.000	30.958	69.042	0.000	0.000	0.000	0.000	0.000	0.042	pg123.cx6
q800.2
- q800.2: range queries with 800 insert/s per client, 2nd loop
- Legend for results is here.
- Each entry lists the percentage of responses that fit in that bucket (slower than max time for previous bucket, faster than min time for next bucket).
Query response time histogram
256us	1ms	4ms	16ms	64ms	256ms	1s	4s	16s	gt	max	tag
99.725	0.263	0.011	nonzero	0.001	0.000	0.000	0.000	0.000	0.000	0.043	pg123.cx0
99.911	0.078	0.011	nonzero	nonzero	0.000	0.000	0.000	0.000	0.000	0.017	pg123.cx1
99.888	0.105	0.004	0.002	0.000	0.000	0.000	0.000	0.000	0.000	0.014	pg123.cx2
99.919	0.076	0.003	0.002	nonzero	0.000	0.000	0.000	0.000	0.000	0.017	pg123.cx3a
99.919	0.076	0.004	0.001	0.000	0.000	0.000	0.000	0.000	0.000	0.013	pg123.cx3b
99.920	0.075	0.004	0.001	nonzero	0.000	0.000	0.000	0.000	0.000	0.019	pg123.cx3c
99.918	0.077	0.004	0.001	0.000	0.000	0.000	0.000	0.000	0.000	0.012	pg123.cx3d
99.916	0.079	0.005	0.001	0.000	0.000	0.000	0.000	0.000	0.000	0.013	pg123.cx4a
99.918	0.076	0.004	0.001	0.000	0.000	0.000	0.000	0.000	0.000	0.013	pg123.cx4b
99.932	0.059	0.009	nonzero	0.000	0.000	0.000	0.000	0.000	0.000	0.006	pg123.cx5
99.915	0.080	0.004	0.001	0.000	0.000	0.000	0.000	0.000	0.000	0.012	pg123.cx6
Insert response time histogram
256us	1ms	4ms	16ms	64ms	256ms	1s	4s	16s	gt	max	tag
0.000	0.000	94.410	5.292	0.299	0.000	0.000	0.000	0.000	0.000	0.048	pg123.cx0
0.000	0.000	98.236	1.726	0.038	0.000	0.000	0.000	0.000	0.000	0.017	pg123.cx1
0.000	0.000	0.000	2.358	97.642	0.000	0.000	0.000	0.000	0.000	0.036	pg123.cx2
0.000	0.000	0.000	53.052	46.948	0.000	0.000	0.000	0.000	0.000	0.036	pg123.cx3a
0.000	0.000	0.000	54.774	45.226	0.000	0.000	0.000	0.000	0.000	0.033	pg123.cx3b
0.000	0.000	0.000	55.128	44.872	0.000	0.000	0.000	0.000	0.000	0.032	pg123.cx3c
0.000	0.000	0.000	54.809	45.191	0.000	0.000	0.000	0.000	0.000	0.033	pg123.cx3d
0.000	0.000	0.000	54.542	45.458	0.000	0.000	0.000	0.000	0.000	0.037	pg123.cx4a
0.000	0.000	0.000	55.031	44.965	0.003	0.000	0.000	0.000	0.000	0.065	pg123.cx4b
0.000	0.000	97.510	2.476	0.014	0.000	0.000	0.000	0.000	0.000	0.016	pg123.cx5
0.000	0.000	0.000	55.399	44.601	0.000	0.000	0.000	0.000	0.000	0.033	pg123.cx6
q1000.2
- q1000.2: range queries with 1000 insert/s per client, 2nd loop
- Legend for results is here.
- Each entry lists the percentage of responses that fit in that bucket (slower than max time for previous bucket, faster than min time for next bucket).
Query response time histogram
256us	1ms	4ms	16ms	64ms	256ms	1s	4s	16s	gt	max	tag
99.658	0.324	0.016	0.001	0.001	0.000	0.000	0.000	0.000	0.000	0.052	pg123.cx0
99.881	0.102	0.016	0.001	0.000	0.000	0.000	0.000	0.000	0.000	0.013	pg123.cx1
99.850	0.143	0.005	0.003	0.000	0.000	0.000	0.000	0.000	0.000	0.013	pg123.cx2
99.896	0.097	0.004	0.003	0.000	0.000	0.000	0.000	0.000	0.000	0.013	pg123.cx3a
99.894	0.099	0.005	0.002	0.000	0.000	0.000	0.000	0.000	0.000	0.013	pg123.cx3b
99.894	0.099	0.005	0.002	0.000	0.000	0.000	0.000	0.000	0.000	0.012	pg123.cx3c
99.894	0.099	0.005	0.002	0.000	0.000	0.000	0.000	0.000	0.000	0.013	pg123.cx3d
99.895	0.098	0.005	0.002	0.000	0.000	0.000	0.000	0.000	0.000	0.013	pg123.cx4a
99.897	0.096	0.005	0.002	0.000	0.000	0.000	0.000	0.000	0.000	0.013	pg123.cx4b
99.913	0.075	0.012	nonzero	0.000	0.000	0.000	0.000	0.000	0.000	0.007	pg123.cx5
99.895	0.098	0.006	0.001	0.000	0.000	0.000	0.000	0.000	0.000	0.013	pg123.cx6
Insert response time histogram
256us	1ms	4ms	16ms	64ms	256ms	1s	4s	16s	gt	max	tag
0.000	0.000	93.467	6.217	0.289	0.028	0.000	0.000	0.000	0.000	0.172	pg123.cx0
0.000	0.000	99.897	0.103	0.000	0.000	0.000	0.000	0.000	0.000	0.014	pg123.cx1
0.000	0.000	0.000	1.919	98.081	0.000	0.000	0.000	0.000	0.000	0.036	pg123.cx2
0.000	0.000	0.000	61.772	38.228	0.000	0.000	0.000	0.000	0.000	0.034	pg123.cx3a
0.000	0.000	0.003	63.047	36.950	0.000	0.000	0.000	0.000	0.000	0.031	pg123.cx3b
0.000	0.000	0.000	63.031	36.969	0.000	0.000	0.000	0.000	0.000	0.031	pg123.cx3c
0.000	0.000	0.000	62.725	37.275	0.000	0.000	0.000	0.000	0.000	0.031	pg123.cx3d
0.000	0.000	0.000	62.842	37.158	0.000	0.000	0.000	0.000	0.000	0.030	pg123.cx4a
0.000	0.000	0.000	63.083	36.917	0.000	0.000	0.000	0.000	0.000	0.031	pg123.cx4b
0.000	0.000	99.861	0.139	0.000	0.000	0.000	0.000	0.000	0.000	0.016	pg123.cx5
0.000	0.000	0.000	62.994	37.006	0.000	0.000	0.000	0.000	0.000	0.033	pg123.cx6