Introduction
This is a report for the insert benchmark with 100M docs and 1 client(s). It is generated by scripts (bash, awk, sed) and Tufte might not be impressed. An overview of the insert benchmark is here and a short update is here. Below, by DBMS, I mean DBMS+version.config. An example is my8020.c10b40 where my means MySQL, 8020 is version 8.0.20 and c10b40 is the name for the configuration file.
The test server is described here. Clients and the DBMS shared the same host running Ubuntu 18.04.5. All tests used Postgres 12.3. The configurations for Postgres are here.
Contents
- Summary
- l.i0: load without secondary indexes
- l.x: create secondary indexes
- l.i1: continue load after secondary indexes created
- q100.2: range queries with 100 insert/s per client, 2nd loop
- q200.2: range queries with 200 insert/s per client, 2nd loop
- q400.2: range queries with 400 insert/s per client, 2nd loop
- q600.2: range queries with 600 insert/s per client, 2nd loop
- q800.2: range queries with 800 insert/s per client, 2nd loop
- q1000.2: range queries with 1000 insert/s per client, 2nd loop
Summary
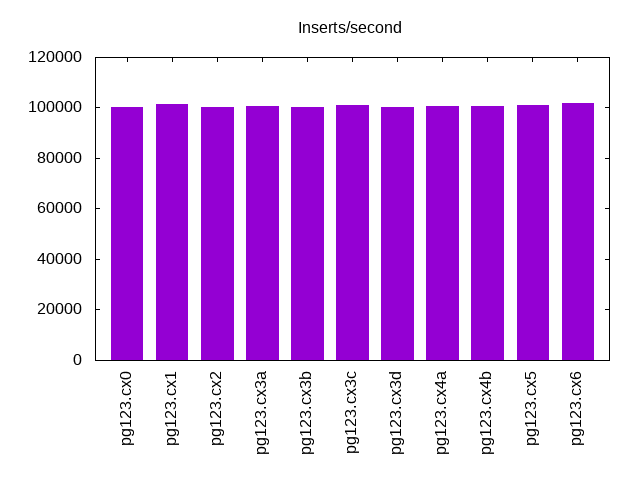
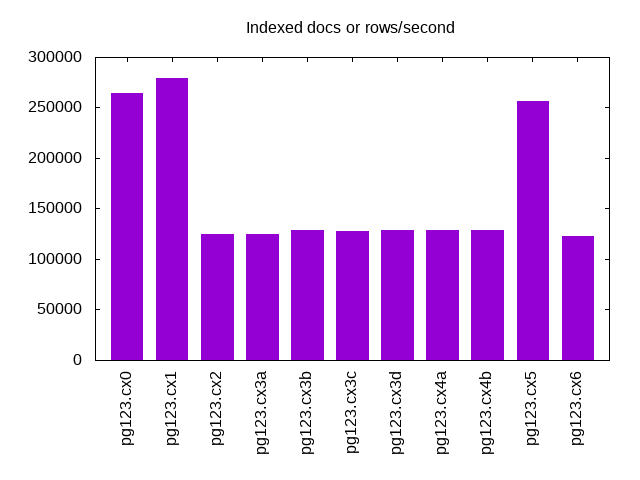
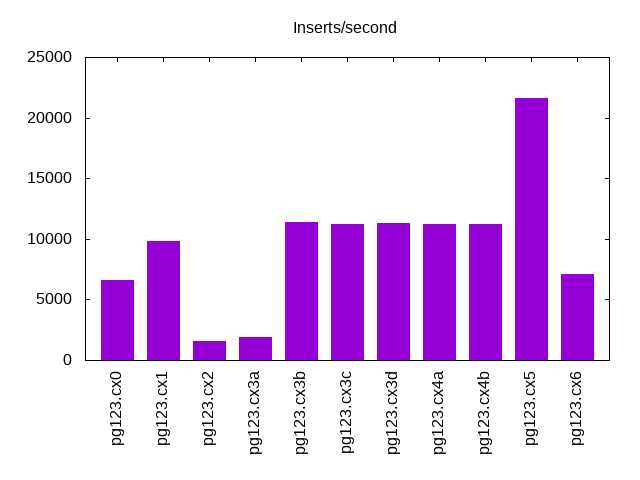
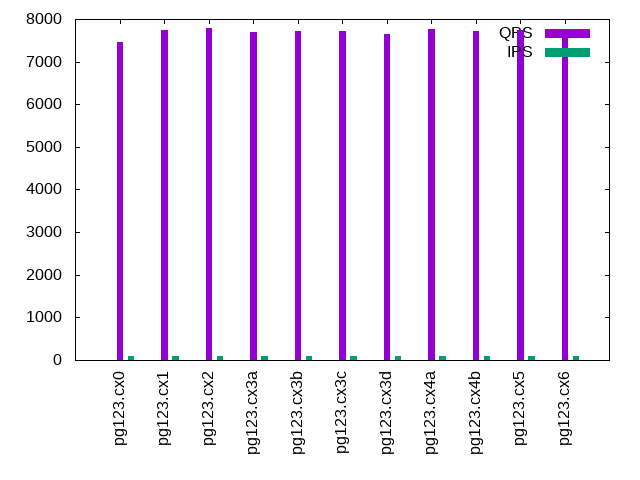
The numbers are inserts/s for l.i0 and l.i1, indexed docs (or rows) /s for l.x and queries/s for q*.2. The values are the average rate over the entire test for inserts (IPS) and queries (QPS). The range of values for IPS and QPS is split into 3 parts: bottom 25%, middle 50%, top 25%. Values in the bottom 25% have a red background, values in the top 25% have a green background and values in the middle have no color. A gray background is used for values that can be ignored because the DBMS did not sustain the target insert rate. Red backgrounds are not used when the minimum value is within 80% of the max value.
| dbms | l.i0 | l.x | l.i1 | q100.2 | q200.2 | q400.2 | q600.2 | q800.2 | q1000.2 |
|---|---|---|---|---|---|---|---|---|---|
| pg123.cx0 | 100301 | 264116 | 6614 | 7456 | 7479 | 7428 | 7306 | 7245 | 7322 |
| pg123.cx1 | 101523 | 278830 | 9842 | 7739 | 7762 | 7775 | 7758 | 7759 | 7710 |
| pg123.cx2 | 100200 | 124969 | 1583 | 7780 | 7771 | 7742 | 7711 | 7723 | 7688 |
| pg123.cx3a | 100502 | 124658 | 1859 | 7706 | 7705 | 7711 | 7703 | 7686 | 7659 |
| pg123.cx3b | 100200 | 128333 | 11351 | 7719 | 7703 | 7664 | 7699 | 7699 | 7647 |
| pg123.cx3c | 101112 | 127842 | 11248 | 7715 | 7706 | 7728 | 7718 | 7644 | 7660 |
| pg123.cx3d | 100000 | 128663 | 11287 | 7637 | 7701 | 7672 | 7680 | 7655 | 7607 |
| pg123.cx4a | 100402 | 129161 | 11248 | 7774 | 7735 | 7747 | 7747 | 7677 | 7698 |
| pg123.cx4b | 100604 | 128498 | 11223 | 7730 | 7741 | 7723 | 7714 | 7695 | 7670 |
| pg123.cx5 | 100806 | 256010 | 21645 | 7748 | 7785 | 7787 | 7803 | 7805 | 7705 |
| pg123.cx6 | 101729 | 122822 | 7067 | 7740 | 7718 | 7714 | 7690 | 7670 | 7593 |
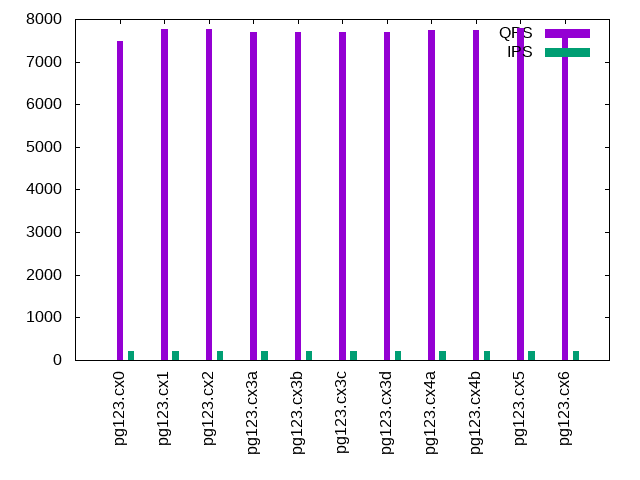
This lists the average rate of inserts/s for the tests that do inserts concurrent with queries. For such tests the query rate is listed in the table above. The read+write tests are setup so that the insert rate should match the target rate every second. Cells that are not at least 95% of the target have a red background to indicate a failure to satisfy the target.
| dbms | q100.2 | q200.2 | q400.2 | q600.2 | q800.2 | q1000.2 |
|---|---|---|---|---|---|---|
| pg123.cx0 | 100 | 200 | 399 | 599 | 799 | 998 |
| pg123.cx1 | 100 | 200 | 399 | 599 | 799 | 998 |
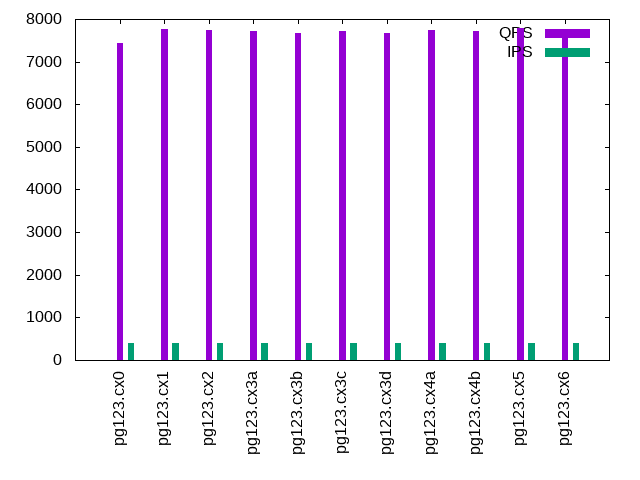
| pg123.cx2 | 100 | 200 | 399 | 599 | 799 | 998 |
| pg123.cx3a | 100 | 200 | 399 | 599 | 799 | 999 |
| pg123.cx3b | 100 | 200 | 399 | 599 | 799 | 999 |
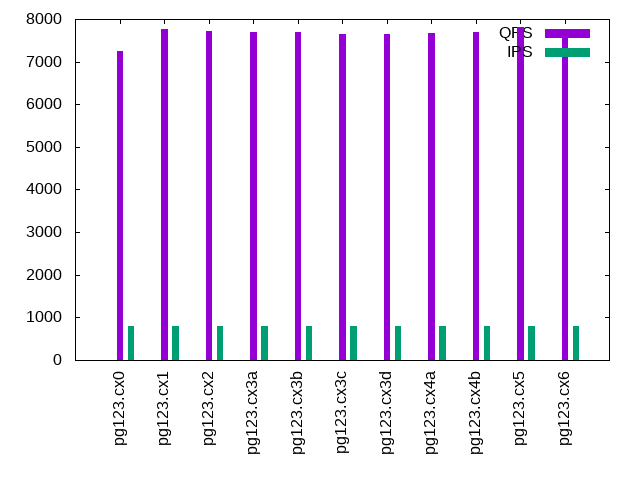
| pg123.cx3c | 100 | 200 | 400 | 599 | 799 | 999 |
| pg123.cx3d | 100 | 200 | 399 | 599 | 799 | 999 |
| pg123.cx4a | 100 | 200 | 399 | 599 | 799 | 999 |
| pg123.cx4b | 100 | 200 | 399 | 599 | 799 | 999 |
| pg123.cx5 | 100 | 200 | 399 | 599 | 799 | 998 |
| pg123.cx6 | 100 | 200 | 399 | 599 | 799 | 999 |
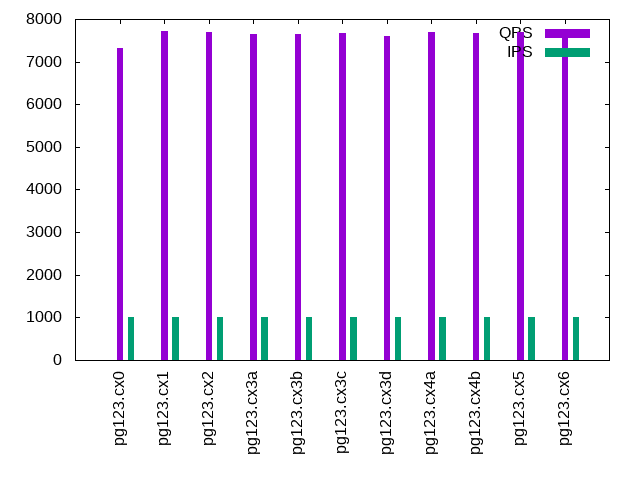
| target | 100 | 200 | 400 | 600 | 800 | 1000 |
l.i0
l.i0: load without secondary indexes. Graphs for performance per 1-second interval are here.
Average throughput:
Insert response time histogram: each cell has the percentage of responses that take <= the time in the header and max is the max response time in seconds. For the max column values in the top 25% of the range have a red background and in the bottom 25% of the range have a green background. The red background is not used when the min value is within 80% of the max value.
| dbms | 256us | 1ms | 4ms | 16ms | 64ms | 256ms | 1s | 4s | 16s | gt | max |
|---|---|---|---|---|---|---|---|---|---|---|---|
| pg123.cx0 | 83.573 | 16.422 | 0.004 | nonzero | 0.029 | ||||||
| pg123.cx1 | 87.938 | 12.058 | 0.005 | nonzero | 0.022 | ||||||
| pg123.cx2 | 84.614 | 15.379 | 0.003 | 0.003 | nonzero | 0.220 | |||||
| pg123.cx3a | 84.973 | 15.023 | 0.003 | 0.001 | 0.030 | ||||||
| pg123.cx3b | 82.846 | 17.149 | 0.004 | 0.001 | 0.029 | ||||||
| pg123.cx3c | 86.237 | 13.759 | 0.003 | nonzero | 0.026 | ||||||
| pg123.cx3d | 81.804 | 18.191 | 0.005 | nonzero | 0.030 | ||||||
| pg123.cx4a | 84.453 | 15.543 | 0.004 | nonzero | 0.035 | ||||||
| pg123.cx4b | 85.325 | 14.671 | 0.004 | nonzero | 0.025 | ||||||
| pg123.cx5 | 85.511 | 14.483 | 0.005 | nonzero | 0.024 | ||||||
| pg123.cx6 | 88.665 | 11.332 | 0.002 | nonzero | 0.027 |
Performance metrics for the DBMS listed above. Some are normalized by throughput, others are not. Legend for results is here.
ips	qps	rps	rkbps	wkbps	rpq	rkbpq	wkbpi	csps	cpups	cspq	cpupq	dbgb1	dbgb2	rss	maxop	p50	p99	tag
100301	0	0	0	42149	0.000	0.000	0.420	12268	45.7	0.122	18	9.6	10.6	0.0	0.029	100489	98171	pg123.cx0
101523	0	0	0	47396	0.000	0.000	0.467	12248	46.3	0.121	18	9.6	10.6	0.0	0.022	101788	97896	pg123.cx1
100200	0	0	0	48009	0.000	0.000	0.479	11952	47.3	0.119	19	9.6	10.6	0.0	0.220	100922	91797	pg123.cx2
100502	0	0	0	50623	0.000	0.000	0.504	12009	46.9	0.119	19	9.6	11.6	0.0	0.030	100890	94297	pg123.cx3a
100200	0	0	0	55845	0.000	0.000	0.557	12089	46.3	0.121	18	9.6	17.1	0.0	0.029	100327	96430	pg123.cx3b
101112	0	0	0	57483	0.000	0.000	0.569	12174	46.6	0.120	18	9.6	17.2	0.0	0.026	101289	96627	pg123.cx3c
100000	0	0	0	55711	0.000	0.000	0.557	12046	46.1	0.120	18	9.6	17.2	0.0	0.030	100193	94999	pg123.cx3d
100402	0	0	0	57388	0.000	0.000	0.572	12115	46.3	0.121	18	9.6	17.2	0.0	0.035	100593	95827	pg123.cx4a
100604	0	0	0	56256	0.000	0.000	0.559	12169	46.6	0.121	19	9.6	17.2	0.0	0.025	100889	96395	pg123.cx4b
100806	0	0	0	55747	0.000	0.000	0.553	12176	46.1	0.121	18	9.6	17.4	0.0	0.024	100987	97834	pg123.cx5
101729	0	16	133	56457	0.000	0.001	0.555	12327	46.8	0.121	18	9.6	17.3	0.0	0.027	101889	98562	pg123.cx6
l.x
l.x: create secondary indexes.
Average throughput:
Performance metrics for the DBMS listed above. Some are normalized by throughput, others are not. Legend for results is here.
ips	qps	rps	rkbps	wkbps	rpq	rkbpq	wkbpi	csps	cpups	cspq	cpupq	dbgb1	dbgb2	rss	maxop	p50	p99	tag
264116	0	4	149	135982	0.000	0.001	0.515	568	23.5	0.002	4	18.4	19.4	0.0	0.002	NA	NA	pg123.cx0
278830	0	71	8743	140004	0.000	0.031	0.502	524	24.6	0.002	4	18.4	19.4	0.0	0.002	NA	NA	pg123.cx1
124969	0	34	4167	62113	0.000	0.033	0.497	295	24.5	0.002	8	18.4	19.4	0.0	0.002	NA	NA	pg123.cx2
124658	0	37	4620	57730	0.000	0.037	0.463	282	24.5	0.002	8	18.4	20.4	0.0	0.002	NA	NA	pg123.cx3a
128333	0	40	4956	65909	0.000	0.039	0.514	361	24.5	0.003	8	18.4	26.0	0.0	0.003	NA	NA	pg123.cx3b
127842	0	40	4897	63603	0.000	0.038	0.498	348	24.5	0.003	8	18.4	26.1	0.0	0.003	NA	NA	pg123.cx3c
128663	0	40	4986	65896	0.000	0.039	0.512	349	24.4	0.003	8	18.4	26.0	0.0	0.002	NA	NA	pg123.cx3d
129161	0	40	4915	66231	0.000	0.038	0.513	321	24.4	0.002	8	18.4	26.0	0.0	0.002	NA	NA	pg123.cx4a
128498	0	39	4861	60699	0.000	0.038	0.472	337	24.4	0.003	8	18.4	26.0	0.0	0.003	NA	NA	pg123.cx4b
256010	0	116	14521	167503	0.000	0.057	0.654	1192	23.4	0.005	4	18.4	29.8	0.0	0.005	NA	NA	pg123.cx5
122822	0	137	7735	63224	0.001	0.063	0.515	340	24.5	0.003	8	18.4	26.1	0.0	0.229	NA	NA	pg123.cx6
l.i1
l.i1: continue load after secondary indexes created. Graphs for performance per 1-second interval are here.
Average throughput:
Insert response time histogram: each cell has the percentage of responses that take <= the time in the header and max is the max response time in seconds. For the max column values in the top 25% of the range have a red background and in the bottom 25% of the range have a green background. The red background is not used when the min value is within 80% of the max value.
| dbms | 256us | 1ms | 4ms | 16ms | 64ms | 256ms | 1s | 4s | 16s | gt | max |
|---|---|---|---|---|---|---|---|---|---|---|---|
| pg123.cx0 | 46.712 | 47.331 | 5.109 | 0.850 | 0.208 | ||||||
| pg123.cx1 | 64.377 | 31.450 | 3.969 | 0.203 | 0.002 | 0.372 | |||||
| pg123.cx2 | 99.966 | 0.034 | 0.199 | ||||||||
| pg123.cx3a | 0.397 | 99.572 | 0.030 | 0.001 | 0.410 | ||||||
| pg123.cx3b | 76.532 | 16.918 | 6.539 | 0.011 | 0.240 | ||||||
| pg123.cx3c | 76.555 | 16.707 | 6.726 | 0.010 | 0.002 | 0.343 | |||||
| pg123.cx3d | 76.355 | 17.032 | 6.601 | 0.012 | 0.001 | 0.401 | |||||
| pg123.cx4a | 76.526 | 16.790 | 6.675 | 0.009 | 0.184 | ||||||
| pg123.cx4b | 76.339 | 17.001 | 6.650 | 0.009 | 0.001 | 0.289 | |||||
| pg123.cx5 | 89.762 | 9.190 | 1.038 | 0.009 | 0.001 | 0.328 | |||||
| pg123.cx6 | 55.589 | 32.146 | 12.247 | 0.018 | 0.144 |
Performance metrics for the DBMS listed above. Some are normalized by throughput, others are not. Legend for results is here.
ips	qps	rps	rkbps	wkbps	rpq	rkbpq	wkbpi	csps	cpups	cspq	cpupq	dbgb1	dbgb2	rss	maxop	p50	p99	tag
6614	0	432	4501	356307	0.065	0.681	53.874	5636	24.3	0.852	147	21.4	22.4	0.0	0.208	6092	1648	pg123.cx0
9842	0	837	7921	472236	0.085	0.805	47.979	11581	33.2	1.177	135	21.4	31.6	0.0	0.372	5643	2497	pg123.cx1
1583	0	135	1281	56070	0.085	0.810	35.427	1121	25.1	0.708	634	21.4	22.4	0.0	0.199	1549	1249	pg123.cx2
1859	0	164	1526	54005	0.088	0.821	29.044	1240	25.1	0.667	540	21.4	23.4	0.0	0.410	1798	1249	pg123.cx3a
11351	0	968	9193	46844	0.085	0.810	4.127	5063	25.7	0.446	91	21.4	30.2	0.0	0.240	5294	1299	pg123.cx3b
11248	0	964	9127	46102	0.086	0.811	4.098	5004	25.7	0.445	91	21.4	30.2	0.0	0.343	5244	1348	pg123.cx3c
11287	0	964	9145	53436	0.085	0.810	4.734	5007	25.7	0.444	91	21.4	30.2	0.0	0.401	5344	1299	pg123.cx3d
11248	0	968	9162	54330	0.086	0.814	4.830	4962	25.7	0.441	91	21.4	30.2	0.0	0.184	5194	1348	pg123.cx4a
11223	0	961	9122	57608	0.086	0.813	5.133	4900	25.8	0.437	92	21.4	30.2	0.0	0.289	5294	1299	pg123.cx4b
21645	0	1860	17533	129001	0.086	0.810	5.960	9735	27.8	0.450	51	21.4	37.0	0.0	0.328	18628	2098	pg123.cx5
7067	0	542	5131	122579	0.077	0.726	17.345	5437	26.9	0.769	152	21.4	29.4	0.0	0.144	3999	1249	pg123.cx6
q100.2
q100.2: range queries with 100 insert/s per client, 2nd loop. Graphs for performance per 1-second interval are here.
Average throughput:
Query response time histogram: each cell has the percentage of responses that take <= the time in the header and max is the max response time in seconds. For max values in the top 25% of the range have a red background and in the bottom 25% of the range have a green background. The red background is not used when the min value is within 80% of the max value.
| dbms | 256us | 1ms | 4ms | 16ms | 64ms | 256ms | 1s | 4s | 16s | gt | max |
|---|---|---|---|---|---|---|---|---|---|---|---|
| pg123.cx0 | 99.977 | 0.022 | nonzero | 0.003 | |||||||
| pg123.cx1 | 99.985 | 0.015 | 0.001 | nonzero | 0.008 | ||||||
| pg123.cx2 | 99.985 | 0.014 | nonzero | nonzero | 0.012 | ||||||
| pg123.cx3a | 99.985 | 0.015 | nonzero | nonzero | 0.013 | ||||||
| pg123.cx3b | 99.985 | 0.015 | nonzero | nonzero | 0.010 | ||||||
| pg123.cx3c | 99.985 | 0.015 | nonzero | nonzero | 0.011 | ||||||
| pg123.cx3d | 99.985 | 0.015 | nonzero | nonzero | 0.012 | ||||||
| pg123.cx4a | 99.985 | 0.015 | nonzero | nonzero | 0.013 | ||||||
| pg123.cx4b | 99.986 | 0.014 | nonzero | nonzero | 0.013 | ||||||
| pg123.cx5 | 99.985 | 0.014 | 0.001 | 0.003 | |||||||
| pg123.cx6 | 99.987 | 0.013 | nonzero | nonzero | 0.011 |
Insert response time histogram: each cell has the percentage of responses that take <= the time in the header and max is the max response time in seconds. For max values in the top 25% of the range have a red background and in the bottom 25% of the range have a green background. The red background is not used when the min value is within 80% of the max value.
| dbms | 256us | 1ms | 4ms | 16ms | 64ms | 256ms | 1s | 4s | 16s | gt | max |
|---|---|---|---|---|---|---|---|---|---|---|---|
| pg123.cx0 | 32.028 | 67.972 | 0.012 | ||||||||
| pg123.cx1 | 99.861 | 0.139 | 0.006 | ||||||||
| pg123.cx2 | 100.000 | 0.057 | |||||||||
| pg123.cx3a | 100.000 | 0.053 | |||||||||
| pg123.cx3b | 100.000 | 0.043 | |||||||||
| pg123.cx3c | 100.000 | 0.044 | |||||||||
| pg123.cx3d | 100.000 | 0.044 | |||||||||
| pg123.cx4a | 100.000 | 0.043 | |||||||||
| pg123.cx4b | 100.000 | 0.044 | |||||||||
| pg123.cx5 | 99.889 | 0.111 | 0.006 | ||||||||
| pg123.cx6 | 100.000 | 0.052 |
Performance metrics for the DBMS listed above. Some are normalized by throughput, others are not. Legend for results is here.
ips	qps	rps	rkbps	wkbps	rpq	rkbpq	wkbpi	csps	cpups	cspq	cpupq	dbgb1	dbgb2	rss	maxop	p50	p99	tag
100	7456	35	347	4868	0.005	0.047	48.777	28790	25.4	3.861	136	21.8	22.8	0.0	0.003	7464	7368	pg123.cx0
100	7739	0	0	4614	0.000	0.000	46.237	29790	25.1	3.849	130	21.8	22.8	0.0	0.008	7751	7639	pg123.cx1
100	7780	0	0	3863	0.000	0.000	38.706	29968	27.0	3.852	139	21.8	22.6	0.0	0.012	7783	7674	pg123.cx2
100	7706	0	0	4031	0.000	0.000	40.392	29684	27.1	3.852	141	21.8	23.0	0.0	0.013	7719	7608	pg123.cx3a
100	7719	0	0	4889	0.000	0.000	48.989	29738	27.1	3.853	140	21.8	26.8	0.0	0.010	7720	7596	pg123.cx3b
100	7715	0	0	5031	0.000	0.000	50.410	29772	27.1	3.859	141	21.8	26.8	0.0	0.011	7720	7592	pg123.cx3c
100	7637	0	0	4937	0.000	0.000	49.471	29424	27.1	3.853	142	21.8	26.8	0.0	0.012	7640	7528	pg123.cx3d
100	7774	0	0	4924	0.000	0.000	49.341	29949	27.0	3.852	139	21.8	26.8	0.0	0.013	7783	7656	pg123.cx4a
100	7730	0	0	4897	0.000	0.000	49.064	29779	27.0	3.853	140	21.8	26.8	0.0	0.013	7735	7624	pg123.cx4b
100	7748	0	0	6590	0.000	0.000	66.033	29835	25.1	3.851	130	21.8	32.8	0.0	0.003	7751	7624	pg123.cx5
100	7740	2	14	4960	0.000	0.002	49.702	29823	27.1	3.853	140	21.8	25.3	0.0	0.011	7740	7640	pg123.cx6
q200.2
q200.2: range queries with 200 insert/s per client, 2nd loop. Graphs for performance per 1-second interval are here.
Average throughput:
Query response time histogram: each cell has the percentage of responses that take <= the time in the header and max is the max response time in seconds. For max values in the top 25% of the range have a red background and in the bottom 25% of the range have a green background. The red background is not used when the min value is within 80% of the max value.
| dbms | 256us | 1ms | 4ms | 16ms | 64ms | 256ms | 1s | 4s | 16s | gt | max |
|---|---|---|---|---|---|---|---|---|---|---|---|
| pg123.cx0 | 99.973 | 0.026 | 0.002 | nonzero | 0.007 | ||||||
| pg123.cx1 | 99.983 | 0.016 | 0.001 | nonzero | 0.013 | ||||||
| pg123.cx2 | 99.981 | 0.018 | 0.001 | nonzero | 0.012 | ||||||
| pg123.cx3a | 99.981 | 0.018 | 0.001 | nonzero | 0.010 | ||||||
| pg123.cx3b | 99.981 | 0.018 | 0.001 | nonzero | 0.012 | ||||||
| pg123.cx3c | 99.980 | 0.019 | 0.001 | nonzero | 0.014 | ||||||
| pg123.cx3d | 99.980 | 0.018 | 0.001 | nonzero | 0.012 | ||||||
| pg123.cx4a | 99.981 | 0.018 | 0.001 | nonzero | 0.011 | ||||||
| pg123.cx4b | 99.981 | 0.018 | 0.001 | nonzero | 0.012 | ||||||
| pg123.cx5 | 99.981 | 0.016 | 0.002 | nonzero | 0.010 | ||||||
| pg123.cx6 | 99.981 | 0.018 | 0.001 | nonzero | 0.012 |
Insert response time histogram: each cell has the percentage of responses that take <= the time in the header and max is the max response time in seconds. For max values in the top 25% of the range have a red background and in the bottom 25% of the range have a green background. The red background is not used when the min value is within 80% of the max value.
| dbms | 256us | 1ms | 4ms | 16ms | 64ms | 256ms | 1s | 4s | 16s | gt | max |
|---|---|---|---|---|---|---|---|---|---|---|---|
| pg123.cx0 | 79.472 | 20.444 | 0.083 | 0.033 | |||||||
| pg123.cx1 | 94.403 | 4.181 | 1.417 | 0.018 | |||||||
| pg123.cx2 | 100.000 | 0.054 | |||||||||
| pg123.cx3a | 100.000 | 0.048 | |||||||||
| pg123.cx3b | 100.000 | 0.048 | |||||||||
| pg123.cx3c | 100.000 | 0.046 | |||||||||
| pg123.cx3d | 100.000 | 0.048 | |||||||||
| pg123.cx4a | 100.000 | 0.047 | |||||||||
| pg123.cx4b | 100.000 | 0.048 | |||||||||
| pg123.cx5 | 96.972 | 2.097 | 0.931 | 0.019 | |||||||
| pg123.cx6 | 100.000 | 0.050 |
Performance metrics for the DBMS listed above. Some are normalized by throughput, others are not. Legend for results is here.
ips	qps	rps	rkbps	wkbps	rpq	rkbpq	wkbpi	csps	cpups	cspq	cpupq	dbgb1	dbgb2	rss	maxop	p50	p99	tag
200	7479	10	98	9395	0.001	0.013	47.044	28860	25.5	3.859	136	22.6	23.6	0.0	0.007	7480	7368	pg123.cx0
200	7762	0	3	9010	0.000	0.000	45.143	29919	25.4	3.854	131	22.6	23.6	0.0	0.013	7767	7656	pg123.cx1
200	7771	0	3	7158	0.000	0.000	35.859	29961	28.6	3.856	147	22.6	23.6	0.0	0.012	7783	7656	pg123.cx2
200	7705	0	3	7331	0.000	0.000	36.729	29712	28.6	3.856	148	22.6	23.7	0.0	0.010	7704	7592	pg123.cx3a
200	7703	0	3	7430	0.000	0.000	37.227	29708	28.7	3.857	149	22.6	24.2	0.0	0.012	7704	7592	pg123.cx3b
200	7706	0	3	7339	0.000	0.000	36.768	29720	28.6	3.857	148	22.6	24.3	0.0	0.014	7709	7576	pg123.cx3c
200	7701	0	3	7358	0.000	0.000	36.863	29698	28.6	3.856	149	22.6	24.3	0.0	0.012	7704	7592	pg123.cx3d
200	7735	0	3	7469	0.000	0.000	37.420	29830	28.6	3.857	148	22.6	24.3	0.0	0.011	7736	7624	pg123.cx4a
200	7741	0	3	7297	0.000	0.000	36.559	29856	28.7	3.857	148	22.6	24.2	0.0	0.012	7751	7640	pg123.cx4b
200	7785	0	3	9539	0.000	0.000	47.790	30003	25.4	3.854	131	22.6	26.0	0.0	0.010	7784	7640	pg123.cx5
200	7718	15	136	7318	0.002	0.018	36.662	29801	28.7	3.861	149	22.6	24.1	0.0	0.012	7720	7624	pg123.cx6
q400.2
q400.2: range queries with 400 insert/s per client, 2nd loop. Graphs for performance per 1-second interval are here.
Average throughput:
Query response time histogram: each cell has the percentage of responses that take <= the time in the header and max is the max response time in seconds. For max values in the top 25% of the range have a red background and in the bottom 25% of the range have a green background. The red background is not used when the min value is within 80% of the max value.
| dbms | 256us | 1ms | 4ms | 16ms | 64ms | 256ms | 1s | 4s | 16s | gt | max |
|---|---|---|---|---|---|---|---|---|---|---|---|
| pg123.cx0 | 99.933 | 0.063 | 0.004 | nonzero | nonzero | 0.023 | |||||
| pg123.cx1 | 99.963 | 0.036 | 0.001 | nonzero | 0.008 | ||||||
| pg123.cx2 | 99.957 | 0.039 | 0.003 | 0.001 | 0.010 | ||||||
| pg123.cx3a | 99.961 | 0.034 | 0.004 | 0.001 | 0.010 | ||||||
| pg123.cx3b | 99.960 | 0.035 | 0.004 | nonzero | 0.010 | ||||||
| pg123.cx3c | 99.962 | 0.034 | 0.003 | nonzero | 0.008 | ||||||
| pg123.cx3d | 99.960 | 0.036 | 0.004 | 0.001 | 0.012 | ||||||
| pg123.cx4a | 99.962 | 0.033 | 0.004 | 0.001 | 0.010 | ||||||
| pg123.cx4b | 99.963 | 0.034 | 0.003 | nonzero | 0.010 | ||||||
| pg123.cx5 | 99.965 | 0.034 | 0.001 | nonzero | 0.006 | ||||||
| pg123.cx6 | 99.958 | 0.037 | 0.004 | 0.001 | 0.011 |
Insert response time histogram: each cell has the percentage of responses that take <= the time in the header and max is the max response time in seconds. For max values in the top 25% of the range have a red background and in the bottom 25% of the range have a green background. The red background is not used when the min value is within 80% of the max value.
| dbms | 256us | 1ms | 4ms | 16ms | 64ms | 256ms | 1s | 4s | 16s | gt | max |
|---|---|---|---|---|---|---|---|---|---|---|---|
| pg123.cx0 | 94.153 | 5.743 | 0.104 | 0.052 | |||||||
| pg123.cx1 | 65.076 | 32.521 | 2.403 | 0.022 | |||||||
| pg123.cx2 | 100.000 | 0.048 | |||||||||
| pg123.cx3a | 100.000 | 0.046 | |||||||||
| pg123.cx3b | 100.000 | 0.047 | |||||||||
| pg123.cx3c | 0.007 | 99.993 | 0.047 | ||||||||
| pg123.cx3d | 0.007 | 99.993 | 0.047 | ||||||||
| pg123.cx4a | 100.000 | 0.045 | |||||||||
| pg123.cx4b | 100.000 | 0.046 | |||||||||
| pg123.cx5 | 74.215 | 24.854 | 0.931 | 0.022 | |||||||
| pg123.cx6 | 0.021 | 99.979 | 0.040 |
Performance metrics for the DBMS listed above. Some are normalized by throughput, others are not. Legend for results is here.
ips	qps	rps	rkbps	wkbps	rpq	rkbpq	wkbpi	csps	cpups	cspq	cpupq	dbgb1	dbgb2	rss	maxop	p50	p99	tag
399	7428	15	122	17843	0.002	0.016	44.685	28790	25.7	3.876	138	24.1	25.2	0.0	0.023	7432	7320	pg123.cx0
399	7775	56	514	17168	0.007	0.066	42.996	30174	25.9	3.881	133	24.1	25.2	0.0	0.008	7783	7642	pg123.cx1
399	7742	56	515	13349	0.007	0.066	33.432	30009	31.4	3.876	162	24.1	25.2	0.0	0.010	7751	7595	pg123.cx2
399	7711	71	621	12032	0.009	0.080	30.133	29911	30.8	3.879	160	24.1	25.9	0.0	0.010	7719	7576	pg123.cx3a
399	7664	56	501	12024	0.007	0.065	30.114	29713	30.7	3.877	160	24.1	25.9	0.0	0.010	7672	7544	pg123.cx3b
400	7728	56	500	11907	0.007	0.065	29.805	29937	30.8	3.874	159	24.1	25.9	0.0	0.008	7735	7608	pg123.cx3c
399	7672	56	504	11925	0.007	0.066	29.865	29739	30.7	3.876	160	24.1	25.9	0.0	0.012	7672	7560	pg123.cx3d
399	7747	56	504	11906	0.007	0.065	29.818	30044	30.7	3.878	159	24.1	25.9	0.0	0.010	7752	7624	pg123.cx4a
399	7723	56	503	11908	0.007	0.065	29.821	29960	30.8	3.879	160	24.1	25.9	0.0	0.010	7735	7608	pg123.cx4b
399	7787	56	485	14580	0.007	0.062	36.513	30189	25.9	3.877	133	24.1	27.2	0.0	0.006	7799	7672	pg123.cx5
399	7714	4	32	12935	0.001	0.004	32.395	29860	30.8	3.871	160	24.1	25.9	0.0	0.011	7720	7592	pg123.cx6
q600.2
q600.2: range queries with 600 insert/s per client, 2nd loop. Graphs for performance per 1-second interval are here.
Average throughput:

Query response time histogram: each cell has the percentage of responses that take <= the time in the header and max is the max response time in seconds. For max values in the top 25% of the range have a red background and in the bottom 25% of the range have a green background. The red background is not used when the min value is within 80% of the max value.
| dbms | 256us | 1ms | 4ms | 16ms | 64ms | 256ms | 1s | 4s | 16s | gt | max |
|---|---|---|---|---|---|---|---|---|---|---|---|
| pg123.cx0 | 99.743 | 0.250 | 0.006 | 0.001 | 0.001 | 0.040 | |||||
| pg123.cx1 | 99.940 | 0.059 | 0.001 | nonzero | 0.011 | ||||||
| pg123.cx2 | 99.920 | 0.074 | 0.004 | 0.001 | 0.012 | ||||||
| pg123.cx3a | 99.934 | 0.061 | 0.004 | 0.001 | 0.011 | ||||||
| pg123.cx3b | 99.938 | 0.058 | 0.004 | nonzero | 0.007 | ||||||
| pg123.cx3c | 99.940 | 0.056 | 0.004 | nonzero | 0.007 | ||||||
| pg123.cx3d | 99.936 | 0.060 | 0.004 | nonzero | 0.008 | ||||||
| pg123.cx4a | 99.941 | 0.055 | 0.004 | nonzero | 0.006 | ||||||
| pg123.cx4b | 99.936 | 0.060 | 0.004 | nonzero | 0.006 | ||||||
| pg123.cx5 | 99.946 | 0.053 | 0.001 | nonzero | 0.006 | ||||||
| pg123.cx6 | 99.928 | 0.066 | 0.005 | 0.001 | 0.014 |
Insert response time histogram: each cell has the percentage of responses that take <= the time in the header and max is the max response time in seconds. For max values in the top 25% of the range have a red background and in the bottom 25% of the range have a green background. The red background is not used when the min value is within 80% of the max value.
| dbms | 256us | 1ms | 4ms | 16ms | 64ms | 256ms | 1s | 4s | 16s | gt | max |
|---|---|---|---|---|---|---|---|---|---|---|---|
| pg123.cx0 | 84.750 | 15.032 | 0.218 | 0.036 | |||||||
| pg123.cx1 | 50.329 | 48.292 | 1.380 | 0.028 | |||||||
| pg123.cx2 | 0.005 | 99.995 | 0.046 | ||||||||
| pg123.cx3a | 5.894 | 94.106 | 0.050 | ||||||||
| pg123.cx3b | 6.579 | 93.421 | 0.052 | ||||||||
| pg123.cx3c | 6.079 | 93.921 | 0.041 | ||||||||
| pg123.cx3d | 6.032 | 93.968 | 0.055 | ||||||||
| pg123.cx4a | 6.394 | 93.606 | 0.049 | ||||||||
| pg123.cx4b | 5.593 | 94.407 | 0.040 | ||||||||
| pg123.cx5 | 60.819 | 38.426 | 0.755 | 0.029 | |||||||
| pg123.cx6 | 8.065 | 91.935 | 0.044 |
Performance metrics for the DBMS listed above. Some are normalized by throughput, others are not. Legend for results is here.
ips	qps	rps	rkbps	wkbps	rpq	rkbpq	wkbpi	csps	cpups	cspq	cpupq	dbgb1	dbgb2	rss	maxop	p50	p99	tag
599	7306	4	36	23513	0.001	0.005	39.255	28431	26.0	3.891	142	25.9	26.9	0.0	0.040	7352	4954	pg123.cx0
599	7758	168	1510	22395	0.022	0.195	37.388	30416	26.3	3.921	136	25.9	26.9	0.0	0.011	7767	7655	pg123.cx1
599	7711	168	1510	17754	0.022	0.196	29.639	30267	33.0	3.925	171	25.9	26.9	0.0	0.012	7738	6217	pg123.cx2
599	7703	168	1490	15718	0.022	0.193	26.240	30128	31.6	3.911	164	25.9	27.9	0.0	0.011	7719	7544	pg123.cx3a
599	7699	167	1480	15731	0.022	0.192	26.262	30111	31.6	3.911	164	25.9	28.0	0.0	0.007	7704	7576	pg123.cx3b
599	7718	168	1486	15868	0.022	0.193	26.478	30163	31.6	3.908	164	25.9	28.0	0.0	0.007	7720	7592	pg123.cx3c
599	7680	166	1476	15805	0.022	0.192	26.386	30023	31.5	3.909	164	25.9	28.0	0.0	0.008	7688	7560	pg123.cx3d
599	7747	166	1478	15637	0.021	0.191	26.105	30295	31.5	3.910	163	25.9	28.0	0.0	0.006	7752	7624	pg123.cx4a
599	7714	167	1471	15437	0.022	0.191	25.772	30190	31.6	3.913	164	25.9	28.0	0.0	0.006	7720	7594	pg123.cx4b
599	7803	166	1443	18397	0.021	0.185	30.713	30512	26.2	3.910	134	25.9	29.4	0.0	0.006	7815	7657	pg123.cx5
599	7690	118	1059	17333	0.015	0.138	28.937	29990	31.7	3.900	165	25.9	28.0	0.0	0.014	7703	7576	pg123.cx6
q800.2
q800.2: range queries with 800 insert/s per client, 2nd loop. Graphs for performance per 1-second interval are here.
Average throughput:
Query response time histogram: each cell has the percentage of responses that take <= the time in the header and max is the max response time in seconds. For max values in the top 25% of the range have a red background and in the bottom 25% of the range have a green background. The red background is not used when the min value is within 80% of the max value.
| dbms | 256us | 1ms | 4ms | 16ms | 64ms | 256ms | 1s | 4s | 16s | gt | max |
|---|---|---|---|---|---|---|---|---|---|---|---|
| pg123.cx0 | 99.656 | 0.332 | 0.010 | 0.001 | 0.001 | 0.041 | |||||
| pg123.cx1 | 99.914 | 0.085 | 0.001 | nonzero | 0.009 | ||||||
| pg123.cx2 | 99.906 | 0.088 | 0.005 | 0.001 | 0.015 | ||||||
| pg123.cx3a | 99.919 | 0.076 | 0.004 | 0.001 | nonzero | 0.017 | |||||
| pg123.cx3b | 99.916 | 0.079 | 0.004 | nonzero | nonzero | 0.016 | |||||
| pg123.cx3c | 99.917 | 0.078 | 0.004 | nonzero | nonzero | 0.017 | |||||
| pg123.cx3d | 99.917 | 0.079 | 0.005 | nonzero | nonzero | 0.017 | |||||
| pg123.cx4a | 99.919 | 0.076 | 0.004 | nonzero | 0.012 | ||||||
| pg123.cx4b | 99.918 | 0.077 | 0.004 | nonzero | nonzero | 0.016 | |||||
| pg123.cx5 | 99.926 | 0.073 | 0.001 | nonzero | 0.006 | ||||||
| pg123.cx6 | 99.918 | 0.076 | 0.006 | 0.001 | nonzero | 0.017 |
Insert response time histogram: each cell has the percentage of responses that take <= the time in the header and max is the max response time in seconds. For max values in the top 25% of the range have a red background and in the bottom 25% of the range have a green background. The red background is not used when the min value is within 80% of the max value.
| dbms | 256us | 1ms | 4ms | 16ms | 64ms | 256ms | 1s | 4s | 16s | gt | max |
|---|---|---|---|---|---|---|---|---|---|---|---|
| pg123.cx0 | 94.792 | 4.986 | 0.222 | 0.049 | |||||||
| pg123.cx1 | 62.333 | 36.983 | 0.684 | 0.034 | |||||||
| pg123.cx2 | 0.062 | 99.938 | 0.045 | ||||||||
| pg123.cx3a | 33.639 | 66.361 | 0.057 | ||||||||
| pg123.cx3b | 34.066 | 65.934 | 0.051 | ||||||||
| pg123.cx3c | 33.031 | 66.969 | 0.040 | ||||||||
| pg123.cx3d | 32.542 | 67.458 | 0.042 | ||||||||
| pg123.cx4a | 33.247 | 66.753 | 0.047 | ||||||||
| pg123.cx4b | 33.035 | 66.965 | 0.043 | ||||||||
| pg123.cx5 | 74.826 | 23.642 | 1.531 | 0.030 | |||||||
| pg123.cx6 | 38.167 | 61.833 | 0.041 |
Performance metrics for the DBMS listed above. Some are normalized by throughput, others are not. Legend for results is here.
ips	qps	rps	rkbps	wkbps	rpq	rkbpq	wkbpi	csps	cpups	cspq	cpupq	dbgb1	dbgb2	rss	maxop	p50	p99	tag
799	7245	1	11	28609	0.000	0.001	35.824	28279	26.3	3.903	145	26.6	27.6	0.0	0.041	7304	4251	pg123.cx0
799	7759	210	1898	27213	0.027	0.245	34.076	30596	26.5	3.943	137	26.6	27.6	0.0	0.009	7767	7624	pg123.cx1
799	7723	210	1910	21671	0.027	0.247	27.136	30355	34.1	3.931	177	26.6	27.6	0.0	0.015	7736	7576	pg123.cx2
799	7686	209	1878	17447	0.027	0.244	21.847	30188	32.5	3.927	169	26.6	28.6	0.0	0.017	7690	7544	pg123.cx3a
799	7699	209	1876	17595	0.027	0.244	22.019	30211	32.4	3.924	168	26.6	28.9	0.0	0.016	7704	7576	pg123.cx3b
799	7644	210	1879	17286	0.027	0.246	21.646	30023	32.4	3.928	170	26.6	28.8	0.0	0.017	7656	7528	pg123.cx3c
799	7655	210	1875	17279	0.027	0.245	21.623	30046	32.4	3.925	169	26.6	28.9	0.0	0.017	7656	7528	pg123.cx3d
799	7677	210	1879	17276	0.027	0.245	21.633	30168	32.5	3.930	169	26.6	28.9	0.0	0.012	7688	7560	pg123.cx4a
799	7695	210	1879	17349	0.027	0.244	21.725	30239	32.5	3.930	169	26.6	28.9	0.0	0.016	7704	7576	pg123.cx4b
799	7805	209	1845	20240	0.027	0.236	25.345	30645	26.4	3.927	135	26.6	30.3	0.0	0.006	7815	7655	pg123.cx5
799	7670	83	714	20045	0.011	0.093	25.100	29894	32.6	3.897	170	26.6	28.9	0.0	0.017	7672	7560	pg123.cx6
q1000.2
q1000.2: range queries with 1000 insert/s per client, 2nd loop. Graphs for performance per 1-second interval are here.
Average throughput:
Query response time histogram: each cell has the percentage of responses that take <= the time in the header and max is the max response time in seconds. For max values in the top 25% of the range have a red background and in the bottom 25% of the range have a green background. The red background is not used when the min value is within 80% of the max value.
| dbms | 256us | 1ms | 4ms | 16ms | 64ms | 256ms | 1s | 4s | 16s | gt | max |
|---|---|---|---|---|---|---|---|---|---|---|---|
| pg123.cx0 | 99.733 | 0.250 | 0.015 | 0.001 | 0.001 | 0.043 | |||||
| pg123.cx1 | 99.888 | 0.111 | 0.001 | nonzero | 0.011 | ||||||
| pg123.cx2 | 99.871 | 0.121 | 0.006 | 0.002 | 0.012 | ||||||
| pg123.cx3a | 99.886 | 0.107 | 0.005 | 0.002 | 0.011 | ||||||
| pg123.cx3b | 99.892 | 0.102 | 0.006 | 0.001 | nonzero | 0.017 | |||||
| pg123.cx3c | 99.894 | 0.099 | 0.006 | 0.001 | 0.011 | ||||||
| pg123.cx3d | 99.893 | 0.100 | 0.006 | 0.001 | 0.013 | ||||||
| pg123.cx4a | 99.895 | 0.098 | 0.006 | 0.001 | nonzero | 0.017 | |||||
| pg123.cx4b | 99.889 | 0.104 | 0.006 | 0.001 | 0.007 | ||||||
| pg123.cx5 | 99.903 | 0.096 | 0.001 | nonzero | nonzero | 0.017 | |||||
| pg123.cx6 | 99.893 | 0.098 | 0.009 | 0.001 | 0.016 |
Insert response time histogram: each cell has the percentage of responses that take <= the time in the header and max is the max response time in seconds. For max values in the top 25% of the range have a red background and in the bottom 25% of the range have a green background. The red background is not used when the min value is within 80% of the max value.
| dbms | 256us | 1ms | 4ms | 16ms | 64ms | 256ms | 1s | 4s | 16s | gt | max |
|---|---|---|---|---|---|---|---|---|---|---|---|
| pg123.cx0 | 96.822 | 2.903 | 0.250 | 0.025 | 0.165 | ||||||
| pg123.cx1 | 68.628 | 30.994 | 0.378 | 0.029 | |||||||
| pg123.cx2 | 100.000 | 0.052 | |||||||||
| pg123.cx3a | 23.647 | 76.353 | 0.050 | ||||||||
| pg123.cx3b | 40.883 | 59.117 | 0.055 | ||||||||
| pg123.cx3c | 40.628 | 59.372 | 0.052 | ||||||||
| pg123.cx3d | 40.508 | 59.492 | 0.052 | ||||||||
| pg123.cx4a | 40.308 | 59.692 | 0.058 | ||||||||
| pg123.cx4b | 40.700 | 59.300 | 0.054 | ||||||||
| pg123.cx5 | 78.644 | 20.783 | 0.572 | 0.039 | |||||||
| pg123.cx6 | 40.667 | 59.333 | 0.056 |
Performance metrics for the DBMS listed above. Some are normalized by throughput, others are not. Legend for results is here.
ips	qps	rps	rkbps	wkbps	rpq	rkbpq	wkbpi	csps	cpups	cspq	cpupq	dbgb1	dbgb2	rss	maxop	p50	p99	tag
998	7322	0	1	36761	0.000	0.000	36.824	28673	26.7	3.916	146	27.0	28.0	0.0	0.043	7368	5690	pg123.cx0
998	7710	246	2205	35247	0.032	0.286	35.307	30603	26.9	3.969	140	27.0	28.0	0.0	0.011	7719	7560	pg123.cx1
998	7688	230	2082	26357	0.030	0.271	26.402	30344	37.2	3.947	194	27.0	28.0	0.0	0.012	7704	7528	pg123.cx2
999	7659	230	2043	22545	0.030	0.267	22.572	30177	35.0	3.940	183	27.0	29.0	0.0	0.011	7672	7496	pg123.cx3a
999	7647	247	2207	20513	0.032	0.289	20.538	30155	34.2	3.943	179	27.0	29.7	0.0	0.017	7656	7512	pg123.cx3b
999	7660	248	2211	20475	0.032	0.289	20.499	30235	34.3	3.947	179	27.0	29.7	0.0	0.011	7672	7464	pg123.cx3c
999	7607	248	2212	20489	0.033	0.291	20.513	29999	34.2	3.943	180	27.0	29.7	0.0	0.013	7608	7450	pg123.cx3d
999	7698	247	2210	20505	0.032	0.287	20.530	30370	34.2	3.945	178	27.0	29.7	0.0	0.017	7704	7546	pg123.cx4a
999	7670	247	2207	20615	0.032	0.288	20.640	30270	34.2	3.947	178	27.0	29.7	0.0	0.007	7672	7528	pg123.cx4b
998	7705	247	2181	24210	0.032	0.283	24.252	30399	26.6	3.945	138	27.0	31.4	0.0	0.017	7718	7592	pg123.cx5
999	7593	149	1277	23948	0.020	0.168	23.977	29723	34.4	3.915	181	27.0	29.7	0.0	0.016	7592	7464	pg123.cx6
l.i0
l.i0: load without secondary indexes
Performance metrics for all DBMS, not just the ones listed above. Some are normalized by throughput, others are not. Legend for results is here.
ips	qps	rps	rkbps	wkbps	rpq	rkbpq	wkbpi	csps	cpups	cspq	cpupq	dbgb1	dbgb2	rss	maxop	p50	p99	tag
100301	0	0	0	42149	0.000	0.000	0.420	12268	45.7	0.122	18	9.6	10.6	0.0	0.029	100489	98171	pg123.cx0
101523	0	0	0	47396	0.000	0.000	0.467	12248	46.3	0.121	18	9.6	10.6	0.0	0.022	101788	97896	pg123.cx1
100200	0	0	0	48009	0.000	0.000	0.479	11952	47.3	0.119	19	9.6	10.6	0.0	0.220	100922	91797	pg123.cx2
100502	0	0	0	50623	0.000	0.000	0.504	12009	46.9	0.119	19	9.6	11.6	0.0	0.030	100890	94297	pg123.cx3a
100200	0	0	0	55845	0.000	0.000	0.557	12089	46.3	0.121	18	9.6	17.1	0.0	0.029	100327	96430	pg123.cx3b
101112	0	0	0	57483	0.000	0.000	0.569	12174	46.6	0.120	18	9.6	17.2	0.0	0.026	101289	96627	pg123.cx3c
100000	0	0	0	55711	0.000	0.000	0.557	12046	46.1	0.120	18	9.6	17.2	0.0	0.030	100193	94999	pg123.cx3d
100402	0	0	0	57388	0.000	0.000	0.572	12115	46.3	0.121	18	9.6	17.2	0.0	0.035	100593	95827	pg123.cx4a
100604	0	0	0	56256	0.000	0.000	0.559	12169	46.6	0.121	19	9.6	17.2	0.0	0.025	100889	96395	pg123.cx4b
100806	0	0	0	55747	0.000	0.000	0.553	12176	46.1	0.121	18	9.6	17.4	0.0	0.024	100987	97834	pg123.cx5
101729	0	16	133	56457	0.000	0.001	0.555	12327	46.8	0.121	18	9.6	17.3	0.0	0.027	101889	98562	pg123.cx6
l.x
l.x: create secondary indexes
Performance metrics for all DBMS, not just the ones listed above. Some are normalized by throughput, others are not. Legend for results is here.
ips	qps	rps	rkbps	wkbps	rpq	rkbpq	wkbpi	csps	cpups	cspq	cpupq	dbgb1	dbgb2	rss	maxop	p50	p99	tag
264116	0	4	149	135982	0.000	0.001	0.515	568	23.5	0.002	4	18.4	19.4	0.0	0.002	NA	NA	pg123.cx0
278830	0	71	8743	140004	0.000	0.031	0.502	524	24.6	0.002	4	18.4	19.4	0.0	0.002	NA	NA	pg123.cx1
124969	0	34	4167	62113	0.000	0.033	0.497	295	24.5	0.002	8	18.4	19.4	0.0	0.002	NA	NA	pg123.cx2
124658	0	37	4620	57730	0.000	0.037	0.463	282	24.5	0.002	8	18.4	20.4	0.0	0.002	NA	NA	pg123.cx3a
128333	0	40	4956	65909	0.000	0.039	0.514	361	24.5	0.003	8	18.4	26.0	0.0	0.003	NA	NA	pg123.cx3b
127842	0	40	4897	63603	0.000	0.038	0.498	348	24.5	0.003	8	18.4	26.1	0.0	0.003	NA	NA	pg123.cx3c
128663	0	40	4986	65896	0.000	0.039	0.512	349	24.4	0.003	8	18.4	26.0	0.0	0.002	NA	NA	pg123.cx3d
129161	0	40	4915	66231	0.000	0.038	0.513	321	24.4	0.002	8	18.4	26.0	0.0	0.002	NA	NA	pg123.cx4a
128498	0	39	4861	60699	0.000	0.038	0.472	337	24.4	0.003	8	18.4	26.0	0.0	0.003	NA	NA	pg123.cx4b
256010	0	116	14521	167503	0.000	0.057	0.654	1192	23.4	0.005	4	18.4	29.8	0.0	0.005	NA	NA	pg123.cx5
122822	0	137	7735	63224	0.001	0.063	0.515	340	24.5	0.003	8	18.4	26.1	0.0	0.229	NA	NA	pg123.cx6
l.i1
l.i1: continue load after secondary indexes created
Performance metrics for all DBMS, not just the ones listed above. Some are normalized by throughput, others are not. Legend for results is here.
ips	qps	rps	rkbps	wkbps	rpq	rkbpq	wkbpi	csps	cpups	cspq	cpupq	dbgb1	dbgb2	rss	maxop	p50	p99	tag
6614	0	432	4501	356307	0.065	0.681	53.874	5636	24.3	0.852	147	21.4	22.4	0.0	0.208	6092	1648	pg123.cx0
9842	0	837	7921	472236	0.085	0.805	47.979	11581	33.2	1.177	135	21.4	31.6	0.0	0.372	5643	2497	pg123.cx1
1583	0	135	1281	56070	0.085	0.810	35.427	1121	25.1	0.708	634	21.4	22.4	0.0	0.199	1549	1249	pg123.cx2
1859	0	164	1526	54005	0.088	0.821	29.044	1240	25.1	0.667	540	21.4	23.4	0.0	0.410	1798	1249	pg123.cx3a
11351	0	968	9193	46844	0.085	0.810	4.127	5063	25.7	0.446	91	21.4	30.2	0.0	0.240	5294	1299	pg123.cx3b
11248	0	964	9127	46102	0.086	0.811	4.098	5004	25.7	0.445	91	21.4	30.2	0.0	0.343	5244	1348	pg123.cx3c
11287	0	964	9145	53436	0.085	0.810	4.734	5007	25.7	0.444	91	21.4	30.2	0.0	0.401	5344	1299	pg123.cx3d
11248	0	968	9162	54330	0.086	0.814	4.830	4962	25.7	0.441	91	21.4	30.2	0.0	0.184	5194	1348	pg123.cx4a
11223	0	961	9122	57608	0.086	0.813	5.133	4900	25.8	0.437	92	21.4	30.2	0.0	0.289	5294	1299	pg123.cx4b
21645	0	1860	17533	129001	0.086	0.810	5.960	9735	27.8	0.450	51	21.4	37.0	0.0	0.328	18628	2098	pg123.cx5
7067	0	542	5131	122579	0.077	0.726	17.345	5437	26.9	0.769	152	21.4	29.4	0.0	0.144	3999	1249	pg123.cx6
q100.2
q100.2: range queries with 100 insert/s per client, 2nd loop
Performance metrics for all DBMS, not just the ones listed above. Some are normalized by throughput, others are not. Legend for results is here.
ips	qps	rps	rkbps	wkbps	rpq	rkbpq	wkbpi	csps	cpups	cspq	cpupq	dbgb1	dbgb2	rss	maxop	p50	p99	tag
100	7456	35	347	4868	0.005	0.047	48.777	28790	25.4	3.861	136	21.8	22.8	0.0	0.003	7464	7368	pg123.cx0
100	7739	0	0	4614	0.000	0.000	46.237	29790	25.1	3.849	130	21.8	22.8	0.0	0.008	7751	7639	pg123.cx1
100	7780	0	0	3863	0.000	0.000	38.706	29968	27.0	3.852	139	21.8	22.6	0.0	0.012	7783	7674	pg123.cx2
100	7706	0	0	4031	0.000	0.000	40.392	29684	27.1	3.852	141	21.8	23.0	0.0	0.013	7719	7608	pg123.cx3a
100	7719	0	0	4889	0.000	0.000	48.989	29738	27.1	3.853	140	21.8	26.8	0.0	0.010	7720	7596	pg123.cx3b
100	7715	0	0	5031	0.000	0.000	50.410	29772	27.1	3.859	141	21.8	26.8	0.0	0.011	7720	7592	pg123.cx3c
100	7637	0	0	4937	0.000	0.000	49.471	29424	27.1	3.853	142	21.8	26.8	0.0	0.012	7640	7528	pg123.cx3d
100	7774	0	0	4924	0.000	0.000	49.341	29949	27.0	3.852	139	21.8	26.8	0.0	0.013	7783	7656	pg123.cx4a
100	7730	0	0	4897	0.000	0.000	49.064	29779	27.0	3.853	140	21.8	26.8	0.0	0.013	7735	7624	pg123.cx4b
100	7748	0	0	6590	0.000	0.000	66.033	29835	25.1	3.851	130	21.8	32.8	0.0	0.003	7751	7624	pg123.cx5
100	7740	2	14	4960	0.000	0.002	49.702	29823	27.1	3.853	140	21.8	25.3	0.0	0.011	7740	7640	pg123.cx6
q200.2
q200.2: range queries with 200 insert/s per client, 2nd loop
Performance metrics for all DBMS, not just the ones listed above. Some are normalized by throughput, others are not. Legend for results is here.
ips	qps	rps	rkbps	wkbps	rpq	rkbpq	wkbpi	csps	cpups	cspq	cpupq	dbgb1	dbgb2	rss	maxop	p50	p99	tag
200	7479	10	98	9395	0.001	0.013	47.044	28860	25.5	3.859	136	22.6	23.6	0.0	0.007	7480	7368	pg123.cx0
200	7762	0	3	9010	0.000	0.000	45.143	29919	25.4	3.854	131	22.6	23.6	0.0	0.013	7767	7656	pg123.cx1
200	7771	0	3	7158	0.000	0.000	35.859	29961	28.6	3.856	147	22.6	23.6	0.0	0.012	7783	7656	pg123.cx2
200	7705	0	3	7331	0.000	0.000	36.729	29712	28.6	3.856	148	22.6	23.7	0.0	0.010	7704	7592	pg123.cx3a
200	7703	0	3	7430	0.000	0.000	37.227	29708	28.7	3.857	149	22.6	24.2	0.0	0.012	7704	7592	pg123.cx3b
200	7706	0	3	7339	0.000	0.000	36.768	29720	28.6	3.857	148	22.6	24.3	0.0	0.014	7709	7576	pg123.cx3c
200	7701	0	3	7358	0.000	0.000	36.863	29698	28.6	3.856	149	22.6	24.3	0.0	0.012	7704	7592	pg123.cx3d
200	7735	0	3	7469	0.000	0.000	37.420	29830	28.6	3.857	148	22.6	24.3	0.0	0.011	7736	7624	pg123.cx4a
200	7741	0	3	7297	0.000	0.000	36.559	29856	28.7	3.857	148	22.6	24.2	0.0	0.012	7751	7640	pg123.cx4b
200	7785	0	3	9539	0.000	0.000	47.790	30003	25.4	3.854	131	22.6	26.0	0.0	0.010	7784	7640	pg123.cx5
200	7718	15	136	7318	0.002	0.018	36.662	29801	28.7	3.861	149	22.6	24.1	0.0	0.012	7720	7624	pg123.cx6
q400.2
q400.2: range queries with 400 insert/s per client, 2nd loop
Performance metrics for all DBMS, not just the ones listed above. Some are normalized by throughput, others are not. Legend for results is here.
ips	qps	rps	rkbps	wkbps	rpq	rkbpq	wkbpi	csps	cpups	cspq	cpupq	dbgb1	dbgb2	rss	maxop	p50	p99	tag
399	7428	15	122	17843	0.002	0.016	44.685	28790	25.7	3.876	138	24.1	25.2	0.0	0.023	7432	7320	pg123.cx0
399	7775	56	514	17168	0.007	0.066	42.996	30174	25.9	3.881	133	24.1	25.2	0.0	0.008	7783	7642	pg123.cx1
399	7742	56	515	13349	0.007	0.066	33.432	30009	31.4	3.876	162	24.1	25.2	0.0	0.010	7751	7595	pg123.cx2
399	7711	71	621	12032	0.009	0.080	30.133	29911	30.8	3.879	160	24.1	25.9	0.0	0.010	7719	7576	pg123.cx3a
399	7664	56	501	12024	0.007	0.065	30.114	29713	30.7	3.877	160	24.1	25.9	0.0	0.010	7672	7544	pg123.cx3b
400	7728	56	500	11907	0.007	0.065	29.805	29937	30.8	3.874	159	24.1	25.9	0.0	0.008	7735	7608	pg123.cx3c
399	7672	56	504	11925	0.007	0.066	29.865	29739	30.7	3.876	160	24.1	25.9	0.0	0.012	7672	7560	pg123.cx3d
399	7747	56	504	11906	0.007	0.065	29.818	30044	30.7	3.878	159	24.1	25.9	0.0	0.010	7752	7624	pg123.cx4a
399	7723	56	503	11908	0.007	0.065	29.821	29960	30.8	3.879	160	24.1	25.9	0.0	0.010	7735	7608	pg123.cx4b
399	7787	56	485	14580	0.007	0.062	36.513	30189	25.9	3.877	133	24.1	27.2	0.0	0.006	7799	7672	pg123.cx5
399	7714	4	32	12935	0.001	0.004	32.395	29860	30.8	3.871	160	24.1	25.9	0.0	0.011	7720	7592	pg123.cx6
q600.2
q600.2: range queries with 600 insert/s per client, 2nd loop
Performance metrics for all DBMS, not just the ones listed above. Some are normalized by throughput, others are not. Legend for results is here.
ips	qps	rps	rkbps	wkbps	rpq	rkbpq	wkbpi	csps	cpups	cspq	cpupq	dbgb1	dbgb2	rss	maxop	p50	p99	tag
599	7306	4	36	23513	0.001	0.005	39.255	28431	26.0	3.891	142	25.9	26.9	0.0	0.040	7352	4954	pg123.cx0
599	7758	168	1510	22395	0.022	0.195	37.388	30416	26.3	3.921	136	25.9	26.9	0.0	0.011	7767	7655	pg123.cx1
599	7711	168	1510	17754	0.022	0.196	29.639	30267	33.0	3.925	171	25.9	26.9	0.0	0.012	7738	6217	pg123.cx2
599	7703	168	1490	15718	0.022	0.193	26.240	30128	31.6	3.911	164	25.9	27.9	0.0	0.011	7719	7544	pg123.cx3a
599	7699	167	1480	15731	0.022	0.192	26.262	30111	31.6	3.911	164	25.9	28.0	0.0	0.007	7704	7576	pg123.cx3b
599	7718	168	1486	15868	0.022	0.193	26.478	30163	31.6	3.908	164	25.9	28.0	0.0	0.007	7720	7592	pg123.cx3c
599	7680	166	1476	15805	0.022	0.192	26.386	30023	31.5	3.909	164	25.9	28.0	0.0	0.008	7688	7560	pg123.cx3d
599	7747	166	1478	15637	0.021	0.191	26.105	30295	31.5	3.910	163	25.9	28.0	0.0	0.006	7752	7624	pg123.cx4a
599	7714	167	1471	15437	0.022	0.191	25.772	30190	31.6	3.913	164	25.9	28.0	0.0	0.006	7720	7594	pg123.cx4b
599	7803	166	1443	18397	0.021	0.185	30.713	30512	26.2	3.910	134	25.9	29.4	0.0	0.006	7815	7657	pg123.cx5
599	7690	118	1059	17333	0.015	0.138	28.937	29990	31.7	3.900	165	25.9	28.0	0.0	0.014	7703	7576	pg123.cx6
q800.2
q800.2: range queries with 800 insert/s per client, 2nd loop
Performance metrics for all DBMS, not just the ones listed above. Some are normalized by throughput, others are not. Legend for results is here.
ips	qps	rps	rkbps	wkbps	rpq	rkbpq	wkbpi	csps	cpups	cspq	cpupq	dbgb1	dbgb2	rss	maxop	p50	p99	tag
799	7245	1	11	28609	0.000	0.001	35.824	28279	26.3	3.903	145	26.6	27.6	0.0	0.041	7304	4251	pg123.cx0
799	7759	210	1898	27213	0.027	0.245	34.076	30596	26.5	3.943	137	26.6	27.6	0.0	0.009	7767	7624	pg123.cx1
799	7723	210	1910	21671	0.027	0.247	27.136	30355	34.1	3.931	177	26.6	27.6	0.0	0.015	7736	7576	pg123.cx2
799	7686	209	1878	17447	0.027	0.244	21.847	30188	32.5	3.927	169	26.6	28.6	0.0	0.017	7690	7544	pg123.cx3a
799	7699	209	1876	17595	0.027	0.244	22.019	30211	32.4	3.924	168	26.6	28.9	0.0	0.016	7704	7576	pg123.cx3b
799	7644	210	1879	17286	0.027	0.246	21.646	30023	32.4	3.928	170	26.6	28.8	0.0	0.017	7656	7528	pg123.cx3c
799	7655	210	1875	17279	0.027	0.245	21.623	30046	32.4	3.925	169	26.6	28.9	0.0	0.017	7656	7528	pg123.cx3d
799	7677	210	1879	17276	0.027	0.245	21.633	30168	32.5	3.930	169	26.6	28.9	0.0	0.012	7688	7560	pg123.cx4a
799	7695	210	1879	17349	0.027	0.244	21.725	30239	32.5	3.930	169	26.6	28.9	0.0	0.016	7704	7576	pg123.cx4b
799	7805	209	1845	20240	0.027	0.236	25.345	30645	26.4	3.927	135	26.6	30.3	0.0	0.006	7815	7655	pg123.cx5
799	7670	83	714	20045	0.011	0.093	25.100	29894	32.6	3.897	170	26.6	28.9	0.0	0.017	7672	7560	pg123.cx6
q1000.2
q1000.2: range queries with 1000 insert/s per client, 2nd loop
Performance metrics for all DBMS, not just the ones listed above. Some are normalized by throughput, others are not. Legend for results is here.
ips	qps	rps	rkbps	wkbps	rpq	rkbpq	wkbpi	csps	cpups	cspq	cpupq	dbgb1	dbgb2	rss	maxop	p50	p99	tag
998	7322	0	1	36761	0.000	0.000	36.824	28673	26.7	3.916	146	27.0	28.0	0.0	0.043	7368	5690	pg123.cx0
998	7710	246	2205	35247	0.032	0.286	35.307	30603	26.9	3.969	140	27.0	28.0	0.0	0.011	7719	7560	pg123.cx1
998	7688	230	2082	26357	0.030	0.271	26.402	30344	37.2	3.947	194	27.0	28.0	0.0	0.012	7704	7528	pg123.cx2
999	7659	230	2043	22545	0.030	0.267	22.572	30177	35.0	3.940	183	27.0	29.0	0.0	0.011	7672	7496	pg123.cx3a
999	7647	247	2207	20513	0.032	0.289	20.538	30155	34.2	3.943	179	27.0	29.7	0.0	0.017	7656	7512	pg123.cx3b
999	7660	248	2211	20475	0.032	0.289	20.499	30235	34.3	3.947	179	27.0	29.7	0.0	0.011	7672	7464	pg123.cx3c
999	7607	248	2212	20489	0.033	0.291	20.513	29999	34.2	3.943	180	27.0	29.7	0.0	0.013	7608	7450	pg123.cx3d
999	7698	247	2210	20505	0.032	0.287	20.530	30370	34.2	3.945	178	27.0	29.7	0.0	0.017	7704	7546	pg123.cx4a
999	7670	247	2207	20615	0.032	0.288	20.640	30270	34.2	3.947	178	27.0	29.7	0.0	0.007	7672	7528	pg123.cx4b
998	7705	247	2181	24210	0.032	0.283	24.252	30399	26.6	3.945	138	27.0	31.4	0.0	0.017	7718	7592	pg123.cx5
999	7593	149	1277	23948	0.020	0.168	23.977	29723	34.4	3.915	181	27.0	29.7	0.0	0.016	7592	7464	pg123.cx6
l.i0
- l.i0: load without secondary indexes
- Legend for results is here.
- Each entry lists the percentage of responses that fit in that bucket (slower than max time for previous bucket, faster than min time for next bucket).
Insert response time histogram
256us	1ms	4ms	16ms	64ms	256ms	1s	4s	16s	gt	max	tag
0.000	83.573	16.422	0.004	nonzero	0.000	0.000	0.000	0.000	0.000	0.029	pg123.cx0
0.000	87.938	12.058	0.005	nonzero	0.000	0.000	0.000	0.000	0.000	0.022	pg123.cx1
0.000	84.614	15.379	0.003	0.003	nonzero	0.000	0.000	0.000	0.000	0.220	pg123.cx2
0.000	84.973	15.023	0.003	0.001	0.000	0.000	0.000	0.000	0.000	0.030	pg123.cx3a
0.000	82.846	17.149	0.004	0.001	0.000	0.000	0.000	0.000	0.000	0.029	pg123.cx3b
0.000	86.237	13.759	0.003	nonzero	0.000	0.000	0.000	0.000	0.000	0.026	pg123.cx3c
0.000	81.804	18.191	0.005	nonzero	0.000	0.000	0.000	0.000	0.000	0.030	pg123.cx3d
0.000	84.453	15.543	0.004	nonzero	0.000	0.000	0.000	0.000	0.000	0.035	pg123.cx4a
0.000	85.325	14.671	0.004	nonzero	0.000	0.000	0.000	0.000	0.000	0.025	pg123.cx4b
0.000	85.511	14.483	0.005	nonzero	0.000	0.000	0.000	0.000	0.000	0.024	pg123.cx5
0.000	88.665	11.332	0.002	nonzero	0.000	0.000	0.000	0.000	0.000	0.027	pg123.cx6
l.x
- l.x: create secondary indexes
- Legend for results is here.
- Each entry lists the percentage of responses that fit in that bucket (slower than max time for previous bucket, faster than min time for next bucket).
TODO - determine whether there is data for create index response time
l.i1
- l.i1: continue load after secondary indexes created
- Legend for results is here.
- Each entry lists the percentage of responses that fit in that bucket (slower than max time for previous bucket, faster than min time for next bucket).
Insert response time histogram
256us	1ms	4ms	16ms	64ms	256ms	1s	4s	16s	gt	max	tag
0.000	0.000	46.712	47.331	5.109	0.850	0.000	0.000	0.000	0.000	0.208	pg123.cx0
0.000	0.000	64.377	31.450	3.969	0.203	0.002	0.000	0.000	0.000	0.372	pg123.cx1
0.000	0.000	0.000	0.000	99.966	0.034	0.000	0.000	0.000	0.000	0.199	pg123.cx2
0.000	0.000	0.000	0.397	99.572	0.030	0.001	0.000	0.000	0.000	0.410	pg123.cx3a
0.000	0.000	76.532	16.918	6.539	0.011	0.000	0.000	0.000	0.000	0.240	pg123.cx3b
0.000	0.000	76.555	16.707	6.726	0.010	0.002	0.000	0.000	0.000	0.343	pg123.cx3c
0.000	0.000	76.355	17.032	6.601	0.012	0.001	0.000	0.000	0.000	0.401	pg123.cx3d
0.000	0.000	76.526	16.790	6.675	0.009	0.000	0.000	0.000	0.000	0.184	pg123.cx4a
0.000	0.000	76.339	17.001	6.650	0.009	0.001	0.000	0.000	0.000	0.289	pg123.cx4b
0.000	0.000	89.762	9.190	1.038	0.009	0.001	0.000	0.000	0.000	0.328	pg123.cx5
0.000	0.000	55.589	32.146	12.247	0.018	0.000	0.000	0.000	0.000	0.144	pg123.cx6
q100.2
- q100.2: range queries with 100 insert/s per client, 2nd loop
- Legend for results is here.
- Each entry lists the percentage of responses that fit in that bucket (slower than max time for previous bucket, faster than min time for next bucket).
Query response time histogram
256us	1ms	4ms	16ms	64ms	256ms	1s	4s	16s	gt	max	tag
99.977	0.022	nonzero	0.000	0.000	0.000	0.000	0.000	0.000	0.000	0.003	pg123.cx0
99.985	0.015	0.001	nonzero	0.000	0.000	0.000	0.000	0.000	0.000	0.008	pg123.cx1
99.985	0.014	nonzero	nonzero	0.000	0.000	0.000	0.000	0.000	0.000	0.012	pg123.cx2
99.985	0.015	nonzero	nonzero	0.000	0.000	0.000	0.000	0.000	0.000	0.013	pg123.cx3a
99.985	0.015	nonzero	nonzero	0.000	0.000	0.000	0.000	0.000	0.000	0.010	pg123.cx3b
99.985	0.015	nonzero	nonzero	0.000	0.000	0.000	0.000	0.000	0.000	0.011	pg123.cx3c
99.985	0.015	nonzero	nonzero	0.000	0.000	0.000	0.000	0.000	0.000	0.012	pg123.cx3d
99.985	0.015	nonzero	nonzero	0.000	0.000	0.000	0.000	0.000	0.000	0.013	pg123.cx4a
99.986	0.014	nonzero	nonzero	0.000	0.000	0.000	0.000	0.000	0.000	0.013	pg123.cx4b
99.985	0.014	0.001	0.000	0.000	0.000	0.000	0.000	0.000	0.000	0.003	pg123.cx5
99.987	0.013	nonzero	nonzero	0.000	0.000	0.000	0.000	0.000	0.000	0.011	pg123.cx6
Insert response time histogram
256us	1ms	4ms	16ms	64ms	256ms	1s	4s	16s	gt	max	tag
0.000	0.000	32.028	67.972	0.000	0.000	0.000	0.000	0.000	0.000	0.012	pg123.cx0
0.000	0.000	99.861	0.139	0.000	0.000	0.000	0.000	0.000	0.000	0.006	pg123.cx1
0.000	0.000	0.000	0.000	100.000	0.000	0.000	0.000	0.000	0.000	0.057	pg123.cx2
0.000	0.000	0.000	0.000	100.000	0.000	0.000	0.000	0.000	0.000	0.053	pg123.cx3a
0.000	0.000	0.000	0.000	100.000	0.000	0.000	0.000	0.000	0.000	0.043	pg123.cx3b
0.000	0.000	0.000	0.000	100.000	0.000	0.000	0.000	0.000	0.000	0.044	pg123.cx3c
0.000	0.000	0.000	0.000	100.000	0.000	0.000	0.000	0.000	0.000	0.044	pg123.cx3d
0.000	0.000	0.000	0.000	100.000	0.000	0.000	0.000	0.000	0.000	0.043	pg123.cx4a
0.000	0.000	0.000	0.000	100.000	0.000	0.000	0.000	0.000	0.000	0.044	pg123.cx4b
0.000	0.000	99.889	0.111	0.000	0.000	0.000	0.000	0.000	0.000	0.006	pg123.cx5
0.000	0.000	0.000	0.000	100.000	0.000	0.000	0.000	0.000	0.000	0.052	pg123.cx6
q200.2
- q200.2: range queries with 200 insert/s per client, 2nd loop
- Legend for results is here.
- Each entry lists the percentage of responses that fit in that bucket (slower than max time for previous bucket, faster than min time for next bucket).
Query response time histogram
256us	1ms	4ms	16ms	64ms	256ms	1s	4s	16s	gt	max	tag
99.973	0.026	0.002	nonzero	0.000	0.000	0.000	0.000	0.000	0.000	0.007	pg123.cx0
99.983	0.016	0.001	nonzero	0.000	0.000	0.000	0.000	0.000	0.000	0.013	pg123.cx1
99.981	0.018	0.001	nonzero	0.000	0.000	0.000	0.000	0.000	0.000	0.012	pg123.cx2
99.981	0.018	0.001	nonzero	0.000	0.000	0.000	0.000	0.000	0.000	0.010	pg123.cx3a
99.981	0.018	0.001	nonzero	0.000	0.000	0.000	0.000	0.000	0.000	0.012	pg123.cx3b
99.980	0.019	0.001	nonzero	0.000	0.000	0.000	0.000	0.000	0.000	0.014	pg123.cx3c
99.980	0.018	0.001	nonzero	0.000	0.000	0.000	0.000	0.000	0.000	0.012	pg123.cx3d
99.981	0.018	0.001	nonzero	0.000	0.000	0.000	0.000	0.000	0.000	0.011	pg123.cx4a
99.981	0.018	0.001	nonzero	0.000	0.000	0.000	0.000	0.000	0.000	0.012	pg123.cx4b
99.981	0.016	0.002	nonzero	0.000	0.000	0.000	0.000	0.000	0.000	0.010	pg123.cx5
99.981	0.018	0.001	nonzero	0.000	0.000	0.000	0.000	0.000	0.000	0.012	pg123.cx6
Insert response time histogram
256us	1ms	4ms	16ms	64ms	256ms	1s	4s	16s	gt	max	tag
0.000	0.000	79.472	20.444	0.083	0.000	0.000	0.000	0.000	0.000	0.033	pg123.cx0
0.000	0.000	94.403	4.181	1.417	0.000	0.000	0.000	0.000	0.000	0.018	pg123.cx1
0.000	0.000	0.000	0.000	100.000	0.000	0.000	0.000	0.000	0.000	0.054	pg123.cx2
0.000	0.000	0.000	0.000	100.000	0.000	0.000	0.000	0.000	0.000	0.048	pg123.cx3a
0.000	0.000	0.000	0.000	100.000	0.000	0.000	0.000	0.000	0.000	0.048	pg123.cx3b
0.000	0.000	0.000	0.000	100.000	0.000	0.000	0.000	0.000	0.000	0.046	pg123.cx3c
0.000	0.000	0.000	0.000	100.000	0.000	0.000	0.000	0.000	0.000	0.048	pg123.cx3d
0.000	0.000	0.000	0.000	100.000	0.000	0.000	0.000	0.000	0.000	0.047	pg123.cx4a
0.000	0.000	0.000	0.000	100.000	0.000	0.000	0.000	0.000	0.000	0.048	pg123.cx4b
0.000	0.000	96.972	2.097	0.931	0.000	0.000	0.000	0.000	0.000	0.019	pg123.cx5
0.000	0.000	0.000	0.000	100.000	0.000	0.000	0.000	0.000	0.000	0.050	pg123.cx6
q400.2
- q400.2: range queries with 400 insert/s per client, 2nd loop
- Legend for results is here.
- Each entry lists the percentage of responses that fit in that bucket (slower than max time for previous bucket, faster than min time for next bucket).
Query response time histogram
256us	1ms	4ms	16ms	64ms	256ms	1s	4s	16s	gt	max	tag
99.933	0.063	0.004	nonzero	nonzero	0.000	0.000	0.000	0.000	0.000	0.023	pg123.cx0
99.963	0.036	0.001	nonzero	0.000	0.000	0.000	0.000	0.000	0.000	0.008	pg123.cx1
99.957	0.039	0.003	0.001	0.000	0.000	0.000	0.000	0.000	0.000	0.010	pg123.cx2
99.961	0.034	0.004	0.001	0.000	0.000	0.000	0.000	0.000	0.000	0.010	pg123.cx3a
99.960	0.035	0.004	nonzero	0.000	0.000	0.000	0.000	0.000	0.000	0.010	pg123.cx3b
99.962	0.034	0.003	nonzero	0.000	0.000	0.000	0.000	0.000	0.000	0.008	pg123.cx3c
99.960	0.036	0.004	0.001	0.000	0.000	0.000	0.000	0.000	0.000	0.012	pg123.cx3d
99.962	0.033	0.004	0.001	0.000	0.000	0.000	0.000	0.000	0.000	0.010	pg123.cx4a
99.963	0.034	0.003	nonzero	0.000	0.000	0.000	0.000	0.000	0.000	0.010	pg123.cx4b
99.965	0.034	0.001	nonzero	0.000	0.000	0.000	0.000	0.000	0.000	0.006	pg123.cx5
99.958	0.037	0.004	0.001	0.000	0.000	0.000	0.000	0.000	0.000	0.011	pg123.cx6
Insert response time histogram
256us	1ms	4ms	16ms	64ms	256ms	1s	4s	16s	gt	max	tag
0.000	0.000	94.153	5.743	0.104	0.000	0.000	0.000	0.000	0.000	0.052	pg123.cx0
0.000	0.000	65.076	32.521	2.403	0.000	0.000	0.000	0.000	0.000	0.022	pg123.cx1
0.000	0.000	0.000	0.000	100.000	0.000	0.000	0.000	0.000	0.000	0.048	pg123.cx2
0.000	0.000	0.000	0.000	100.000	0.000	0.000	0.000	0.000	0.000	0.046	pg123.cx3a
0.000	0.000	0.000	0.000	100.000	0.000	0.000	0.000	0.000	0.000	0.047	pg123.cx3b
0.000	0.000	0.000	0.007	99.993	0.000	0.000	0.000	0.000	0.000	0.047	pg123.cx3c
0.000	0.000	0.000	0.007	99.993	0.000	0.000	0.000	0.000	0.000	0.047	pg123.cx3d
0.000	0.000	0.000	0.000	100.000	0.000	0.000	0.000	0.000	0.000	0.045	pg123.cx4a
0.000	0.000	0.000	0.000	100.000	0.000	0.000	0.000	0.000	0.000	0.046	pg123.cx4b
0.000	0.000	74.215	24.854	0.931	0.000	0.000	0.000	0.000	0.000	0.022	pg123.cx5
0.000	0.000	0.000	0.021	99.979	0.000	0.000	0.000	0.000	0.000	0.040	pg123.cx6
q600.2
- q600.2: range queries with 600 insert/s per client, 2nd loop
- Legend for results is here.
- Each entry lists the percentage of responses that fit in that bucket (slower than max time for previous bucket, faster than min time for next bucket).
Query response time histogram
256us	1ms	4ms	16ms	64ms	256ms	1s	4s	16s	gt	max	tag
99.743	0.250	0.006	0.001	0.001	0.000	0.000	0.000	0.000	0.000	0.040	pg123.cx0
99.940	0.059	0.001	nonzero	0.000	0.000	0.000	0.000	0.000	0.000	0.011	pg123.cx1
99.920	0.074	0.004	0.001	0.000	0.000	0.000	0.000	0.000	0.000	0.012	pg123.cx2
99.934	0.061	0.004	0.001	0.000	0.000	0.000	0.000	0.000	0.000	0.011	pg123.cx3a
99.938	0.058	0.004	nonzero	0.000	0.000	0.000	0.000	0.000	0.000	0.007	pg123.cx3b
99.940	0.056	0.004	nonzero	0.000	0.000	0.000	0.000	0.000	0.000	0.007	pg123.cx3c
99.936	0.060	0.004	nonzero	0.000	0.000	0.000	0.000	0.000	0.000	0.008	pg123.cx3d
99.941	0.055	0.004	nonzero	0.000	0.000	0.000	0.000	0.000	0.000	0.006	pg123.cx4a
99.936	0.060	0.004	nonzero	0.000	0.000	0.000	0.000	0.000	0.000	0.006	pg123.cx4b
99.946	0.053	0.001	nonzero	0.000	0.000	0.000	0.000	0.000	0.000	0.006	pg123.cx5
99.928	0.066	0.005	0.001	0.000	0.000	0.000	0.000	0.000	0.000	0.014	pg123.cx6
Insert response time histogram
256us	1ms	4ms	16ms	64ms	256ms	1s	4s	16s	gt	max	tag
0.000	0.000	84.750	15.032	0.218	0.000	0.000	0.000	0.000	0.000	0.036	pg123.cx0
0.000	0.000	50.329	48.292	1.380	0.000	0.000	0.000	0.000	0.000	0.028	pg123.cx1
0.000	0.000	0.000	0.005	99.995	0.000	0.000	0.000	0.000	0.000	0.046	pg123.cx2
0.000	0.000	0.000	5.894	94.106	0.000	0.000	0.000	0.000	0.000	0.050	pg123.cx3a
0.000	0.000	0.000	6.579	93.421	0.000	0.000	0.000	0.000	0.000	0.052	pg123.cx3b
0.000	0.000	0.000	6.079	93.921	0.000	0.000	0.000	0.000	0.000	0.041	pg123.cx3c
0.000	0.000	0.000	6.032	93.968	0.000	0.000	0.000	0.000	0.000	0.055	pg123.cx3d
0.000	0.000	0.000	6.394	93.606	0.000	0.000	0.000	0.000	0.000	0.049	pg123.cx4a
0.000	0.000	0.000	5.593	94.407	0.000	0.000	0.000	0.000	0.000	0.040	pg123.cx4b
0.000	0.000	60.819	38.426	0.755	0.000	0.000	0.000	0.000	0.000	0.029	pg123.cx5
0.000	0.000	0.000	8.065	91.935	0.000	0.000	0.000	0.000	0.000	0.044	pg123.cx6
q800.2
- q800.2: range queries with 800 insert/s per client, 2nd loop
- Legend for results is here.
- Each entry lists the percentage of responses that fit in that bucket (slower than max time for previous bucket, faster than min time for next bucket).
Query response time histogram
256us	1ms	4ms	16ms	64ms	256ms	1s	4s	16s	gt	max	tag
99.656	0.332	0.010	0.001	0.001	0.000	0.000	0.000	0.000	0.000	0.041	pg123.cx0
99.914	0.085	0.001	nonzero	0.000	0.000	0.000	0.000	0.000	0.000	0.009	pg123.cx1
99.906	0.088	0.005	0.001	0.000	0.000	0.000	0.000	0.000	0.000	0.015	pg123.cx2
99.919	0.076	0.004	0.001	nonzero	0.000	0.000	0.000	0.000	0.000	0.017	pg123.cx3a
99.916	0.079	0.004	nonzero	nonzero	0.000	0.000	0.000	0.000	0.000	0.016	pg123.cx3b
99.917	0.078	0.004	nonzero	nonzero	0.000	0.000	0.000	0.000	0.000	0.017	pg123.cx3c
99.917	0.079	0.005	nonzero	nonzero	0.000	0.000	0.000	0.000	0.000	0.017	pg123.cx3d
99.919	0.076	0.004	nonzero	0.000	0.000	0.000	0.000	0.000	0.000	0.012	pg123.cx4a
99.918	0.077	0.004	nonzero	nonzero	0.000	0.000	0.000	0.000	0.000	0.016	pg123.cx4b
99.926	0.073	0.001	nonzero	0.000	0.000	0.000	0.000	0.000	0.000	0.006	pg123.cx5
99.918	0.076	0.006	0.001	nonzero	0.000	0.000	0.000	0.000	0.000	0.017	pg123.cx6
Insert response time histogram
256us	1ms	4ms	16ms	64ms	256ms	1s	4s	16s	gt	max	tag
0.000	0.000	94.792	4.986	0.222	0.000	0.000	0.000	0.000	0.000	0.049	pg123.cx0
0.000	0.000	62.333	36.983	0.684	0.000	0.000	0.000	0.000	0.000	0.034	pg123.cx1
0.000	0.000	0.000	0.062	99.938	0.000	0.000	0.000	0.000	0.000	0.045	pg123.cx2
0.000	0.000	0.000	33.639	66.361	0.000	0.000	0.000	0.000	0.000	0.057	pg123.cx3a
0.000	0.000	0.000	34.066	65.934	0.000	0.000	0.000	0.000	0.000	0.051	pg123.cx3b
0.000	0.000	0.000	33.031	66.969	0.000	0.000	0.000	0.000	0.000	0.040	pg123.cx3c
0.000	0.000	0.000	32.542	67.458	0.000	0.000	0.000	0.000	0.000	0.042	pg123.cx3d
0.000	0.000	0.000	33.247	66.753	0.000	0.000	0.000	0.000	0.000	0.047	pg123.cx4a
0.000	0.000	0.000	33.035	66.965	0.000	0.000	0.000	0.000	0.000	0.043	pg123.cx4b
0.000	0.000	74.826	23.642	1.531	0.000	0.000	0.000	0.000	0.000	0.030	pg123.cx5
0.000	0.000	0.000	38.167	61.833	0.000	0.000	0.000	0.000	0.000	0.041	pg123.cx6
q1000.2
- q1000.2: range queries with 1000 insert/s per client, 2nd loop
- Legend for results is here.
- Each entry lists the percentage of responses that fit in that bucket (slower than max time for previous bucket, faster than min time for next bucket).
Query response time histogram
256us	1ms	4ms	16ms	64ms	256ms	1s	4s	16s	gt	max	tag
99.733	0.250	0.015	0.001	0.001	0.000	0.000	0.000	0.000	0.000	0.043	pg123.cx0
99.888	0.111	0.001	nonzero	0.000	0.000	0.000	0.000	0.000	0.000	0.011	pg123.cx1
99.871	0.121	0.006	0.002	0.000	0.000	0.000	0.000	0.000	0.000	0.012	pg123.cx2
99.886	0.107	0.005	0.002	0.000	0.000	0.000	0.000	0.000	0.000	0.011	pg123.cx3a
99.892	0.102	0.006	0.001	nonzero	0.000	0.000	0.000	0.000	0.000	0.017	pg123.cx3b
99.894	0.099	0.006	0.001	0.000	0.000	0.000	0.000	0.000	0.000	0.011	pg123.cx3c
99.893	0.100	0.006	0.001	0.000	0.000	0.000	0.000	0.000	0.000	0.013	pg123.cx3d
99.895	0.098	0.006	0.001	nonzero	0.000	0.000	0.000	0.000	0.000	0.017	pg123.cx4a
99.889	0.104	0.006	0.001	0.000	0.000	0.000	0.000	0.000	0.000	0.007	pg123.cx4b
99.903	0.096	0.001	nonzero	nonzero	0.000	0.000	0.000	0.000	0.000	0.017	pg123.cx5
99.893	0.098	0.009	0.001	0.000	0.000	0.000	0.000	0.000	0.000	0.016	pg123.cx6
Insert response time histogram
256us	1ms	4ms	16ms	64ms	256ms	1s	4s	16s	gt	max	tag
0.000	0.000	96.822	2.903	0.250	0.025	0.000	0.000	0.000	0.000	0.165	pg123.cx0
0.000	0.000	68.628	30.994	0.378	0.000	0.000	0.000	0.000	0.000	0.029	pg123.cx1
0.000	0.000	0.000	0.000	100.000	0.000	0.000	0.000	0.000	0.000	0.052	pg123.cx2
0.000	0.000	0.000	23.647	76.353	0.000	0.000	0.000	0.000	0.000	0.050	pg123.cx3a
0.000	0.000	0.000	40.883	59.117	0.000	0.000	0.000	0.000	0.000	0.055	pg123.cx3b
0.000	0.000	0.000	40.628	59.372	0.000	0.000	0.000	0.000	0.000	0.052	pg123.cx3c
0.000	0.000	0.000	40.508	59.492	0.000	0.000	0.000	0.000	0.000	0.052	pg123.cx3d
0.000	0.000	0.000	40.308	59.692	0.000	0.000	0.000	0.000	0.000	0.058	pg123.cx4a
0.000	0.000	0.000	40.700	59.300	0.000	0.000	0.000	0.000	0.000	0.054	pg123.cx4b
0.000	0.000	78.644	20.783	0.572	0.000	0.000	0.000	0.000	0.000	0.039	pg123.cx5
0.000	0.000	0.000	40.667	59.333	0.000	0.000	0.000	0.000	0.000	0.056	pg123.cx6