Introduction
This is a report for the insert benchmark with 800M docs and 1 client(s). It is generated by scripts (bash, awk, sed) and Tufte might not be impressed. An overview of the insert benchmark is here and a short update is here. Below, by DBMS, I mean DBMS+version.config. An example is my8020.c10b40 where my means MySQL, 8020 is version 8.0.20 and c10b40 is the name for the configuration file.
The test server has 8 AMD cores, 16G RAM and an NVMe SSD. It is described here as the Beelink. The benchmark was run with 1 client and there were 1 or 3 connections per client (1 for queries or inserts without rate limits, 1+1 for rate limited inserts+deletes). It uses 1 table. It loads 800M rows per table without secondary indexes, creates 3 secondary indexes per table, then inserts 5m rows per table with a delete per insert to avoid growing the table. It then does 6 read+write tests for 1800s each that do queries as fast as possible with 100,100,500,500,1000,1000 inserts/s and the same for deletes/s per client concurrent with the queries. The database is larger than memory. Clients and the DBMS share one server. The per-database configs are in the per-database subdirectories here.
The tested DBMS are:
- my8013_rel.cz10a_bee - MySQL 8.0.13 with InnoDB, rel build, cz10a_bee config
- my8014_rel.cz10a_bee - MySQL 8.0.14 with InnoDB, rel build, cz10a_bee config
- my8020_rel.cz10a_bee - MySQL 8.0.20 with InnoDB, rel build, cz10a_bee config
- my8028_rel.cz10a_bee - MySQL 8.0.28 with InnoDB, rel build, cz10a_bee config
- my8035_rel.cz10a_bee - MySQL 8.0.35 with InnoDB, rel build, cz10a_bee config
- my8035_rel.cz10aps0_bee - MySQL 8.0.35 with InnoDB, rel build, cz10aps0_bee config that disables the perf schema
- my8035_rel_lessps.cz10a_bee - MySQL 8.0.35 with InnoDB, rel_less build that disables most of the perf schema at compile time, cz10a_bee config
- my8036_rel.cz10a_bee - MySQL 8.0.36 with InnoDB, rel build, cz10a_bee config
Contents
- Summary
- l.i0: load without secondary indexes
- l.x: create secondary indexes
- l.i1: continue load after secondary indexes created with 50 inserts per transaction
- l.i2: continue load after secondary indexes created with 5 inserts per transaction
- qr100.L1: range queries with 100 insert/s per client
- qp100.L2: point queries with 100 insert/s per client
- qr500.L3: range queries with 500 insert/s per client
- qp500.L4: point queries with 500 insert/s per client
- qr1000.L5: range queries with 1000 insert/s per client
- qp1000.L6: point queries with 1000 insert/s per client
Summary
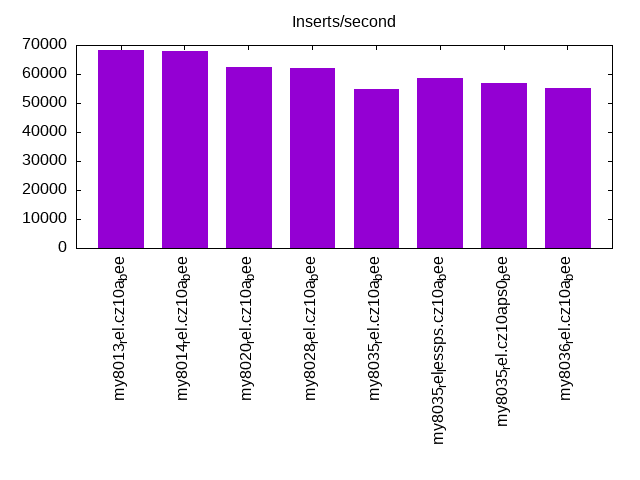
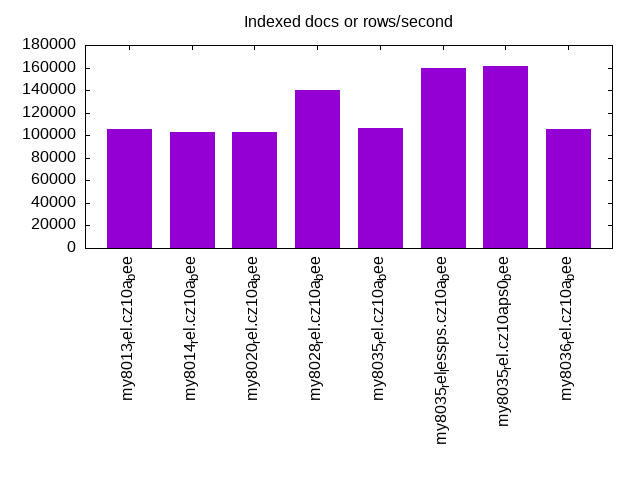
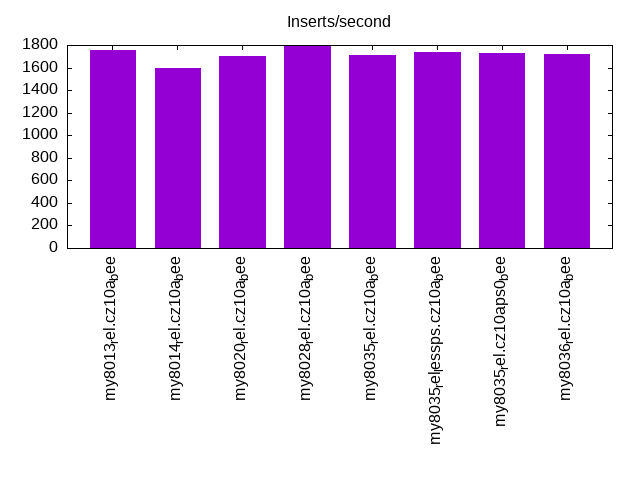
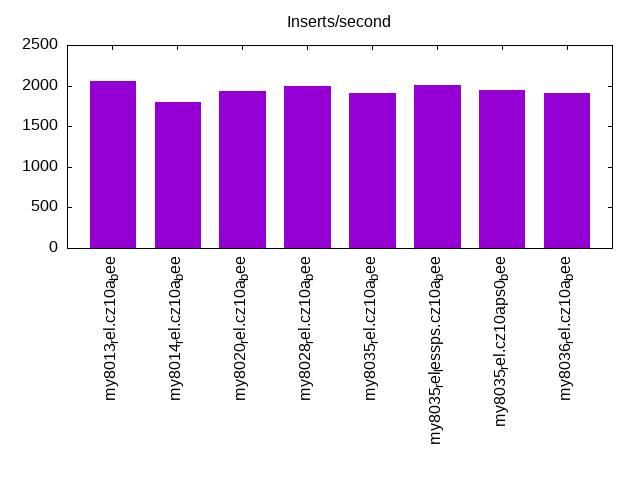
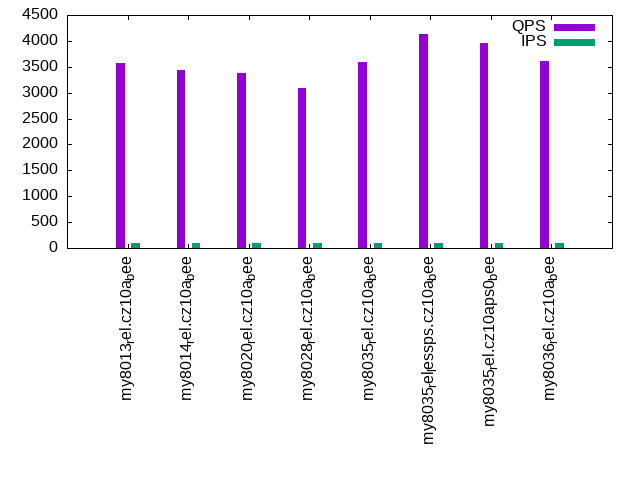
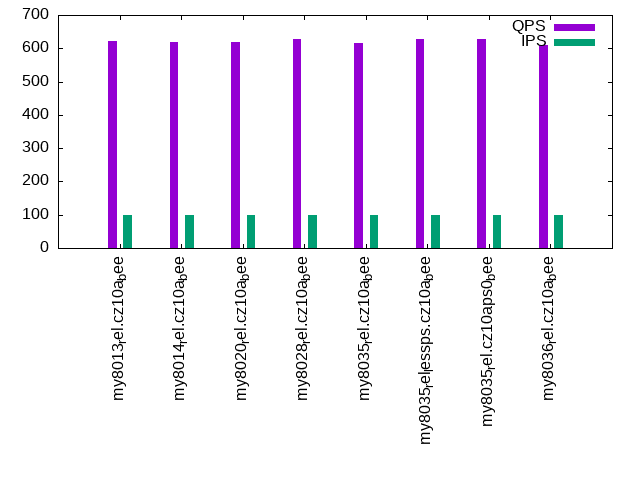
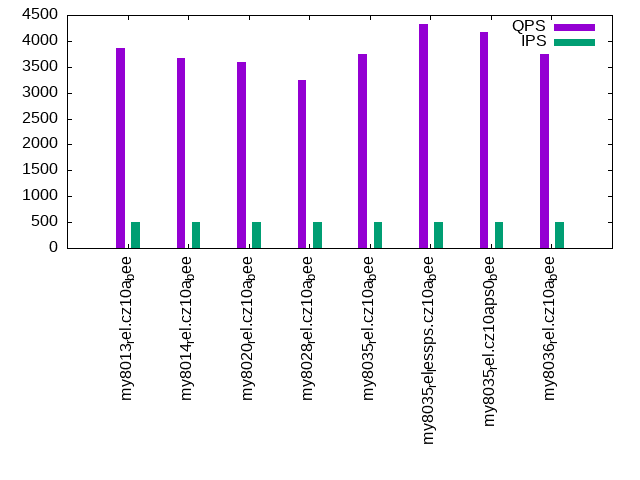
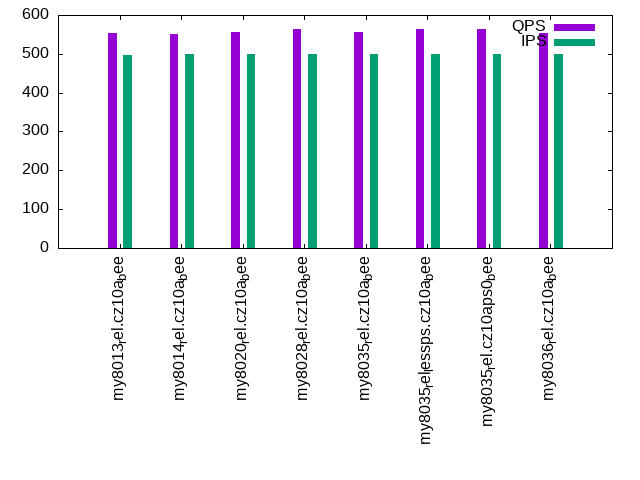
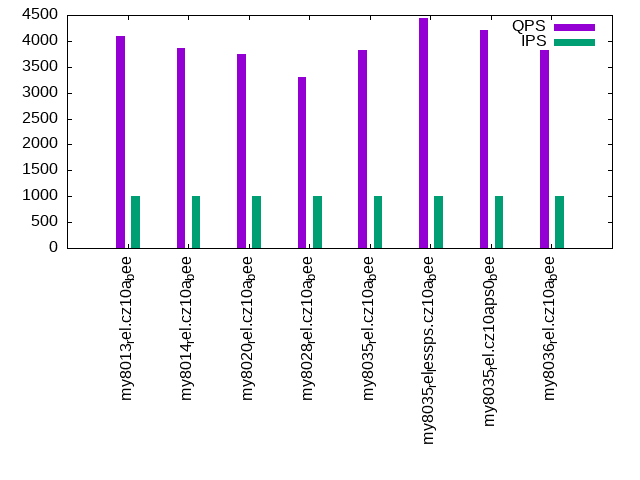
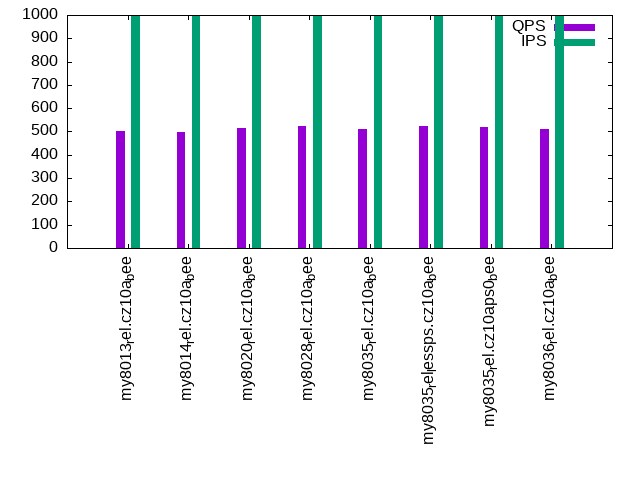
The numbers are inserts/s for l.i0, l.i1 and l.i2, indexed docs (or rows) /s for l.x and queries/s for qr100, qp100 thru qr1000, qp1000" The values are the average rate over the entire test for inserts (IPS) and queries (QPS). The range of values for IPS and QPS is split into 3 parts: bottom 25%, middle 50%, top 25%. Values in the bottom 25% have a red background, values in the top 25% have a green background and values in the middle have no color. A gray background is used for values that can be ignored because the DBMS did not sustain the target insert rate. Red backgrounds are not used when the minimum value is within 80% of the max value.
| dbms | l.i0 | l.x | l.i1 | l.i2 | qr100 | qp100 | qr500 | qp500 | qr1000 | qp1000 |
|---|---|---|---|---|---|---|---|---|---|---|
| my8013_rel.cz10a_bee | 68329 | 105235 | 1752 | 2053 | 3581 | 622 | 3870 | 553 | 4100 | 504 |
| my8014_rel.cz10a_bee | 67883 | 103106 | 1596 | 1802 | 3434 | 619 | 3679 | 550 | 3867 | 498 |
| my8020_rel.cz10a_bee | 62554 | 103172 | 1706 | 1934 | 3378 | 618 | 3599 | 555 | 3756 | 517 |
| my8028_rel.cz10a_bee | 62174 | 139714 | 1800 | 1992 | 3094 | 627 | 3249 | 565 | 3300 | 523 |
| my8035_rel.cz10a_bee | 54949 | 106738 | 1712 | 1905 | 3593 | 615 | 3738 | 556 | 3828 | 512 |
| my8035_rel_lessps.cz10a_bee | 58582 | 159267 | 1738 | 2008 | 4130 | 628 | 4334 | 565 | 4449 | 522 |
| my8035_rel.cz10aps0_bee | 56798 | 161258 | 1725 | 1946 | 3956 | 629 | 4174 | 563 | 4219 | 520 |
| my8036_rel.cz10a_bee | 55021 | 105152 | 1721 | 1912 | 3604 | 611 | 3750 | 553 | 3819 | 511 |
This table has relative throughput, throughput for the DBMS relative to the DBMS in the first line, using the absolute throughput from the previous table. Values less than 0.95 have a yellow background. Values greater than 1.05 have a blue background.
| dbms | l.i0 | l.x | l.i1 | l.i2 | qr100 | qp100 | qr500 | qp500 | qr1000 | qp1000 |
|---|---|---|---|---|---|---|---|---|---|---|
| my8013_rel.cz10a_bee | 1.00 | 1.00 | 1.00 | 1.00 | 1.00 | 1.00 | 1.00 | 1.00 | 1.00 | 1.00 |
| my8014_rel.cz10a_bee | 0.99 | 0.98 | 0.91 | 0.88 | 0.96 | 1.00 | 0.95 | 0.99 | 0.94 | 0.99 |
| my8020_rel.cz10a_bee | 0.92 | 0.98 | 0.97 | 0.94 | 0.94 | 0.99 | 0.93 | 1.00 | 0.92 | 1.03 |
| my8028_rel.cz10a_bee | 0.91 | 1.33 | 1.03 | 0.97 | 0.86 | 1.01 | 0.84 | 1.02 | 0.80 | 1.04 |
| my8035_rel.cz10a_bee | 0.80 | 1.01 | 0.98 | 0.93 | 1.00 | 0.99 | 0.97 | 1.01 | 0.93 | 1.02 |
| my8035_rel_lessps.cz10a_bee | 0.86 | 1.51 | 0.99 | 0.98 | 1.15 | 1.01 | 1.12 | 1.02 | 1.09 | 1.04 |
| my8035_rel.cz10aps0_bee | 0.83 | 1.53 | 0.98 | 0.95 | 1.10 | 1.01 | 1.08 | 1.02 | 1.03 | 1.03 |
| my8036_rel.cz10a_bee | 0.81 | 1.00 | 0.98 | 0.93 | 1.01 | 0.98 | 0.97 | 1.00 | 0.93 | 1.01 |
This lists the average rate of inserts/s for the tests that do inserts concurrent with queries. For such tests the query rate is listed in the table above. The read+write tests are setup so that the insert rate should match the target rate every second. Cells that are not at least 95% of the target have a red background to indicate a failure to satisfy the target.
| dbms | qr100.L1 | qp100.L2 | qr500.L3 | qp500.L4 | qr1000.L5 | qp1000.L6 |
|---|---|---|---|---|---|---|
| my8013_rel.cz10a_bee | 100 | 100 | 499 | 498 | 997 | 997 |
| my8014_rel.cz10a_bee | 100 | 100 | 499 | 499 | 998 | 998 |
| my8020_rel.cz10a_bee | 100 | 100 | 499 | 499 | 998 | 998 |
| my8028_rel.cz10a_bee | 100 | 100 | 499 | 499 | 998 | 998 |
| my8035_rel.cz10a_bee | 100 | 100 | 499 | 499 | 999 | 998 |
| my8035_rel_lessps.cz10a_bee | 100 | 100 | 499 | 499 | 998 | 998 |
| my8035_rel.cz10aps0_bee | 100 | 100 | 499 | 499 | 998 | 999 |
| my8036_rel.cz10a_bee | 100 | 100 | 499 | 499 | 998 | 998 |
| target | 100 | 100 | 500 | 500 | 1000 | 1000 |
l.i0
l.i0: load without secondary indexes. Graphs for performance per 1-second interval are here.
Average throughput:
Insert response time histogram: each cell has the percentage of responses that take <= the time in the header and max is the max response time in seconds. For the max column values in the top 25% of the range have a red background and in the bottom 25% of the range have a green background. The red background is not used when the min value is within 80% of the max value.
| dbms | 256us | 1ms | 4ms | 16ms | 64ms | 256ms | 1s | 4s | 16s | gt | max |
|---|---|---|---|---|---|---|---|---|---|---|---|
| my8013_rel.cz10a_bee | 99.483 | 0.381 | 0.134 | 0.002 | 0.104 | ||||||
| my8014_rel.cz10a_bee | 99.398 | 0.445 | 0.154 | 0.003 | 0.111 | ||||||
| my8020_rel.cz10a_bee | 99.364 | 0.460 | 0.172 | 0.004 | 0.126 | ||||||
| my8028_rel.cz10a_bee | 99.464 | 0.386 | 0.146 | 0.004 | 0.107 | ||||||
| my8035_rel.cz10a_bee | 99.406 | 0.445 | 0.146 | 0.003 | 0.183 | ||||||
| my8035_rel_lessps.cz10a_bee | 99.432 | 0.424 | 0.141 | 0.003 | 0.176 | ||||||
| my8035_rel.cz10aps0_bee | 99.417 | 0.437 | 0.143 | 0.003 | 0.092 | ||||||
| my8036_rel.cz10a_bee | 99.405 | 0.445 | 0.146 | 0.003 | 0.107 |
Performance metrics for the DBMS listed above. Some are normalized by throughput, others are not. Legend for results is here.
ips	qps	rps	rmbps	wps	wmbps	rpq	rkbpq	wpi	wkbpi	csps	cpups	cspq	cpupq	dbgb1	dbgb2	rss	maxop	p50	p99	tag
68329	0	22	0.1	363.4	26.0	0.000	0.001	0.005	0.389	55849	34.9	0.817	41	52.4	69.0	11.0	0.104	68426	60634	my8013_rel.cz10a_bee
67883	0	21	0.1	362.5	25.8	0.000	0.001	0.005	0.389	19399	22.9	0.286	27	52.4	69.0	11.1	0.111	67926	60455	my8014_rel.cz10a_bee
62554	0	0	0.0	388.3	23.5	0.000	0.000	0.006	0.385	17227	22.0	0.275	28	52.4	69.0	11.1	0.126	62466	55340	my8020_rel.cz10a_bee
62174	0	0	0.0	382.3	23.4	0.000	0.000	0.006	0.385	7186	21.0	0.116	27	52.4	69.0	11.0	0.107	62382	55556	my8028_rel.cz10a_bee
54949	0	0	0.0	338.5	20.8	0.000	0.000	0.006	0.388	6574	20.2	0.120	29	52.4	69.0	11.1	0.183	55081	49758	my8035_rel.cz10a_bee
58582	0	0	0.0	360.3	22.2	0.000	0.000	0.006	0.389	6980	20.9	0.119	29	52.4	69.0	10.7	0.176	58742	52940	my8035_rel_lessps.cz10a_bee
56798	0	0	0.0	349.3	21.6	0.000	0.000	0.006	0.389	6779	20.5	0.119	29	52.4	69.0	10.8	0.092	56933	51341	my8035_rel.cz10aps0_bee
55021	0	0	0.0	339.0	20.9	0.000	0.000	0.006	0.389	6582	20.2	0.120	29	52.4	69.0	11.1	0.107	55152	49746	my8036_rel.cz10a_bee
l.x
l.x: create secondary indexes.
Average throughput:
Performance metrics for the DBMS listed above. Some are normalized by throughput, others are not. Legend for results is here.
ips	qps	rps	rmbps	wps	wmbps	rpq	rkbpq	wpi	wkbpi	csps	cpups	cspq	cpupq	dbgb1	dbgb2	rss	maxop	p50	p99	tag
105235	0	688	106.1	815.5	125.5	0.007	1.032	0.008	1.222	10356	14.1	0.098	11	120.7	137.2	10.4	0.005	NA	NA	my8013_rel.cz10a_bee
103106	0	640	103.6	782.2	122.8	0.006	1.029	0.008	1.219	7072	12.2	0.069	9	120.7	137.2	10.5	0.005	NA	NA	my8014_rel.cz10a_bee
103172	0	638	103.7	891.4	122.9	0.006	1.029	0.009	1.220	6704	12.1	0.065	9	120.7	137.3	11.2	0.003	NA	NA	my8020_rel.cz10a_bee
139714	0	2346	222.4	2854.8	199.9	0.017	1.630	0.020	1.465	11025	42.5	0.079	24	120.7	137.3	11.2	0.004	NA	NA	my8028_rel.cz10a_bee
106738	0	1792	169.8	2181.0	152.7	0.017	1.629	0.020	1.465	8827	43.5	0.083	33	120.7	137.3	11.2	0.004	NA	NA	my8035_rel.cz10a_bee
159267	0	2675	253.6	3245.2	227.8	0.017	1.630	0.020	1.465	12843	40.8	0.081	20	120.7	137.3	10.9	0.003	NA	NA	my8035_rel_lessps.cz10a_bee
161258	0	2705	256.2	3287.6	230.8	0.017	1.627	0.020	1.466	13075	40.7	0.081	20	120.7	137.3	11.0	0.003	NA	NA	my8035_rel.cz10aps0_bee
105152	0	1765	167.4	2146.0	150.4	0.017	1.630	0.020	1.465	8686	43.6	0.083	33	120.7	137.3	11.2	0.004	NA	NA	my8036_rel.cz10a_bee
l.i1
l.i1: continue load after secondary indexes created with 50 inserts per transaction. Graphs for performance per 1-second interval are here.
Average throughput:
Insert response time histogram: each cell has the percentage of responses that take <= the time in the header and max is the max response time in seconds. For the max column values in the top 25% of the range have a red background and in the bottom 25% of the range have a green background. The red background is not used when the min value is within 80% of the max value.
| dbms | 256us | 1ms | 4ms | 16ms | 64ms | 256ms | 1s | 4s | 16s | gt | max |
|---|---|---|---|---|---|---|---|---|---|---|---|
| my8013_rel.cz10a_bee | 22.804 | 71.418 | 5.775 | 0.004 | 0.405 | ||||||
| my8014_rel.cz10a_bee | 13.581 | 80.082 | 6.333 | 0.004 | 0.396 | ||||||
| my8020_rel.cz10a_bee | 16.574 | 77.771 | 5.655 | 0.256 | |||||||
| my8028_rel.cz10a_bee | 22.089 | 72.719 | 5.190 | 0.003 | 0.467 | ||||||
| my8035_rel.cz10a_bee | 16.773 | 77.761 | 5.465 | 0.001 | 0.261 | ||||||
| my8035_rel_lessps.cz10a_bee | 19.220 | 75.355 | 5.425 | 0.212 | |||||||
| my8035_rel.cz10aps0_bee | 17.992 | 76.578 | 5.429 | 0.001 | 0.288 | ||||||
| my8036_rel.cz10a_bee | 17.570 | 77.000 | 5.430 | 0.249 |
Delete response time histogram: each cell has the percentage of responses that take <= the time in the header and max is the max response time in seconds. For the max column values in the top 25% of the range have a red background and in the bottom 25% of the range have a green background. The red background is not used when the min value is within 80% of the max value.
| dbms | 256us | 1ms | 4ms | 16ms | 64ms | 256ms | 1s | 4s | 16s | gt | max |
|---|---|---|---|---|---|---|---|---|---|---|---|
| my8013_rel.cz10a_bee | 81.141 | 17.752 | 1.076 | 0.030 | 0.150 | ||||||
| my8014_rel.cz10a_bee | 70.868 | 27.776 | 1.325 | 0.031 | 0.135 | ||||||
| my8020_rel.cz10a_bee | 73.189 | 25.725 | 1.061 | 0.025 | 0.107 | ||||||
| my8028_rel.cz10a_bee | 70.976 | 28.759 | 0.261 | 0.004 | 0.130 | ||||||
| my8035_rel.cz10a_bee | 47.145 | 52.521 | 0.329 | 0.005 | 0.076 | ||||||
| my8035_rel_lessps.cz10a_bee | 59.496 | 40.151 | 0.346 | 0.006 | 0.102 | ||||||
| my8035_rel.cz10aps0_bee | 53.604 | 46.084 | 0.310 | 0.003 | 0.068 | ||||||
| my8036_rel.cz10a_bee | 47.870 | 51.776 | 0.354 | 0.061 |
Performance metrics for the DBMS listed above. Some are normalized by throughput, others are not. Legend for results is here.
ips	qps	rps	rmbps	wps	wmbps	rpq	rkbpq	wpi	wkbpi	csps	cpups	cspq	cpupq	dbgb1	dbgb2	rss	maxop	p50	p99	tag
1752	0	8973	140.2	11206.0	361.1	5.121	81.941	6.396	211.051	93426	33.4	53.325	1525	150.0	166.6	10.7	0.405	1648	949	my8013_rel.cz10a_bee
1596	0	8171	127.7	10125.3	328.6	5.121	81.944	6.346	210.902	76633	18.9	48.031	948	150.0	166.6	10.5	0.396	1500	849	my8014_rel.cz10a_bee
1706	0	8804	137.6	13131.1	353.9	5.162	82.584	7.698	212.464	68615	17.3	40.227	811	149.6	166.4	10.5	0.256	1648	849	my8020_rel.cz10a_bee
1800	0	9270	144.8	13861.2	373.7	5.150	82.398	7.700	212.597	60823	21.8	33.789	969	149.6	166.3	10.7	0.467	1748	949	my8028_rel.cz10a_bee
1712	0	8835	138.0	13249.7	367.6	5.160	82.552	7.738	219.821	55841	22.8	32.611	1065	149.5	166.3	10.7	0.261	1648	899	my8035_rel.cz10a_bee
1738	0	8958	140.0	13417.9	372.3	5.155	82.486	7.722	219.413	56849	22.6	32.717	1041	149.6	166.4	10.6	0.212	1648	900	my8035_rel_lessps.cz10a_bee
1725	0	8871	138.6	13311.9	369.3	5.143	82.292	7.718	219.245	56185	22.8	32.575	1058	149.6	166.3	10.7	0.288	1648	949	my8035_rel.cz10aps0_bee
1721	0	8862	138.5	13288.6	368.6	5.149	82.380	7.721	219.326	56029	22.8	32.554	1060	149.6	166.3	10.7	0.249	1648	899	my8036_rel.cz10a_bee
l.i2
l.i2: continue load after secondary indexes created with 5 inserts per transaction. Graphs for performance per 1-second interval are here.
Average throughput:
Insert response time histogram: each cell has the percentage of responses that take <= the time in the header and max is the max response time in seconds. For the max column values in the top 25% of the range have a red background and in the bottom 25% of the range have a green background. The red background is not used when the min value is within 80% of the max value.
| dbms | 256us | 1ms | 4ms | 16ms | 64ms | 256ms | 1s | 4s | 16s | gt | max |
|---|---|---|---|---|---|---|---|---|---|---|---|
| my8013_rel.cz10a_bee | 7.239 | 85.565 | 6.324 | 0.869 | 0.003 | 0.088 | |||||
| my8014_rel.cz10a_bee | 3.517 | 87.070 | 8.636 | 0.773 | 0.003 | 0.097 | |||||
| my8020_rel.cz10a_bee | 4.154 | 90.511 | 4.507 | 0.819 | 0.010 | 0.144 | |||||
| my8028_rel.cz10a_bee | 3.712 | 90.631 | 5.132 | 0.523 | 0.001 | 0.068 | |||||
| my8035_rel.cz10a_bee | 2.627 | 91.239 | 5.518 | 0.617 | 0.001 | 0.077 | |||||
| my8035_rel_lessps.cz10a_bee | 4.250 | 90.020 | 5.163 | 0.564 | 0.002 | 0.083 | |||||
| my8035_rel.cz10aps0_bee | 3.365 | 90.665 | 5.365 | 0.603 | 0.002 | 0.085 | |||||
| my8036_rel.cz10a_bee | 2.724 | 91.200 | 5.470 | 0.605 | 0.001 | 0.064 |
Delete response time histogram: each cell has the percentage of responses that take <= the time in the header and max is the max response time in seconds. For the max column values in the top 25% of the range have a red background and in the bottom 25% of the range have a green background. The red background is not used when the min value is within 80% of the max value.
| dbms | 256us | 1ms | 4ms | 16ms | 64ms | 256ms | 1s | 4s | 16s | gt | max |
|---|---|---|---|---|---|---|---|---|---|---|---|
| my8013_rel.cz10a_bee | 62.184 | 36.984 | 0.656 | 0.176 | 0.001 | 0.100 | |||||
| my8014_rel.cz10a_bee | 44.897 | 53.727 | 1.164 | 0.211 | 0.001 | 0.069 | |||||
| my8020_rel.cz10a_bee | 49.256 | 49.801 | 0.766 | 0.176 | 0.002 | 0.128 | |||||
| my8028_rel.cz10a_bee | 30.416 | 69.006 | 0.538 | 0.040 | 0.049 | ||||||
| my8035_rel.cz10a_bee | 15.756 | 83.627 | 0.565 | 0.052 | 0.063 | ||||||
| my8035_rel_lessps.cz10a_bee | 28.775 | 70.663 | 0.523 | 0.038 | 0.046 | ||||||
| my8035_rel.cz10aps0_bee | 20.873 | 78.527 | 0.546 | 0.053 | 0.051 | ||||||
| my8036_rel.cz10a_bee | 15.007 | 84.361 | 0.576 | 0.056 | 0.048 |
Performance metrics for the DBMS listed above. Some are normalized by throughput, others are not. Legend for results is here.
ips	qps	rps	rmbps	wps	wmbps	rpq	rkbpq	wpi	wkbpi	csps	cpups	cspq	cpupq	dbgb1	dbgb2	rss	maxop	p50	p99	tag
2053	0	8072	126.1	9999.5	311.9	3.931	62.902	4.870	155.536	94898	40.5	46.217	1578	150.0	166.9	10.7	0.088	2038	1655	my8013_rel.cz10a_bee
1802	0	7363	115.0	8987.8	282.8	4.086	65.382	4.988	160.732	81949	28.6	45.482	1270	150.0	166.8	10.5	0.097	1749	1470	my8014_rel.cz10a_bee
1934	0	7993	124.9	11782.6	307.0	4.133	66.121	6.092	162.530	76380	28.7	39.489	1187	149.6	166.4	10.5	0.144	1874	1634	my8020_rel.cz10a_bee
1992	0	8394	131.2	12342.7	321.9	4.214	67.423	6.196	165.453	61348	30.9	30.797	1241	149.6	166.4	10.7	0.068	1949	1713	my8028_rel.cz10a_bee
1905	0	8092	126.4	11910.1	318.3	4.249	67.978	6.253	171.134	56420	31.8	29.622	1336	149.5	166.4	10.7	0.077	1858	1664	my8035_rel.cz10a_bee
2008	0	8271	129.2	12209.3	326.2	4.119	65.902	6.080	166.369	58517	31.8	29.142	1267	149.6	166.4	10.6	0.083	1948	1728	my8035_rel_lessps.cz10a_bee
1946	0	8154	127.4	12021.1	321.2	4.191	67.055	6.179	169.066	57640	32.0	29.628	1316	149.6	166.5	10.7	0.085	1903	1698	my8035_rel.cz10aps0_bee
1912	0	8088	126.4	11931.0	318.8	4.230	67.684	6.240	170.742	57007	32.2	29.816	1347	149.6	166.4	10.7	0.064	1873	1673	my8036_rel.cz10a_bee
qr100.L1
qr100.L1: range queries with 100 insert/s per client. Graphs for performance per 1-second interval are here.
Average throughput:
Query response time histogram: each cell has the percentage of responses that take <= the time in the header and max is the max response time in seconds. For max values in the top 25% of the range have a red background and in the bottom 25% of the range have a green background. The red background is not used when the min value is within 80% of the max value.
| dbms | 256us | 1ms | 4ms | 16ms | 64ms | 256ms | 1s | 4s | 16s | gt | max |
|---|---|---|---|---|---|---|---|---|---|---|---|
| my8013_rel.cz10a_bee | 56.205 | 43.610 | 0.171 | 0.015 | nonzero | 0.036 | |||||
| my8014_rel.cz10a_bee | 47.037 | 52.766 | 0.181 | 0.016 | nonzero | 0.035 | |||||
| my8020_rel.cz10a_bee | 40.364 | 59.436 | 0.182 | 0.017 | nonzero | 0.045 | |||||
| my8028_rel.cz10a_bee | 28.441 | 71.348 | 0.197 | 0.014 | 0.012 | ||||||
| my8035_rel.cz10a_bee | 53.250 | 46.745 | 0.005 | 0.001 | nonzero | 0.046 | |||||
| my8035_rel_lessps.cz10a_bee | 70.826 | 29.168 | 0.005 | nonzero | nonzero | 0.033 | |||||
| my8035_rel.cz10aps0_bee | 67.540 | 32.453 | 0.006 | 0.001 | nonzero | 0.031 | |||||
| my8036_rel.cz10a_bee | 54.508 | 45.486 | 0.005 | 0.001 | 0.009 |
Insert response time histogram: each cell has the percentage of responses that take <= the time in the header and max is the max response time in seconds. For max values in the top 25% of the range have a red background and in the bottom 25% of the range have a green background. The red background is not used when the min value is within 80% of the max value.
| dbms | 256us | 1ms | 4ms | 16ms | 64ms | 256ms | 1s | 4s | 16s | gt | max |
|---|---|---|---|---|---|---|---|---|---|---|---|
| my8013_rel.cz10a_bee | 14.083 | 85.917 | 0.045 | ||||||||
| my8014_rel.cz10a_bee | 5.722 | 94.250 | 0.028 | 0.072 | |||||||
| my8020_rel.cz10a_bee | 7.111 | 92.889 | 0.053 | ||||||||
| my8028_rel.cz10a_bee | 16.167 | 83.833 | 0.035 | ||||||||
| my8035_rel.cz10a_bee | 7.806 | 91.722 | 0.472 | 0.114 | |||||||
| my8035_rel_lessps.cz10a_bee | 11.917 | 88.083 | 0.037 | ||||||||
| my8035_rel.cz10aps0_bee | 10.139 | 89.861 | 0.061 | ||||||||
| my8036_rel.cz10a_bee | 8.556 | 91.250 | 0.194 | 0.104 |
Delete response time histogram: each cell has the percentage of responses that take <= the time in the header and max is the max response time in seconds. For max values in the top 25% of the range have a red background and in the bottom 25% of the range have a green background. The red background is not used when the min value is within 80% of the max value.
| dbms | 256us | 1ms | 4ms | 16ms | 64ms | 256ms | 1s | 4s | 16s | gt | max |
|---|---|---|---|---|---|---|---|---|---|---|---|
| my8013_rel.cz10a_bee | 95.972 | 3.944 | 0.083 | 0.019 | |||||||
| my8014_rel.cz10a_bee | 94.000 | 5.917 | 0.083 | 0.046 | |||||||
| my8020_rel.cz10a_bee | 93.639 | 6.361 | 0.015 | ||||||||
| my8028_rel.cz10a_bee | 99.222 | 0.778 | 0.014 | ||||||||
| my8035_rel.cz10a_bee | 97.056 | 2.278 | 0.667 | 0.043 | |||||||
| my8035_rel_lessps.cz10a_bee | 98.222 | 1.778 | 0.012 | ||||||||
| my8035_rel.cz10aps0_bee | 98.722 | 1.139 | 0.139 | 0.025 | |||||||
| my8036_rel.cz10a_bee | 98.639 | 1.222 | 0.139 | 0.039 |
Performance metrics for the DBMS listed above. Some are normalized by throughput, others are not. Legend for results is here.
ips	qps	rps	rmbps	wps	wmbps	rpq	rkbpq	wpi	wkbpi	csps	cpups	cspq	cpupq	dbgb1	dbgb2	rss	maxop	p50	p99	tag
100	3581	958	15.0	892.5	27.2	0.268	4.281	8.961	279.269	24340	15.3	6.797	342	150.0	166.9	10.7	0.036	3548	2253	my8013_rel.cz10a_bee
100	3434	956	14.9	868.0	26.6	0.278	4.454	8.697	273.081	20678	14.4	6.022	336	150.0	166.8	10.5	0.035	3404	2286	my8014_rel.cz10a_bee
100	3378	828	12.9	863.2	22.1	0.245	3.922	8.649	226.511	18599	14.0	5.506	332	149.6	166.4	10.5	0.045	3356	2399	my8020_rel.cz10a_bee
100	3094	633	9.9	568.5	14.6	0.205	3.274	5.702	150.334	15007	13.3	4.851	344	149.6	166.4	10.7	0.012	3084	2104	my8028_rel.cz10a_bee
100	3593	582	9.1	631.0	16.6	0.162	2.590	6.323	170.354	17037	13.9	4.742	309	149.5	166.4	10.7	0.046	3548	3308	my8035_rel.cz10a_bee
100	4130	651	10.2	739.9	19.4	0.158	2.522	7.421	199.604	19521	14.1	4.726	273	149.6	166.4	10.6	0.033	4060	3756	my8035_rel_lessps.cz10a_bee
100	3956	630	9.9	720.9	18.9	0.159	2.550	7.231	194.358	18774	14.2	4.745	287	149.6	166.5	10.7	0.031	3900	3596	my8035_rel.cz10aps0_bee
100	3604	590	9.2	652.6	17.2	0.164	2.621	6.539	176.023	17135	14.0	4.754	311	149.6	166.4	10.7	0.009	3564	3324	my8036_rel.cz10a_bee
qp100.L2
qp100.L2: point queries with 100 insert/s per client. Graphs for performance per 1-second interval are here.
Average throughput:
Query response time histogram: each cell has the percentage of responses that take <= the time in the header and max is the max response time in seconds. For max values in the top 25% of the range have a red background and in the bottom 25% of the range have a green background. The red background is not used when the min value is within 80% of the max value.
| dbms | 256us | 1ms | 4ms | 16ms | 64ms | 256ms | 1s | 4s | 16s | gt | max |
|---|---|---|---|---|---|---|---|---|---|---|---|
| my8013_rel.cz10a_bee | 0.186 | 99.487 | 0.326 | 0.001 | 0.037 | ||||||
| my8014_rel.cz10a_bee | 0.145 | 99.501 | 0.353 | 0.001 | 0.036 | ||||||
| my8020_rel.cz10a_bee | 0.131 | 99.649 | 0.220 | 0.001 | 0.043 | ||||||
| my8028_rel.cz10a_bee | 0.168 | 99.586 | 0.244 | 0.001 | 0.041 | ||||||
| my8035_rel.cz10a_bee | 0.106 | 99.645 | 0.248 | 0.001 | 0.045 | ||||||
| my8035_rel_lessps.cz10a_bee | 0.180 | 99.603 | 0.215 | 0.001 | 0.042 | ||||||
| my8035_rel.cz10aps0_bee | 0.186 | 99.577 | 0.236 | 0.001 | 0.044 | ||||||
| my8036_rel.cz10a_bee | 0.098 | 99.533 | 0.368 | 0.002 | 0.042 |
Insert response time histogram: each cell has the percentage of responses that take <= the time in the header and max is the max response time in seconds. For max values in the top 25% of the range have a red background and in the bottom 25% of the range have a green background. The red background is not used when the min value is within 80% of the max value.
| dbms | 256us | 1ms | 4ms | 16ms | 64ms | 256ms | 1s | 4s | 16s | gt | max |
|---|---|---|---|---|---|---|---|---|---|---|---|
| my8013_rel.cz10a_bee | 13.056 | 86.917 | 0.028 | 0.065 | |||||||
| my8014_rel.cz10a_bee | 4.056 | 95.917 | 0.028 | 0.111 | |||||||
| my8020_rel.cz10a_bee | 4.556 | 95.444 | 0.057 | ||||||||
| my8028_rel.cz10a_bee | 14.972 | 85.028 | 0.041 | ||||||||
| my8035_rel.cz10a_bee | 7.583 | 92.417 | 0.056 | ||||||||
| my8035_rel_lessps.cz10a_bee | 9.417 | 90.583 | 0.039 | ||||||||
| my8035_rel.cz10aps0_bee | 8.722 | 91.278 | 0.043 | ||||||||
| my8036_rel.cz10a_bee | 3.833 | 96.139 | 0.028 | 0.066 |
Delete response time histogram: each cell has the percentage of responses that take <= the time in the header and max is the max response time in seconds. For max values in the top 25% of the range have a red background and in the bottom 25% of the range have a green background. The red background is not used when the min value is within 80% of the max value.
| dbms | 256us | 1ms | 4ms | 16ms | 64ms | 256ms | 1s | 4s | 16s | gt | max |
|---|---|---|---|---|---|---|---|---|---|---|---|
| my8013_rel.cz10a_bee | 97.389 | 2.611 | 0.012 | ||||||||
| my8014_rel.cz10a_bee | 96.250 | 3.722 | 0.028 | 0.023 | |||||||
| my8020_rel.cz10a_bee | 95.194 | 4.722 | 0.083 | 0.019 | |||||||
| my8028_rel.cz10a_bee | 98.528 | 1.472 | 0.015 | ||||||||
| my8035_rel.cz10a_bee | 97.861 | 2.139 | 0.016 | ||||||||
| my8035_rel_lessps.cz10a_bee | 98.694 | 1.306 | 0.011 | ||||||||
| my8035_rel.cz10aps0_bee | 98.667 | 1.333 | 0.012 | ||||||||
| my8036_rel.cz10a_bee | 98.472 | 1.500 | 0.028 | 0.022 |
Performance metrics for the DBMS listed above. Some are normalized by throughput, others are not. Legend for results is here.
ips	qps	rps	rmbps	wps	wmbps	rpq	rkbpq	wpi	wkbpi	csps	cpups	cspq	cpupq	dbgb1	dbgb2	rss	maxop	p50	p99	tag
100	622	6178	96.5	990.9	30.1	9.926	158.809	9.959	309.718	22075	6.1	35.468	784	150.0	166.9	10.7	0.037	624	543	my8013_rel.cz10a_bee
100	619	6136	95.9	988.7	30.2	9.915	158.648	9.917	310.539	19435	5.7	31.407	737	150.0	166.8	10.5	0.036	623	559	my8014_rel.cz10a_bee
100	618	6123	95.7	1177.3	29.9	9.899	158.389	11.796	306.811	18199	5.5	29.425	711	149.6	166.4	10.5	0.043	623	559	my8020_rel.cz10a_bee
100	627	6196	96.8	1187.0	30.0	9.881	158.092	11.894	307.978	17945	5.5	28.615	702	149.6	166.4	10.7	0.041	624	575	my8028_rel.cz10a_bee
100	615	6098	95.3	1136.4	29.2	9.916	158.653	11.398	299.871	17650	5.9	28.699	768	149.5	166.4	10.7	0.045	623	559	my8035_rel.cz10a_bee
100	628	6202	96.9	1138.7	29.3	9.869	157.909	11.410	300.211	17939	5.5	28.548	700	149.6	166.4	10.6	0.042	639	575	my8035_rel_lessps.cz10a_bee
100	629	6212	97.1	1143.8	29.4	9.871	157.928	11.460	301.469	17950	5.7	28.523	725	149.6	166.5	10.7	0.044	639	575	my8035_rel.cz10aps0_bee
100	611	6059	94.7	1133.4	29.1	9.916	158.649	11.357	298.839	17530	6.1	28.686	799	149.6	166.4	10.7	0.042	623	543	my8036_rel.cz10a_bee
qr500.L3
qr500.L3: range queries with 500 insert/s per client. Graphs for performance per 1-second interval are here.
Average throughput:
Query response time histogram: each cell has the percentage of responses that take <= the time in the header and max is the max response time in seconds. For max values in the top 25% of the range have a red background and in the bottom 25% of the range have a green background. The red background is not used when the min value is within 80% of the max value.
| dbms | 256us | 1ms | 4ms | 16ms | 64ms | 256ms | 1s | 4s | 16s | gt | max |
|---|---|---|---|---|---|---|---|---|---|---|---|
| my8013_rel.cz10a_bee | 66.892 | 32.906 | 0.180 | 0.023 | 0.013 | ||||||
| my8014_rel.cz10a_bee | 59.046 | 40.745 | 0.186 | 0.023 | nonzero | 0.037 | |||||
| my8020_rel.cz10a_bee | 53.009 | 46.773 | 0.188 | 0.030 | nonzero | 0.040 | |||||
| my8028_rel.cz10a_bee | 38.424 | 61.336 | 0.211 | 0.029 | nonzero | 0.036 | |||||
| my8035_rel.cz10a_bee | 58.840 | 41.151 | 0.008 | 0.001 | 0.011 | ||||||
| my8035_rel_lessps.cz10a_bee | 75.891 | 24.102 | 0.006 | 0.001 | nonzero | 0.027 | |||||
| my8035_rel.cz10aps0_bee | 73.031 | 26.962 | 0.006 | 0.001 | nonzero | 0.023 | |||||
| my8036_rel.cz10a_bee | 59.465 | 40.526 | 0.008 | 0.001 | 0.010 |
Insert response time histogram: each cell has the percentage of responses that take <= the time in the header and max is the max response time in seconds. For max values in the top 25% of the range have a red background and in the bottom 25% of the range have a green background. The red background is not used when the min value is within 80% of the max value.
| dbms | 256us | 1ms | 4ms | 16ms | 64ms | 256ms | 1s | 4s | 16s | gt | max |
|---|---|---|---|---|---|---|---|---|---|---|---|
| my8013_rel.cz10a_bee | 65.044 | 34.950 | 0.006 | 0.069 | |||||||
| my8014_rel.cz10a_bee | 54.461 | 45.539 | 0.053 | ||||||||
| my8020_rel.cz10a_bee | 57.989 | 41.983 | 0.028 | 0.080 | |||||||
| my8028_rel.cz10a_bee | 70.389 | 29.611 | 0.036 | ||||||||
| my8035_rel.cz10a_bee | 58.406 | 41.583 | 0.011 | 0.083 | |||||||
| my8035_rel_lessps.cz10a_bee | 63.222 | 36.778 | 0.048 | ||||||||
| my8035_rel.cz10aps0_bee | 60.489 | 39.511 | 0.039 | ||||||||
| my8036_rel.cz10a_bee | 37.833 | 62.167 | 0.048 |
Delete response time histogram: each cell has the percentage of responses that take <= the time in the header and max is the max response time in seconds. For max values in the top 25% of the range have a red background and in the bottom 25% of the range have a green background. The red background is not used when the min value is within 80% of the max value.
| dbms | 256us | 1ms | 4ms | 16ms | 64ms | 256ms | 1s | 4s | 16s | gt | max |
|---|---|---|---|---|---|---|---|---|---|---|---|
| my8013_rel.cz10a_bee | 95.783 | 4.167 | 0.050 | 0.028 | |||||||
| my8014_rel.cz10a_bee | 93.700 | 6.272 | 0.028 | 0.021 | |||||||
| my8020_rel.cz10a_bee | 92.589 | 7.372 | 0.039 | 0.024 | |||||||
| my8028_rel.cz10a_bee | 98.917 | 1.083 | 0.013 | ||||||||
| my8035_rel.cz10a_bee | 97.250 | 2.728 | 0.022 | 0.031 | |||||||
| my8035_rel_lessps.cz10a_bee | 97.928 | 2.061 | 0.011 | 0.020 | |||||||
| my8035_rel.cz10aps0_bee | 98.372 | 1.617 | 0.011 | 0.017 | |||||||
| my8036_rel.cz10a_bee | 97.617 | 2.350 | 0.033 | 0.020 |
Performance metrics for the DBMS listed above. Some are normalized by throughput, others are not. Legend for results is here.
ips	qps	rps	rmbps	wps	wmbps	rpq	rkbpq	wpi	wkbpi	csps	cpups	cspq	cpupq	dbgb1	dbgb2	rss	maxop	p50	p99	tag
499	3870	3001	46.9	3244.8	100.2	0.775	12.407	6.508	205.854	41391	21.2	10.695	438	150.0	166.9	10.7	0.013	3868	2477	my8013_rel.cz10a_bee
499	3679	2997	46.8	3221.3	100.3	0.815	13.032	6.458	205.902	37107	18.1	10.086	394	150.0	166.8	10.5	0.037	3676	2174	my8014_rel.cz10a_bee
499	3599	2991	46.7	3877.4	100.0	0.831	13.295	7.769	205.152	32738	17.5	9.095	389	149.6	166.4	10.5	0.040	3593	2280	my8020_rel.cz10a_bee
499	3249	2990	46.7	3867.6	99.8	0.920	14.724	7.754	204.854	30081	18.0	9.258	443	149.6	166.4	10.7	0.036	3229	2048	my8028_rel.cz10a_bee
499	3738	2936	45.9	3890.6	102.5	0.785	12.568	7.800	210.372	31771	18.8	8.500	402	149.5	166.4	10.7	0.011	3708	3340	my8035_rel.cz10a_bee
499	4334	2940	45.9	3893.0	102.5	0.678	10.852	7.808	210.588	33967	18.5	7.837	341	149.6	166.4	10.6	0.027	4269	3818	my8035_rel_lessps.cz10a_bee
499	4174	2940	45.9	3891.6	102.5	0.704	11.269	7.802	210.438	33470	18.7	8.018	358	149.6	166.5	10.7	0.023	4123	3660	my8035_rel.cz10aps0_bee
499	3750	2938	45.9	3894.0	102.6	0.783	12.534	7.807	210.554	31892	18.9	8.505	403	149.6	166.4	10.7	0.010	3723	3324	my8036_rel.cz10a_bee
qp500.L4
qp500.L4: point queries with 500 insert/s per client. Graphs for performance per 1-second interval are here.
Average throughput:
Query response time histogram: each cell has the percentage of responses that take <= the time in the header and max is the max response time in seconds. For max values in the top 25% of the range have a red background and in the bottom 25% of the range have a green background. The red background is not used when the min value is within 80% of the max value.
| dbms | 256us | 1ms | 4ms | 16ms | 64ms | 256ms | 1s | 4s | 16s | gt | max |
|---|---|---|---|---|---|---|---|---|---|---|---|
| my8013_rel.cz10a_bee | 0.007 | 97.505 | 2.481 | 0.007 | 0.043 | ||||||
| my8014_rel.cz10a_bee | 0.006 | 97.485 | 2.501 | 0.007 | 0.045 | ||||||
| my8020_rel.cz10a_bee | 0.004 | 99.099 | 0.761 | 0.136 | 0.057 | ||||||
| my8028_rel.cz10a_bee | 0.005 | 99.030 | 0.869 | 0.096 | 0.054 | ||||||
| my8035_rel.cz10a_bee | 0.004 | 98.962 | 0.928 | 0.106 | 0.056 | ||||||
| my8035_rel_lessps.cz10a_bee | 0.009 | 99.019 | 0.857 | 0.115 | 0.055 | ||||||
| my8035_rel.cz10aps0_bee | 0.006 | 99.005 | 0.872 | 0.117 | 0.054 | ||||||
| my8036_rel.cz10a_bee | 0.003 | 98.765 | 1.177 | 0.054 | nonzero | 0.069 |
Insert response time histogram: each cell has the percentage of responses that take <= the time in the header and max is the max response time in seconds. For max values in the top 25% of the range have a red background and in the bottom 25% of the range have a green background. The red background is not used when the min value is within 80% of the max value.
| dbms | 256us | 1ms | 4ms | 16ms | 64ms | 256ms | 1s | 4s | 16s | gt | max |
|---|---|---|---|---|---|---|---|---|---|---|---|
| my8013_rel.cz10a_bee | 72.878 | 26.844 | 0.278 | 0.092 | |||||||
| my8014_rel.cz10a_bee | 61.806 | 37.950 | 0.244 | 0.105 | |||||||
| my8020_rel.cz10a_bee | 65.739 | 33.711 | 0.550 | 0.122 | |||||||
| my8028_rel.cz10a_bee | 81.894 | 17.783 | 0.322 | 0.104 | |||||||
| my8035_rel.cz10a_bee | 68.183 | 30.878 | 0.939 | 0.114 | |||||||
| my8035_rel_lessps.cz10a_bee | 75.100 | 24.706 | 0.194 | 0.110 | |||||||
| my8035_rel.cz10aps0_bee | 71.617 | 27.828 | 0.556 | 0.105 | |||||||
| my8036_rel.cz10a_bee | 47.217 | 51.967 | 0.817 | 0.113 |
Delete response time histogram: each cell has the percentage of responses that take <= the time in the header and max is the max response time in seconds. For max values in the top 25% of the range have a red background and in the bottom 25% of the range have a green background. The red background is not used when the min value is within 80% of the max value.
| dbms | 256us | 1ms | 4ms | 16ms | 64ms | 256ms | 1s | 4s | 16s | gt | max |
|---|---|---|---|---|---|---|---|---|---|---|---|
| my8013_rel.cz10a_bee | 94.667 | 4.806 | 0.528 | 0.043 | |||||||
| my8014_rel.cz10a_bee | 91.900 | 7.506 | 0.594 | 0.057 | |||||||
| my8020_rel.cz10a_bee | 92.550 | 7.044 | 0.406 | 0.055 | |||||||
| my8028_rel.cz10a_bee | 98.367 | 1.561 | 0.072 | 0.030 | |||||||
| my8035_rel.cz10a_bee | 95.433 | 4.306 | 0.261 | 0.030 | |||||||
| my8035_rel_lessps.cz10a_bee | 97.778 | 2.094 | 0.128 | 0.045 | |||||||
| my8035_rel.cz10aps0_bee | 96.572 | 3.228 | 0.200 | 0.051 | |||||||
| my8036_rel.cz10a_bee | 95.006 | 4.817 | 0.178 | 0.045 |
Performance metrics for the DBMS listed above. Some are normalized by throughput, others are not. Legend for results is here.
ips	qps	rps	rmbps	wps	wmbps	rpq	rkbpq	wpi	wkbpi	csps	cpups	cspq	cpupq	dbgb1	dbgb2	rss	maxop	p50	p99	tag
498	553	8268	129.2	3542.0	108.7	14.948	239.176	7.113	223.465	48027	11.0	86.832	1591	150.0	166.9	10.7	0.043	559	527	my8013_rel.cz10a_bee
499	550	8232	128.6	3512.3	108.6	14.962	239.388	7.037	222.843	37047	10.1	67.334	1469	150.0	166.8	10.5	0.045	544	512	my8014_rel.cz10a_bee
499	555	8272	129.3	4219.5	108.3	14.894	238.302	8.454	222.242	32312	9.1	58.178	1311	149.6	166.4	10.5	0.057	559	527	my8020_rel.cz10a_bee
499	565	8361	130.6	4224.8	108.5	14.791	236.658	8.465	222.547	30799	10.0	54.482	1415	149.6	166.4	10.7	0.054	560	543	my8028_rel.cz10a_bee
499	556	8276	129.3	4270.4	111.7	14.875	237.996	8.556	229.130	30497	10.7	54.812	1538	149.5	166.4	10.8	0.056	559	527	my8035_rel.cz10a_bee
499	565	8362	130.6	4275.3	111.8	14.791	236.660	8.566	229.395	30856	10.2	54.583	1443	149.6	166.4	10.6	0.055	560	543	my8035_rel_lessps.cz10a_bee
499	563	8338	130.3	4272.4	111.7	14.812	236.996	8.560	229.232	30695	10.4	54.530	1478	149.6	166.5	10.7	0.054	559	540	my8035_rel.cz10aps0_bee
499	553	8247	128.9	4269.7	111.7	14.911	238.577	8.555	229.094	30288	10.9	54.761	1577	149.6	166.4	10.7	0.069	559	512	my8036_rel.cz10a_bee
qr1000.L5
qr1000.L5: range queries with 1000 insert/s per client. Graphs for performance per 1-second interval are here.
Average throughput:
Query response time histogram: each cell has the percentage of responses that take <= the time in the header and max is the max response time in seconds. For max values in the top 25% of the range have a red background and in the bottom 25% of the range have a green background. The red background is not used when the min value is within 80% of the max value.
| dbms | 256us | 1ms | 4ms | 16ms | 64ms | 256ms | 1s | 4s | 16s | gt | max |
|---|---|---|---|---|---|---|---|---|---|---|---|
| my8013_rel.cz10a_bee | 73.047 | 26.756 | 0.186 | 0.011 | nonzero | 0.037 | |||||
| my8014_rel.cz10a_bee | 65.400 | 34.389 | 0.194 | 0.017 | nonzero | 0.035 | |||||
| my8020_rel.cz10a_bee | 59.931 | 39.858 | 0.194 | 0.017 | 0.001 | 0.049 | |||||
| my8028_rel.cz10a_bee | 40.499 | 59.253 | 0.229 | 0.018 | 0.001 | 0.047 | |||||
| my8035_rel.cz10a_bee | 61.790 | 38.191 | 0.018 | 0.001 | 0.011 | ||||||
| my8035_rel_lessps.cz10a_bee | 78.802 | 21.185 | 0.011 | 0.001 | 0.009 | ||||||
| my8035_rel.cz10aps0_bee | 74.718 | 25.268 | 0.013 | 0.001 | nonzero | 0.027 | |||||
| my8036_rel.cz10a_bee | 61.581 | 38.403 | 0.015 | 0.001 | 0.014 |
Insert response time histogram: each cell has the percentage of responses that take <= the time in the header and max is the max response time in seconds. For max values in the top 25% of the range have a red background and in the bottom 25% of the range have a green background. The red background is not used when the min value is within 80% of the max value.
| dbms | 256us | 1ms | 4ms | 16ms | 64ms | 256ms | 1s | 4s | 16s | gt | max |
|---|---|---|---|---|---|---|---|---|---|---|---|
| my8013_rel.cz10a_bee | 87.311 | 12.600 | 0.089 | 0.092 | |||||||
| my8014_rel.cz10a_bee | 81.958 | 18.033 | 0.008 | 0.080 | |||||||
| my8020_rel.cz10a_bee | 86.606 | 13.394 | 0.064 | ||||||||
| my8028_rel.cz10a_bee | 91.764 | 8.233 | 0.003 | 0.065 | |||||||
| my8035_rel.cz10a_bee | 84.750 | 15.131 | 0.119 | 0.113 | |||||||
| my8035_rel_lessps.cz10a_bee | 88.700 | 11.300 | 0.042 | ||||||||
| my8035_rel.cz10aps0_bee | 88.236 | 11.692 | 0.072 | 0.087 | |||||||
| my8036_rel.cz10a_bee | 86.419 | 13.581 | 0.041 |
Delete response time histogram: each cell has the percentage of responses that take <= the time in the header and max is the max response time in seconds. For max values in the top 25% of the range have a red background and in the bottom 25% of the range have a green background. The red background is not used when the min value is within 80% of the max value.
| dbms | 256us | 1ms | 4ms | 16ms | 64ms | 256ms | 1s | 4s | 16s | gt | max |
|---|---|---|---|---|---|---|---|---|---|---|---|
| my8013_rel.cz10a_bee | 96.433 | 3.206 | 0.361 | 0.057 | |||||||
| my8014_rel.cz10a_bee | 93.131 | 6.772 | 0.097 | 0.060 | |||||||
| my8020_rel.cz10a_bee | 94.181 | 5.775 | 0.044 | 0.050 | |||||||
| my8028_rel.cz10a_bee | 98.406 | 1.586 | 0.008 | 0.049 | |||||||
| my8035_rel.cz10a_bee | 95.100 | 4.883 | 0.017 | 0.019 | |||||||
| my8035_rel_lessps.cz10a_bee | 97.756 | 2.225 | 0.019 | 0.043 | |||||||
| my8035_rel.cz10aps0_bee | 96.817 | 3.167 | 0.017 | 0.021 | |||||||
| my8036_rel.cz10a_bee | 96.569 | 3.400 | 0.031 | 0.043 |
Performance metrics for the DBMS listed above. Some are normalized by throughput, others are not. Legend for results is here.
ips	qps	rps	rmbps	wps	wmbps	rpq	rkbpq	wpi	wkbpi	csps	cpups	cspq	cpupq	dbgb1	dbgb2	rss	maxop	p50	p99	tag
997	4100	5632	88.0	6390.5	197.0	1.374	21.981	6.408	202.253	67527	29.5	16.472	576	150.0	166.9	10.7	0.037	4124	2399	my8013_rel.cz10a_bee
998	3867	5628	87.9	6334.2	196.8	1.456	23.289	6.349	201.949	58760	22.7	15.196	470	150.0	166.8	10.5	0.035	3886	2221	my8014_rel.cz10a_bee
998	3756	5626	87.9	7645.8	196.7	1.498	23.961	7.663	201.834	49811	21.6	13.260	460	149.6	166.4	10.5	0.049	3772	2190	my8020_rel.cz10a_bee
998	3300	5625	87.9	7641.7	196.6	1.705	27.277	7.655	201.656	46476	22.8	14.086	553	149.6	166.4	10.7	0.047	3292	2062	my8028_rel.cz10a_bee
999	3828	5543	86.6	7626.9	199.7	1.448	23.170	7.636	204.688	48007	23.9	12.542	500	149.5	166.4	10.8	0.011	3788	3420	my8035_rel.cz10a_bee
998	4449	5545	86.6	7627.4	199.7	1.246	19.941	7.640	204.835	50441	23.5	11.338	423	149.6	166.4	10.6	0.009	4382	3884	my8035_rel_lessps.cz10a_bee
998	4219	5547	86.7	7630.3	199.8	1.315	21.040	7.648	205.017	49670	23.6	11.774	448	149.6	166.5	10.7	0.027	4171	3724	my8035_rel.cz10aps0_bee
998	3819	5542	86.6	7629.9	199.7	1.451	23.220	7.643	204.865	48241	23.9	12.633	501	149.6	166.4	10.7	0.014	3789	3404	my8036_rel.cz10a_bee
qp1000.L6
qp1000.L6: point queries with 1000 insert/s per client. Graphs for performance per 1-second interval are here.
Average throughput:
Query response time histogram: each cell has the percentage of responses that take <= the time in the header and max is the max response time in seconds. For max values in the top 25% of the range have a red background and in the bottom 25% of the range have a green background. The red background is not used when the min value is within 80% of the max value.
| dbms | 256us | 1ms | 4ms | 16ms | 64ms | 256ms | 1s | 4s | 16s | gt | max |
|---|---|---|---|---|---|---|---|---|---|---|---|
| my8013_rel.cz10a_bee | 0.001 | 94.888 | 5.097 | 0.014 | 0.057 | ||||||
| my8014_rel.cz10a_bee | 0.001 | 94.414 | 5.571 | 0.015 | 0.042 | ||||||
| my8020_rel.cz10a_bee | 0.001 | 98.095 | 1.664 | 0.241 | 0.061 | ||||||
| my8028_rel.cz10a_bee | 0.001 | 98.026 | 1.781 | 0.192 | 0.055 | ||||||
| my8035_rel.cz10a_bee | nonzero | 97.901 | 1.893 | 0.205 | 0.059 | ||||||
| my8035_rel_lessps.cz10a_bee | 0.001 | 97.971 | 1.827 | 0.201 | 0.062 | ||||||
| my8035_rel.cz10aps0_bee | 0.001 | 97.943 | 1.853 | 0.203 | nonzero | 0.091 | |||||
| my8036_rel.cz10a_bee | nonzero | 97.884 | 1.910 | 0.206 | 0.056 |
Insert response time histogram: each cell has the percentage of responses that take <= the time in the header and max is the max response time in seconds. For max values in the top 25% of the range have a red background and in the bottom 25% of the range have a green background. The red background is not used when the min value is within 80% of the max value.
| dbms | 256us | 1ms | 4ms | 16ms | 64ms | 256ms | 1s | 4s | 16s | gt | max |
|---|---|---|---|---|---|---|---|---|---|---|---|
| my8013_rel.cz10a_bee | 78.789 | 21.058 | 0.153 | 0.096 | |||||||
| my8014_rel.cz10a_bee | 67.275 | 32.486 | 0.239 | 0.106 | |||||||
| my8020_rel.cz10a_bee | 79.247 | 19.594 | 1.158 | 0.122 | |||||||
| my8028_rel.cz10a_bee | 87.803 | 11.067 | 1.131 | 0.119 | |||||||
| my8035_rel.cz10a_bee | 82.431 | 16.778 | 0.792 | 0.126 | |||||||
| my8035_rel_lessps.cz10a_bee | 85.447 | 14.119 | 0.433 | 0.117 | |||||||
| my8035_rel.cz10aps0_bee | 83.597 | 15.481 | 0.922 | 0.129 | |||||||
| my8036_rel.cz10a_bee | 80.508 | 18.756 | 0.736 | 0.114 |
Delete response time histogram: each cell has the percentage of responses that take <= the time in the header and max is the max response time in seconds. For max values in the top 25% of the range have a red background and in the bottom 25% of the range have a green background. The red background is not used when the min value is within 80% of the max value.
| dbms | 256us | 1ms | 4ms | 16ms | 64ms | 256ms | 1s | 4s | 16s | gt | max |
|---|---|---|---|---|---|---|---|---|---|---|---|
| my8013_rel.cz10a_bee | 97.172 | 2.653 | 0.172 | 0.003 | 0.078 | ||||||
| my8014_rel.cz10a_bee | 95.506 | 4.222 | 0.269 | 0.003 | 0.074 | ||||||
| my8020_rel.cz10a_bee | 95.119 | 4.372 | 0.506 | 0.003 | 0.070 | ||||||
| my8028_rel.cz10a_bee | 97.728 | 2.211 | 0.061 | 0.047 | |||||||
| my8035_rel.cz10a_bee | 95.450 | 4.378 | 0.172 | 0.046 | |||||||
| my8035_rel_lessps.cz10a_bee | 96.519 | 3.289 | 0.192 | 0.059 | |||||||
| my8035_rel.cz10aps0_bee | 96.042 | 3.789 | 0.169 | 0.058 | |||||||
| my8036_rel.cz10a_bee | 94.114 | 5.625 | 0.261 | 0.053 |
Performance metrics for the DBMS listed above. Some are normalized by throughput, others are not. Legend for results is here.
ips	qps	rps	rmbps	wps	wmbps	rpq	rkbpq	wpi	wkbpi	csps	cpups	cspq	cpupq	dbgb1	dbgb2	rss	maxop	p50	p99	tag
997	504	10555	164.9	6446.0	196.5	20.935	334.955	6.464	201.801	67066	22.7	133.014	3602	150.0	166.9	10.7	0.057	496	464	my8013_rel.cz10a_bee
998	498	10486	163.8	6385.3	196.2	21.076	337.222	6.396	201.256	58484	14.6	117.555	2348	150.0	166.8	10.5	0.042	496	448	my8014_rel.cz10a_bee
998	517	10674	166.8	7668.1	196.3	20.654	330.462	7.681	201.307	49073	13.2	94.956	2043	149.6	166.4	10.5	0.061	512	464	my8020_rel.cz10a_bee
998	523	10744	167.9	7671.3	196.5	20.526	328.420	7.689	201.633	45512	15.0	86.955	2293	149.6	166.4	10.7	0.055	527	495	my8028_rel.cz10a_bee
998	512	10633	166.1	7778.4	202.2	20.756	332.090	7.792	207.393	44779	16.1	87.408	2514	149.5	166.4	10.8	0.059	511	479	my8035_rel.cz10a_bee
998	522	10722	167.5	7777.8	202.2	20.561	328.967	7.796	207.508	45170	15.7	86.616	2408	149.6	166.4	10.6	0.062	527	479	my8035_rel_lessps.cz10a_bee
999	520	10700	167.2	7778.3	202.2	20.577	329.224	7.788	207.266	44980	15.8	86.499	2431	149.6	166.5	10.7	0.091	512	479	my8035_rel.cz10aps0_bee
998	511	10613	165.8	7770.8	202.0	20.777	332.424	7.784	207.153	44662	16.0	87.435	2506	149.6	166.4	10.7	0.056	511	463	my8036_rel.cz10a_bee
l.i0
l.i0: load without secondary indexes
Performance metrics for all DBMS, not just the ones listed above. Some are normalized by throughput, others are not. Legend for results is here.
ips	qps	rps	rmbps	wps	wmbps	rpq	rkbpq	wpi	wkbpi	csps	cpups	cspq	cpupq	dbgb1	dbgb2	rss	maxop	p50	p99	tag
68329	0	22	0.1	363.4	26.0	0.000	0.001	0.005	0.389	55849	34.9	0.817	41	52.4	69.0	11.0	0.104	68426	60634	my8013_rel.cz10a_bee
67883	0	21	0.1	362.5	25.8	0.000	0.001	0.005	0.389	19399	22.9	0.286	27	52.4	69.0	11.1	0.111	67926	60455	my8014_rel.cz10a_bee
62554	0	0	0.0	388.3	23.5	0.000	0.000	0.006	0.385	17227	22.0	0.275	28	52.4	69.0	11.1	0.126	62466	55340	my8020_rel.cz10a_bee
62174	0	0	0.0	382.3	23.4	0.000	0.000	0.006	0.385	7186	21.0	0.116	27	52.4	69.0	11.0	0.107	62382	55556	my8028_rel.cz10a_bee
54949	0	0	0.0	338.5	20.8	0.000	0.000	0.006	0.388	6574	20.2	0.120	29	52.4	69.0	11.1	0.183	55081	49758	my8035_rel.cz10a_bee
58582	0	0	0.0	360.3	22.2	0.000	0.000	0.006	0.389	6980	20.9	0.119	29	52.4	69.0	10.7	0.176	58742	52940	my8035_rel_lessps.cz10a_bee
56798	0	0	0.0	349.3	21.6	0.000	0.000	0.006	0.389	6779	20.5	0.119	29	52.4	69.0	10.8	0.092	56933	51341	my8035_rel.cz10aps0_bee
55021	0	0	0.0	339.0	20.9	0.000	0.000	0.006	0.389	6582	20.2	0.120	29	52.4	69.0	11.1	0.107	55152	49746	my8036_rel.cz10a_bee
l.x
l.x: create secondary indexes
Performance metrics for all DBMS, not just the ones listed above. Some are normalized by throughput, others are not. Legend for results is here.
ips	qps	rps	rmbps	wps	wmbps	rpq	rkbpq	wpi	wkbpi	csps	cpups	cspq	cpupq	dbgb1	dbgb2	rss	maxop	p50	p99	tag
105235	0	688	106.1	815.5	125.5	0.007	1.032	0.008	1.222	10356	14.1	0.098	11	120.7	137.2	10.4	0.005	NA	NA	my8013_rel.cz10a_bee
103106	0	640	103.6	782.2	122.8	0.006	1.029	0.008	1.219	7072	12.2	0.069	9	120.7	137.2	10.5	0.005	NA	NA	my8014_rel.cz10a_bee
103172	0	638	103.7	891.4	122.9	0.006	1.029	0.009	1.220	6704	12.1	0.065	9	120.7	137.3	11.2	0.003	NA	NA	my8020_rel.cz10a_bee
139714	0	2346	222.4	2854.8	199.9	0.017	1.630	0.020	1.465	11025	42.5	0.079	24	120.7	137.3	11.2	0.004	NA	NA	my8028_rel.cz10a_bee
106738	0	1792	169.8	2181.0	152.7	0.017	1.629	0.020	1.465	8827	43.5	0.083	33	120.7	137.3	11.2	0.004	NA	NA	my8035_rel.cz10a_bee
159267	0	2675	253.6	3245.2	227.8	0.017	1.630	0.020	1.465	12843	40.8	0.081	20	120.7	137.3	10.9	0.003	NA	NA	my8035_rel_lessps.cz10a_bee
161258	0	2705	256.2	3287.6	230.8	0.017	1.627	0.020	1.466	13075	40.7	0.081	20	120.7	137.3	11.0	0.003	NA	NA	my8035_rel.cz10aps0_bee
105152	0	1765	167.4	2146.0	150.4	0.017	1.630	0.020	1.465	8686	43.6	0.083	33	120.7	137.3	11.2	0.004	NA	NA	my8036_rel.cz10a_bee
l.i1
l.i1: continue load after secondary indexes created with 50 inserts per transaction
Performance metrics for all DBMS, not just the ones listed above. Some are normalized by throughput, others are not. Legend for results is here.
ips	qps	rps	rmbps	wps	wmbps	rpq	rkbpq	wpi	wkbpi	csps	cpups	cspq	cpupq	dbgb1	dbgb2	rss	maxop	p50	p99	tag
1752	0	8973	140.2	11206.0	361.1	5.121	81.941	6.396	211.051	93426	33.4	53.325	1525	150.0	166.6	10.7	0.405	1648	949	my8013_rel.cz10a_bee
1596	0	8171	127.7	10125.3	328.6	5.121	81.944	6.346	210.902	76633	18.9	48.031	948	150.0	166.6	10.5	0.396	1500	849	my8014_rel.cz10a_bee
1706	0	8804	137.6	13131.1	353.9	5.162	82.584	7.698	212.464	68615	17.3	40.227	811	149.6	166.4	10.5	0.256	1648	849	my8020_rel.cz10a_bee
1800	0	9270	144.8	13861.2	373.7	5.150	82.398	7.700	212.597	60823	21.8	33.789	969	149.6	166.3	10.7	0.467	1748	949	my8028_rel.cz10a_bee
1712	0	8835	138.0	13249.7	367.6	5.160	82.552	7.738	219.821	55841	22.8	32.611	1065	149.5	166.3	10.7	0.261	1648	899	my8035_rel.cz10a_bee
1738	0	8958	140.0	13417.9	372.3	5.155	82.486	7.722	219.413	56849	22.6	32.717	1041	149.6	166.4	10.6	0.212	1648	900	my8035_rel_lessps.cz10a_bee
1725	0	8871	138.6	13311.9	369.3	5.143	82.292	7.718	219.245	56185	22.8	32.575	1058	149.6	166.3	10.7	0.288	1648	949	my8035_rel.cz10aps0_bee
1721	0	8862	138.5	13288.6	368.6	5.149	82.380	7.721	219.326	56029	22.8	32.554	1060	149.6	166.3	10.7	0.249	1648	899	my8036_rel.cz10a_bee
l.i2
l.i2: continue load after secondary indexes created with 5 inserts per transaction
Performance metrics for all DBMS, not just the ones listed above. Some are normalized by throughput, others are not. Legend for results is here.
ips	qps	rps	rmbps	wps	wmbps	rpq	rkbpq	wpi	wkbpi	csps	cpups	cspq	cpupq	dbgb1	dbgb2	rss	maxop	p50	p99	tag
2053	0	8072	126.1	9999.5	311.9	3.931	62.902	4.870	155.536	94898	40.5	46.217	1578	150.0	166.9	10.7	0.088	2038	1655	my8013_rel.cz10a_bee
1802	0	7363	115.0	8987.8	282.8	4.086	65.382	4.988	160.732	81949	28.6	45.482	1270	150.0	166.8	10.5	0.097	1749	1470	my8014_rel.cz10a_bee
1934	0	7993	124.9	11782.6	307.0	4.133	66.121	6.092	162.530	76380	28.7	39.489	1187	149.6	166.4	10.5	0.144	1874	1634	my8020_rel.cz10a_bee
1992	0	8394	131.2	12342.7	321.9	4.214	67.423	6.196	165.453	61348	30.9	30.797	1241	149.6	166.4	10.7	0.068	1949	1713	my8028_rel.cz10a_bee
1905	0	8092	126.4	11910.1	318.3	4.249	67.978	6.253	171.134	56420	31.8	29.622	1336	149.5	166.4	10.7	0.077	1858	1664	my8035_rel.cz10a_bee
2008	0	8271	129.2	12209.3	326.2	4.119	65.902	6.080	166.369	58517	31.8	29.142	1267	149.6	166.4	10.6	0.083	1948	1728	my8035_rel_lessps.cz10a_bee
1946	0	8154	127.4	12021.1	321.2	4.191	67.055	6.179	169.066	57640	32.0	29.628	1316	149.6	166.5	10.7	0.085	1903	1698	my8035_rel.cz10aps0_bee
1912	0	8088	126.4	11931.0	318.8	4.230	67.684	6.240	170.742	57007	32.2	29.816	1347	149.6	166.4	10.7	0.064	1873	1673	my8036_rel.cz10a_bee
qr100.L1
qr100.L1: range queries with 100 insert/s per client
Performance metrics for all DBMS, not just the ones listed above. Some are normalized by throughput, others are not. Legend for results is here.
ips	qps	rps	rmbps	wps	wmbps	rpq	rkbpq	wpi	wkbpi	csps	cpups	cspq	cpupq	dbgb1	dbgb2	rss	maxop	p50	p99	tag
100	3581	958	15.0	892.5	27.2	0.268	4.281	8.961	279.269	24340	15.3	6.797	342	150.0	166.9	10.7	0.036	3548	2253	my8013_rel.cz10a_bee
100	3434	956	14.9	868.0	26.6	0.278	4.454	8.697	273.081	20678	14.4	6.022	336	150.0	166.8	10.5	0.035	3404	2286	my8014_rel.cz10a_bee
100	3378	828	12.9	863.2	22.1	0.245	3.922	8.649	226.511	18599	14.0	5.506	332	149.6	166.4	10.5	0.045	3356	2399	my8020_rel.cz10a_bee
100	3094	633	9.9	568.5	14.6	0.205	3.274	5.702	150.334	15007	13.3	4.851	344	149.6	166.4	10.7	0.012	3084	2104	my8028_rel.cz10a_bee
100	3593	582	9.1	631.0	16.6	0.162	2.590	6.323	170.354	17037	13.9	4.742	309	149.5	166.4	10.7	0.046	3548	3308	my8035_rel.cz10a_bee
100	4130	651	10.2	739.9	19.4	0.158	2.522	7.421	199.604	19521	14.1	4.726	273	149.6	166.4	10.6	0.033	4060	3756	my8035_rel_lessps.cz10a_bee
100	3956	630	9.9	720.9	18.9	0.159	2.550	7.231	194.358	18774	14.2	4.745	287	149.6	166.5	10.7	0.031	3900	3596	my8035_rel.cz10aps0_bee
100	3604	590	9.2	652.6	17.2	0.164	2.621	6.539	176.023	17135	14.0	4.754	311	149.6	166.4	10.7	0.009	3564	3324	my8036_rel.cz10a_bee
qp100.L2
qp100.L2: point queries with 100 insert/s per client
Performance metrics for all DBMS, not just the ones listed above. Some are normalized by throughput, others are not. Legend for results is here.
ips	qps	rps	rmbps	wps	wmbps	rpq	rkbpq	wpi	wkbpi	csps	cpups	cspq	cpupq	dbgb1	dbgb2	rss	maxop	p50	p99	tag
100	622	6178	96.5	990.9	30.1	9.926	158.809	9.959	309.718	22075	6.1	35.468	784	150.0	166.9	10.7	0.037	624	543	my8013_rel.cz10a_bee
100	619	6136	95.9	988.7	30.2	9.915	158.648	9.917	310.539	19435	5.7	31.407	737	150.0	166.8	10.5	0.036	623	559	my8014_rel.cz10a_bee
100	618	6123	95.7	1177.3	29.9	9.899	158.389	11.796	306.811	18199	5.5	29.425	711	149.6	166.4	10.5	0.043	623	559	my8020_rel.cz10a_bee
100	627	6196	96.8	1187.0	30.0	9.881	158.092	11.894	307.978	17945	5.5	28.615	702	149.6	166.4	10.7	0.041	624	575	my8028_rel.cz10a_bee
100	615	6098	95.3	1136.4	29.2	9.916	158.653	11.398	299.871	17650	5.9	28.699	768	149.5	166.4	10.7	0.045	623	559	my8035_rel.cz10a_bee
100	628	6202	96.9	1138.7	29.3	9.869	157.909	11.410	300.211	17939	5.5	28.548	700	149.6	166.4	10.6	0.042	639	575	my8035_rel_lessps.cz10a_bee
100	629	6212	97.1	1143.8	29.4	9.871	157.928	11.460	301.469	17950	5.7	28.523	725	149.6	166.5	10.7	0.044	639	575	my8035_rel.cz10aps0_bee
100	611	6059	94.7	1133.4	29.1	9.916	158.649	11.357	298.839	17530	6.1	28.686	799	149.6	166.4	10.7	0.042	623	543	my8036_rel.cz10a_bee
qr500.L3
qr500.L3: range queries with 500 insert/s per client
Performance metrics for all DBMS, not just the ones listed above. Some are normalized by throughput, others are not. Legend for results is here.
ips	qps	rps	rmbps	wps	wmbps	rpq	rkbpq	wpi	wkbpi	csps	cpups	cspq	cpupq	dbgb1	dbgb2	rss	maxop	p50	p99	tag
499	3870	3001	46.9	3244.8	100.2	0.775	12.407	6.508	205.854	41391	21.2	10.695	438	150.0	166.9	10.7	0.013	3868	2477	my8013_rel.cz10a_bee
499	3679	2997	46.8	3221.3	100.3	0.815	13.032	6.458	205.902	37107	18.1	10.086	394	150.0	166.8	10.5	0.037	3676	2174	my8014_rel.cz10a_bee
499	3599	2991	46.7	3877.4	100.0	0.831	13.295	7.769	205.152	32738	17.5	9.095	389	149.6	166.4	10.5	0.040	3593	2280	my8020_rel.cz10a_bee
499	3249	2990	46.7	3867.6	99.8	0.920	14.724	7.754	204.854	30081	18.0	9.258	443	149.6	166.4	10.7	0.036	3229	2048	my8028_rel.cz10a_bee
499	3738	2936	45.9	3890.6	102.5	0.785	12.568	7.800	210.372	31771	18.8	8.500	402	149.5	166.4	10.7	0.011	3708	3340	my8035_rel.cz10a_bee
499	4334	2940	45.9	3893.0	102.5	0.678	10.852	7.808	210.588	33967	18.5	7.837	341	149.6	166.4	10.6	0.027	4269	3818	my8035_rel_lessps.cz10a_bee
499	4174	2940	45.9	3891.6	102.5	0.704	11.269	7.802	210.438	33470	18.7	8.018	358	149.6	166.5	10.7	0.023	4123	3660	my8035_rel.cz10aps0_bee
499	3750	2938	45.9	3894.0	102.6	0.783	12.534	7.807	210.554	31892	18.9	8.505	403	149.6	166.4	10.7	0.010	3723	3324	my8036_rel.cz10a_bee
qp500.L4
qp500.L4: point queries with 500 insert/s per client
Performance metrics for all DBMS, not just the ones listed above. Some are normalized by throughput, others are not. Legend for results is here.
ips	qps	rps	rmbps	wps	wmbps	rpq	rkbpq	wpi	wkbpi	csps	cpups	cspq	cpupq	dbgb1	dbgb2	rss	maxop	p50	p99	tag
498	553	8268	129.2	3542.0	108.7	14.948	239.176	7.113	223.465	48027	11.0	86.832	1591	150.0	166.9	10.7	0.043	559	527	my8013_rel.cz10a_bee
499	550	8232	128.6	3512.3	108.6	14.962	239.388	7.037	222.843	37047	10.1	67.334	1469	150.0	166.8	10.5	0.045	544	512	my8014_rel.cz10a_bee
499	555	8272	129.3	4219.5	108.3	14.894	238.302	8.454	222.242	32312	9.1	58.178	1311	149.6	166.4	10.5	0.057	559	527	my8020_rel.cz10a_bee
499	565	8361	130.6	4224.8	108.5	14.791	236.658	8.465	222.547	30799	10.0	54.482	1415	149.6	166.4	10.7	0.054	560	543	my8028_rel.cz10a_bee
499	556	8276	129.3	4270.4	111.7	14.875	237.996	8.556	229.130	30497	10.7	54.812	1538	149.5	166.4	10.8	0.056	559	527	my8035_rel.cz10a_bee
499	565	8362	130.6	4275.3	111.8	14.791	236.660	8.566	229.395	30856	10.2	54.583	1443	149.6	166.4	10.6	0.055	560	543	my8035_rel_lessps.cz10a_bee
499	563	8338	130.3	4272.4	111.7	14.812	236.996	8.560	229.232	30695	10.4	54.530	1478	149.6	166.5	10.7	0.054	559	540	my8035_rel.cz10aps0_bee
499	553	8247	128.9	4269.7	111.7	14.911	238.577	8.555	229.094	30288	10.9	54.761	1577	149.6	166.4	10.7	0.069	559	512	my8036_rel.cz10a_bee
qr1000.L5
qr1000.L5: range queries with 1000 insert/s per client
Performance metrics for all DBMS, not just the ones listed above. Some are normalized by throughput, others are not. Legend for results is here.
ips	qps	rps	rmbps	wps	wmbps	rpq	rkbpq	wpi	wkbpi	csps	cpups	cspq	cpupq	dbgb1	dbgb2	rss	maxop	p50	p99	tag
997	4100	5632	88.0	6390.5	197.0	1.374	21.981	6.408	202.253	67527	29.5	16.472	576	150.0	166.9	10.7	0.037	4124	2399	my8013_rel.cz10a_bee
998	3867	5628	87.9	6334.2	196.8	1.456	23.289	6.349	201.949	58760	22.7	15.196	470	150.0	166.8	10.5	0.035	3886	2221	my8014_rel.cz10a_bee
998	3756	5626	87.9	7645.8	196.7	1.498	23.961	7.663	201.834	49811	21.6	13.260	460	149.6	166.4	10.5	0.049	3772	2190	my8020_rel.cz10a_bee
998	3300	5625	87.9	7641.7	196.6	1.705	27.277	7.655	201.656	46476	22.8	14.086	553	149.6	166.4	10.7	0.047	3292	2062	my8028_rel.cz10a_bee
999	3828	5543	86.6	7626.9	199.7	1.448	23.170	7.636	204.688	48007	23.9	12.542	500	149.5	166.4	10.8	0.011	3788	3420	my8035_rel.cz10a_bee
998	4449	5545	86.6	7627.4	199.7	1.246	19.941	7.640	204.835	50441	23.5	11.338	423	149.6	166.4	10.6	0.009	4382	3884	my8035_rel_lessps.cz10a_bee
998	4219	5547	86.7	7630.3	199.8	1.315	21.040	7.648	205.017	49670	23.6	11.774	448	149.6	166.5	10.7	0.027	4171	3724	my8035_rel.cz10aps0_bee
998	3819	5542	86.6	7629.9	199.7	1.451	23.220	7.643	204.865	48241	23.9	12.633	501	149.6	166.4	10.7	0.014	3789	3404	my8036_rel.cz10a_bee
qp1000.L6
qp1000.L6: point queries with 1000 insert/s per client
Performance metrics for all DBMS, not just the ones listed above. Some are normalized by throughput, others are not. Legend for results is here.
ips	qps	rps	rmbps	wps	wmbps	rpq	rkbpq	wpi	wkbpi	csps	cpups	cspq	cpupq	dbgb1	dbgb2	rss	maxop	p50	p99	tag
997	504	10555	164.9	6446.0	196.5	20.935	334.955	6.464	201.801	67066	22.7	133.014	3602	150.0	166.9	10.7	0.057	496	464	my8013_rel.cz10a_bee
998	498	10486	163.8	6385.3	196.2	21.076	337.222	6.396	201.256	58484	14.6	117.555	2348	150.0	166.8	10.5	0.042	496	448	my8014_rel.cz10a_bee
998	517	10674	166.8	7668.1	196.3	20.654	330.462	7.681	201.307	49073	13.2	94.956	2043	149.6	166.4	10.5	0.061	512	464	my8020_rel.cz10a_bee
998	523	10744	167.9	7671.3	196.5	20.526	328.420	7.689	201.633	45512	15.0	86.955	2293	149.6	166.4	10.7	0.055	527	495	my8028_rel.cz10a_bee
998	512	10633	166.1	7778.4	202.2	20.756	332.090	7.792	207.393	44779	16.1	87.408	2514	149.5	166.4	10.8	0.059	511	479	my8035_rel.cz10a_bee
998	522	10722	167.5	7777.8	202.2	20.561	328.967	7.796	207.508	45170	15.7	86.616	2408	149.6	166.4	10.6	0.062	527	479	my8035_rel_lessps.cz10a_bee
999	520	10700	167.2	7778.3	202.2	20.577	329.224	7.788	207.266	44980	15.8	86.499	2431	149.6	166.5	10.7	0.091	512	479	my8035_rel.cz10aps0_bee
998	511	10613	165.8	7770.8	202.0	20.777	332.424	7.784	207.153	44662	16.0	87.435	2506	149.6	166.4	10.7	0.056	511	463	my8036_rel.cz10a_bee
l.i0
- l.i0: load without secondary indexes
- Legend for results is here.
- Each entry lists the percentage of responses that fit in that bucket (slower than max time for previous bucket, faster than min time for next bucket).
Insert response time histogram
256us	1ms	4ms	16ms	64ms	256ms	1s	4s	16s	gt	max	tag
0.000	0.000	99.483	0.381	0.134	0.002	0.000	0.000	0.000	0.000	0.104	my8013_rel.cz10a_bee
0.000	0.000	99.398	0.445	0.154	0.003	0.000	0.000	0.000	0.000	0.111	my8014_rel.cz10a_bee
0.000	0.000	99.364	0.460	0.172	0.004	0.000	0.000	0.000	0.000	0.126	my8020_rel.cz10a_bee
0.000	0.000	99.464	0.386	0.146	0.004	0.000	0.000	0.000	0.000	0.107	my8028_rel.cz10a_bee
0.000	0.000	99.406	0.445	0.146	0.003	0.000	0.000	0.000	0.000	0.183	my8035_rel.cz10a_bee
0.000	0.000	99.432	0.424	0.141	0.003	0.000	0.000	0.000	0.000	0.176	my8035_rel_lessps.cz10a_bee
0.000	0.000	99.417	0.437	0.143	0.003	0.000	0.000	0.000	0.000	0.092	my8035_rel.cz10aps0_bee
0.000	0.000	99.405	0.445	0.146	0.003	0.000	0.000	0.000	0.000	0.107	my8036_rel.cz10a_bee
l.x
- l.x: create secondary indexes
- Legend for results is here.
- Each entry lists the percentage of responses that fit in that bucket (slower than max time for previous bucket, faster than min time for next bucket).
TODO - determine whether there is data for create index response time
l.i1
- l.i1: continue load after secondary indexes created with 50 inserts per transaction
- Legend for results is here.
- Each entry lists the percentage of responses that fit in that bucket (slower than max time for previous bucket, faster than min time for next bucket).
Insert response time histogram
256us	1ms	4ms	16ms	64ms	256ms	1s	4s	16s	gt	max	tag
0.000	0.000	0.000	22.804	71.418	5.775	0.004	0.000	0.000	0.000	0.405	my8013_rel.cz10a_bee
0.000	0.000	0.000	13.581	80.082	6.333	0.004	0.000	0.000	0.000	0.396	my8014_rel.cz10a_bee
0.000	0.000	0.000	16.574	77.771	5.655	0.000	0.000	0.000	0.000	0.256	my8020_rel.cz10a_bee
0.000	0.000	0.000	22.089	72.719	5.190	0.003	0.000	0.000	0.000	0.467	my8028_rel.cz10a_bee
0.000	0.000	0.000	16.773	77.761	5.465	0.001	0.000	0.000	0.000	0.261	my8035_rel.cz10a_bee
0.000	0.000	0.000	19.220	75.355	5.425	0.000	0.000	0.000	0.000	0.212	my8035_rel_lessps.cz10a_bee
0.000	0.000	0.000	17.992	76.578	5.429	0.001	0.000	0.000	0.000	0.288	my8035_rel.cz10aps0_bee
0.000	0.000	0.000	17.570	77.000	5.430	0.000	0.000	0.000	0.000	0.249	my8036_rel.cz10a_bee
Delete response time histogram
256us	1ms	4ms	16ms	64ms	256ms	1s	4s	16s	gt	max	tag
0.000	0.000	81.141	17.752	1.076	0.030	0.000	0.000	0.000	0.000	0.150	my8013_rel.cz10a_bee
0.000	0.000	70.868	27.776	1.325	0.031	0.000	0.000	0.000	0.000	0.135	my8014_rel.cz10a_bee
0.000	0.000	73.189	25.725	1.061	0.025	0.000	0.000	0.000	0.000	0.107	my8020_rel.cz10a_bee
0.000	0.000	70.976	28.759	0.261	0.004	0.000	0.000	0.000	0.000	0.130	my8028_rel.cz10a_bee
0.000	0.000	47.145	52.521	0.329	0.005	0.000	0.000	0.000	0.000	0.076	my8035_rel.cz10a_bee
0.000	0.000	59.496	40.151	0.346	0.006	0.000	0.000	0.000	0.000	0.102	my8035_rel_lessps.cz10a_bee
0.000	0.000	53.604	46.084	0.310	0.003	0.000	0.000	0.000	0.000	0.068	my8035_rel.cz10aps0_bee
0.000	0.000	47.870	51.776	0.354	0.000	0.000	0.000	0.000	0.000	0.061	my8036_rel.cz10a_bee
l.i2
- l.i2: continue load after secondary indexes created with 5 inserts per transaction
- Legend for results is here.
- Each entry lists the percentage of responses that fit in that bucket (slower than max time for previous bucket, faster than min time for next bucket).
Insert response time histogram
256us	1ms	4ms	16ms	64ms	256ms	1s	4s	16s	gt	max	tag
0.000	7.239	85.565	6.324	0.869	0.003	0.000	0.000	0.000	0.000	0.088	my8013_rel.cz10a_bee
0.000	3.517	87.070	8.636	0.773	0.003	0.000	0.000	0.000	0.000	0.097	my8014_rel.cz10a_bee
0.000	4.154	90.511	4.507	0.819	0.010	0.000	0.000	0.000	0.000	0.144	my8020_rel.cz10a_bee
0.000	3.712	90.631	5.132	0.523	0.001	0.000	0.000	0.000	0.000	0.068	my8028_rel.cz10a_bee
0.000	2.627	91.239	5.518	0.617	0.001	0.000	0.000	0.000	0.000	0.077	my8035_rel.cz10a_bee
0.000	4.250	90.020	5.163	0.564	0.002	0.000	0.000	0.000	0.000	0.083	my8035_rel_lessps.cz10a_bee
0.000	3.365	90.665	5.365	0.603	0.002	0.000	0.000	0.000	0.000	0.085	my8035_rel.cz10aps0_bee
0.000	2.724	91.200	5.470	0.605	0.001	0.000	0.000	0.000	0.000	0.064	my8036_rel.cz10a_bee
Delete response time histogram
256us	1ms	4ms	16ms	64ms	256ms	1s	4s	16s	gt	max	tag
0.000	62.184	36.984	0.656	0.176	0.001	0.000	0.000	0.000	0.000	0.100	my8013_rel.cz10a_bee
0.000	44.897	53.727	1.164	0.211	0.001	0.000	0.000	0.000	0.000	0.069	my8014_rel.cz10a_bee
0.000	49.256	49.801	0.766	0.176	0.002	0.000	0.000	0.000	0.000	0.128	my8020_rel.cz10a_bee
0.000	30.416	69.006	0.538	0.040	0.000	0.000	0.000	0.000	0.000	0.049	my8028_rel.cz10a_bee
0.000	15.756	83.627	0.565	0.052	0.000	0.000	0.000	0.000	0.000	0.063	my8035_rel.cz10a_bee
0.000	28.775	70.663	0.523	0.038	0.000	0.000	0.000	0.000	0.000	0.046	my8035_rel_lessps.cz10a_bee
0.000	20.873	78.527	0.546	0.053	0.000	0.000	0.000	0.000	0.000	0.051	my8035_rel.cz10aps0_bee
0.000	15.007	84.361	0.576	0.056	0.000	0.000	0.000	0.000	0.000	0.048	my8036_rel.cz10a_bee
qr100.L1
- qr100.L1: range queries with 100 insert/s per client
- Legend for results is here.
- Each entry lists the percentage of responses that fit in that bucket (slower than max time for previous bucket, faster than min time for next bucket).
Query response time histogram
256us	1ms	4ms	16ms	64ms	256ms	1s	4s	16s	gt	max	tag
56.205	43.610	0.171	0.015	nonzero	0.000	0.000	0.000	0.000	0.000	0.036	my8013_rel.cz10a_bee
47.037	52.766	0.181	0.016	nonzero	0.000	0.000	0.000	0.000	0.000	0.035	my8014_rel.cz10a_bee
40.364	59.436	0.182	0.017	nonzero	0.000	0.000	0.000	0.000	0.000	0.045	my8020_rel.cz10a_bee
28.441	71.348	0.197	0.014	0.000	0.000	0.000	0.000	0.000	0.000	0.012	my8028_rel.cz10a_bee
53.250	46.745	0.005	0.001	nonzero	0.000	0.000	0.000	0.000	0.000	0.046	my8035_rel.cz10a_bee
70.826	29.168	0.005	nonzero	nonzero	0.000	0.000	0.000	0.000	0.000	0.033	my8035_rel_lessps.cz10a_bee
67.540	32.453	0.006	0.001	nonzero	0.000	0.000	0.000	0.000	0.000	0.031	my8035_rel.cz10aps0_bee
54.508	45.486	0.005	0.001	0.000	0.000	0.000	0.000	0.000	0.000	0.009	my8036_rel.cz10a_bee
Insert response time histogram
256us	1ms	4ms	16ms	64ms	256ms	1s	4s	16s	gt	max	tag
0.000	0.000	0.000	14.083	85.917	0.000	0.000	0.000	0.000	0.000	0.045	my8013_rel.cz10a_bee
0.000	0.000	0.000	5.722	94.250	0.028	0.000	0.000	0.000	0.000	0.072	my8014_rel.cz10a_bee
0.000	0.000	0.000	7.111	92.889	0.000	0.000	0.000	0.000	0.000	0.053	my8020_rel.cz10a_bee
0.000	0.000	0.000	16.167	83.833	0.000	0.000	0.000	0.000	0.000	0.035	my8028_rel.cz10a_bee
0.000	0.000	0.000	7.806	91.722	0.472	0.000	0.000	0.000	0.000	0.114	my8035_rel.cz10a_bee
0.000	0.000	0.000	11.917	88.083	0.000	0.000	0.000	0.000	0.000	0.037	my8035_rel_lessps.cz10a_bee
0.000	0.000	0.000	10.139	89.861	0.000	0.000	0.000	0.000	0.000	0.061	my8035_rel.cz10aps0_bee
0.000	0.000	0.000	8.556	91.250	0.194	0.000	0.000	0.000	0.000	0.104	my8036_rel.cz10a_bee
Delete response time histogram
256us	1ms	4ms	16ms	64ms	256ms	1s	4s	16s	gt	max	tag
0.000	0.000	95.972	3.944	0.083	0.000	0.000	0.000	0.000	0.000	0.019	my8013_rel.cz10a_bee
0.000	0.000	94.000	5.917	0.083	0.000	0.000	0.000	0.000	0.000	0.046	my8014_rel.cz10a_bee
0.000	0.000	93.639	6.361	0.000	0.000	0.000	0.000	0.000	0.000	0.015	my8020_rel.cz10a_bee
0.000	0.000	99.222	0.778	0.000	0.000	0.000	0.000	0.000	0.000	0.014	my8028_rel.cz10a_bee
0.000	0.000	97.056	2.278	0.667	0.000	0.000	0.000	0.000	0.000	0.043	my8035_rel.cz10a_bee
0.000	0.000	98.222	1.778	0.000	0.000	0.000	0.000	0.000	0.000	0.012	my8035_rel_lessps.cz10a_bee
0.000	0.000	98.722	1.139	0.139	0.000	0.000	0.000	0.000	0.000	0.025	my8035_rel.cz10aps0_bee
0.000	0.000	98.639	1.222	0.139	0.000	0.000	0.000	0.000	0.000	0.039	my8036_rel.cz10a_bee
qp100.L2
- qp100.L2: point queries with 100 insert/s per client
- Legend for results is here.
- Each entry lists the percentage of responses that fit in that bucket (slower than max time for previous bucket, faster than min time for next bucket).
Query response time histogram
256us	1ms	4ms	16ms	64ms	256ms	1s	4s	16s	gt	max	tag
0.000	0.186	99.487	0.326	0.001	0.000	0.000	0.000	0.000	0.000	0.037	my8013_rel.cz10a_bee
0.000	0.145	99.501	0.353	0.001	0.000	0.000	0.000	0.000	0.000	0.036	my8014_rel.cz10a_bee
0.000	0.131	99.649	0.220	0.001	0.000	0.000	0.000	0.000	0.000	0.043	my8020_rel.cz10a_bee
0.000	0.168	99.586	0.244	0.001	0.000	0.000	0.000	0.000	0.000	0.041	my8028_rel.cz10a_bee
0.000	0.106	99.645	0.248	0.001	0.000	0.000	0.000	0.000	0.000	0.045	my8035_rel.cz10a_bee
0.000	0.180	99.603	0.215	0.001	0.000	0.000	0.000	0.000	0.000	0.042	my8035_rel_lessps.cz10a_bee
0.000	0.186	99.577	0.236	0.001	0.000	0.000	0.000	0.000	0.000	0.044	my8035_rel.cz10aps0_bee
0.000	0.098	99.533	0.368	0.002	0.000	0.000	0.000	0.000	0.000	0.042	my8036_rel.cz10a_bee
Insert response time histogram
256us	1ms	4ms	16ms	64ms	256ms	1s	4s	16s	gt	max	tag
0.000	0.000	0.000	13.056	86.917	0.028	0.000	0.000	0.000	0.000	0.065	my8013_rel.cz10a_bee
0.000	0.000	0.000	4.056	95.917	0.028	0.000	0.000	0.000	0.000	0.111	my8014_rel.cz10a_bee
0.000	0.000	0.000	4.556	95.444	0.000	0.000	0.000	0.000	0.000	0.057	my8020_rel.cz10a_bee
0.000	0.000	0.000	14.972	85.028	0.000	0.000	0.000	0.000	0.000	0.041	my8028_rel.cz10a_bee
0.000	0.000	0.000	7.583	92.417	0.000	0.000	0.000	0.000	0.000	0.056	my8035_rel.cz10a_bee
0.000	0.000	0.000	9.417	90.583	0.000	0.000	0.000	0.000	0.000	0.039	my8035_rel_lessps.cz10a_bee
0.000	0.000	0.000	8.722	91.278	0.000	0.000	0.000	0.000	0.000	0.043	my8035_rel.cz10aps0_bee
0.000	0.000	0.000	3.833	96.139	0.028	0.000	0.000	0.000	0.000	0.066	my8036_rel.cz10a_bee
Delete response time histogram
256us	1ms	4ms	16ms	64ms	256ms	1s	4s	16s	gt	max	tag
0.000	0.000	97.389	2.611	0.000	0.000	0.000	0.000	0.000	0.000	0.012	my8013_rel.cz10a_bee
0.000	0.000	96.250	3.722	0.028	0.000	0.000	0.000	0.000	0.000	0.023	my8014_rel.cz10a_bee
0.000	0.000	95.194	4.722	0.083	0.000	0.000	0.000	0.000	0.000	0.019	my8020_rel.cz10a_bee
0.000	0.000	98.528	1.472	0.000	0.000	0.000	0.000	0.000	0.000	0.015	my8028_rel.cz10a_bee
0.000	0.000	97.861	2.139	0.000	0.000	0.000	0.000	0.000	0.000	0.016	my8035_rel.cz10a_bee
0.000	0.000	98.694	1.306	0.000	0.000	0.000	0.000	0.000	0.000	0.011	my8035_rel_lessps.cz10a_bee
0.000	0.000	98.667	1.333	0.000	0.000	0.000	0.000	0.000	0.000	0.012	my8035_rel.cz10aps0_bee
0.000	0.000	98.472	1.500	0.028	0.000	0.000	0.000	0.000	0.000	0.022	my8036_rel.cz10a_bee
qr500.L3
- qr500.L3: range queries with 500 insert/s per client
- Legend for results is here.
- Each entry lists the percentage of responses that fit in that bucket (slower than max time for previous bucket, faster than min time for next bucket).
Query response time histogram
256us	1ms	4ms	16ms	64ms	256ms	1s	4s	16s	gt	max	tag
66.892	32.906	0.180	0.023	0.000	0.000	0.000	0.000	0.000	0.000	0.013	my8013_rel.cz10a_bee
59.046	40.745	0.186	0.023	nonzero	0.000	0.000	0.000	0.000	0.000	0.037	my8014_rel.cz10a_bee
53.009	46.773	0.188	0.030	nonzero	0.000	0.000	0.000	0.000	0.000	0.040	my8020_rel.cz10a_bee
38.424	61.336	0.211	0.029	nonzero	0.000	0.000	0.000	0.000	0.000	0.036	my8028_rel.cz10a_bee
58.840	41.151	0.008	0.001	0.000	0.000	0.000	0.000	0.000	0.000	0.011	my8035_rel.cz10a_bee
75.891	24.102	0.006	0.001	nonzero	0.000	0.000	0.000	0.000	0.000	0.027	my8035_rel_lessps.cz10a_bee
73.031	26.962	0.006	0.001	nonzero	0.000	0.000	0.000	0.000	0.000	0.023	my8035_rel.cz10aps0_bee
59.465	40.526	0.008	0.001	0.000	0.000	0.000	0.000	0.000	0.000	0.010	my8036_rel.cz10a_bee
Insert response time histogram
256us	1ms	4ms	16ms	64ms	256ms	1s	4s	16s	gt	max	tag
0.000	0.000	0.000	65.044	34.950	0.006	0.000	0.000	0.000	0.000	0.069	my8013_rel.cz10a_bee
0.000	0.000	0.000	54.461	45.539	0.000	0.000	0.000	0.000	0.000	0.053	my8014_rel.cz10a_bee
0.000	0.000	0.000	57.989	41.983	0.028	0.000	0.000	0.000	0.000	0.080	my8020_rel.cz10a_bee
0.000	0.000	0.000	70.389	29.611	0.000	0.000	0.000	0.000	0.000	0.036	my8028_rel.cz10a_bee
0.000	0.000	0.000	58.406	41.583	0.011	0.000	0.000	0.000	0.000	0.083	my8035_rel.cz10a_bee
0.000	0.000	0.000	63.222	36.778	0.000	0.000	0.000	0.000	0.000	0.048	my8035_rel_lessps.cz10a_bee
0.000	0.000	0.000	60.489	39.511	0.000	0.000	0.000	0.000	0.000	0.039	my8035_rel.cz10aps0_bee
0.000	0.000	0.000	37.833	62.167	0.000	0.000	0.000	0.000	0.000	0.048	my8036_rel.cz10a_bee
Delete response time histogram
256us	1ms	4ms	16ms	64ms	256ms	1s	4s	16s	gt	max	tag
0.000	0.000	95.783	4.167	0.050	0.000	0.000	0.000	0.000	0.000	0.028	my8013_rel.cz10a_bee
0.000	0.000	93.700	6.272	0.028	0.000	0.000	0.000	0.000	0.000	0.021	my8014_rel.cz10a_bee
0.000	0.000	92.589	7.372	0.039	0.000	0.000	0.000	0.000	0.000	0.024	my8020_rel.cz10a_bee
0.000	0.000	98.917	1.083	0.000	0.000	0.000	0.000	0.000	0.000	0.013	my8028_rel.cz10a_bee
0.000	0.000	97.250	2.728	0.022	0.000	0.000	0.000	0.000	0.000	0.031	my8035_rel.cz10a_bee
0.000	0.000	97.928	2.061	0.011	0.000	0.000	0.000	0.000	0.000	0.020	my8035_rel_lessps.cz10a_bee
0.000	0.000	98.372	1.617	0.011	0.000	0.000	0.000	0.000	0.000	0.017	my8035_rel.cz10aps0_bee
0.000	0.000	97.617	2.350	0.033	0.000	0.000	0.000	0.000	0.000	0.020	my8036_rel.cz10a_bee
qp500.L4
- qp500.L4: point queries with 500 insert/s per client
- Legend for results is here.
- Each entry lists the percentage of responses that fit in that bucket (slower than max time for previous bucket, faster than min time for next bucket).
Query response time histogram
256us	1ms	4ms	16ms	64ms	256ms	1s	4s	16s	gt	max	tag
0.000	0.007	97.505	2.481	0.007	0.000	0.000	0.000	0.000	0.000	0.043	my8013_rel.cz10a_bee
0.000	0.006	97.485	2.501	0.007	0.000	0.000	0.000	0.000	0.000	0.045	my8014_rel.cz10a_bee
0.000	0.004	99.099	0.761	0.136	0.000	0.000	0.000	0.000	0.000	0.057	my8020_rel.cz10a_bee
0.000	0.005	99.030	0.869	0.096	0.000	0.000	0.000	0.000	0.000	0.054	my8028_rel.cz10a_bee
0.000	0.004	98.962	0.928	0.106	0.000	0.000	0.000	0.000	0.000	0.056	my8035_rel.cz10a_bee
0.000	0.009	99.019	0.857	0.115	0.000	0.000	0.000	0.000	0.000	0.055	my8035_rel_lessps.cz10a_bee
0.000	0.006	99.005	0.872	0.117	0.000	0.000	0.000	0.000	0.000	0.054	my8035_rel.cz10aps0_bee
0.000	0.003	98.765	1.177	0.054	nonzero	0.000	0.000	0.000	0.000	0.069	my8036_rel.cz10a_bee
Insert response time histogram
256us	1ms	4ms	16ms	64ms	256ms	1s	4s	16s	gt	max	tag
0.000	0.000	0.000	72.878	26.844	0.278	0.000	0.000	0.000	0.000	0.092	my8013_rel.cz10a_bee
0.000	0.000	0.000	61.806	37.950	0.244	0.000	0.000	0.000	0.000	0.105	my8014_rel.cz10a_bee
0.000	0.000	0.000	65.739	33.711	0.550	0.000	0.000	0.000	0.000	0.122	my8020_rel.cz10a_bee
0.000	0.000	0.000	81.894	17.783	0.322	0.000	0.000	0.000	0.000	0.104	my8028_rel.cz10a_bee
0.000	0.000	0.000	68.183	30.878	0.939	0.000	0.000	0.000	0.000	0.114	my8035_rel.cz10a_bee
0.000	0.000	0.000	75.100	24.706	0.194	0.000	0.000	0.000	0.000	0.110	my8035_rel_lessps.cz10a_bee
0.000	0.000	0.000	71.617	27.828	0.556	0.000	0.000	0.000	0.000	0.105	my8035_rel.cz10aps0_bee
0.000	0.000	0.000	47.217	51.967	0.817	0.000	0.000	0.000	0.000	0.113	my8036_rel.cz10a_bee
Delete response time histogram
256us	1ms	4ms	16ms	64ms	256ms	1s	4s	16s	gt	max	tag
0.000	0.000	94.667	4.806	0.528	0.000	0.000	0.000	0.000	0.000	0.043	my8013_rel.cz10a_bee
0.000	0.000	91.900	7.506	0.594	0.000	0.000	0.000	0.000	0.000	0.057	my8014_rel.cz10a_bee
0.000	0.000	92.550	7.044	0.406	0.000	0.000	0.000	0.000	0.000	0.055	my8020_rel.cz10a_bee
0.000	0.000	98.367	1.561	0.072	0.000	0.000	0.000	0.000	0.000	0.030	my8028_rel.cz10a_bee
0.000	0.000	95.433	4.306	0.261	0.000	0.000	0.000	0.000	0.000	0.030	my8035_rel.cz10a_bee
0.000	0.000	97.778	2.094	0.128	0.000	0.000	0.000	0.000	0.000	0.045	my8035_rel_lessps.cz10a_bee
0.000	0.000	96.572	3.228	0.200	0.000	0.000	0.000	0.000	0.000	0.051	my8035_rel.cz10aps0_bee
0.000	0.000	95.006	4.817	0.178	0.000	0.000	0.000	0.000	0.000	0.045	my8036_rel.cz10a_bee
qr1000.L5
- qr1000.L5: range queries with 1000 insert/s per client
- Legend for results is here.
- Each entry lists the percentage of responses that fit in that bucket (slower than max time for previous bucket, faster than min time for next bucket).
Query response time histogram
256us	1ms	4ms	16ms	64ms	256ms	1s	4s	16s	gt	max	tag
73.047	26.756	0.186	0.011	nonzero	0.000	0.000	0.000	0.000	0.000	0.037	my8013_rel.cz10a_bee
65.400	34.389	0.194	0.017	nonzero	0.000	0.000	0.000	0.000	0.000	0.035	my8014_rel.cz10a_bee
59.931	39.858	0.194	0.017	0.001	0.000	0.000	0.000	0.000	0.000	0.049	my8020_rel.cz10a_bee
40.499	59.253	0.229	0.018	0.001	0.000	0.000	0.000	0.000	0.000	0.047	my8028_rel.cz10a_bee
61.790	38.191	0.018	0.001	0.000	0.000	0.000	0.000	0.000	0.000	0.011	my8035_rel.cz10a_bee
78.802	21.185	0.011	0.001	0.000	0.000	0.000	0.000	0.000	0.000	0.009	my8035_rel_lessps.cz10a_bee
74.718	25.268	0.013	0.001	nonzero	0.000	0.000	0.000	0.000	0.000	0.027	my8035_rel.cz10aps0_bee
61.581	38.403	0.015	0.001	0.000	0.000	0.000	0.000	0.000	0.000	0.014	my8036_rel.cz10a_bee
Insert response time histogram
256us	1ms	4ms	16ms	64ms	256ms	1s	4s	16s	gt	max	tag
0.000	0.000	0.000	87.311	12.600	0.089	0.000	0.000	0.000	0.000	0.092	my8013_rel.cz10a_bee
0.000	0.000	0.000	81.958	18.033	0.008	0.000	0.000	0.000	0.000	0.080	my8014_rel.cz10a_bee
0.000	0.000	0.000	86.606	13.394	0.000	0.000	0.000	0.000	0.000	0.064	my8020_rel.cz10a_bee
0.000	0.000	0.000	91.764	8.233	0.003	0.000	0.000	0.000	0.000	0.065	my8028_rel.cz10a_bee
0.000	0.000	0.000	84.750	15.131	0.119	0.000	0.000	0.000	0.000	0.113	my8035_rel.cz10a_bee
0.000	0.000	0.000	88.700	11.300	0.000	0.000	0.000	0.000	0.000	0.042	my8035_rel_lessps.cz10a_bee
0.000	0.000	0.000	88.236	11.692	0.072	0.000	0.000	0.000	0.000	0.087	my8035_rel.cz10aps0_bee
0.000	0.000	0.000	86.419	13.581	0.000	0.000	0.000	0.000	0.000	0.041	my8036_rel.cz10a_bee
Delete response time histogram
256us	1ms	4ms	16ms	64ms	256ms	1s	4s	16s	gt	max	tag
0.000	0.000	96.433	3.206	0.361	0.000	0.000	0.000	0.000	0.000	0.057	my8013_rel.cz10a_bee
0.000	0.000	93.131	6.772	0.097	0.000	0.000	0.000	0.000	0.000	0.060	my8014_rel.cz10a_bee
0.000	0.000	94.181	5.775	0.044	0.000	0.000	0.000	0.000	0.000	0.050	my8020_rel.cz10a_bee
0.000	0.000	98.406	1.586	0.008	0.000	0.000	0.000	0.000	0.000	0.049	my8028_rel.cz10a_bee
0.000	0.000	95.100	4.883	0.017	0.000	0.000	0.000	0.000	0.000	0.019	my8035_rel.cz10a_bee
0.000	0.000	97.756	2.225	0.019	0.000	0.000	0.000	0.000	0.000	0.043	my8035_rel_lessps.cz10a_bee
0.000	0.000	96.817	3.167	0.017	0.000	0.000	0.000	0.000	0.000	0.021	my8035_rel.cz10aps0_bee
0.000	0.000	96.569	3.400	0.031	0.000	0.000	0.000	0.000	0.000	0.043	my8036_rel.cz10a_bee
qp1000.L6
- qp1000.L6: point queries with 1000 insert/s per client
- Legend for results is here.
- Each entry lists the percentage of responses that fit in that bucket (slower than max time for previous bucket, faster than min time for next bucket).
Query response time histogram
256us	1ms	4ms	16ms	64ms	256ms	1s	4s	16s	gt	max	tag
0.000	0.001	94.888	5.097	0.014	0.000	0.000	0.000	0.000	0.000	0.057	my8013_rel.cz10a_bee
0.000	0.001	94.414	5.571	0.015	0.000	0.000	0.000	0.000	0.000	0.042	my8014_rel.cz10a_bee
0.000	0.001	98.095	1.664	0.241	0.000	0.000	0.000	0.000	0.000	0.061	my8020_rel.cz10a_bee
0.000	0.001	98.026	1.781	0.192	0.000	0.000	0.000	0.000	0.000	0.055	my8028_rel.cz10a_bee
0.000	nonzero	97.901	1.893	0.205	0.000	0.000	0.000	0.000	0.000	0.059	my8035_rel.cz10a_bee
0.000	0.001	97.971	1.827	0.201	0.000	0.000	0.000	0.000	0.000	0.062	my8035_rel_lessps.cz10a_bee
0.000	0.001	97.943	1.853	0.203	nonzero	0.000	0.000	0.000	0.000	0.091	my8035_rel.cz10aps0_bee
0.000	nonzero	97.884	1.910	0.206	0.000	0.000	0.000	0.000	0.000	0.056	my8036_rel.cz10a_bee
Insert response time histogram
256us	1ms	4ms	16ms	64ms	256ms	1s	4s	16s	gt	max	tag
0.000	0.000	0.000	78.789	21.058	0.153	0.000	0.000	0.000	0.000	0.096	my8013_rel.cz10a_bee
0.000	0.000	0.000	67.275	32.486	0.239	0.000	0.000	0.000	0.000	0.106	my8014_rel.cz10a_bee
0.000	0.000	0.000	79.247	19.594	1.158	0.000	0.000	0.000	0.000	0.122	my8020_rel.cz10a_bee
0.000	0.000	0.000	87.803	11.067	1.131	0.000	0.000	0.000	0.000	0.119	my8028_rel.cz10a_bee
0.000	0.000	0.000	82.431	16.778	0.792	0.000	0.000	0.000	0.000	0.126	my8035_rel.cz10a_bee
0.000	0.000	0.000	85.447	14.119	0.433	0.000	0.000	0.000	0.000	0.117	my8035_rel_lessps.cz10a_bee
0.000	0.000	0.000	83.597	15.481	0.922	0.000	0.000	0.000	0.000	0.129	my8035_rel.cz10aps0_bee
0.000	0.000	0.000	80.508	18.756	0.736	0.000	0.000	0.000	0.000	0.114	my8036_rel.cz10a_bee
Delete response time histogram
256us	1ms	4ms	16ms	64ms	256ms	1s	4s	16s	gt	max	tag
0.000	0.000	97.172	2.653	0.172	0.003	0.000	0.000	0.000	0.000	0.078	my8013_rel.cz10a_bee
0.000	0.000	95.506	4.222	0.269	0.003	0.000	0.000	0.000	0.000	0.074	my8014_rel.cz10a_bee
0.000	0.000	95.119	4.372	0.506	0.003	0.000	0.000	0.000	0.000	0.070	my8020_rel.cz10a_bee
0.000	0.000	97.728	2.211	0.061	0.000	0.000	0.000	0.000	0.000	0.047	my8028_rel.cz10a_bee
0.000	0.000	95.450	4.378	0.172	0.000	0.000	0.000	0.000	0.000	0.046	my8035_rel.cz10a_bee
0.000	0.000	96.519	3.289	0.192	0.000	0.000	0.000	0.000	0.000	0.059	my8035_rel_lessps.cz10a_bee
0.000	0.000	96.042	3.789	0.169	0.000	0.000	0.000	0.000	0.000	0.058	my8035_rel.cz10aps0_bee
0.000	0.000	94.114	5.625	0.261	0.000	0.000	0.000	0.000	0.000	0.053	my8036_rel.cz10a_bee