Introduction
This is a report for the insert benchmark with 30M docs and 1 client(s). It is generated by scripts (bash, awk, sed) and Tufte might not be impressed. An overview of the insert benchmark is here and a short update is here. Below, by DBMS, I mean DBMS+version.config. An example is my8020.c10b40 where my means MySQL, 8020 is version 8.0.20 and c10b40 is the name for the configuration file.
The test server has 8 AMD cores, 16G RAM and an NVMe SSD. It is described here as the Beelink. The benchmark was run with 1 client and there were 1 or 3 connections per client (1 for queries or inserts without rate limits, 1+1 for rate limited inserts+deletes). It uses 1 table. It loads 30M rows per table without secondary indexes, creates 3 secondary indexes per table, then inserts 40m+10m rows per table with a delete per insert to avoid growing the table. It then does 6 read+write tests for 1800s each that do queries as fast as possible with 100,100,500,500,1000,1000 inserts/s and the same for deletes/s per client concurrent with the queries. The database is cached in memory. Clients and the DBMS share one server. The per-database configs are in the per-database subdirectories here.
The tested DBMS are:
- my5651_rel.cz11a_bee - MySQL 5.6.51 with the cz11a_bee config
- my5744_rel.cz11a_bee - MySQL 5.7.44 with the cz11a_bee config
- my8036_rel.cz11a_bee - MySQL 8.0.36 with the cz11a_bee config
- my8036_rel.cz11b_bee - MySQL 8.0.36 with the cz11b_bee config that uses innodb_flush_method=O_DIRECT
- my8036_rel.cz11c_bee - MySQL 8.0.36 with the cz11c_bee config that uses innodb_flush_method=fsync
- my8036_rel.cz11d_bee - MySQL 8.0.36 with the cz11d_bee config that uses innodb_change_buffering=none
Contents
- Summary
- l.i0: load without secondary indexes
- l.x: create secondary indexes
- l.i1: continue load after secondary indexes created with 50 inserts per transaction
- l.i2: continue load after secondary indexes created with 5 inserts per transaction
- qr100.L1: range queries with 100 insert/s per client
- qp100.L2: point queries with 100 insert/s per client
- qr500.L3: range queries with 500 insert/s per client
- qp500.L4: point queries with 500 insert/s per client
- qr1000.L5: range queries with 1000 insert/s per client
- qp1000.L6: point queries with 1000 insert/s per client
Summary
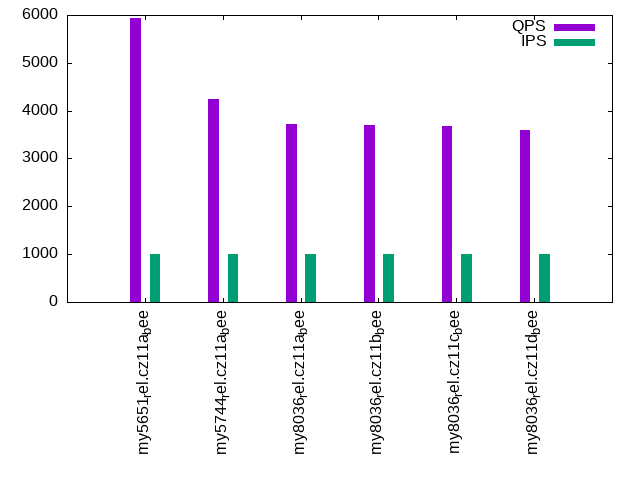
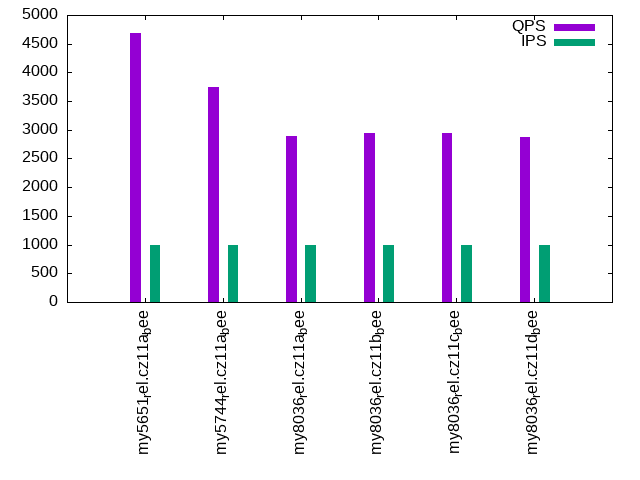
The numbers are inserts/s for l.i0, l.i1 and l.i2, indexed docs (or rows) /s for l.x and queries/s for qr100, qp100 thru qr1000, qp1000" The values are the average rate over the entire test for inserts (IPS) and queries (QPS). The range of values for IPS and QPS is split into 3 parts: bottom 25%, middle 50%, top 25%. Values in the bottom 25% have a red background, values in the top 25% have a green background and values in the middle have no color. A gray background is used for values that can be ignored because the DBMS did not sustain the target insert rate. Red backgrounds are not used when the minimum value is within 80% of the max value.
| dbms | l.i0 | l.x | l.i1 | l.i2 | qr100 | qp100 | qr500 | qp500 | qr1000 | qp1000 |
|---|---|---|---|---|---|---|---|---|---|---|
| my5651_rel.cz11a_bee | 99668 | 109489 | 15804 | 11792 | 5784 | 4595 | 5873 | 4738 | 5935 | 4679 |
| my5744_rel.cz11a_bee | 83565 | 146342 | 18484 | 10493 | 4224 | 3756 | 4229 | 3751 | 4241 | 3753 |
| my8036_rel.cz11a_bee | 56604 | 136987 | 16835 | 8643 | 3642 | 2842 | 3674 | 2838 | 3723 | 2885 |
| my8036_rel.cz11b_bee | 56818 | 30832 | 13642 | 7027 | 3532 | 2876 | 3634 | 2823 | 3701 | 2942 |
| my8036_rel.cz11c_bee | 56180 | 21614 | 14909 | 7770 | 3580 | 2837 | 3558 | 2908 | 3677 | 2938 |
| my8036_rel.cz11d_bee | 57034 | 137615 | 16906 | 8650 | 3604 | 2808 | 3575 | 2830 | 3598 | 2867 |
This table has relative throughput, throughput for the DBMS relative to the DBMS in the first line, using the absolute throughput from the previous table. Values less than 0.95 have a yellow background. Values greater than 1.05 have a blue background.
| dbms | l.i0 | l.x | l.i1 | l.i2 | qr100 | qp100 | qr500 | qp500 | qr1000 | qp1000 |
|---|---|---|---|---|---|---|---|---|---|---|
| my5651_rel.cz11a_bee | 1.00 | 1.00 | 1.00 | 1.00 | 1.00 | 1.00 | 1.00 | 1.00 | 1.00 | 1.00 |
| my5744_rel.cz11a_bee | 0.84 | 1.34 | 1.17 | 0.89 | 0.73 | 0.82 | 0.72 | 0.79 | 0.71 | 0.80 |
| my8036_rel.cz11a_bee | 0.57 | 1.25 | 1.07 | 0.73 | 0.63 | 0.62 | 0.63 | 0.60 | 0.63 | 0.62 |
| my8036_rel.cz11b_bee | 0.57 | 0.28 | 0.86 | 0.60 | 0.61 | 0.63 | 0.62 | 0.60 | 0.62 | 0.63 |
| my8036_rel.cz11c_bee | 0.56 | 0.20 | 0.94 | 0.66 | 0.62 | 0.62 | 0.61 | 0.61 | 0.62 | 0.63 |
| my8036_rel.cz11d_bee | 0.57 | 1.26 | 1.07 | 0.73 | 0.62 | 0.61 | 0.61 | 0.60 | 0.61 | 0.61 |
This lists the average rate of inserts/s for the tests that do inserts concurrent with queries. For such tests the query rate is listed in the table above. The read+write tests are setup so that the insert rate should match the target rate every second. Cells that are not at least 95% of the target have a red background to indicate a failure to satisfy the target.
| dbms | qr100.L1 | qp100.L2 | qr500.L3 | qp500.L4 | qr1000.L5 | qp1000.L6 |
|---|---|---|---|---|---|---|
| my5651_rel.cz11a_bee | 100 | 100 | 499 | 499 | 998 | 998 |
| my5744_rel.cz11a_bee | 100 | 100 | 499 | 499 | 998 | 998 |
| my8036_rel.cz11a_bee | 100 | 100 | 499 | 499 | 998 | 998 |
| my8036_rel.cz11b_bee | 100 | 100 | 499 | 499 | 998 | 998 |
| my8036_rel.cz11c_bee | 100 | 100 | 499 | 499 | 998 | 998 |
| my8036_rel.cz11d_bee | 100 | 100 | 499 | 499 | 998 | 998 |
| target | 100 | 100 | 500 | 500 | 1000 | 1000 |
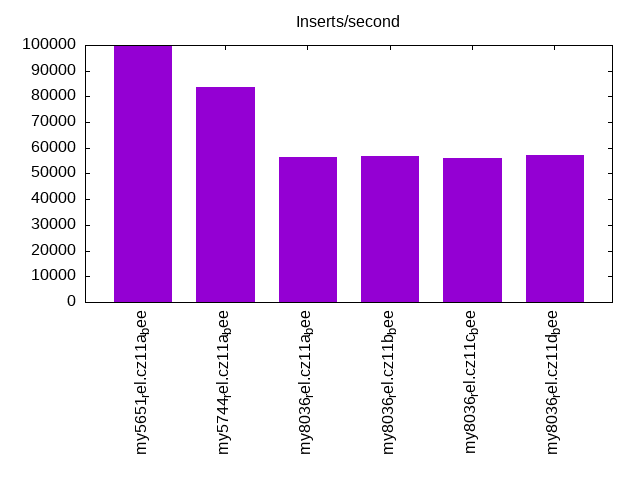
l.i0
l.i0: load without secondary indexes. Graphs for performance per 1-second interval are here.
Average throughput:
Insert response time histogram: each cell has the percentage of responses that take <= the time in the header and max is the max response time in seconds. For the max column values in the top 25% of the range have a red background and in the bottom 25% of the range have a green background. The red background is not used when the min value is within 80% of the max value.
| dbms | 256us | 1ms | 4ms | 16ms | 64ms | 256ms | 1s | 4s | 16s | gt | max |
|---|---|---|---|---|---|---|---|---|---|---|---|
| my5651_rel.cz11a_bee | 88.704 | 11.182 | 0.110 | 0.002 | 0.002 | 0.098 | |||||
| my5744_rel.cz11a_bee | 1.806 | 97.855 | 0.200 | 0.138 | nonzero | 0.103 | |||||
| my8036_rel.cz11a_bee | 99.413 | 0.455 | 0.131 | 0.001 | 0.086 | ||||||
| my8036_rel.cz11b_bee | 99.397 | 0.463 | 0.139 | 0.001 | 0.108 | ||||||
| my8036_rel.cz11c_bee | 99.395 | 0.448 | 0.151 | 0.005 | 0.095 | ||||||
| my8036_rel.cz11d_bee | 99.421 | 0.443 | 0.135 | 0.001 | 0.088 |
Performance metrics for the DBMS listed above. Some are normalized by throughput, others are not. Legend for results is here.
ips	qps	rps	rmbps	wps	wmbps	rpq	rkbpq	wpi	wkbpi	csps	cpups	cspq	cpupq	dbgb1	dbgb2	rss	maxop	p50	p99	tag
99668	0	868	3.4	317.2	30.5	0.009	0.035	0.003	0.313	12115	22.6	0.122	18	2.0	17.5	2.7	0.098	99988	89302	my5651_rel.cz11a_bee
83565	0	0	0.0	278.0	25.9	0.000	0.000	0.003	0.318	8732	21.7	0.104	21	2.0	17.5	2.9	0.103	84304	77615	my5744_rel.cz11a_bee
56604	0	0	0.0	247.7	18.9	0.000	0.000	0.004	0.342	6537	20.8	0.115	29	2.0	17.6	3.0	0.086	56637	52440	my8036_rel.cz11a_bee
56818	0	0	0.0	286.0	19.1	0.000	0.000	0.005	0.343	6881	21.6	0.121	30	2.0	17.6	3.1	0.108	57135	51742	my8036_rel.cz11b_bee
56180	0	0	0.0	220.5	18.9	0.000	0.000	0.004	0.344	7337	22.3	0.131	32	2.0	17.6	3.0	0.095	56835	50343	my8036_rel.cz11c_bee
57034	0	0	0.0	249.5	19.1	0.000	0.000	0.004	0.342	6573	20.7	0.115	29	2.0	17.6	3.1	0.088	57135	53341	my8036_rel.cz11d_bee
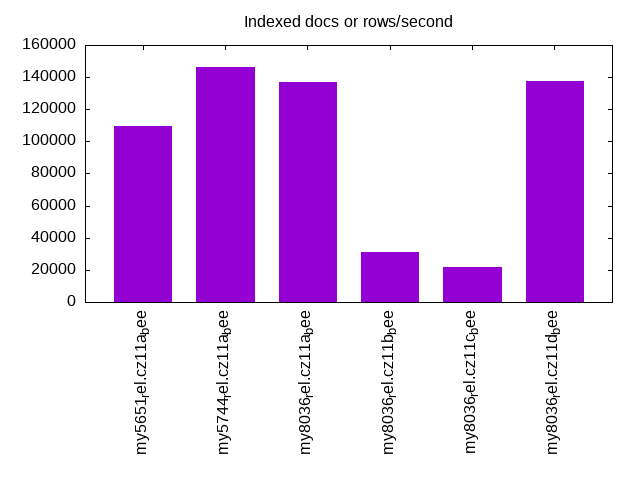
l.x
l.x: create secondary indexes.
Average throughput:
Performance metrics for the DBMS listed above. Some are normalized by throughput, others are not. Legend for results is here.
ips	qps	rps	rmbps	wps	wmbps	rpq	rkbpq	wpi	wkbpi	csps	cpups	cspq	cpupq	dbgb1	dbgb2	rss	maxop	p50	p99	tag
109489	0	10	0.0	857.0	113.1	0.000	0.000	0.008	1.058	2388	11.6	0.022	8	4.2	19.7	4.8	0.002	NA	NA	my5651_rel.cz11a_bee
146342	0	0	0.0	1592.3	142.4	0.000	0.000	0.011	0.996	9469	12.3	0.065	7	4.6	20.1	4.4	0.002	NA	NA	my5744_rel.cz11a_bee
136987	0	705	44.6	2524.3	150.7	0.005	0.333	0.018	1.127	9433	43.3	0.069	25	4.5	20.1	5.3	0.003	NA	NA	my8036_rel.cz11a_bee
30832	0	156	9.9	820.3	36.1	0.005	0.328	0.027	1.200	5284	10.8	0.171	28	4.5	20.1	5.4	0.003	NA	NA	my8036_rel.cz11b_bee
21614	0	109	6.9	573.2	25.3	0.005	0.328	0.027	1.200	4920	7.9	0.228	29	4.5	20.1	5.4	0.003	NA	NA	my8036_rel.cz11c_bee
137615	0	705	44.6	2596.0	151.8	0.005	0.332	0.019	1.130	9518	43.7	0.069	25	4.5	20.1	5.3	0.003	NA	NA	my8036_rel.cz11d_bee
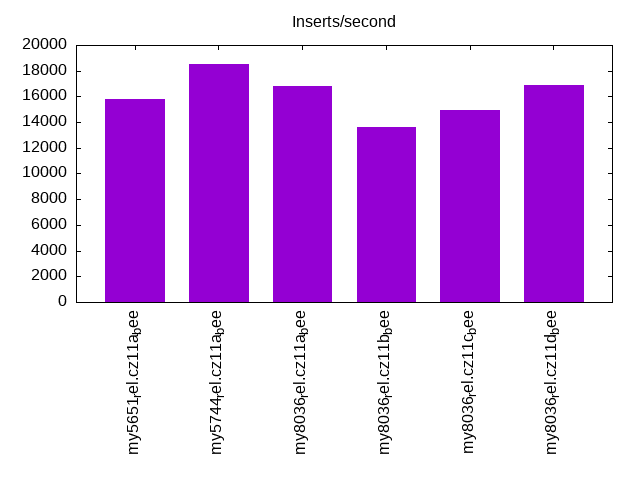
l.i1
l.i1: continue load after secondary indexes created with 50 inserts per transaction. Graphs for performance per 1-second interval are here.
Average throughput:
Insert response time histogram: each cell has the percentage of responses that take <= the time in the header and max is the max response time in seconds. For the max column values in the top 25% of the range have a red background and in the bottom 25% of the range have a green background. The red background is not used when the min value is within 80% of the max value.
| dbms | 256us | 1ms | 4ms | 16ms | 64ms | 256ms | 1s | 4s | 16s | gt | max |
|---|---|---|---|---|---|---|---|---|---|---|---|
| my5651_rel.cz11a_bee | 90.441 | 9.372 | 0.187 | 0.001 | 0.106 | ||||||
| my5744_rel.cz11a_bee | 94.618 | 5.285 | 0.096 | 0.001 | 0.076 | ||||||
| my8036_rel.cz11a_bee | 95.888 | 3.954 | 0.156 | 0.002 | 0.105 | ||||||
| my8036_rel.cz11b_bee | 88.756 | 10.108 | 1.125 | 0.011 | 0.191 | ||||||
| my8036_rel.cz11c_bee | 91.647 | 7.725 | 0.579 | 0.044 | 0.004 | 0.001 | 1.066 | ||||
| my8036_rel.cz11d_bee | 95.949 | 3.895 | 0.154 | 0.002 | 0.104 |
Delete response time histogram: each cell has the percentage of responses that take <= the time in the header and max is the max response time in seconds. For the max column values in the top 25% of the range have a red background and in the bottom 25% of the range have a green background. The red background is not used when the min value is within 80% of the max value.
| dbms | 256us | 1ms | 4ms | 16ms | 64ms | 256ms | 1s | 4s | 16s | gt | max |
|---|---|---|---|---|---|---|---|---|---|---|---|
| my5651_rel.cz11a_bee | 96.240 | 3.661 | 0.099 | nonzero | 0.066 | ||||||
| my5744_rel.cz11a_bee | 96.864 | 3.118 | 0.017 | 0.001 | 0.075 | ||||||
| my8036_rel.cz11a_bee | 97.676 | 2.274 | 0.049 | 0.001 | 0.105 | ||||||
| my8036_rel.cz11b_bee | 92.513 | 6.842 | 0.638 | 0.007 | 0.105 | ||||||
| my8036_rel.cz11c_bee | 94.974 | 4.752 | 0.254 | 0.016 | 0.004 | 0.001 | 1.049 | ||||
| my8036_rel.cz11d_bee | 97.608 | 2.343 | 0.047 | 0.002 | 0.104 |
Performance metrics for the DBMS listed above. Some are normalized by throughput, others are not. Legend for results is here.
ips	qps	rps	rmbps	wps	wmbps	rpq	rkbpq	wpi	wkbpi	csps	cpups	cspq	cpupq	dbgb1	dbgb2	rss	maxop	p50	p99	tag
15804	0	466	1.8	1820.3	77.2	0.029	0.118	0.115	5.003	21838	47.2	1.382	239	6.1	21.6	6.8	0.106	16831	4645	my5651_rel.cz11a_bee
18484	0	0	0.0	2024.5	87.4	0.000	0.000	0.110	4.843	17599	53.7	0.952	232	6.2	21.7	7.1	0.076	19379	5494	my5744_rel.cz11a_bee
16835	0	61	1.0	2782.0	102.0	0.004	0.058	0.165	6.206	38919	38.5	2.312	183	6.5	22.4	7.9	0.105	17580	5244	my8036_rel.cz11a_bee
13642	0	40	0.6	1602.6	60.8	0.003	0.047	0.117	4.563	34147	37.2	2.503	218	6.1	21.8	7.3	0.191	14041	3995	my8036_rel.cz11b_bee
14909	0	6	0.3	982.0	48.3	0.000	0.018	0.066	3.314	33407	36.8	2.241	197	6.3	22.1	6.9	1.066	16432	2547	my8036_rel.cz11c_bee
16906	0	61	1.0	2752.6	101.3	0.004	0.058	0.163	6.135	38939	38.6	2.303	183	6.5	22.4	7.9	0.104	17580	5244	my8036_rel.cz11d_bee
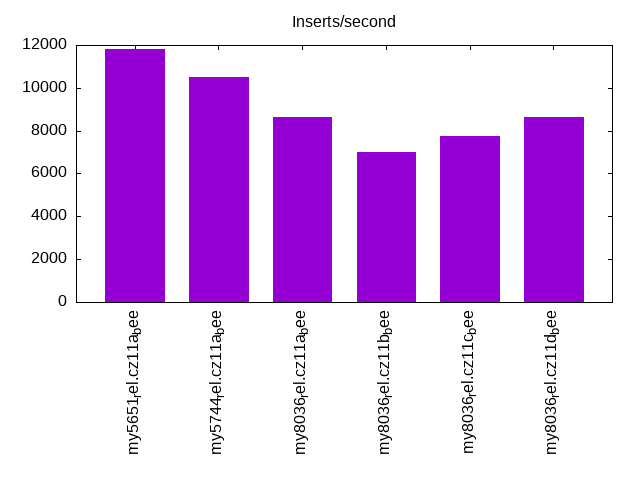
l.i2
l.i2: continue load after secondary indexes created with 5 inserts per transaction. Graphs for performance per 1-second interval are here.
Average throughput:
Insert response time histogram: each cell has the percentage of responses that take <= the time in the header and max is the max response time in seconds. For the max column values in the top 25% of the range have a red background and in the bottom 25% of the range have a green background. The red background is not used when the min value is within 80% of the max value.
| dbms | 256us | 1ms | 4ms | 16ms | 64ms | 256ms | 1s | 4s | 16s | gt | max |
|---|---|---|---|---|---|---|---|---|---|---|---|
| my5651_rel.cz11a_bee | 8.832 | 90.820 | 0.127 | 0.221 | 0.001 | 0.060 | |||||
| my5744_rel.cz11a_bee | 0.136 | 98.727 | 0.889 | 0.247 | 0.001 | 0.060 | |||||
| my8036_rel.cz11a_bee | 99.384 | 0.360 | 0.254 | 0.002 | nonzero | 0.102 | |||||
| my8036_rel.cz11b_bee | 98.023 | 0.884 | 0.997 | 0.093 | 0.002 | 0.107 | |||||
| my8036_rel.cz11c_bee | 98.793 | 0.524 | 0.656 | 0.025 | 0.002 | 0.118 | |||||
| my8036_rel.cz11d_bee | 99.375 | 0.369 | 0.254 | 0.002 | 0.001 | 0.102 |
Delete response time histogram: each cell has the percentage of responses that take <= the time in the header and max is the max response time in seconds. For the max column values in the top 25% of the range have a red background and in the bottom 25% of the range have a green background. The red background is not used when the min value is within 80% of the max value.
| dbms | 256us | 1ms | 4ms | 16ms | 64ms | 256ms | 1s | 4s | 16s | gt | max |
|---|---|---|---|---|---|---|---|---|---|---|---|
| my5651_rel.cz11a_bee | 13.136 | 86.570 | 0.074 | 0.220 | 0.001 | 0.060 | |||||
| my5744_rel.cz11a_bee | 0.424 | 98.416 | 0.914 | 0.245 | 0.001 | 0.060 | |||||
| my8036_rel.cz11a_bee | 99.545 | 0.204 | 0.249 | 0.002 | nonzero | 0.102 | |||||
| my8036_rel.cz11b_bee | 98.408 | 0.542 | 0.965 | 0.081 | 0.003 | 0.102 | |||||
| my8036_rel.cz11c_bee | 99.037 | 0.280 | 0.661 | 0.021 | 0.001 | 0.108 | |||||
| my8036_rel.cz11d_bee | 99.547 | 0.204 | 0.246 | 0.002 | 0.001 | 0.102 |
Performance metrics for the DBMS listed above. Some are normalized by throughput, others are not. Legend for results is here.
ips	qps	rps	rmbps	wps	wmbps	rpq	rkbpq	wpi	wkbpi	csps	cpups	cspq	cpupq	dbgb1	dbgb2	rss	maxop	p50	p99	tag
11792	0	2112	8.3	1359.3	54.8	0.179	0.716	0.115	4.761	93912	44.5	7.964	302	6.1	21.6	6.8	0.060	11756	10878	my5651_rel.cz11a_bee
10493	0	0	0.0	1219.9	49.4	0.000	0.000	0.116	4.817	44878	42.2	4.277	322	6.2	21.7	7.1	0.060	10498	9789	my5744_rel.cz11a_bee
8643	0	0	0.0	1481.9	50.5	0.000	0.000	0.171	5.978	51714	35.6	5.983	330	6.5	22.4	7.9	0.102	8659	7781	my8036_rel.cz11a_bee
7027	0	0	0.0	1429.2	41.4	0.000	0.000	0.203	6.034	45076	36.5	6.414	416	6.1	21.8	7.3	0.107	7062	5594	my8036_rel.cz11b_bee
7770	0	0	0.0	978.9	30.4	0.000	0.000	0.126	4.009	46777	34.0	6.020	350	6.3	22.1	6.8	0.118	7841	6209	my8036_rel.cz11c_bee
8650	0	0	0.0	1469.8	50.2	0.000	0.000	0.170	5.939	51900	35.6	6.000	329	6.5	22.4	7.9	0.102	8669	7771	my8036_rel.cz11d_bee
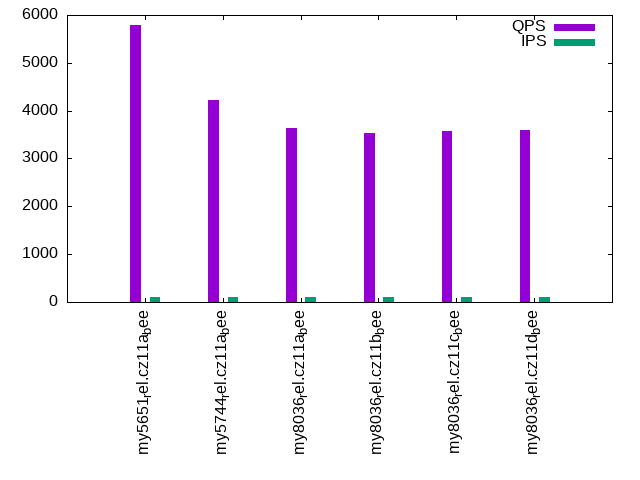
qr100.L1
qr100.L1: range queries with 100 insert/s per client. Graphs for performance per 1-second interval are here.
Average throughput:
Query response time histogram: each cell has the percentage of responses that take <= the time in the header and max is the max response time in seconds. For max values in the top 25% of the range have a red background and in the bottom 25% of the range have a green background. The red background is not used when the min value is within 80% of the max value.
| dbms | 256us | 1ms | 4ms | 16ms | 64ms | 256ms | 1s | 4s | 16s | gt | max |
|---|---|---|---|---|---|---|---|---|---|---|---|
| my5651_rel.cz11a_bee | 97.609 | 2.384 | 0.003 | 0.004 | nonzero | 0.023 | |||||
| my5744_rel.cz11a_bee | 74.928 | 25.071 | 0.001 | nonzero | 0.005 | ||||||
| my8036_rel.cz11a_bee | 59.842 | 40.157 | 0.001 | nonzero | 0.005 | ||||||
| my8036_rel.cz11b_bee | 53.783 | 46.217 | nonzero | nonzero | 0.007 | ||||||
| my8036_rel.cz11c_bee | 56.109 | 43.891 | 0.001 | nonzero | nonzero | 0.050 | |||||
| my8036_rel.cz11d_bee | 56.269 | 43.730 | 0.001 | nonzero | 0.005 |
Insert response time histogram: each cell has the percentage of responses that take <= the time in the header and max is the max response time in seconds. For max values in the top 25% of the range have a red background and in the bottom 25% of the range have a green background. The red background is not used when the min value is within 80% of the max value.
| dbms | 256us | 1ms | 4ms | 16ms | 64ms | 256ms | 1s | 4s | 16s | gt | max |
|---|---|---|---|---|---|---|---|---|---|---|---|
| my5651_rel.cz11a_bee | 47.556 | 49.806 | 2.639 | 0.056 | |||||||
| my5744_rel.cz11a_bee | 99.472 | 0.528 | 0.013 | ||||||||
| my8036_rel.cz11a_bee | 98.889 | 1.083 | 0.028 | 0.026 | |||||||
| my8036_rel.cz11b_bee | 99.528 | 0.472 | 0.015 | ||||||||
| my8036_rel.cz11c_bee | 99.278 | 0.667 | 0.028 | 0.028 | 0.085 | ||||||
| my8036_rel.cz11d_bee | 99.472 | 0.528 | 0.014 |
Delete response time histogram: each cell has the percentage of responses that take <= the time in the header and max is the max response time in seconds. For max values in the top 25% of the range have a red background and in the bottom 25% of the range have a green background. The red background is not used when the min value is within 80% of the max value.
| dbms | 256us | 1ms | 4ms | 16ms | 64ms | 256ms | 1s | 4s | 16s | gt | max |
|---|---|---|---|---|---|---|---|---|---|---|---|
| my5651_rel.cz11a_bee | 48.972 | 49.056 | 1.972 | 0.062 | |||||||
| my5744_rel.cz11a_bee | 99.639 | 0.361 | 0.012 | ||||||||
| my8036_rel.cz11a_bee | 99.028 | 0.944 | 0.028 | 0.019 | |||||||
| my8036_rel.cz11b_bee | 99.667 | 0.333 | 0.013 | ||||||||
| my8036_rel.cz11c_bee | 99.417 | 0.472 | 0.056 | 0.056 | 0.091 | ||||||
| my8036_rel.cz11d_bee | 99.500 | 0.500 | 0.015 |
Performance metrics for the DBMS listed above. Some are normalized by throughput, others are not. Legend for results is here.
ips	qps	rps	rmbps	wps	wmbps	rpq	rkbpq	wpi	wkbpi	csps	cpups	cspq	cpupq	dbgb1	dbgb2	rss	maxop	p50	p99	tag
100	5784	4	0.0	215.4	6.5	0.001	0.003	2.158	66.706	22963	13.2	3.970	183	6.1	21.6	6.8	0.023	5752	5578	my5651_rel.cz11a_bee
100	4224	0	0.0	123.4	3.6	0.000	0.000	1.236	37.183	16702	12.8	3.955	242	6.2	21.7	7.1	0.005	4155	4010	my5744_rel.cz11a_bee
100	3642	0	0.0	165.3	4.2	0.000	0.000	1.657	42.812	14954	13.2	4.105	290	6.5	22.4	7.9	0.005	3612	3436	my8036_rel.cz11a_bee
100	3532	0	0.0	36.6	0.8	0.000	0.000	0.367	7.985	14170	12.9	4.012	292	6.1	21.8	7.3	0.007	3516	3388	my8036_rel.cz11b_bee
100	3580	0	0.0	111.3	2.0	0.000	0.000	1.115	20.356	14750	13.6	4.120	304	6.3	22.1	6.8	0.050	3547	3356	my8036_rel.cz11c_bee
100	3604	0	0.0	152.7	3.9	0.000	0.000	1.530	39.549	14767	13.0	4.097	289	6.5	22.4	7.9	0.005	3564	3356	my8036_rel.cz11d_bee
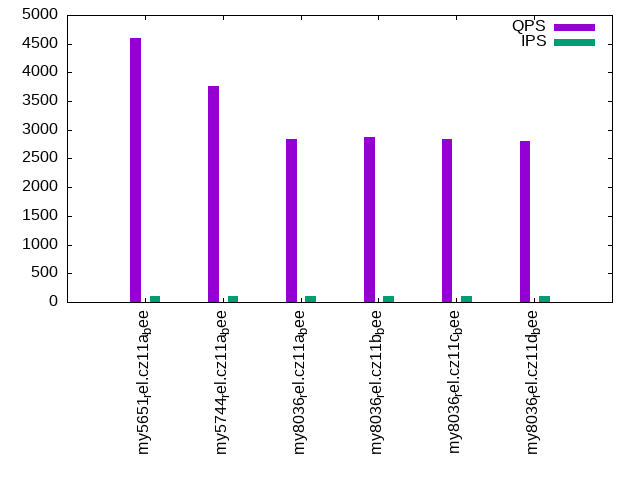
qp100.L2
qp100.L2: point queries with 100 insert/s per client. Graphs for performance per 1-second interval are here.
Average throughput:
Query response time histogram: each cell has the percentage of responses that take <= the time in the header and max is the max response time in seconds. For max values in the top 25% of the range have a red background and in the bottom 25% of the range have a green background. The red background is not used when the min value is within 80% of the max value.
| dbms | 256us | 1ms | 4ms | 16ms | 64ms | 256ms | 1s | 4s | 16s | gt | max |
|---|---|---|---|---|---|---|---|---|---|---|---|
| my5651_rel.cz11a_bee | 94.342 | 5.648 | 0.007 | 0.003 | 0.011 | ||||||
| my5744_rel.cz11a_bee | 85.558 | 14.437 | 0.005 | 0.004 | |||||||
| my8036_rel.cz11a_bee | 10.870 | 89.128 | 0.002 | nonzero | 0.004 | ||||||
| my8036_rel.cz11b_bee | 13.687 | 86.311 | 0.001 | nonzero | 0.005 | ||||||
| my8036_rel.cz11c_bee | 12.590 | 87.408 | 0.002 | 0.003 | |||||||
| my8036_rel.cz11d_bee | 9.534 | 90.464 | 0.002 | 0.004 |
Insert response time histogram: each cell has the percentage of responses that take <= the time in the header and max is the max response time in seconds. For max values in the top 25% of the range have a red background and in the bottom 25% of the range have a green background. The red background is not used when the min value is within 80% of the max value.
| dbms | 256us | 1ms | 4ms | 16ms | 64ms | 256ms | 1s | 4s | 16s | gt | max |
|---|---|---|---|---|---|---|---|---|---|---|---|
| my5651_rel.cz11a_bee | 50.583 | 49.083 | 0.333 | 0.023 | |||||||
| my5744_rel.cz11a_bee | 99.417 | 0.583 | 0.010 | ||||||||
| my8036_rel.cz11a_bee | 99.639 | 0.361 | 0.016 | ||||||||
| my8036_rel.cz11b_bee | 99.694 | 0.306 | 0.009 | ||||||||
| my8036_rel.cz11c_bee | 99.306 | 0.667 | 0.028 | 0.018 | |||||||
| my8036_rel.cz11d_bee | 99.722 | 0.250 | 0.028 | 0.021 |
Delete response time histogram: each cell has the percentage of responses that take <= the time in the header and max is the max response time in seconds. For max values in the top 25% of the range have a red background and in the bottom 25% of the range have a green background. The red background is not used when the min value is within 80% of the max value.
| dbms | 256us | 1ms | 4ms | 16ms | 64ms | 256ms | 1s | 4s | 16s | gt | max |
|---|---|---|---|---|---|---|---|---|---|---|---|
| my5651_rel.cz11a_bee | 53.556 | 46.250 | 0.194 | 0.018 | |||||||
| my5744_rel.cz11a_bee | 99.667 | 0.333 | 0.010 | ||||||||
| my8036_rel.cz11a_bee | 99.806 | 0.194 | 0.008 | ||||||||
| my8036_rel.cz11b_bee | 99.750 | 0.250 | 0.009 | ||||||||
| my8036_rel.cz11c_bee | 99.472 | 0.528 | 0.013 | ||||||||
| my8036_rel.cz11d_bee | 99.806 | 0.194 | 0.014 |
Performance metrics for the DBMS listed above. Some are normalized by throughput, others are not. Legend for results is here.
ips	qps	rps	rmbps	wps	wmbps	rpq	rkbpq	wpi	wkbpi	csps	cpups	cspq	cpupq	dbgb1	dbgb2	rss	maxop	p50	p99	tag
100	4595	4	0.0	2.2	0.1	0.001	0.003	0.022	1.193	18669	13.6	4.063	237	6.1	21.6	6.8	0.011	4555	4298	my5651_rel.cz11a_bee
100	3756	0	0.0	32.9	0.9	0.000	0.000	0.329	9.048	15400	14.0	4.101	298	6.2	21.7	7.1	0.004	3692	3484	my5744_rel.cz11a_bee
100	2842	0	0.0	40.9	1.1	0.000	0.000	0.409	10.861	12111	13.3	4.261	374	6.5	22.4	7.9	0.004	2748	2605	my8036_rel.cz11a_bee
100	2876	0	0.0	14.2	0.3	0.000	0.000	0.142	2.970	12190	13.3	4.238	370	6.1	21.8	7.3	0.005	2750	2621	my8036_rel.cz11b_bee
100	2837	0	0.0	19.1	0.3	0.000	0.000	0.191	2.984	12066	13.1	4.253	369	6.3	22.1	6.8	0.003	2733	2589	my8036_rel.cz11c_bee
100	2808	0	0.0	42.5	1.1	0.000	0.000	0.426	11.402	11973	13.3	4.264	379	6.5	22.4	7.9	0.004	2717	2589	my8036_rel.cz11d_bee
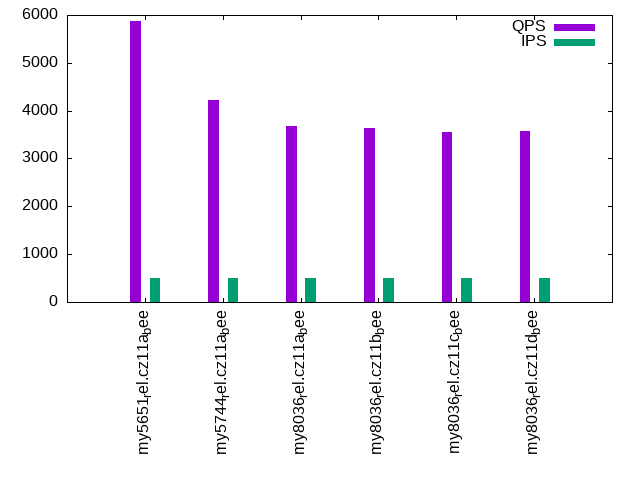
qr500.L3
qr500.L3: range queries with 500 insert/s per client. Graphs for performance per 1-second interval are here.
Average throughput:
Query response time histogram: each cell has the percentage of responses that take <= the time in the header and max is the max response time in seconds. For max values in the top 25% of the range have a red background and in the bottom 25% of the range have a green background. The red background is not used when the min value is within 80% of the max value.
| dbms | 256us | 1ms | 4ms | 16ms | 64ms | 256ms | 1s | 4s | 16s | gt | max |
|---|---|---|---|---|---|---|---|---|---|---|---|
| my5651_rel.cz11a_bee | 97.581 | 2.412 | 0.003 | 0.003 | 0.010 | ||||||
| my5744_rel.cz11a_bee | 75.116 | 24.883 | 0.001 | nonzero | 0.005 | ||||||
| my8036_rel.cz11a_bee | 60.665 | 39.334 | 0.001 | 0.003 | |||||||
| my8036_rel.cz11b_bee | 58.989 | 41.010 | 0.001 | nonzero | 0.013 | ||||||
| my8036_rel.cz11c_bee | 53.490 | 46.507 | 0.002 | 0.001 | nonzero | 0.052 | |||||
| my8036_rel.cz11d_bee | 54.741 | 45.258 | 0.001 | nonzero | 0.005 |
Insert response time histogram: each cell has the percentage of responses that take <= the time in the header and max is the max response time in seconds. For max values in the top 25% of the range have a red background and in the bottom 25% of the range have a green background. The red background is not used when the min value is within 80% of the max value.
| dbms | 256us | 1ms | 4ms | 16ms | 64ms | 256ms | 1s | 4s | 16s | gt | max |
|---|---|---|---|---|---|---|---|---|---|---|---|
| my5651_rel.cz11a_bee | 87.278 | 12.633 | 0.089 | 0.022 | |||||||
| my5744_rel.cz11a_bee | 99.500 | 0.500 | 0.012 | ||||||||
| my8036_rel.cz11a_bee | 98.939 | 1.044 | 0.017 | 0.026 | |||||||
| my8036_rel.cz11b_bee | 99.183 | 0.789 | 0.028 | 0.037 | |||||||
| my8036_rel.cz11c_bee | 98.872 | 0.950 | 0.150 | 0.028 | 0.081 | ||||||
| my8036_rel.cz11d_bee | 99.194 | 0.789 | 0.017 | 0.025 |
Delete response time histogram: each cell has the percentage of responses that take <= the time in the header and max is the max response time in seconds. For max values in the top 25% of the range have a red background and in the bottom 25% of the range have a green background. The red background is not used when the min value is within 80% of the max value.
| dbms | 256us | 1ms | 4ms | 16ms | 64ms | 256ms | 1s | 4s | 16s | gt | max |
|---|---|---|---|---|---|---|---|---|---|---|---|
| my5651_rel.cz11a_bee | 90.000 | 9.972 | 0.028 | 0.018 | |||||||
| my5744_rel.cz11a_bee | 99.656 | 0.344 | 0.012 | ||||||||
| my8036_rel.cz11a_bee | 99.528 | 0.461 | 0.011 | 0.024 | |||||||
| my8036_rel.cz11b_bee | 99.506 | 0.433 | 0.061 | 0.048 | |||||||
| my8036_rel.cz11c_bee | 99.317 | 0.522 | 0.156 | 0.006 | 0.075 | ||||||
| my8036_rel.cz11d_bee | 99.711 | 0.278 | 0.011 | 0.023 |
Performance metrics for the DBMS listed above. Some are normalized by throughput, others are not. Legend for results is here.
ips	qps	rps	rmbps	wps	wmbps	rpq	rkbpq	wpi	wkbpi	csps	cpups	cspq	cpupq	dbgb1	dbgb2	rss	maxop	p50	p99	tag
499	5873	16	0.1	2.8	0.6	0.003	0.011	0.006	1.140	22944	14.3	3.907	195	6.1	21.6	6.8	0.010	5817	5689	my5651_rel.cz11a_bee
499	4229	0	0.0	68.2	2.4	0.000	0.000	0.137	4.903	16649	13.9	3.937	263	6.2	21.7	7.1	0.005	4155	3995	my5744_rel.cz11a_bee
499	3674	0	0.0	90.4	2.8	0.000	0.000	0.181	5.826	15439	14.2	4.203	309	6.5	22.4	7.9	0.003	3643	3420	my8036_rel.cz11a_bee
499	3634	0	0.0	128.2	3.3	0.000	0.000	0.257	6.864	15551	14.4	4.280	317	6.1	21.8	7.3	0.013	3596	3404	my8036_rel.cz11b_bee
499	3558	0	0.0	154.7	3.4	0.000	0.000	0.310	6.927	15506	15.1	4.358	340	6.3	22.1	6.8	0.052	3516	3324	my8036_rel.cz11c_bee
499	3575	0	0.0	92.0	2.9	0.000	0.000	0.184	5.940	15070	14.1	4.215	316	6.5	22.4	7.9	0.005	3548	3356	my8036_rel.cz11d_bee
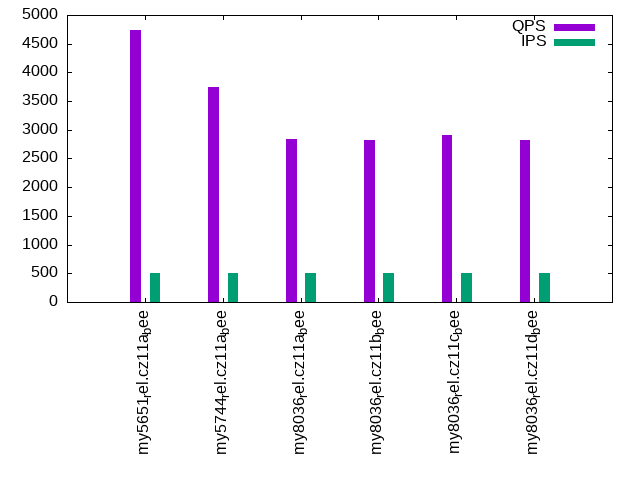
qp500.L4
qp500.L4: point queries with 500 insert/s per client. Graphs for performance per 1-second interval are here.
Average throughput:
Query response time histogram: each cell has the percentage of responses that take <= the time in the header and max is the max response time in seconds. For max values in the top 25% of the range have a red background and in the bottom 25% of the range have a green background. The red background is not used when the min value is within 80% of the max value.
| dbms | 256us | 1ms | 4ms | 16ms | 64ms | 256ms | 1s | 4s | 16s | gt | max |
|---|---|---|---|---|---|---|---|---|---|---|---|
| my5651_rel.cz11a_bee | 94.677 | 5.299 | 0.023 | 0.002 | 0.011 | ||||||
| my5744_rel.cz11a_bee | 84.803 | 15.189 | 0.007 | nonzero | 0.009 | ||||||
| my8036_rel.cz11a_bee | 11.394 | 88.601 | 0.004 | nonzero | 0.007 | ||||||
| my8036_rel.cz11b_bee | 9.756 | 90.240 | 0.004 | nonzero | nonzero | 0.028 | |||||
| my8036_rel.cz11c_bee | 18.219 | 81.776 | 0.005 | nonzero | 0.007 | ||||||
| my8036_rel.cz11d_bee | 11.495 | 88.500 | 0.005 | nonzero | 0.006 |
Insert response time histogram: each cell has the percentage of responses that take <= the time in the header and max is the max response time in seconds. For max values in the top 25% of the range have a red background and in the bottom 25% of the range have a green background. The red background is not used when the min value is within 80% of the max value.
| dbms | 256us | 1ms | 4ms | 16ms | 64ms | 256ms | 1s | 4s | 16s | gt | max |
|---|---|---|---|---|---|---|---|---|---|---|---|
| my5651_rel.cz11a_bee | 84.367 | 15.506 | 0.128 | 0.041 | |||||||
| my5744_rel.cz11a_bee | 99.428 | 0.572 | 0.016 | ||||||||
| my8036_rel.cz11a_bee | 99.017 | 0.950 | 0.028 | 0.006 | 0.105 | ||||||
| my8036_rel.cz11b_bee | 98.556 | 1.317 | 0.128 | 0.062 | |||||||
| my8036_rel.cz11c_bee | 98.828 | 1.022 | 0.117 | 0.033 | 0.086 | ||||||
| my8036_rel.cz11d_bee | 98.861 | 1.128 | 0.011 | 0.025 |
Delete response time histogram: each cell has the percentage of responses that take <= the time in the header and max is the max response time in seconds. For max values in the top 25% of the range have a red background and in the bottom 25% of the range have a green background. The red background is not used when the min value is within 80% of the max value.
| dbms | 256us | 1ms | 4ms | 16ms | 64ms | 256ms | 1s | 4s | 16s | gt | max |
|---|---|---|---|---|---|---|---|---|---|---|---|
| my5651_rel.cz11a_bee | 88.200 | 11.761 | 0.039 | 0.031 | |||||||
| my5744_rel.cz11a_bee | 99.606 | 0.394 | 0.013 | ||||||||
| my8036_rel.cz11a_bee | 99.761 | 0.228 | 0.006 | 0.006 | 0.103 | ||||||
| my8036_rel.cz11b_bee | 99.289 | 0.561 | 0.150 | 0.039 | |||||||
| my8036_rel.cz11c_bee | 99.489 | 0.394 | 0.106 | 0.011 | 0.085 | ||||||
| my8036_rel.cz11d_bee | 99.656 | 0.344 | 0.015 |
Performance metrics for the DBMS listed above. Some are normalized by throughput, others are not. Legend for results is here.
ips	qps	rps	rmbps	wps	wmbps	rpq	rkbpq	wpi	wkbpi	csps	cpups	cspq	cpupq	dbgb1	dbgb2	rss	maxop	p50	p99	tag
499	4738	16	0.1	325.0	10.3	0.003	0.014	0.651	21.080	20616	14.7	4.351	248	6.1	21.6	6.8	0.011	4619	4331	my5651_rel.cz11a_bee
499	3751	0	0.0	73.4	2.5	0.000	0.000	0.147	5.221	15612	14.7	4.162	314	6.2	21.7	7.1	0.009	3692	3452	my5744_rel.cz11a_bee
499	2838	0	0.0	97.5	3.0	0.000	0.000	0.195	6.212	12874	14.2	4.536	400	6.5	22.4	7.9	0.007	2733	2589	my8036_rel.cz11a_bee
499	2823	0	0.0	130.4	3.4	0.000	0.000	0.261	6.976	13037	15.1	4.617	428	6.1	21.8	7.3	0.028	2734	2589	my8036_rel.cz11b_bee
499	2908	0	0.0	156.8	3.4	0.000	0.000	0.314	7.033	13652	15.4	4.694	424	6.3	22.1	6.8	0.007	2797	2591	my8036_rel.cz11c_bee
499	2830	0	0.0	107.1	3.3	0.000	0.000	0.215	6.706	12871	14.3	4.548	404	6.5	22.4	7.9	0.006	2735	2573	my8036_rel.cz11d_bee
qr1000.L5
qr1000.L5: range queries with 1000 insert/s per client. Graphs for performance per 1-second interval are here.
Average throughput:
Query response time histogram: each cell has the percentage of responses that take <= the time in the header and max is the max response time in seconds. For max values in the top 25% of the range have a red background and in the bottom 25% of the range have a green background. The red background is not used when the min value is within 80% of the max value.
| dbms | 256us | 1ms | 4ms | 16ms | 64ms | 256ms | 1s | 4s | 16s | gt | max |
|---|---|---|---|---|---|---|---|---|---|---|---|
| my5651_rel.cz11a_bee | 97.396 | 2.588 | 0.013 | 0.003 | nonzero | 0.021 | |||||
| my5744_rel.cz11a_bee | 76.286 | 23.712 | 0.001 | nonzero | 0.008 | ||||||
| my8036_rel.cz11a_bee | 62.298 | 37.699 | 0.003 | nonzero | 0.005 | ||||||
| my8036_rel.cz11b_bee | 61.155 | 38.840 | 0.004 | nonzero | nonzero | 0.048 | |||||
| my8036_rel.cz11c_bee | 59.492 | 40.502 | 0.004 | 0.001 | nonzero | 0.061 | |||||
| my8036_rel.cz11d_bee | 55.183 | 44.814 | 0.003 | nonzero | 0.005 |
Insert response time histogram: each cell has the percentage of responses that take <= the time in the header and max is the max response time in seconds. For max values in the top 25% of the range have a red background and in the bottom 25% of the range have a green background. The red background is not used when the min value is within 80% of the max value.
| dbms | 256us | 1ms | 4ms | 16ms | 64ms | 256ms | 1s | 4s | 16s | gt | max |
|---|---|---|---|---|---|---|---|---|---|---|---|
| my5651_rel.cz11a_bee | 86.669 | 13.228 | 0.103 | 0.030 | |||||||
| my5744_rel.cz11a_bee | 99.422 | 0.578 | 0.016 | ||||||||
| my8036_rel.cz11a_bee | 97.419 | 2.569 | 0.011 | 0.026 | |||||||
| my8036_rel.cz11b_bee | 97.206 | 2.639 | 0.153 | 0.003 | 0.093 | ||||||
| my8036_rel.cz11c_bee | 96.861 | 2.764 | 0.328 | 0.047 | 0.109 | ||||||
| my8036_rel.cz11d_bee | 97.872 | 2.117 | 0.011 | 0.026 |
Delete response time histogram: each cell has the percentage of responses that take <= the time in the header and max is the max response time in seconds. For max values in the top 25% of the range have a red background and in the bottom 25% of the range have a green background. The red background is not used when the min value is within 80% of the max value.
| dbms | 256us | 1ms | 4ms | 16ms | 64ms | 256ms | 1s | 4s | 16s | gt | max |
|---|---|---|---|---|---|---|---|---|---|---|---|
| my5651_rel.cz11a_bee | 92.547 | 7.369 | 0.083 | 0.025 | |||||||
| my5744_rel.cz11a_bee | 99.628 | 0.372 | 0.015 | ||||||||
| my8036_rel.cz11a_bee | 99.392 | 0.606 | 0.003 | 0.025 | |||||||
| my8036_rel.cz11b_bee | 98.972 | 0.917 | 0.111 | 0.061 | |||||||
| my8036_rel.cz11c_bee | 99.058 | 0.683 | 0.214 | 0.044 | 0.092 | ||||||
| my8036_rel.cz11d_bee | 99.475 | 0.522 | 0.003 | 0.024 |
Performance metrics for the DBMS listed above. Some are normalized by throughput, others are not. Legend for results is here.
ips	qps	rps	rmbps	wps	wmbps	rpq	rkbpq	wpi	wkbpi	csps	cpups	cspq	cpupq	dbgb1	dbgb2	rss	maxop	p50	p99	tag
998	5935	32	0.1	348.2	11.5	0.005	0.021	0.349	11.771	24635	15.4	4.151	208	6.1	21.6	6.8	0.021	5887	5594	my5651_rel.cz11a_bee
998	4241	0	0.0	123.0	4.6	0.000	0.000	0.123	4.698	17053	15.2	4.021	287	6.2	21.7	7.1	0.008	4171	3979	my5744_rel.cz11a_bee
998	3723	0	0.0	215.0	6.7	0.000	0.000	0.215	6.823	16821	15.2	4.518	327	6.5	22.4	7.9	0.005	3692	3436	my8036_rel.cz11a_bee
998	3701	0	0.0	202.2	5.6	0.000	0.000	0.203	5.754	16914	15.9	4.570	344	6.1	21.8	7.3	0.048	3660	3436	my8036_rel.cz11b_bee
998	3677	0	0.0	252.5	5.8	0.000	0.000	0.253	5.988	17311	16.9	4.708	368	6.3	22.1	6.8	0.061	3614	3374	my8036_rel.cz11c_bee
998	3598	0	0.0	219.9	6.8	0.000	0.000	0.220	6.947	16363	15.2	4.547	338	6.5	22.4	8.0	0.005	3564	3340	my8036_rel.cz11d_bee
qp1000.L6
qp1000.L6: point queries with 1000 insert/s per client. Graphs for performance per 1-second interval are here.
Average throughput:
Query response time histogram: each cell has the percentage of responses that take <= the time in the header and max is the max response time in seconds. For max values in the top 25% of the range have a red background and in the bottom 25% of the range have a green background. The red background is not used when the min value is within 80% of the max value.
| dbms | 256us | 1ms | 4ms | 16ms | 64ms | 256ms | 1s | 4s | 16s | gt | max |
|---|---|---|---|---|---|---|---|---|---|---|---|
| my5651_rel.cz11a_bee | 93.763 | 6.132 | 0.104 | 0.002 | 0.011 | ||||||
| my5744_rel.cz11a_bee | 83.527 | 16.459 | 0.014 | nonzero | 0.008 | ||||||
| my8036_rel.cz11a_bee | 17.097 | 82.891 | 0.012 | nonzero | 0.007 | ||||||
| my8036_rel.cz11b_bee | 20.595 | 79.393 | 0.011 | nonzero | 0.008 | ||||||
| my8036_rel.cz11c_bee | 22.719 | 77.269 | 0.012 | nonzero | 0.007 | ||||||
| my8036_rel.cz11d_bee | 15.756 | 84.234 | 0.009 | nonzero | 0.008 |
Insert response time histogram: each cell has the percentage of responses that take <= the time in the header and max is the max response time in seconds. For max values in the top 25% of the range have a red background and in the bottom 25% of the range have a green background. The red background is not used when the min value is within 80% of the max value.
| dbms | 256us | 1ms | 4ms | 16ms | 64ms | 256ms | 1s | 4s | 16s | gt | max |
|---|---|---|---|---|---|---|---|---|---|---|---|
| my5651_rel.cz11a_bee | 84.956 | 14.950 | 0.094 | 0.023 | |||||||
| my5744_rel.cz11a_bee | 99.408 | 0.589 | 0.003 | 0.017 | |||||||
| my8036_rel.cz11a_bee | 96.756 | 3.222 | 0.022 | 0.031 | |||||||
| my8036_rel.cz11b_bee | 96.839 | 3.014 | 0.144 | 0.003 | 0.103 | ||||||
| my8036_rel.cz11c_bee | 96.092 | 3.481 | 0.392 | 0.036 | 0.088 | ||||||
| my8036_rel.cz11d_bee | 97.878 | 2.114 | 0.008 | 0.031 |
Delete response time histogram: each cell has the percentage of responses that take <= the time in the header and max is the max response time in seconds. For max values in the top 25% of the range have a red background and in the bottom 25% of the range have a green background. The red background is not used when the min value is within 80% of the max value.
| dbms | 256us | 1ms | 4ms | 16ms | 64ms | 256ms | 1s | 4s | 16s | gt | max |
|---|---|---|---|---|---|---|---|---|---|---|---|
| my5651_rel.cz11a_bee | 90.719 | 9.214 | 0.067 | 0.023 | |||||||
| my5744_rel.cz11a_bee | 99.672 | 0.328 | 0.015 | ||||||||
| my8036_rel.cz11a_bee | 99.358 | 0.628 | 0.014 | 0.030 | |||||||
| my8036_rel.cz11b_bee | 98.989 | 0.886 | 0.122 | 0.003 | 0.102 | ||||||
| my8036_rel.cz11c_bee | 98.558 | 1.111 | 0.286 | 0.044 | 0.119 | ||||||
| my8036_rel.cz11d_bee | 99.650 | 0.344 | 0.006 | 0.030 |
Performance metrics for the DBMS listed above. Some are normalized by throughput, others are not. Legend for results is here.
ips	qps	rps	rmbps	wps	wmbps	rpq	rkbpq	wpi	wkbpi	csps	cpups	cspq	cpupq	dbgb1	dbgb2	rss	maxop	p50	p99	tag
998	4679	32	0.1	359.2	11.8	0.007	0.028	0.360	12.110	20840	15.8	4.454	270	6.1	21.6	6.8	0.011	4555	4235	my5651_rel.cz11a_bee
998	3753	0	0.0	124.0	4.6	0.000	0.000	0.124	4.725	15969	15.6	4.255	333	6.2	21.7	7.1	0.008	3676	3436	my5744_rel.cz11a_bee
998	2885	0	0.0	213.9	6.6	0.000	0.000	0.214	6.791	14241	15.4	4.937	427	6.5	22.4	7.9	0.007	2798	2605	my8036_rel.cz11a_bee
998	2942	0	0.0	228.2	6.2	0.000	0.000	0.229	6.327	14759	16.5	5.017	449	6.1	21.8	7.3	0.008	2877	2605	my8036_rel.cz11b_bee
998	2938	0	0.0	276.3	6.3	0.000	0.000	0.277	6.443	15249	17.8	5.190	485	6.3	22.1	6.8	0.007	2877	2605	my8036_rel.cz11c_bee
998	2867	0	0.0	212.3	6.6	0.000	0.000	0.213	6.737	14152	15.4	4.936	430	6.5	22.4	8.0	0.008	2783	2589	my8036_rel.cz11d_bee
l.i0
l.i0: load without secondary indexes
Performance metrics for all DBMS, not just the ones listed above. Some are normalized by throughput, others are not. Legend for results is here.
ips	qps	rps	rmbps	wps	wmbps	rpq	rkbpq	wpi	wkbpi	csps	cpups	cspq	cpupq	dbgb1	dbgb2	rss	maxop	p50	p99	tag
99668	0	868	3.4	317.2	30.5	0.009	0.035	0.003	0.313	12115	22.6	0.122	18	2.0	17.5	2.7	0.098	99988	89302	my5651_rel.cz11a_bee
83565	0	0	0.0	278.0	25.9	0.000	0.000	0.003	0.318	8732	21.7	0.104	21	2.0	17.5	2.9	0.103	84304	77615	my5744_rel.cz11a_bee
56604	0	0	0.0	247.7	18.9	0.000	0.000	0.004	0.342	6537	20.8	0.115	29	2.0	17.6	3.0	0.086	56637	52440	my8036_rel.cz11a_bee
56818	0	0	0.0	286.0	19.1	0.000	0.000	0.005	0.343	6881	21.6	0.121	30	2.0	17.6	3.1	0.108	57135	51742	my8036_rel.cz11b_bee
56180	0	0	0.0	220.5	18.9	0.000	0.000	0.004	0.344	7337	22.3	0.131	32	2.0	17.6	3.0	0.095	56835	50343	my8036_rel.cz11c_bee
57034	0	0	0.0	249.5	19.1	0.000	0.000	0.004	0.342	6573	20.7	0.115	29	2.0	17.6	3.1	0.088	57135	53341	my8036_rel.cz11d_bee
l.x
l.x: create secondary indexes
Performance metrics for all DBMS, not just the ones listed above. Some are normalized by throughput, others are not. Legend for results is here.
ips	qps	rps	rmbps	wps	wmbps	rpq	rkbpq	wpi	wkbpi	csps	cpups	cspq	cpupq	dbgb1	dbgb2	rss	maxop	p50	p99	tag
109489	0	10	0.0	857.0	113.1	0.000	0.000	0.008	1.058	2388	11.6	0.022	8	4.2	19.7	4.8	0.002	NA	NA	my5651_rel.cz11a_bee
146342	0	0	0.0	1592.3	142.4	0.000	0.000	0.011	0.996	9469	12.3	0.065	7	4.6	20.1	4.4	0.002	NA	NA	my5744_rel.cz11a_bee
136987	0	705	44.6	2524.3	150.7	0.005	0.333	0.018	1.127	9433	43.3	0.069	25	4.5	20.1	5.3	0.003	NA	NA	my8036_rel.cz11a_bee
30832	0	156	9.9	820.3	36.1	0.005	0.328	0.027	1.200	5284	10.8	0.171	28	4.5	20.1	5.4	0.003	NA	NA	my8036_rel.cz11b_bee
21614	0	109	6.9	573.2	25.3	0.005	0.328	0.027	1.200	4920	7.9	0.228	29	4.5	20.1	5.4	0.003	NA	NA	my8036_rel.cz11c_bee
137615	0	705	44.6	2596.0	151.8	0.005	0.332	0.019	1.130	9518	43.7	0.069	25	4.5	20.1	5.3	0.003	NA	NA	my8036_rel.cz11d_bee
l.i1
l.i1: continue load after secondary indexes created with 50 inserts per transaction
Performance metrics for all DBMS, not just the ones listed above. Some are normalized by throughput, others are not. Legend for results is here.
ips	qps	rps	rmbps	wps	wmbps	rpq	rkbpq	wpi	wkbpi	csps	cpups	cspq	cpupq	dbgb1	dbgb2	rss	maxop	p50	p99	tag
15804	0	466	1.8	1820.3	77.2	0.029	0.118	0.115	5.003	21838	47.2	1.382	239	6.1	21.6	6.8	0.106	16831	4645	my5651_rel.cz11a_bee
18484	0	0	0.0	2024.5	87.4	0.000	0.000	0.110	4.843	17599	53.7	0.952	232	6.2	21.7	7.1	0.076	19379	5494	my5744_rel.cz11a_bee
16835	0	61	1.0	2782.0	102.0	0.004	0.058	0.165	6.206	38919	38.5	2.312	183	6.5	22.4	7.9	0.105	17580	5244	my8036_rel.cz11a_bee
13642	0	40	0.6	1602.6	60.8	0.003	0.047	0.117	4.563	34147	37.2	2.503	218	6.1	21.8	7.3	0.191	14041	3995	my8036_rel.cz11b_bee
14909	0	6	0.3	982.0	48.3	0.000	0.018	0.066	3.314	33407	36.8	2.241	197	6.3	22.1	6.9	1.066	16432	2547	my8036_rel.cz11c_bee
16906	0	61	1.0	2752.6	101.3	0.004	0.058	0.163	6.135	38939	38.6	2.303	183	6.5	22.4	7.9	0.104	17580	5244	my8036_rel.cz11d_bee
l.i2
l.i2: continue load after secondary indexes created with 5 inserts per transaction
Performance metrics for all DBMS, not just the ones listed above. Some are normalized by throughput, others are not. Legend for results is here.
ips	qps	rps	rmbps	wps	wmbps	rpq	rkbpq	wpi	wkbpi	csps	cpups	cspq	cpupq	dbgb1	dbgb2	rss	maxop	p50	p99	tag
11792	0	2112	8.3	1359.3	54.8	0.179	0.716	0.115	4.761	93912	44.5	7.964	302	6.1	21.6	6.8	0.060	11756	10878	my5651_rel.cz11a_bee
10493	0	0	0.0	1219.9	49.4	0.000	0.000	0.116	4.817	44878	42.2	4.277	322	6.2	21.7	7.1	0.060	10498	9789	my5744_rel.cz11a_bee
8643	0	0	0.0	1481.9	50.5	0.000	0.000	0.171	5.978	51714	35.6	5.983	330	6.5	22.4	7.9	0.102	8659	7781	my8036_rel.cz11a_bee
7027	0	0	0.0	1429.2	41.4	0.000	0.000	0.203	6.034	45076	36.5	6.414	416	6.1	21.8	7.3	0.107	7062	5594	my8036_rel.cz11b_bee
7770	0	0	0.0	978.9	30.4	0.000	0.000	0.126	4.009	46777	34.0	6.020	350	6.3	22.1	6.8	0.118	7841	6209	my8036_rel.cz11c_bee
8650	0	0	0.0	1469.8	50.2	0.000	0.000	0.170	5.939	51900	35.6	6.000	329	6.5	22.4	7.9	0.102	8669	7771	my8036_rel.cz11d_bee
qr100.L1
qr100.L1: range queries with 100 insert/s per client
Performance metrics for all DBMS, not just the ones listed above. Some are normalized by throughput, others are not. Legend for results is here.
ips	qps	rps	rmbps	wps	wmbps	rpq	rkbpq	wpi	wkbpi	csps	cpups	cspq	cpupq	dbgb1	dbgb2	rss	maxop	p50	p99	tag
100	5784	4	0.0	215.4	6.5	0.001	0.003	2.158	66.706	22963	13.2	3.970	183	6.1	21.6	6.8	0.023	5752	5578	my5651_rel.cz11a_bee
100	4224	0	0.0	123.4	3.6	0.000	0.000	1.236	37.183	16702	12.8	3.955	242	6.2	21.7	7.1	0.005	4155	4010	my5744_rel.cz11a_bee
100	3642	0	0.0	165.3	4.2	0.000	0.000	1.657	42.812	14954	13.2	4.105	290	6.5	22.4	7.9	0.005	3612	3436	my8036_rel.cz11a_bee
100	3532	0	0.0	36.6	0.8	0.000	0.000	0.367	7.985	14170	12.9	4.012	292	6.1	21.8	7.3	0.007	3516	3388	my8036_rel.cz11b_bee
100	3580	0	0.0	111.3	2.0	0.000	0.000	1.115	20.356	14750	13.6	4.120	304	6.3	22.1	6.8	0.050	3547	3356	my8036_rel.cz11c_bee
100	3604	0	0.0	152.7	3.9	0.000	0.000	1.530	39.549	14767	13.0	4.097	289	6.5	22.4	7.9	0.005	3564	3356	my8036_rel.cz11d_bee
qp100.L2
qp100.L2: point queries with 100 insert/s per client
Performance metrics for all DBMS, not just the ones listed above. Some are normalized by throughput, others are not. Legend for results is here.
ips	qps	rps	rmbps	wps	wmbps	rpq	rkbpq	wpi	wkbpi	csps	cpups	cspq	cpupq	dbgb1	dbgb2	rss	maxop	p50	p99	tag
100	4595	4	0.0	2.2	0.1	0.001	0.003	0.022	1.193	18669	13.6	4.063	237	6.1	21.6	6.8	0.011	4555	4298	my5651_rel.cz11a_bee
100	3756	0	0.0	32.9	0.9	0.000	0.000	0.329	9.048	15400	14.0	4.101	298	6.2	21.7	7.1	0.004	3692	3484	my5744_rel.cz11a_bee
100	2842	0	0.0	40.9	1.1	0.000	0.000	0.409	10.861	12111	13.3	4.261	374	6.5	22.4	7.9	0.004	2748	2605	my8036_rel.cz11a_bee
100	2876	0	0.0	14.2	0.3	0.000	0.000	0.142	2.970	12190	13.3	4.238	370	6.1	21.8	7.3	0.005	2750	2621	my8036_rel.cz11b_bee
100	2837	0	0.0	19.1	0.3	0.000	0.000	0.191	2.984	12066	13.1	4.253	369	6.3	22.1	6.8	0.003	2733	2589	my8036_rel.cz11c_bee
100	2808	0	0.0	42.5	1.1	0.000	0.000	0.426	11.402	11973	13.3	4.264	379	6.5	22.4	7.9	0.004	2717	2589	my8036_rel.cz11d_bee
qr500.L3
qr500.L3: range queries with 500 insert/s per client
Performance metrics for all DBMS, not just the ones listed above. Some are normalized by throughput, others are not. Legend for results is here.
ips	qps	rps	rmbps	wps	wmbps	rpq	rkbpq	wpi	wkbpi	csps	cpups	cspq	cpupq	dbgb1	dbgb2	rss	maxop	p50	p99	tag
499	5873	16	0.1	2.8	0.6	0.003	0.011	0.006	1.140	22944	14.3	3.907	195	6.1	21.6	6.8	0.010	5817	5689	my5651_rel.cz11a_bee
499	4229	0	0.0	68.2	2.4	0.000	0.000	0.137	4.903	16649	13.9	3.937	263	6.2	21.7	7.1	0.005	4155	3995	my5744_rel.cz11a_bee
499	3674	0	0.0	90.4	2.8	0.000	0.000	0.181	5.826	15439	14.2	4.203	309	6.5	22.4	7.9	0.003	3643	3420	my8036_rel.cz11a_bee
499	3634	0	0.0	128.2	3.3	0.000	0.000	0.257	6.864	15551	14.4	4.280	317	6.1	21.8	7.3	0.013	3596	3404	my8036_rel.cz11b_bee
499	3558	0	0.0	154.7	3.4	0.000	0.000	0.310	6.927	15506	15.1	4.358	340	6.3	22.1	6.8	0.052	3516	3324	my8036_rel.cz11c_bee
499	3575	0	0.0	92.0	2.9	0.000	0.000	0.184	5.940	15070	14.1	4.215	316	6.5	22.4	7.9	0.005	3548	3356	my8036_rel.cz11d_bee
qp500.L4
qp500.L4: point queries with 500 insert/s per client
Performance metrics for all DBMS, not just the ones listed above. Some are normalized by throughput, others are not. Legend for results is here.
ips	qps	rps	rmbps	wps	wmbps	rpq	rkbpq	wpi	wkbpi	csps	cpups	cspq	cpupq	dbgb1	dbgb2	rss	maxop	p50	p99	tag
499	4738	16	0.1	325.0	10.3	0.003	0.014	0.651	21.080	20616	14.7	4.351	248	6.1	21.6	6.8	0.011	4619	4331	my5651_rel.cz11a_bee
499	3751	0	0.0	73.4	2.5	0.000	0.000	0.147	5.221	15612	14.7	4.162	314	6.2	21.7	7.1	0.009	3692	3452	my5744_rel.cz11a_bee
499	2838	0	0.0	97.5	3.0	0.000	0.000	0.195	6.212	12874	14.2	4.536	400	6.5	22.4	7.9	0.007	2733	2589	my8036_rel.cz11a_bee
499	2823	0	0.0	130.4	3.4	0.000	0.000	0.261	6.976	13037	15.1	4.617	428	6.1	21.8	7.3	0.028	2734	2589	my8036_rel.cz11b_bee
499	2908	0	0.0	156.8	3.4	0.000	0.000	0.314	7.033	13652	15.4	4.694	424	6.3	22.1	6.8	0.007	2797	2591	my8036_rel.cz11c_bee
499	2830	0	0.0	107.1	3.3	0.000	0.000	0.215	6.706	12871	14.3	4.548	404	6.5	22.4	7.9	0.006	2735	2573	my8036_rel.cz11d_bee
qr1000.L5
qr1000.L5: range queries with 1000 insert/s per client
Performance metrics for all DBMS, not just the ones listed above. Some are normalized by throughput, others are not. Legend for results is here.
ips	qps	rps	rmbps	wps	wmbps	rpq	rkbpq	wpi	wkbpi	csps	cpups	cspq	cpupq	dbgb1	dbgb2	rss	maxop	p50	p99	tag
998	5935	32	0.1	348.2	11.5	0.005	0.021	0.349	11.771	24635	15.4	4.151	208	6.1	21.6	6.8	0.021	5887	5594	my5651_rel.cz11a_bee
998	4241	0	0.0	123.0	4.6	0.000	0.000	0.123	4.698	17053	15.2	4.021	287	6.2	21.7	7.1	0.008	4171	3979	my5744_rel.cz11a_bee
998	3723	0	0.0	215.0	6.7	0.000	0.000	0.215	6.823	16821	15.2	4.518	327	6.5	22.4	7.9	0.005	3692	3436	my8036_rel.cz11a_bee
998	3701	0	0.0	202.2	5.6	0.000	0.000	0.203	5.754	16914	15.9	4.570	344	6.1	21.8	7.3	0.048	3660	3436	my8036_rel.cz11b_bee
998	3677	0	0.0	252.5	5.8	0.000	0.000	0.253	5.988	17311	16.9	4.708	368	6.3	22.1	6.8	0.061	3614	3374	my8036_rel.cz11c_bee
998	3598	0	0.0	219.9	6.8	0.000	0.000	0.220	6.947	16363	15.2	4.547	338	6.5	22.4	8.0	0.005	3564	3340	my8036_rel.cz11d_bee
qp1000.L6
qp1000.L6: point queries with 1000 insert/s per client
Performance metrics for all DBMS, not just the ones listed above. Some are normalized by throughput, others are not. Legend for results is here.
ips	qps	rps	rmbps	wps	wmbps	rpq	rkbpq	wpi	wkbpi	csps	cpups	cspq	cpupq	dbgb1	dbgb2	rss	maxop	p50	p99	tag
998	4679	32	0.1	359.2	11.8	0.007	0.028	0.360	12.110	20840	15.8	4.454	270	6.1	21.6	6.8	0.011	4555	4235	my5651_rel.cz11a_bee
998	3753	0	0.0	124.0	4.6	0.000	0.000	0.124	4.725	15969	15.6	4.255	333	6.2	21.7	7.1	0.008	3676	3436	my5744_rel.cz11a_bee
998	2885	0	0.0	213.9	6.6	0.000	0.000	0.214	6.791	14241	15.4	4.937	427	6.5	22.4	7.9	0.007	2798	2605	my8036_rel.cz11a_bee
998	2942	0	0.0	228.2	6.2	0.000	0.000	0.229	6.327	14759	16.5	5.017	449	6.1	21.8	7.3	0.008	2877	2605	my8036_rel.cz11b_bee
998	2938	0	0.0	276.3	6.3	0.000	0.000	0.277	6.443	15249	17.8	5.190	485	6.3	22.1	6.8	0.007	2877	2605	my8036_rel.cz11c_bee
998	2867	0	0.0	212.3	6.6	0.000	0.000	0.213	6.737	14152	15.4	4.936	430	6.5	22.4	8.0	0.008	2783	2589	my8036_rel.cz11d_bee
l.i0
- l.i0: load without secondary indexes
- Legend for results is here.
- Each entry lists the percentage of responses that fit in that bucket (slower than max time for previous bucket, faster than min time for next bucket).
Insert response time histogram
256us	1ms	4ms	16ms	64ms	256ms	1s	4s	16s	gt	max	tag
0.000	88.704	11.182	0.110	0.002	0.002	0.000	0.000	0.000	0.000	0.098	my5651_rel.cz11a_bee
0.000	1.806	97.855	0.200	0.138	nonzero	0.000	0.000	0.000	0.000	0.103	my5744_rel.cz11a_bee
0.000	0.000	99.413	0.455	0.131	0.001	0.000	0.000	0.000	0.000	0.086	my8036_rel.cz11a_bee
0.000	0.000	99.397	0.463	0.139	0.001	0.000	0.000	0.000	0.000	0.108	my8036_rel.cz11b_bee
0.000	0.000	99.395	0.448	0.151	0.005	0.000	0.000	0.000	0.000	0.095	my8036_rel.cz11c_bee
0.000	0.000	99.421	0.443	0.135	0.001	0.000	0.000	0.000	0.000	0.088	my8036_rel.cz11d_bee
l.x
- l.x: create secondary indexes
- Legend for results is here.
- Each entry lists the percentage of responses that fit in that bucket (slower than max time for previous bucket, faster than min time for next bucket).
TODO - determine whether there is data for create index response time
l.i1
- l.i1: continue load after secondary indexes created with 50 inserts per transaction
- Legend for results is here.
- Each entry lists the percentage of responses that fit in that bucket (slower than max time for previous bucket, faster than min time for next bucket).
Insert response time histogram
256us	1ms	4ms	16ms	64ms	256ms	1s	4s	16s	gt	max	tag
0.000	0.000	90.441	9.372	0.187	0.001	0.000	0.000	0.000	0.000	0.106	my5651_rel.cz11a_bee
0.000	0.000	94.618	5.285	0.096	0.001	0.000	0.000	0.000	0.000	0.076	my5744_rel.cz11a_bee
0.000	0.000	95.888	3.954	0.156	0.002	0.000	0.000	0.000	0.000	0.105	my8036_rel.cz11a_bee
0.000	0.000	88.756	10.108	1.125	0.011	0.000	0.000	0.000	0.000	0.191	my8036_rel.cz11b_bee
0.000	0.000	91.647	7.725	0.579	0.044	0.004	0.001	0.000	0.000	1.066	my8036_rel.cz11c_bee
0.000	0.000	95.949	3.895	0.154	0.002	0.000	0.000	0.000	0.000	0.104	my8036_rel.cz11d_bee
Delete response time histogram
256us	1ms	4ms	16ms	64ms	256ms	1s	4s	16s	gt	max	tag
0.000	0.000	96.240	3.661	0.099	nonzero	0.000	0.000	0.000	0.000	0.066	my5651_rel.cz11a_bee
0.000	0.000	96.864	3.118	0.017	0.001	0.000	0.000	0.000	0.000	0.075	my5744_rel.cz11a_bee
0.000	0.000	97.676	2.274	0.049	0.001	0.000	0.000	0.000	0.000	0.105	my8036_rel.cz11a_bee
0.000	0.000	92.513	6.842	0.638	0.007	0.000	0.000	0.000	0.000	0.105	my8036_rel.cz11b_bee
0.000	0.000	94.974	4.752	0.254	0.016	0.004	0.001	0.000	0.000	1.049	my8036_rel.cz11c_bee
0.000	0.000	97.608	2.343	0.047	0.002	0.000	0.000	0.000	0.000	0.104	my8036_rel.cz11d_bee
l.i2
- l.i2: continue load after secondary indexes created with 5 inserts per transaction
- Legend for results is here.
- Each entry lists the percentage of responses that fit in that bucket (slower than max time for previous bucket, faster than min time for next bucket).
Insert response time histogram
256us	1ms	4ms	16ms	64ms	256ms	1s	4s	16s	gt	max	tag
8.832	90.820	0.127	0.221	0.001	0.000	0.000	0.000	0.000	0.000	0.060	my5651_rel.cz11a_bee
0.136	98.727	0.889	0.247	0.001	0.000	0.000	0.000	0.000	0.000	0.060	my5744_rel.cz11a_bee
0.000	99.384	0.360	0.254	0.002	nonzero	0.000	0.000	0.000	0.000	0.102	my8036_rel.cz11a_bee
0.000	98.023	0.884	0.997	0.093	0.002	0.000	0.000	0.000	0.000	0.107	my8036_rel.cz11b_bee
0.000	98.793	0.524	0.656	0.025	0.002	0.000	0.000	0.000	0.000	0.118	my8036_rel.cz11c_bee
0.000	99.375	0.369	0.254	0.002	0.001	0.000	0.000	0.000	0.000	0.102	my8036_rel.cz11d_bee
Delete response time histogram
256us	1ms	4ms	16ms	64ms	256ms	1s	4s	16s	gt	max	tag
13.136	86.570	0.074	0.220	0.001	0.000	0.000	0.000	0.000	0.000	0.060	my5651_rel.cz11a_bee
0.424	98.416	0.914	0.245	0.001	0.000	0.000	0.000	0.000	0.000	0.060	my5744_rel.cz11a_bee
0.000	99.545	0.204	0.249	0.002	nonzero	0.000	0.000	0.000	0.000	0.102	my8036_rel.cz11a_bee
0.000	98.408	0.542	0.965	0.081	0.003	0.000	0.000	0.000	0.000	0.102	my8036_rel.cz11b_bee
0.000	99.037	0.280	0.661	0.021	0.001	0.000	0.000	0.000	0.000	0.108	my8036_rel.cz11c_bee
0.000	99.547	0.204	0.246	0.002	0.001	0.000	0.000	0.000	0.000	0.102	my8036_rel.cz11d_bee
qr100.L1
- qr100.L1: range queries with 100 insert/s per client
- Legend for results is here.
- Each entry lists the percentage of responses that fit in that bucket (slower than max time for previous bucket, faster than min time for next bucket).
Query response time histogram
256us	1ms	4ms	16ms	64ms	256ms	1s	4s	16s	gt	max	tag
97.609	2.384	0.003	0.004	nonzero	0.000	0.000	0.000	0.000	0.000	0.023	my5651_rel.cz11a_bee
74.928	25.071	0.001	nonzero	0.000	0.000	0.000	0.000	0.000	0.000	0.005	my5744_rel.cz11a_bee
59.842	40.157	0.001	nonzero	0.000	0.000	0.000	0.000	0.000	0.000	0.005	my8036_rel.cz11a_bee
53.783	46.217	nonzero	nonzero	0.000	0.000	0.000	0.000	0.000	0.000	0.007	my8036_rel.cz11b_bee
56.109	43.891	0.001	nonzero	nonzero	0.000	0.000	0.000	0.000	0.000	0.050	my8036_rel.cz11c_bee
56.269	43.730	0.001	nonzero	0.000	0.000	0.000	0.000	0.000	0.000	0.005	my8036_rel.cz11d_bee
Insert response time histogram
256us	1ms	4ms	16ms	64ms	256ms	1s	4s	16s	gt	max	tag
0.000	0.000	47.556	49.806	2.639	0.000	0.000	0.000	0.000	0.000	0.056	my5651_rel.cz11a_bee
0.000	0.000	99.472	0.528	0.000	0.000	0.000	0.000	0.000	0.000	0.013	my5744_rel.cz11a_bee
0.000	0.000	98.889	1.083	0.028	0.000	0.000	0.000	0.000	0.000	0.026	my8036_rel.cz11a_bee
0.000	0.000	99.528	0.472	0.000	0.000	0.000	0.000	0.000	0.000	0.015	my8036_rel.cz11b_bee
0.000	0.000	99.278	0.667	0.028	0.028	0.000	0.000	0.000	0.000	0.085	my8036_rel.cz11c_bee
0.000	0.000	99.472	0.528	0.000	0.000	0.000	0.000	0.000	0.000	0.014	my8036_rel.cz11d_bee
Delete response time histogram
256us	1ms	4ms	16ms	64ms	256ms	1s	4s	16s	gt	max	tag
0.000	0.000	48.972	49.056	1.972	0.000	0.000	0.000	0.000	0.000	0.062	my5651_rel.cz11a_bee
0.000	0.000	99.639	0.361	0.000	0.000	0.000	0.000	0.000	0.000	0.012	my5744_rel.cz11a_bee
0.000	0.000	99.028	0.944	0.028	0.000	0.000	0.000	0.000	0.000	0.019	my8036_rel.cz11a_bee
0.000	0.000	99.667	0.333	0.000	0.000	0.000	0.000	0.000	0.000	0.013	my8036_rel.cz11b_bee
0.000	0.000	99.417	0.472	0.056	0.056	0.000	0.000	0.000	0.000	0.091	my8036_rel.cz11c_bee
0.000	0.000	99.500	0.500	0.000	0.000	0.000	0.000	0.000	0.000	0.015	my8036_rel.cz11d_bee
qp100.L2
- qp100.L2: point queries with 100 insert/s per client
- Legend for results is here.
- Each entry lists the percentage of responses that fit in that bucket (slower than max time for previous bucket, faster than min time for next bucket).
Query response time histogram
256us	1ms	4ms	16ms	64ms	256ms	1s	4s	16s	gt	max	tag
94.342	5.648	0.007	0.003	0.000	0.000	0.000	0.000	0.000	0.000	0.011	my5651_rel.cz11a_bee
85.558	14.437	0.005	0.000	0.000	0.000	0.000	0.000	0.000	0.000	0.004	my5744_rel.cz11a_bee
10.870	89.128	0.002	nonzero	0.000	0.000	0.000	0.000	0.000	0.000	0.004	my8036_rel.cz11a_bee
13.687	86.311	0.001	nonzero	0.000	0.000	0.000	0.000	0.000	0.000	0.005	my8036_rel.cz11b_bee
12.590	87.408	0.002	0.000	0.000	0.000	0.000	0.000	0.000	0.000	0.003	my8036_rel.cz11c_bee
9.534	90.464	0.002	0.000	0.000	0.000	0.000	0.000	0.000	0.000	0.004	my8036_rel.cz11d_bee
Insert response time histogram
256us	1ms	4ms	16ms	64ms	256ms	1s	4s	16s	gt	max	tag
0.000	0.000	50.583	49.083	0.333	0.000	0.000	0.000	0.000	0.000	0.023	my5651_rel.cz11a_bee
0.000	0.000	99.417	0.583	0.000	0.000	0.000	0.000	0.000	0.000	0.010	my5744_rel.cz11a_bee
0.000	0.000	99.639	0.361	0.000	0.000	0.000	0.000	0.000	0.000	0.016	my8036_rel.cz11a_bee
0.000	0.000	99.694	0.306	0.000	0.000	0.000	0.000	0.000	0.000	0.009	my8036_rel.cz11b_bee
0.000	0.000	99.306	0.667	0.028	0.000	0.000	0.000	0.000	0.000	0.018	my8036_rel.cz11c_bee
0.000	0.000	99.722	0.250	0.028	0.000	0.000	0.000	0.000	0.000	0.021	my8036_rel.cz11d_bee
Delete response time histogram
256us	1ms	4ms	16ms	64ms	256ms	1s	4s	16s	gt	max	tag
0.000	0.000	53.556	46.250	0.194	0.000	0.000	0.000	0.000	0.000	0.018	my5651_rel.cz11a_bee
0.000	0.000	99.667	0.333	0.000	0.000	0.000	0.000	0.000	0.000	0.010	my5744_rel.cz11a_bee
0.000	0.000	99.806	0.194	0.000	0.000	0.000	0.000	0.000	0.000	0.008	my8036_rel.cz11a_bee
0.000	0.000	99.750	0.250	0.000	0.000	0.000	0.000	0.000	0.000	0.009	my8036_rel.cz11b_bee
0.000	0.000	99.472	0.528	0.000	0.000	0.000	0.000	0.000	0.000	0.013	my8036_rel.cz11c_bee
0.000	0.000	99.806	0.194	0.000	0.000	0.000	0.000	0.000	0.000	0.014	my8036_rel.cz11d_bee
qr500.L3
- qr500.L3: range queries with 500 insert/s per client
- Legend for results is here.
- Each entry lists the percentage of responses that fit in that bucket (slower than max time for previous bucket, faster than min time for next bucket).
Query response time histogram
256us	1ms	4ms	16ms	64ms	256ms	1s	4s	16s	gt	max	tag
97.581	2.412	0.003	0.003	0.000	0.000	0.000	0.000	0.000	0.000	0.010	my5651_rel.cz11a_bee
75.116	24.883	0.001	nonzero	0.000	0.000	0.000	0.000	0.000	0.000	0.005	my5744_rel.cz11a_bee
60.665	39.334	0.001	0.000	0.000	0.000	0.000	0.000	0.000	0.000	0.003	my8036_rel.cz11a_bee
58.989	41.010	0.001	nonzero	0.000	0.000	0.000	0.000	0.000	0.000	0.013	my8036_rel.cz11b_bee
53.490	46.507	0.002	0.001	nonzero	0.000	0.000	0.000	0.000	0.000	0.052	my8036_rel.cz11c_bee
54.741	45.258	0.001	nonzero	0.000	0.000	0.000	0.000	0.000	0.000	0.005	my8036_rel.cz11d_bee
Insert response time histogram
256us	1ms	4ms	16ms	64ms	256ms	1s	4s	16s	gt	max	tag
0.000	0.000	87.278	12.633	0.089	0.000	0.000	0.000	0.000	0.000	0.022	my5651_rel.cz11a_bee
0.000	0.000	99.500	0.500	0.000	0.000	0.000	0.000	0.000	0.000	0.012	my5744_rel.cz11a_bee
0.000	0.000	98.939	1.044	0.017	0.000	0.000	0.000	0.000	0.000	0.026	my8036_rel.cz11a_bee
0.000	0.000	99.183	0.789	0.028	0.000	0.000	0.000	0.000	0.000	0.037	my8036_rel.cz11b_bee
0.000	0.000	98.872	0.950	0.150	0.028	0.000	0.000	0.000	0.000	0.081	my8036_rel.cz11c_bee
0.000	0.000	99.194	0.789	0.017	0.000	0.000	0.000	0.000	0.000	0.025	my8036_rel.cz11d_bee
Delete response time histogram
256us	1ms	4ms	16ms	64ms	256ms	1s	4s	16s	gt	max	tag
0.000	0.000	90.000	9.972	0.028	0.000	0.000	0.000	0.000	0.000	0.018	my5651_rel.cz11a_bee
0.000	0.000	99.656	0.344	0.000	0.000	0.000	0.000	0.000	0.000	0.012	my5744_rel.cz11a_bee
0.000	0.000	99.528	0.461	0.011	0.000	0.000	0.000	0.000	0.000	0.024	my8036_rel.cz11a_bee
0.000	0.000	99.506	0.433	0.061	0.000	0.000	0.000	0.000	0.000	0.048	my8036_rel.cz11b_bee
0.000	0.000	99.317	0.522	0.156	0.006	0.000	0.000	0.000	0.000	0.075	my8036_rel.cz11c_bee
0.000	0.000	99.711	0.278	0.011	0.000	0.000	0.000	0.000	0.000	0.023	my8036_rel.cz11d_bee
qp500.L4
- qp500.L4: point queries with 500 insert/s per client
- Legend for results is here.
- Each entry lists the percentage of responses that fit in that bucket (slower than max time for previous bucket, faster than min time for next bucket).
Query response time histogram
256us	1ms	4ms	16ms	64ms	256ms	1s	4s	16s	gt	max	tag
94.677	5.299	0.023	0.002	0.000	0.000	0.000	0.000	0.000	0.000	0.011	my5651_rel.cz11a_bee
84.803	15.189	0.007	nonzero	0.000	0.000	0.000	0.000	0.000	0.000	0.009	my5744_rel.cz11a_bee
11.394	88.601	0.004	nonzero	0.000	0.000	0.000	0.000	0.000	0.000	0.007	my8036_rel.cz11a_bee
9.756	90.240	0.004	nonzero	nonzero	0.000	0.000	0.000	0.000	0.000	0.028	my8036_rel.cz11b_bee
18.219	81.776	0.005	nonzero	0.000	0.000	0.000	0.000	0.000	0.000	0.007	my8036_rel.cz11c_bee
11.495	88.500	0.005	nonzero	0.000	0.000	0.000	0.000	0.000	0.000	0.006	my8036_rel.cz11d_bee
Insert response time histogram
256us	1ms	4ms	16ms	64ms	256ms	1s	4s	16s	gt	max	tag
0.000	0.000	84.367	15.506	0.128	0.000	0.000	0.000	0.000	0.000	0.041	my5651_rel.cz11a_bee
0.000	0.000	99.428	0.572	0.000	0.000	0.000	0.000	0.000	0.000	0.016	my5744_rel.cz11a_bee
0.000	0.000	99.017	0.950	0.028	0.006	0.000	0.000	0.000	0.000	0.105	my8036_rel.cz11a_bee
0.000	0.000	98.556	1.317	0.128	0.000	0.000	0.000	0.000	0.000	0.062	my8036_rel.cz11b_bee
0.000	0.000	98.828	1.022	0.117	0.033	0.000	0.000	0.000	0.000	0.086	my8036_rel.cz11c_bee
0.000	0.000	98.861	1.128	0.011	0.000	0.000	0.000	0.000	0.000	0.025	my8036_rel.cz11d_bee
Delete response time histogram
256us	1ms	4ms	16ms	64ms	256ms	1s	4s	16s	gt	max	tag
0.000	0.000	88.200	11.761	0.039	0.000	0.000	0.000	0.000	0.000	0.031	my5651_rel.cz11a_bee
0.000	0.000	99.606	0.394	0.000	0.000	0.000	0.000	0.000	0.000	0.013	my5744_rel.cz11a_bee
0.000	0.000	99.761	0.228	0.006	0.006	0.000	0.000	0.000	0.000	0.103	my8036_rel.cz11a_bee
0.000	0.000	99.289	0.561	0.150	0.000	0.000	0.000	0.000	0.000	0.039	my8036_rel.cz11b_bee
0.000	0.000	99.489	0.394	0.106	0.011	0.000	0.000	0.000	0.000	0.085	my8036_rel.cz11c_bee
0.000	0.000	99.656	0.344	0.000	0.000	0.000	0.000	0.000	0.000	0.015	my8036_rel.cz11d_bee
qr1000.L5
- qr1000.L5: range queries with 1000 insert/s per client
- Legend for results is here.
- Each entry lists the percentage of responses that fit in that bucket (slower than max time for previous bucket, faster than min time for next bucket).
Query response time histogram
256us	1ms	4ms	16ms	64ms	256ms	1s	4s	16s	gt	max	tag
97.396	2.588	0.013	0.003	nonzero	0.000	0.000	0.000	0.000	0.000	0.021	my5651_rel.cz11a_bee
76.286	23.712	0.001	nonzero	0.000	0.000	0.000	0.000	0.000	0.000	0.008	my5744_rel.cz11a_bee
62.298	37.699	0.003	nonzero	0.000	0.000	0.000	0.000	0.000	0.000	0.005	my8036_rel.cz11a_bee
61.155	38.840	0.004	nonzero	nonzero	0.000	0.000	0.000	0.000	0.000	0.048	my8036_rel.cz11b_bee
59.492	40.502	0.004	0.001	nonzero	0.000	0.000	0.000	0.000	0.000	0.061	my8036_rel.cz11c_bee
55.183	44.814	0.003	nonzero	0.000	0.000	0.000	0.000	0.000	0.000	0.005	my8036_rel.cz11d_bee
Insert response time histogram
256us	1ms	4ms	16ms	64ms	256ms	1s	4s	16s	gt	max	tag
0.000	0.000	86.669	13.228	0.103	0.000	0.000	0.000	0.000	0.000	0.030	my5651_rel.cz11a_bee
0.000	0.000	99.422	0.578	0.000	0.000	0.000	0.000	0.000	0.000	0.016	my5744_rel.cz11a_bee
0.000	0.000	97.419	2.569	0.011	0.000	0.000	0.000	0.000	0.000	0.026	my8036_rel.cz11a_bee
0.000	0.000	97.206	2.639	0.153	0.003	0.000	0.000	0.000	0.000	0.093	my8036_rel.cz11b_bee
0.000	0.000	96.861	2.764	0.328	0.047	0.000	0.000	0.000	0.000	0.109	my8036_rel.cz11c_bee
0.000	0.000	97.872	2.117	0.011	0.000	0.000	0.000	0.000	0.000	0.026	my8036_rel.cz11d_bee
Delete response time histogram
256us	1ms	4ms	16ms	64ms	256ms	1s	4s	16s	gt	max	tag
0.000	0.000	92.547	7.369	0.083	0.000	0.000	0.000	0.000	0.000	0.025	my5651_rel.cz11a_bee
0.000	0.000	99.628	0.372	0.000	0.000	0.000	0.000	0.000	0.000	0.015	my5744_rel.cz11a_bee
0.000	0.000	99.392	0.606	0.003	0.000	0.000	0.000	0.000	0.000	0.025	my8036_rel.cz11a_bee
0.000	0.000	98.972	0.917	0.111	0.000	0.000	0.000	0.000	0.000	0.061	my8036_rel.cz11b_bee
0.000	0.000	99.058	0.683	0.214	0.044	0.000	0.000	0.000	0.000	0.092	my8036_rel.cz11c_bee
0.000	0.000	99.475	0.522	0.003	0.000	0.000	0.000	0.000	0.000	0.024	my8036_rel.cz11d_bee
qp1000.L6
- qp1000.L6: point queries with 1000 insert/s per client
- Legend for results is here.
- Each entry lists the percentage of responses that fit in that bucket (slower than max time for previous bucket, faster than min time for next bucket).
Query response time histogram
256us	1ms	4ms	16ms	64ms	256ms	1s	4s	16s	gt	max	tag
93.763	6.132	0.104	0.002	0.000	0.000	0.000	0.000	0.000	0.000	0.011	my5651_rel.cz11a_bee
83.527	16.459	0.014	nonzero	0.000	0.000	0.000	0.000	0.000	0.000	0.008	my5744_rel.cz11a_bee
17.097	82.891	0.012	nonzero	0.000	0.000	0.000	0.000	0.000	0.000	0.007	my8036_rel.cz11a_bee
20.595	79.393	0.011	nonzero	0.000	0.000	0.000	0.000	0.000	0.000	0.008	my8036_rel.cz11b_bee
22.719	77.269	0.012	nonzero	0.000	0.000	0.000	0.000	0.000	0.000	0.007	my8036_rel.cz11c_bee
15.756	84.234	0.009	nonzero	0.000	0.000	0.000	0.000	0.000	0.000	0.008	my8036_rel.cz11d_bee
Insert response time histogram
256us	1ms	4ms	16ms	64ms	256ms	1s	4s	16s	gt	max	tag
0.000	0.000	84.956	14.950	0.094	0.000	0.000	0.000	0.000	0.000	0.023	my5651_rel.cz11a_bee
0.000	0.000	99.408	0.589	0.003	0.000	0.000	0.000	0.000	0.000	0.017	my5744_rel.cz11a_bee
0.000	0.000	96.756	3.222	0.022	0.000	0.000	0.000	0.000	0.000	0.031	my8036_rel.cz11a_bee
0.000	0.000	96.839	3.014	0.144	0.003	0.000	0.000	0.000	0.000	0.103	my8036_rel.cz11b_bee
0.000	0.000	96.092	3.481	0.392	0.036	0.000	0.000	0.000	0.000	0.088	my8036_rel.cz11c_bee
0.000	0.000	97.878	2.114	0.008	0.000	0.000	0.000	0.000	0.000	0.031	my8036_rel.cz11d_bee
Delete response time histogram
256us	1ms	4ms	16ms	64ms	256ms	1s	4s	16s	gt	max	tag
0.000	0.000	90.719	9.214	0.067	0.000	0.000	0.000	0.000	0.000	0.023	my5651_rel.cz11a_bee
0.000	0.000	99.672	0.328	0.000	0.000	0.000	0.000	0.000	0.000	0.015	my5744_rel.cz11a_bee
0.000	0.000	99.358	0.628	0.014	0.000	0.000	0.000	0.000	0.000	0.030	my8036_rel.cz11a_bee
0.000	0.000	98.989	0.886	0.122	0.003	0.000	0.000	0.000	0.000	0.102	my8036_rel.cz11b_bee
0.000	0.000	98.558	1.111	0.286	0.044	0.000	0.000	0.000	0.000	0.119	my8036_rel.cz11c_bee
0.000	0.000	99.650	0.344	0.006	0.000	0.000	0.000	0.000	0.000	0.030	my8036_rel.cz11d_bee