Introduction
This is a report for the insert benchmark with 30M docs and 1 client(s). It is generated by scripts (bash, awk, sed) and Tufte might not be impressed. An overview of the insert benchmark is here and a short update is here. Below, by DBMS, I mean DBMS+version.config. An example is my8020.c10b40 where my means MySQL, 8020 is version 8.0.20 and c10b40 is the name for the configuration file.
The test server has 8 AMD cores, 16G RAM and an NVMe SSD. It is described here as the Beelink. The benchmark was run with 1 client and there were 1 or 3 connections per client (1 for queries or inserts without rate limits, 1+1 for rate limited inserts+deletes). It uses 1 table. It loads 30M rows per table without secondary indexes, creates 3 secondary indexes per table, then inserts 40m+10m rows per table with a delete per insert to avoid growing the table. It then does 6 read+write tests for 1800s each that do queries as fast as possible with 100,100,500,500,1000,1000 inserts/s and the same for deletes/s per client concurrent with the queries. The database is cached in memory. Clients and the DBMS share one server. The per-database configs are in the per-database subdirectories here.
The tested DBMS are:
- ma100244_rel.cz11a_bee - MariaDB 10.2.44 with the cz11a_bee config that uses innodb_flush_method=O_DIRECT_NO_FSYNC
- ma100339_rel.cz11a_bee - MariaDB 10.3.39 with the cz11a_bee config
- ma100433_rel.cz11a_bee - MariaDB 10.4.33 with the cz11a_bee config
- ma100524_rel.cz11a_bee - MariaDB 10.5.24 with the cz11a_bee config
- ma100617_rel.cz11a_bee - MariaDB 10.6.17 with the cz11a_bee config
- ma101107_rel.cz11a_bee - MariaDB 10.11.7 with the cz11a_bee config
- ma101107_rel.cz11b_bee - MariaDB 10.11.7 with the cz11b_bee config that uses innodb_flush_method=O_DIRECT
- ma101107_rel.cz11c_bee - MariaDB 10.11.7 with the cz11c_bee config that uses innodb_flush_method=fsync
- ma101107_rel.cz11d_bee - MariaDB 10.11.7 with the cz11d_bee config that uses innodb_change_buffering=all
- ma110401_rel.cz11b_bee - MariaDB 11.4.1 with the cz11b_bee config that uses innodb_flush_method=O_DIRECT
- ma110401_rel.cz11c_bee - MariaDB 11.4.1 with the cz11c_bee config that uses innodb_flush_method=fsync
Contents
- Summary
- l.i0: load without secondary indexes
- l.x: create secondary indexes
- l.i1: continue load after secondary indexes created with 50 inserts per transaction
- l.i2: continue load after secondary indexes created with 5 inserts per transaction
- qr100.L1: range queries with 100 insert/s per client
- qp100.L2: point queries with 100 insert/s per client
- qr500.L3: range queries with 500 insert/s per client
- qp500.L4: point queries with 500 insert/s per client
- qr1000.L5: range queries with 1000 insert/s per client
- qp1000.L6: point queries with 1000 insert/s per client
Summary
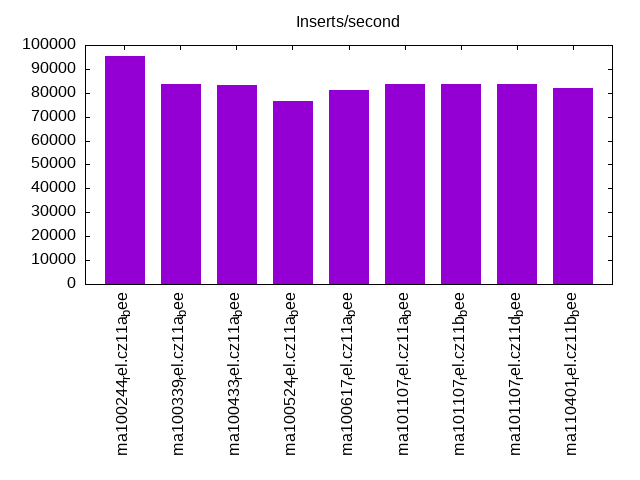
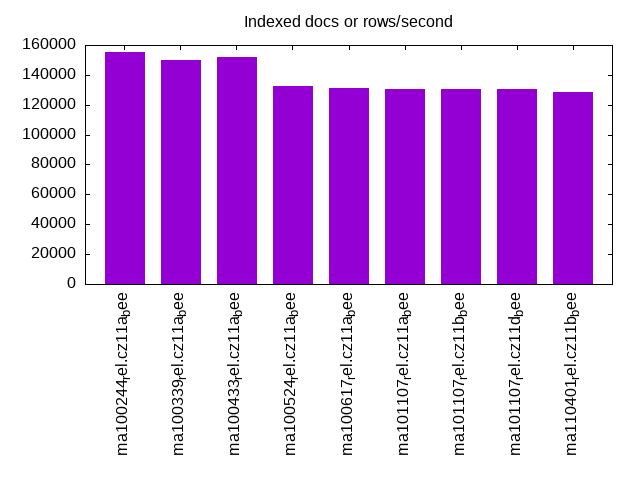
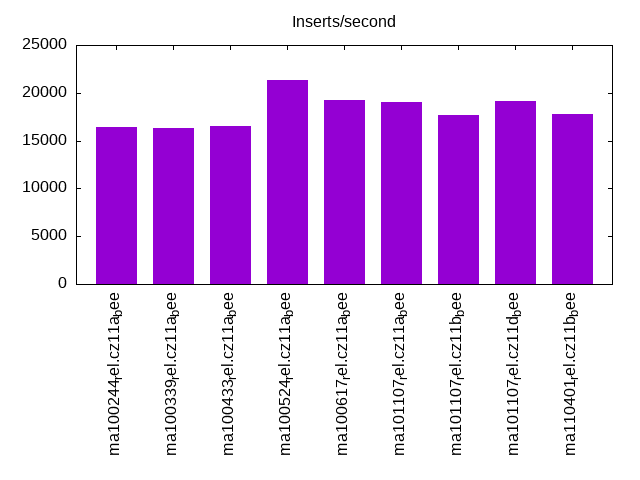
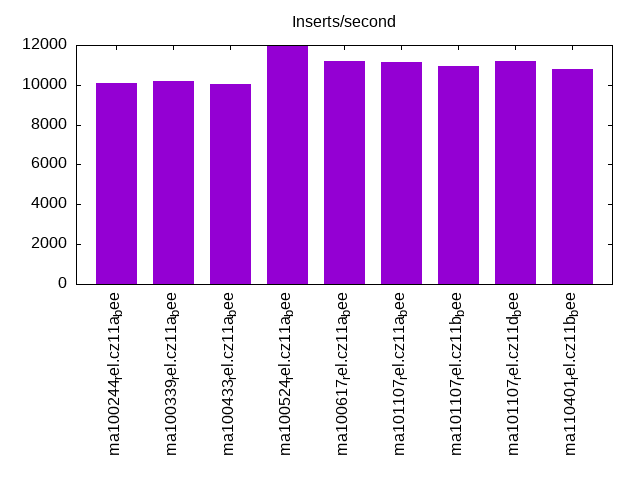
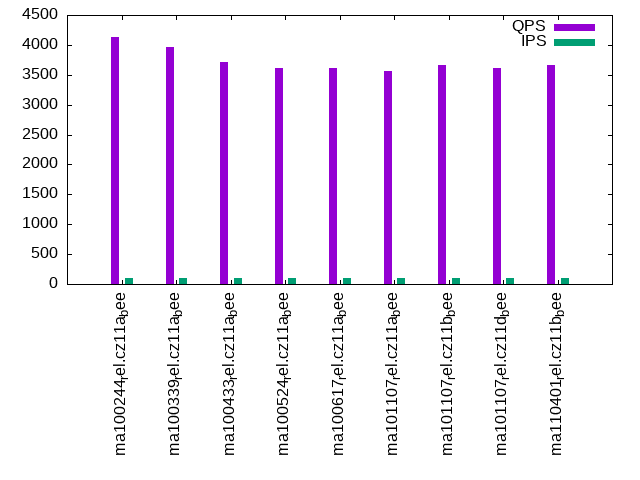
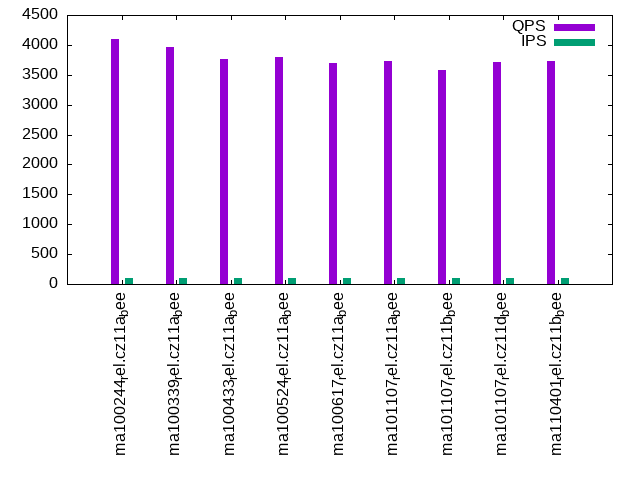
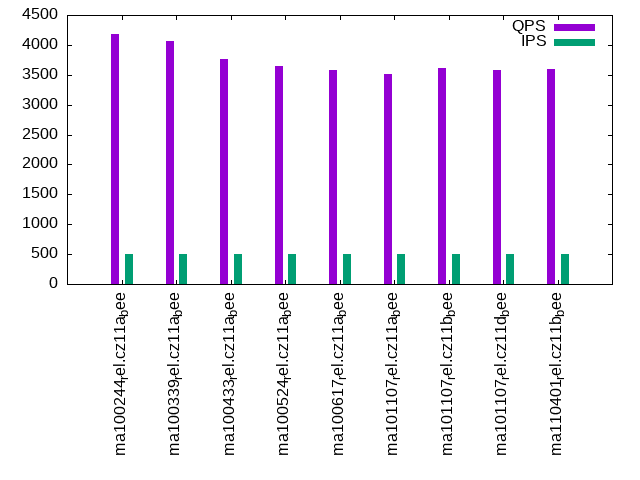
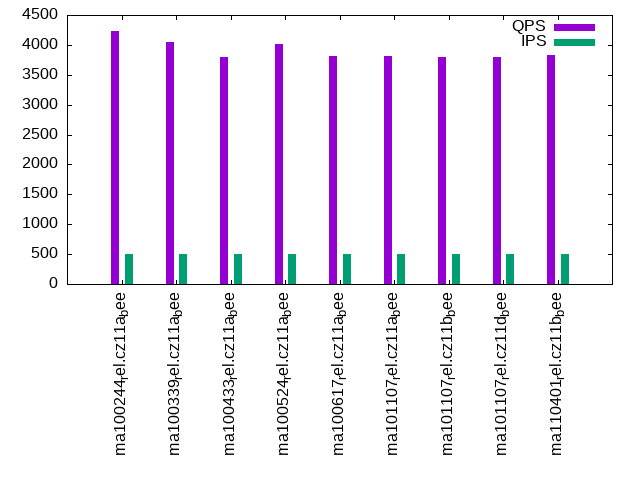
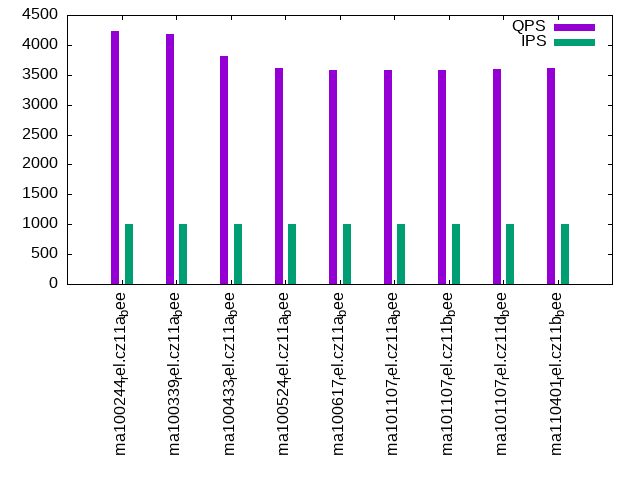
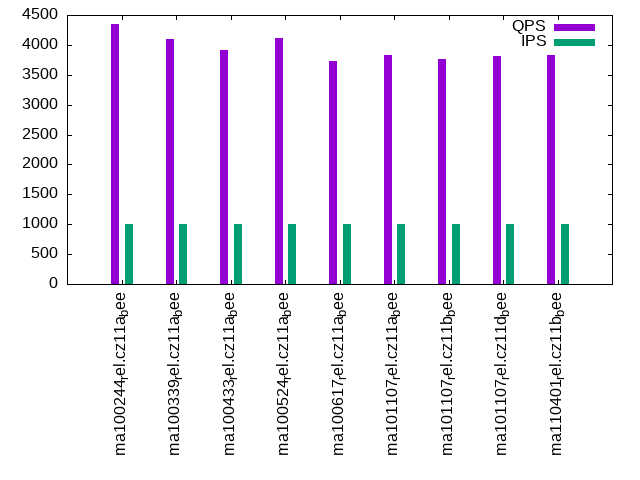
The numbers are inserts/s for l.i0, l.i1 and l.i2, indexed docs (or rows) /s for l.x and queries/s for qr100, qp100 thru qr1000, qp1000" The values are the average rate over the entire test for inserts (IPS) and queries (QPS). The range of values for IPS and QPS is split into 3 parts: bottom 25%, middle 50%, top 25%. Values in the bottom 25% have a red background, values in the top 25% have a green background and values in the middle have no color. A gray background is used for values that can be ignored because the DBMS did not sustain the target insert rate. Red backgrounds are not used when the minimum value is within 80% of the max value.
| dbms | l.i0 | l.x | l.i1 | l.i2 | qr100 | qp100 | qr500 | qp500 | qr1000 | qp1000 |
|---|---|---|---|---|---|---|---|---|---|---|
| ma100244_rel.cz11a_bee | 95541 | 155441 | 16454 | 10111 | 4128 | 4106 | 4184 | 4231 | 4232 | 4350 |
| ma100339_rel.cz11a_bee | 83565 | 150000 | 16320 | 10194 | 3970 | 3970 | 4062 | 4055 | 4182 | 4093 |
| ma100433_rel.cz11a_bee | 83102 | 152285 | 16522 | 10040 | 3713 | 3764 | 3757 | 3805 | 3814 | 3920 |
| ma100524_rel.cz11a_bee | 76726 | 132744 | 21345 | 11947 | 3607 | 3801 | 3650 | 4015 | 3619 | 4107 |
| ma100617_rel.cz11a_bee | 81081 | 131005 | 19286 | 11186 | 3613 | 3698 | 3573 | 3813 | 3580 | 3727 |
| ma101107_rel.cz11a_bee | 83799 | 130435 | 19066 | 11136 | 3565 | 3729 | 3516 | 3818 | 3574 | 3824 |
| ma101107_rel.cz11b_bee | 83565 | 130435 | 17730 | 10941 | 3670 | 3588 | 3621 | 3791 | 3578 | 3768 |
| ma101107_rel.cz11d_bee | 83799 | 130435 | 19175 | 11198 | 3614 | 3720 | 3580 | 3802 | 3597 | 3807 |
| ma110401_rel.cz11b_bee | 82192 | 128206 | 17770 | 10799 | 3667 | 3728 | 3593 | 3835 | 3618 | 3836 |
This table has relative throughput, throughput for the DBMS relative to the DBMS in the first line, using the absolute throughput from the previous table. Values less than 0.95 have a yellow background. Values greater than 1.05 have a blue background.
| dbms | l.i0 | l.x | l.i1 | l.i2 | qr100 | qp100 | qr500 | qp500 | qr1000 | qp1000 |
|---|---|---|---|---|---|---|---|---|---|---|
| ma100244_rel.cz11a_bee | 1.00 | 1.00 | 1.00 | 1.00 | 1.00 | 1.00 | 1.00 | 1.00 | 1.00 | 1.00 |
| ma100339_rel.cz11a_bee | 0.87 | 0.96 | 0.99 | 1.01 | 0.96 | 0.97 | 0.97 | 0.96 | 0.99 | 0.94 |
| ma100433_rel.cz11a_bee | 0.87 | 0.98 | 1.00 | 0.99 | 0.90 | 0.92 | 0.90 | 0.90 | 0.90 | 0.90 |
| ma100524_rel.cz11a_bee | 0.80 | 0.85 | 1.30 | 1.18 | 0.87 | 0.93 | 0.87 | 0.95 | 0.86 | 0.94 |
| ma100617_rel.cz11a_bee | 0.85 | 0.84 | 1.17 | 1.11 | 0.88 | 0.90 | 0.85 | 0.90 | 0.85 | 0.86 |
| ma101107_rel.cz11a_bee | 0.88 | 0.84 | 1.16 | 1.10 | 0.86 | 0.91 | 0.84 | 0.90 | 0.84 | 0.88 |
| ma101107_rel.cz11b_bee | 0.87 | 0.84 | 1.08 | 1.08 | 0.89 | 0.87 | 0.87 | 0.90 | 0.85 | 0.87 |
| ma101107_rel.cz11d_bee | 0.88 | 0.84 | 1.17 | 1.11 | 0.88 | 0.91 | 0.86 | 0.90 | 0.85 | 0.88 |
| ma110401_rel.cz11b_bee | 0.86 | 0.82 | 1.08 | 1.07 | 0.89 | 0.91 | 0.86 | 0.91 | 0.85 | 0.88 |
This lists the average rate of inserts/s for the tests that do inserts concurrent with queries. For such tests the query rate is listed in the table above. The read+write tests are setup so that the insert rate should match the target rate every second. Cells that are not at least 95% of the target have a red background to indicate a failure to satisfy the target.
| dbms | qr100.L1 | qp100.L2 | qr500.L3 | qp500.L4 | qr1000.L5 | qp1000.L6 |
|---|---|---|---|---|---|---|
| ma100244_rel.cz11a_bee | 100 | 100 | 499 | 499 | 998 | 998 |
| ma100339_rel.cz11a_bee | 100 | 100 | 499 | 499 | 998 | 998 |
| ma100433_rel.cz11a_bee | 100 | 100 | 499 | 499 | 998 | 998 |
| ma100524_rel.cz11a_bee | 100 | 100 | 499 | 499 | 998 | 998 |
| ma100617_rel.cz11a_bee | 100 | 100 | 499 | 499 | 998 | 998 |
| ma101107_rel.cz11a_bee | 100 | 100 | 499 | 499 | 998 | 998 |
| ma101107_rel.cz11b_bee | 100 | 100 | 499 | 499 | 998 | 998 |
| ma101107_rel.cz11d_bee | 100 | 100 | 499 | 499 | 998 | 998 |
| ma110401_rel.cz11b_bee | 100 | 100 | 499 | 499 | 998 | 998 |
| target | 100 | 100 | 500 | 500 | 1000 | 1000 |
l.i0
l.i0: load without secondary indexes. Graphs for performance per 1-second interval are here.
Average throughput:
Insert response time histogram: each cell has the percentage of responses that take <= the time in the header and max is the max response time in seconds. For the max column values in the top 25% of the range have a red background and in the bottom 25% of the range have a green background. The red background is not used when the min value is within 80% of the max value.
| dbms | 256us | 1ms | 4ms | 16ms | 64ms | 256ms | 1s | 4s | 16s | gt | max |
|---|---|---|---|---|---|---|---|---|---|---|---|
| ma100244_rel.cz11a_bee | 86.770 | 12.870 | 0.345 | 0.011 | 0.004 | 0.150 | |||||
| ma100339_rel.cz11a_bee | 7.202 | 92.253 | 0.500 | 0.041 | 0.004 | 0.151 | |||||
| ma100433_rel.cz11a_bee | 2.219 | 97.372 | 0.370 | 0.035 | 0.004 | 0.153 | |||||
| ma100524_rel.cz11a_bee | 3.727 | 95.537 | 0.577 | 0.156 | 0.004 | 0.140 | |||||
| ma100617_rel.cz11a_bee | 1.759 | 97.919 | 0.193 | 0.123 | 0.005 | 0.179 | |||||
| ma101107_rel.cz11a_bee | 10.964 | 88.724 | 0.197 | 0.111 | 0.005 | 0.182 | |||||
| ma101107_rel.cz11b_bee | 9.943 | 89.744 | 0.197 | 0.111 | 0.005 | 0.229 | |||||
| ma101107_rel.cz11d_bee | 10.120 | 89.568 | 0.184 | 0.122 | 0.005 | 0.190 | |||||
| ma110401_rel.cz11b_bee | 2.688 | 96.998 | 0.187 | 0.122 | 0.005 | 0.206 |
Performance metrics for the DBMS listed above. Some are normalized by throughput, others are not. Legend for results is here.
ips	qps	rps	rmbps	wps	wmbps	rpq	rkbpq	wpi	wkbpi	csps	cpups	cspq	cpupq	dbgb1	dbgb2	rss	maxop	p50	p99	tag
95541	0	0	0.0	453.9	33.7	0.000	0.000	0.005	0.361	10657	22.8	0.112	19	2.0	17.8	2.4	0.150	96391	77714	ma100244_rel.cz11a_bee
83565	0	0	0.0	538.7	35.5	0.000	0.000	0.006	0.435	27921	34.4	0.334	33	2.0	17.8	2.5	0.151	83909	69523	ma100339_rel.cz11a_bee
83102	0	0	0.0	459.9	32.9	0.000	0.000	0.006	0.405	27677	33.9	0.333	33	2.0	17.8	NA	0.153	83807	69221	ma100433_rel.cz11a_bee
76726	0	0	0.0	691.7	28.8	0.000	0.000	0.009	0.385	37639	27.1	0.491	28	2.0	17.8	2.4	0.140	77051	63457	ma100524_rel.cz11a_bee
81081	0	0	0.0	244.1	20.1	0.000	0.000	0.003	0.254	11013	25.3	0.136	25	2.0	17.8	2.3	0.179	81945	68623	ma100617_rel.cz11a_bee
83799	0	0	0.0	266.2	21.6	0.000	0.000	0.003	0.264	11299	25.8	0.135	25	2.0	17.8	2.4	0.182	84803	71353	ma101107_rel.cz11a_bee
83565	0	0	0.0	262.2	21.5	0.000	0.000	0.003	0.264	11334	25.9	0.136	25	2.0	17.8	2.4	0.229	84504	70719	ma101107_rel.cz11b_bee
83799	0	0	0.0	265.5	21.6	0.000	0.000	0.003	0.263	11312	25.8	0.135	25	2.0	17.8	2.4	0.190	84506	70520	ma101107_rel.cz11d_bee
82192	0	0	0.0	252.5	21.1	0.000	0.000	0.003	0.262	11329	25.9	0.138	25	2.0	17.8	2.3	0.206	82810	69657	ma110401_rel.cz11b_bee
l.x
l.x: create secondary indexes.
Average throughput:
Performance metrics for the DBMS listed above. Some are normalized by throughput, others are not. Legend for results is here.
ips	qps	rps	rmbps	wps	wmbps	rpq	rkbpq	wpi	wkbpi	csps	cpups	cspq	cpupq	dbgb1	dbgb2	rss	maxop	p50	p99	tag
155441	0	0	0.0	795.1	138.0	0.000	0.000	0.005	0.909	7023	12.4	0.045	6	4.6	20.4	4.1	0.002	NA	NA	ma100244_rel.cz11a_bee
150000	0	0	0.0	761.3	131.8	0.000	0.000	0.005	0.900	6987	12.5	0.047	7	4.6	20.4	4.0	0.002	NA	NA	ma100339_rel.cz11a_bee
152285	0	0	0.0	779.4	134.6	0.000	0.000	0.005	0.905	6906	12.4	0.045	7	4.5	20.3	NA	0.001	NA	NA	ma100433_rel.cz11a_bee
132744	0	0	0.0	226.6	103.9	0.000	0.000	0.002	0.801	597	11.8	0.004	7	4.5	20.3	3.9	0.002	NA	NA	ma100524_rel.cz11a_bee
131005	0	0	0.0	843.7	113.0	0.000	0.000	0.006	0.883	3060	12.0	0.023	7	4.5	20.3	3.8	0.002	NA	NA	ma100617_rel.cz11a_bee
130435	0	0	0.0	823.0	111.7	0.000	0.000	0.006	0.877	3016	12.1	0.023	7	4.5	20.3	3.8	0.002	NA	NA	ma101107_rel.cz11a_bee
130435	0	0	0.0	817.1	111.0	0.000	0.000	0.006	0.872	3151	12.1	0.024	7	4.5	20.3	3.8	0.002	NA	NA	ma101107_rel.cz11b_bee
130435	0	0	0.0	814.4	110.7	0.000	0.000	0.006	0.869	3054	12.1	0.023	7	4.5	20.3	3.8	0.002	NA	NA	ma101107_rel.cz11d_bee
128206	0	0	0.0	807.7	109.8	0.000	0.000	0.006	0.877	2916	12.1	0.023	8	4.5	20.3	3.8	0.002	NA	NA	ma110401_rel.cz11b_bee
l.i1
l.i1: continue load after secondary indexes created with 50 inserts per transaction. Graphs for performance per 1-second interval are here.
Average throughput:
Insert response time histogram: each cell has the percentage of responses that take <= the time in the header and max is the max response time in seconds. For the max column values in the top 25% of the range have a red background and in the bottom 25% of the range have a green background. The red background is not used when the min value is within 80% of the max value.
| dbms | 256us | 1ms | 4ms | 16ms | 64ms | 256ms | 1s | 4s | 16s | gt | max |
|---|---|---|---|---|---|---|---|---|---|---|---|
| ma100244_rel.cz11a_bee | 89.039 | 10.852 | 0.108 | 0.001 | 0.069 | ||||||
| ma100339_rel.cz11a_bee | 88.676 | 11.202 | 0.121 | 0.001 | 0.069 | ||||||
| ma100433_rel.cz11a_bee | 89.775 | 10.104 | 0.120 | 0.001 | 0.122 | ||||||
| ma100524_rel.cz11a_bee | 96.792 | 3.098 | 0.097 | 0.001 | 0.012 | 0.399 | |||||
| ma100617_rel.cz11a_bee | 95.970 | 3.930 | 0.100 | 0.001 | 0.111 | ||||||
| ma101107_rel.cz11a_bee | 95.914 | 4.010 | 0.075 | nonzero | nonzero | 0.263 | |||||
| ma101107_rel.cz11b_bee | 94.287 | 5.220 | 0.489 | 0.004 | 0.235 | ||||||
| ma101107_rel.cz11d_bee | 95.916 | 4.012 | 0.071 | nonzero | 0.117 | ||||||
| ma110401_rel.cz11b_bee | 94.301 | 5.211 | 0.485 | 0.004 | 0.189 |
Delete response time histogram: each cell has the percentage of responses that take <= the time in the header and max is the max response time in seconds. For the max column values in the top 25% of the range have a red background and in the bottom 25% of the range have a green background. The red background is not used when the min value is within 80% of the max value.
| dbms | 256us | 1ms | 4ms | 16ms | 64ms | 256ms | 1s | 4s | 16s | gt | max |
|---|---|---|---|---|---|---|---|---|---|---|---|
| ma100244_rel.cz11a_bee | 91.345 | 8.604 | 0.050 | 0.001 | 0.068 | ||||||
| ma100339_rel.cz11a_bee | 91.777 | 8.178 | 0.044 | 0.001 | 0.069 | ||||||
| ma100433_rel.cz11a_bee | 92.937 | 7.026 | 0.036 | 0.001 | 0.074 | ||||||
| ma100524_rel.cz11a_bee | 98.049 | 1.884 | 0.055 | 0.001 | 0.012 | 0.398 | |||||
| ma100617_rel.cz11a_bee | 97.234 | 2.699 | 0.067 | nonzero | 0.074 | ||||||
| ma101107_rel.cz11a_bee | 97.312 | 2.649 | 0.039 | nonzero | 0.255 | ||||||
| ma101107_rel.cz11b_bee | 96.131 | 3.470 | 0.396 | 0.003 | 0.234 | ||||||
| ma101107_rel.cz11d_bee | 97.301 | 2.656 | 0.043 | 0.063 | |||||||
| ma110401_rel.cz11b_bee | 96.023 | 3.587 | 0.388 | 0.003 | 0.188 |
Performance metrics for the DBMS listed above. Some are normalized by throughput, others are not. Legend for results is here.
ips	qps	rps	rmbps	wps	wmbps	rpq	rkbpq	wpi	wkbpi	csps	cpups	cspq	cpupq	dbgb1	dbgb2	rss	maxop	p50	p99	tag
16454	0	0	0.0	7184.5	239.8	0.000	0.000	0.437	14.922	36861	53.3	2.240	259	6.1	22.0	6.7	0.069	16639	6693	ma100244_rel.cz11a_bee
16320	0	0	0.0	7115.8	237.9	0.000	0.000	0.436	14.926	42613	51.4	2.611	252	6.1	22.0	6.7	0.069	16782	5244	ma100339_rel.cz11a_bee
16522	0	0	0.0	6187.7	210.2	0.000	0.000	0.375	13.029	39510	51.5	2.391	249	6.1	22.0	NA	0.122	17231	4845	ma100433_rel.cz11a_bee
21345	0	0	0.0	9246.8	294.5	0.000	0.000	0.433	14.129	55601	40.1	2.605	150	6.6	23.6	7.5	0.399	22425	200	ma100524_rel.cz11a_bee
19286	0	0	0.0	2781.1	102.3	0.000	0.000	0.144	5.431	50183	35.3	2.602	146	6.2	22.0	6.1	0.111	20527	5194	ma100617_rel.cz11a_bee
19066	0	754	2.9	2800.7	102.6	0.040	0.158	0.147	5.511	50067	34.8	2.626	146	6.2	22.0	6.1	0.263	20328	5294	ma101107_rel.cz11a_bee
17730	0	698	2.7	2643.1	95.4	0.039	0.158	0.149	5.509	46805	32.9	2.640	148	6.2	22.0	6.1	0.235	18430	5294	ma101107_rel.cz11b_bee
19175	0	756	3.0	2809.4	103.0	0.039	0.158	0.147	5.502	50335	34.9	2.625	146	6.2	22.0	6.1	0.117	20427	5294	ma101107_rel.cz11d_bee
17770	0	685	2.7	2634.6	95.1	0.039	0.154	0.148	5.483	46630	32.8	2.624	148	6.2	22.0	6.1	0.189	18380	5194	ma110401_rel.cz11b_bee
l.i2
l.i2: continue load after secondary indexes created with 5 inserts per transaction. Graphs for performance per 1-second interval are here.
Average throughput:
Insert response time histogram: each cell has the percentage of responses that take <= the time in the header and max is the max response time in seconds. For the max column values in the top 25% of the range have a red background and in the bottom 25% of the range have a green background. The red background is not used when the min value is within 80% of the max value.
| dbms | 256us | 1ms | 4ms | 16ms | 64ms | 256ms | 1s | 4s | 16s | gt | max |
|---|---|---|---|---|---|---|---|---|---|---|---|
| ma100244_rel.cz11a_bee | 1.814 | 96.575 | 0.417 | 1.191 | 0.003 | 0.046 | |||||
| ma100339_rel.cz11a_bee | 0.745 | 97.757 | 0.372 | 1.123 | 0.003 | 0.048 | |||||
| ma100433_rel.cz11a_bee | 0.175 | 98.321 | 0.371 | 1.130 | 0.003 | 0.046 | |||||
| ma100524_rel.cz11a_bee | 0.955 | 98.487 | 0.432 | 0.124 | 0.002 | 0.064 | |||||
| ma100617_rel.cz11a_bee | 0.316 | 99.556 | 0.104 | 0.022 | nonzero | nonzero | 0.071 | ||||
| ma101107_rel.cz11a_bee | 0.384 | 99.465 | 0.131 | 0.021 | nonzero | nonzero | 0.065 | ||||
| ma101107_rel.cz11b_bee | 0.518 | 99.260 | 0.117 | 0.102 | 0.002 | 0.063 | |||||
| ma101107_rel.cz11d_bee | 0.428 | 99.415 | 0.135 | 0.021 | 0.001 | 0.063 | |||||
| ma110401_rel.cz11b_bee | 0.358 | 99.424 | 0.111 | 0.104 | 0.003 | nonzero | 0.064 |
Delete response time histogram: each cell has the percentage of responses that take <= the time in the header and max is the max response time in seconds. For the max column values in the top 25% of the range have a red background and in the bottom 25% of the range have a green background. The red background is not used when the min value is within 80% of the max value.
| dbms | 256us | 1ms | 4ms | 16ms | 64ms | 256ms | 1s | 4s | 16s | gt | max |
|---|---|---|---|---|---|---|---|---|---|---|---|
| ma100244_rel.cz11a_bee | 3.577 | 94.789 | 0.447 | 1.185 | 0.002 | 0.046 | |||||
| ma100339_rel.cz11a_bee | 3.985 | 94.502 | 0.394 | 1.117 | 0.002 | 0.048 | |||||
| ma100433_rel.cz11a_bee | 2.983 | 95.468 | 0.424 | 1.123 | 0.002 | 0.046 | |||||
| ma100524_rel.cz11a_bee | 1.820 | 97.601 | 0.457 | 0.119 | 0.002 | 0.064 | |||||
| ma100617_rel.cz11a_bee | 2.485 | 97.387 | 0.107 | 0.020 | nonzero | nonzero | 0.071 | ||||
| ma101107_rel.cz11a_bee | 3.060 | 96.786 | 0.134 | 0.020 | nonzero | nonzero | 0.065 | ||||
| ma101107_rel.cz11b_bee | 2.748 | 97.043 | 0.113 | 0.094 | 0.002 | 0.063 | |||||
| ma101107_rel.cz11d_bee | 2.951 | 96.891 | 0.137 | 0.021 | 0.001 | 0.063 | |||||
| ma110401_rel.cz11b_bee | 1.129 | 98.652 | 0.117 | 0.098 | 0.003 | nonzero | 0.064 |
Performance metrics for the DBMS listed above. Some are normalized by throughput, others are not. Legend for results is here.
ips	qps	rps	rmbps	wps	wmbps	rpq	rkbpq	wpi	wkbpi	csps	cpups	cspq	cpupq	dbgb1	dbgb2	rss	maxop	p50	p99	tag
10111	0	0	0.0	8116.7	257.1	0.000	0.000	0.803	26.036	106666	46.6	10.549	369	6.1	22.0	6.7	0.046	10024	8531	ma100244_rel.cz11a_bee
10194	0	0	0.0	7912.9	251.5	0.000	0.000	0.776	25.264	122626	46.6	12.030	366	6.1	22.0	6.7	0.048	10143	8581	ma100339_rel.cz11a_bee
10040	0	0	0.0	7876.3	249.8	0.000	0.000	0.784	25.472	121492	46.5	12.101	371	6.1	22.0	NA	0.046	10014	8629	ma100433_rel.cz11a_bee
11947	0	0	0.0	10172.5	314.0	0.000	0.000	0.851	26.913	177415	44.6	14.850	299	6.6	23.6	7.4	0.064	11951	10923	ma100524_rel.cz11a_bee
11186	0	0	0.0	1288.7	49.2	0.000	0.000	0.115	4.507	58682	36.0	5.246	257	6.2	22.0	6.1	0.071	11262	9649	ma100617_rel.cz11a_bee
11136	0	1774	6.9	1327.5	50.6	0.159	0.637	0.119	4.652	62221	35.3	5.587	254	6.2	22.0	6.1	0.065	11163	9794	ma101107_rel.cz11a_bee
10941	0	1744	6.8	1335.0	50.0	0.159	0.638	0.122	4.677	61253	35.0	5.599	256	6.2	22.0	6.1	0.063	11043	9394	ma101107_rel.cz11b_bee
11198	0	1786	7.0	1355.9	51.5	0.159	0.638	0.121	4.712	62617	35.4	5.592	253	6.2	22.0	6.1	0.063	11223	10149	ma101107_rel.cz11d_bee
10799	0	1719	6.7	1320.2	49.4	0.159	0.637	0.122	4.680	60542	34.8	5.606	258	6.2	22.0	6.1	0.064	10913	9004	ma110401_rel.cz11b_bee
qr100.L1
qr100.L1: range queries with 100 insert/s per client. Graphs for performance per 1-second interval are here.
Average throughput:
Query response time histogram: each cell has the percentage of responses that take <= the time in the header and max is the max response time in seconds. For max values in the top 25% of the range have a red background and in the bottom 25% of the range have a green background. The red background is not used when the min value is within 80% of the max value.
| dbms | 256us | 1ms | 4ms | 16ms | 64ms | 256ms | 1s | 4s | 16s | gt | max |
|---|---|---|---|---|---|---|---|---|---|---|---|
| ma100244_rel.cz11a_bee | 74.389 | 25.606 | 0.004 | nonzero | nonzero | 0.018 | |||||
| ma100339_rel.cz11a_bee | 70.506 | 29.490 | 0.003 | 0.001 | nonzero | 0.017 | |||||
| ma100433_rel.cz11a_bee | 62.255 | 37.741 | 0.003 | nonzero | nonzero | 0.021 | |||||
| ma100524_rel.cz11a_bee | 56.972 | 43.028 | 0.001 | 0.003 | |||||||
| ma100617_rel.cz11a_bee | 56.594 | 43.406 | 0.001 | nonzero | 0.011 | ||||||
| ma101107_rel.cz11a_bee | 54.960 | 45.040 | nonzero | nonzero | 0.005 | ||||||
| ma101107_rel.cz11b_bee | 59.643 | 40.356 | 0.001 | nonzero | 0.012 | ||||||
| ma101107_rel.cz11d_bee | 57.715 | 42.284 | nonzero | 0.004 | |||||||
| ma110401_rel.cz11b_bee | 60.353 | 39.646 | nonzero | nonzero | 0.004 |
Insert response time histogram: each cell has the percentage of responses that take <= the time in the header and max is the max response time in seconds. For max values in the top 25% of the range have a red background and in the bottom 25% of the range have a green background. The red background is not used when the min value is within 80% of the max value.
| dbms | 256us | 1ms | 4ms | 16ms | 64ms | 256ms | 1s | 4s | 16s | gt | max |
|---|---|---|---|---|---|---|---|---|---|---|---|
| ma100244_rel.cz11a_bee | 95.056 | 3.750 | 1.194 | 0.040 | |||||||
| ma100339_rel.cz11a_bee | 95.472 | 3.333 | 1.194 | 0.036 | |||||||
| ma100433_rel.cz11a_bee | 95.250 | 3.167 | 1.583 | 0.038 | |||||||
| ma100524_rel.cz11a_bee | 97.167 | 2.833 | 0.005 | ||||||||
| ma100617_rel.cz11a_bee | 99.889 | 0.056 | 0.056 | 0.021 | |||||||
| ma101107_rel.cz11a_bee | 53.306 | 46.667 | 0.028 | 0.024 | |||||||
| ma101107_rel.cz11b_bee | 53.194 | 46.778 | 0.028 | 0.044 | |||||||
| ma101107_rel.cz11d_bee | 53.278 | 46.694 | 0.028 | 0.026 | |||||||
| ma110401_rel.cz11b_bee | 53.250 | 46.722 | 0.028 | 0.020 |
Delete response time histogram: each cell has the percentage of responses that take <= the time in the header and max is the max response time in seconds. For max values in the top 25% of the range have a red background and in the bottom 25% of the range have a green background. The red background is not used when the min value is within 80% of the max value.
| dbms | 256us | 1ms | 4ms | 16ms | 64ms | 256ms | 1s | 4s | 16s | gt | max |
|---|---|---|---|---|---|---|---|---|---|---|---|
| ma100244_rel.cz11a_bee | 95.861 | 3.278 | 0.861 | 0.040 | |||||||
| ma100339_rel.cz11a_bee | 96.278 | 2.750 | 0.972 | 0.030 | |||||||
| ma100433_rel.cz11a_bee | 96.167 | 2.944 | 0.889 | 0.038 | |||||||
| ma100524_rel.cz11a_bee | 99.944 | 0.056 | 0.006 | ||||||||
| ma100617_rel.cz11a_bee | 99.972 | 0.028 | 0.017 | ||||||||
| ma101107_rel.cz11a_bee | 53.361 | 46.639 | 0.012 | ||||||||
| ma101107_rel.cz11b_bee | 53.222 | 46.750 | 0.028 | 0.017 | |||||||
| ma101107_rel.cz11d_bee | 53.278 | 46.722 | 0.012 | ||||||||
| ma110401_rel.cz11b_bee | 53.306 | 46.694 | 0.012 |
Performance metrics for the DBMS listed above. Some are normalized by throughput, others are not. Legend for results is here.
ips	qps	rps	rmbps	wps	wmbps	rpq	rkbpq	wpi	wkbpi	csps	cpups	cspq	cpupq	dbgb1	dbgb2	rss	maxop	p50	p99	tag
100	4128	0	0.0	787.4	23.7	0.000	0.000	7.889	243.326	19411	13.6	4.703	264	6.1	22.0	6.7	0.018	4059	3868	ma100244_rel.cz11a_bee
100	3970	0	0.0	789.6	23.8	0.000	0.000	7.912	244.035	18832	13.6	4.744	274	6.1	22.0	6.7	0.017	3915	3724	ma100339_rel.cz11a_bee
100	3713	0	0.0	786.2	23.7	0.000	0.000	7.878	243.009	17838	13.7	4.805	295	6.1	22.0	NA	0.021	3660	3500	ma100433_rel.cz11a_bee
100	3607	0	0.0	2.3	0.1	0.000	0.000	0.023	1.171	15190	12.9	4.211	286	6.6	23.6	7.4	0.003	3580	3404	ma100524_rel.cz11a_bee
100	3613	0	0.0	8.0	0.3	0.000	0.000	0.080	2.944	14030	12.9	3.883	286	6.2	22.0	6.1	0.011	3580	3420	ma100617_rel.cz11a_bee
100	3565	3	0.0	8.0	0.3	0.001	0.004	0.080	2.955	13852	12.8	3.886	287	6.2	22.0	6.1	0.005	3532	3388	ma101107_rel.cz11a_bee
100	3670	3	0.0	8.1	0.3	0.001	0.003	0.082	2.954	14267	12.8	3.888	279	6.2	22.0	6.1	0.012	3627	3452	ma101107_rel.cz11b_bee
100	3614	3	0.0	8.0	0.3	0.001	0.004	0.080	2.954	14052	12.9	3.888	286	6.2	22.0	6.1	0.004	3595	3436	ma101107_rel.cz11d_bee
100	3667	3	0.0	8.2	0.3	0.001	0.003	0.082	2.944	14247	13.0	3.885	284	6.2	22.0	6.1	0.004	3644	3484	ma110401_rel.cz11b_bee
qp100.L2
qp100.L2: point queries with 100 insert/s per client. Graphs for performance per 1-second interval are here.
Average throughput:
Query response time histogram: each cell has the percentage of responses that take <= the time in the header and max is the max response time in seconds. For max values in the top 25% of the range have a red background and in the bottom 25% of the range have a green background. The red background is not used when the min value is within 80% of the max value.
| dbms | 256us | 1ms | 4ms | 16ms | 64ms | 256ms | 1s | 4s | 16s | gt | max |
|---|---|---|---|---|---|---|---|---|---|---|---|
| ma100244_rel.cz11a_bee | 90.240 | 9.758 | 0.001 | nonzero | nonzero | 0.016 | |||||
| ma100339_rel.cz11a_bee | 87.820 | 12.178 | 0.002 | nonzero | nonzero | 0.016 | |||||
| ma100433_rel.cz11a_bee | 76.429 | 23.569 | 0.002 | nonzero | nonzero | 0.023 | |||||
| ma100524_rel.cz11a_bee | 78.944 | 21.055 | 0.001 | 0.003 | |||||||
| ma100617_rel.cz11a_bee | 72.091 | 27.907 | 0.002 | nonzero | 0.006 | ||||||
| ma101107_rel.cz11a_bee | 74.190 | 25.809 | 0.002 | nonzero | 0.005 | ||||||
| ma101107_rel.cz11b_bee | 64.672 | 35.326 | 0.002 | nonzero | 0.005 | ||||||
| ma101107_rel.cz11d_bee | 65.846 | 34.152 | 0.001 | nonzero | 0.005 | ||||||
| ma110401_rel.cz11b_bee | 77.686 | 22.312 | 0.002 | nonzero | 0.007 |
Insert response time histogram: each cell has the percentage of responses that take <= the time in the header and max is the max response time in seconds. For max values in the top 25% of the range have a red background and in the bottom 25% of the range have a green background. The red background is not used when the min value is within 80% of the max value.
| dbms | 256us | 1ms | 4ms | 16ms | 64ms | 256ms | 1s | 4s | 16s | gt | max |
|---|---|---|---|---|---|---|---|---|---|---|---|
| ma100244_rel.cz11a_bee | 95.361 | 3.361 | 1.278 | 0.040 | |||||||
| ma100339_rel.cz11a_bee | 95.472 | 3.250 | 1.278 | 0.035 | |||||||
| ma100433_rel.cz11a_bee | 95.222 | 3.583 | 1.194 | 0.048 | |||||||
| ma100524_rel.cz11a_bee | 98.194 | 1.806 | 0.006 | ||||||||
| ma100617_rel.cz11a_bee | 99.972 | 0.028 | 0.009 | ||||||||
| ma101107_rel.cz11a_bee | 53.194 | 46.806 | 0.012 | ||||||||
| ma101107_rel.cz11b_bee | 53.000 | 47.000 | 0.012 | ||||||||
| ma101107_rel.cz11d_bee | 52.944 | 47.056 | 0.012 | ||||||||
| ma110401_rel.cz11b_bee | 53.306 | 46.694 | 0.012 |
Delete response time histogram: each cell has the percentage of responses that take <= the time in the header and max is the max response time in seconds. For max values in the top 25% of the range have a red background and in the bottom 25% of the range have a green background. The red background is not used when the min value is within 80% of the max value.
| dbms | 256us | 1ms | 4ms | 16ms | 64ms | 256ms | 1s | 4s | 16s | gt | max |
|---|---|---|---|---|---|---|---|---|---|---|---|
| ma100244_rel.cz11a_bee | 96.361 | 3.111 | 0.528 | 0.023 | |||||||
| ma100339_rel.cz11a_bee | 96.111 | 2.889 | 1.000 | 0.034 | |||||||
| ma100433_rel.cz11a_bee | 96.361 | 2.750 | 0.889 | 0.043 | |||||||
| ma100524_rel.cz11a_bee | 100.000 | 0.004 | |||||||||
| ma100617_rel.cz11a_bee | 100.000 | 0.004 | |||||||||
| ma101107_rel.cz11a_bee | 53.333 | 46.667 | 0.012 | ||||||||
| ma101107_rel.cz11b_bee | 53.083 | 46.917 | 0.012 | ||||||||
| ma101107_rel.cz11d_bee | 53.000 | 47.000 | 0.012 | ||||||||
| ma110401_rel.cz11b_bee | 53.333 | 46.667 | 0.012 |
Performance metrics for the DBMS listed above. Some are normalized by throughput, others are not. Legend for results is here.
ips	qps	rps	rmbps	wps	wmbps	rpq	rkbpq	wpi	wkbpi	csps	cpups	cspq	cpupq	dbgb1	dbgb2	rss	maxop	p50	p99	tag
100	4106	0	0.0	780.3	23.5	0.000	0.000	7.819	241.154	20115	15.0	4.899	292	6.1	22.0	6.7	0.016	3916	3564	ma100244_rel.cz11a_bee
100	3970	0	0.0	784.0	23.6	0.000	0.000	7.864	242.567	19623	14.4	4.943	290	6.1	22.0	6.7	0.016	3804	3468	ma100339_rel.cz11a_bee
100	3764	0	0.0	784.4	23.6	0.000	0.000	7.859	242.401	18800	14.3	4.995	304	6.1	22.0	NA	0.023	3596	3276	ma100433_rel.cz11a_bee
100	3801	0	0.0	2.2	0.1	0.000	0.000	0.022	1.156	16700	14.6	4.394	307	6.6	23.6	7.4	0.003	3595	3310	ma100524_rel.cz11a_bee
100	3698	0	0.0	19.5	0.6	0.000	0.000	0.196	6.476	15492	14.9	4.189	322	6.2	22.0	6.1	0.006	3532	3340	ma100617_rel.cz11a_bee
100	3729	3	0.0	19.6	0.6	0.001	0.003	0.196	6.478	15342	14.1	4.114	302	6.2	22.0	6.1	0.005	3548	3324	ma101107_rel.cz11a_bee
100	3588	3	0.0	19.9	0.6	0.001	0.004	0.200	6.476	14763	14.3	4.115	319	6.2	22.0	6.1	0.005	3484	3308	ma101107_rel.cz11b_bee
100	3720	3	0.0	13.8	0.5	0.001	0.003	0.138	4.716	15277	14.1	4.107	303	6.2	22.0	6.1	0.005	3532	3324	ma101107_rel.cz11d_bee
100	3728	3	0.0	14.0	0.5	0.001	0.003	0.140	4.715	15297	14.3	4.103	307	6.2	22.0	6.1	0.007	3580	3355	ma110401_rel.cz11b_bee
qr500.L3
qr500.L3: range queries with 500 insert/s per client. Graphs for performance per 1-second interval are here.
Average throughput:
Query response time histogram: each cell has the percentage of responses that take <= the time in the header and max is the max response time in seconds. For max values in the top 25% of the range have a red background and in the bottom 25% of the range have a green background. The red background is not used when the min value is within 80% of the max value.
| dbms | 256us | 1ms | 4ms | 16ms | 64ms | 256ms | 1s | 4s | 16s | gt | max |
|---|---|---|---|---|---|---|---|---|---|---|---|
| ma100244_rel.cz11a_bee | 75.986 | 23.986 | 0.024 | 0.004 | nonzero | 0.023 | |||||
| ma100339_rel.cz11a_bee | 73.619 | 26.355 | 0.020 | 0.005 | nonzero | 0.027 | |||||
| ma100433_rel.cz11a_bee | 64.700 | 35.273 | 0.022 | 0.004 | 0.001 | 0.030 | |||||
| ma100524_rel.cz11a_bee | 58.624 | 41.373 | 0.003 | nonzero | 0.006 | ||||||
| ma100617_rel.cz11a_bee | 54.795 | 45.204 | 0.001 | nonzero | 0.004 | ||||||
| ma101107_rel.cz11a_bee | 51.804 | 48.195 | 0.001 | nonzero | 0.004 | ||||||
| ma101107_rel.cz11b_bee | 57.650 | 42.348 | 0.001 | nonzero | 0.012 | ||||||
| ma101107_rel.cz11d_bee | 55.796 | 44.203 | 0.001 | nonzero | 0.006 | ||||||
| ma110401_rel.cz11b_bee | 56.843 | 43.156 | 0.001 | 0.003 |
Insert response time histogram: each cell has the percentage of responses that take <= the time in the header and max is the max response time in seconds. For max values in the top 25% of the range have a red background and in the bottom 25% of the range have a green background. The red background is not used when the min value is within 80% of the max value.
| dbms | 256us | 1ms | 4ms | 16ms | 64ms | 256ms | 1s | 4s | 16s | gt | max |
|---|---|---|---|---|---|---|---|---|---|---|---|
| ma100244_rel.cz11a_bee | 87.822 | 9.150 | 3.028 | 0.047 | |||||||
| ma100339_rel.cz11a_bee | 87.322 | 9.467 | 3.211 | 0.047 | |||||||
| ma100433_rel.cz11a_bee | 87.678 | 9.194 | 3.128 | 0.046 | |||||||
| ma100524_rel.cz11a_bee | 99.283 | 0.717 | 0.007 | ||||||||
| ma100617_rel.cz11a_bee | 99.789 | 0.211 | 0.005 | ||||||||
| ma101107_rel.cz11a_bee | 90.061 | 9.939 | 0.012 | ||||||||
| ma101107_rel.cz11b_bee | 90.128 | 9.872 | 0.012 | ||||||||
| ma101107_rel.cz11d_bee | 90.106 | 9.894 | 0.012 | ||||||||
| ma110401_rel.cz11b_bee | 90.122 | 9.878 | 0.012 |
Delete response time histogram: each cell has the percentage of responses that take <= the time in the header and max is the max response time in seconds. For max values in the top 25% of the range have a red background and in the bottom 25% of the range have a green background. The red background is not used when the min value is within 80% of the max value.
| dbms | 256us | 1ms | 4ms | 16ms | 64ms | 256ms | 1s | 4s | 16s | gt | max |
|---|---|---|---|---|---|---|---|---|---|---|---|
| ma100244_rel.cz11a_bee | 88.750 | 8.628 | 2.622 | 0.038 | |||||||
| ma100339_rel.cz11a_bee | 88.483 | 8.828 | 2.689 | 0.050 | |||||||
| ma100433_rel.cz11a_bee | 88.783 | 8.706 | 2.511 | 0.045 | |||||||
| ma100524_rel.cz11a_bee | 99.778 | 0.222 | 0.006 | ||||||||
| ma100617_rel.cz11a_bee | 99.950 | 0.050 | 0.006 | ||||||||
| ma101107_rel.cz11a_bee | 90.511 | 9.489 | 0.012 | ||||||||
| ma101107_rel.cz11b_bee | 90.550 | 9.450 | 0.012 | ||||||||
| ma101107_rel.cz11d_bee | 90.539 | 9.461 | 0.012 | ||||||||
| ma110401_rel.cz11b_bee | 90.583 | 9.417 | 0.014 |
Performance metrics for the DBMS listed above. Some are normalized by throughput, others are not. Legend for results is here.
ips	qps	rps	rmbps	wps	wmbps	rpq	rkbpq	wpi	wkbpi	csps	cpups	cspq	cpupq	dbgb1	dbgb2	rss	maxop	p50	p99	tag
499	4184	0	0.0	3273.9	99.3	0.000	0.000	6.560	203.724	27004	15.7	6.454	300	6.1	22.0	6.7	0.023	4108	3836	ma100244_rel.cz11a_bee
499	4062	0	0.0	3305.0	100.2	0.000	0.000	6.622	205.651	26913	15.8	6.626	311	6.1	22.0	6.7	0.027	3995	3692	ma100339_rel.cz11a_bee
499	3757	0	0.0	3292.3	99.9	0.000	0.000	6.596	204.868	25610	15.7	6.816	334	6.1	22.0	NA	0.030	3724	3452	ma100433_rel.cz11a_bee
499	3650	0	0.0	2.5	0.5	0.000	0.000	0.005	1.117	15490	14.0	4.243	307	6.6	23.6	7.4	0.006	3612	3435	ma100524_rel.cz11a_bee
499	3573	0	0.0	8.3	0.7	0.000	0.000	0.017	1.462	14062	13.8	3.936	309	6.2	22.0	6.1	0.004	3548	3388	ma100617_rel.cz11a_bee
499	3516	17	0.1	2.6	0.6	0.005	0.020	0.005	1.143	13857	13.7	3.941	312	6.2	22.0	6.1	0.004	3500	3372	ma101107_rel.cz11a_bee
499	3621	17	0.1	7.4	0.7	0.005	0.019	0.015	1.433	14282	13.8	3.944	305	6.2	22.0	6.1	0.012	3595	3452	ma101107_rel.cz11b_bee
499	3580	17	0.1	2.6	0.6	0.005	0.019	0.005	1.142	14098	14.0	3.938	313	6.2	22.0	6.1	0.006	3548	3404	ma101107_rel.cz11d_bee
499	3593	17	0.1	3.1	0.6	0.005	0.019	0.006	1.165	14154	13.6	3.939	303	6.2	22.0	6.1	0.003	3580	3452	ma110401_rel.cz11b_bee
qp500.L4
qp500.L4: point queries with 500 insert/s per client. Graphs for performance per 1-second interval are here.
Average throughput:
Query response time histogram: each cell has the percentage of responses that take <= the time in the header and max is the max response time in seconds. For max values in the top 25% of the range have a red background and in the bottom 25% of the range have a green background. The red background is not used when the min value is within 80% of the max value.
| dbms | 256us | 1ms | 4ms | 16ms | 64ms | 256ms | 1s | 4s | 16s | gt | max |
|---|---|---|---|---|---|---|---|---|---|---|---|
| ma100244_rel.cz11a_bee | 90.867 | 9.126 | 0.007 | nonzero | nonzero | 0.017 | |||||
| ma100339_rel.cz11a_bee | 88.085 | 11.907 | 0.007 | 0.001 | nonzero | 0.024 | |||||
| ma100433_rel.cz11a_bee | 77.171 | 22.820 | 0.008 | 0.001 | nonzero | 0.024 | |||||
| ma100524_rel.cz11a_bee | 85.410 | 14.588 | 0.002 | nonzero | 0.005 | ||||||
| ma100617_rel.cz11a_bee | 79.221 | 20.778 | 0.001 | nonzero | 0.013 | ||||||
| ma101107_rel.cz11a_bee | 79.062 | 20.937 | 0.002 | nonzero | 0.005 | ||||||
| ma101107_rel.cz11b_bee | 75.394 | 24.604 | 0.002 | nonzero | 0.009 | ||||||
| ma101107_rel.cz11d_bee | 75.600 | 24.397 | 0.003 | nonzero | 0.009 | ||||||
| ma110401_rel.cz11b_bee | 81.114 | 18.884 | 0.002 | nonzero | 0.005 |
Insert response time histogram: each cell has the percentage of responses that take <= the time in the header and max is the max response time in seconds. For max values in the top 25% of the range have a red background and in the bottom 25% of the range have a green background. The red background is not used when the min value is within 80% of the max value.
| dbms | 256us | 1ms | 4ms | 16ms | 64ms | 256ms | 1s | 4s | 16s | gt | max |
|---|---|---|---|---|---|---|---|---|---|---|---|
| ma100244_rel.cz11a_bee | 88.078 | 8.806 | 3.117 | 0.049 | |||||||
| ma100339_rel.cz11a_bee | 87.361 | 9.344 | 3.294 | 0.055 | |||||||
| ma100433_rel.cz11a_bee | 87.483 | 9.322 | 3.194 | 0.045 | |||||||
| ma100524_rel.cz11a_bee | 99.278 | 0.722 | 0.007 | ||||||||
| ma100617_rel.cz11a_bee | 99.606 | 0.389 | 0.006 | 0.016 | |||||||
| ma101107_rel.cz11a_bee | 90.061 | 9.939 | 0.013 | ||||||||
| ma101107_rel.cz11b_bee | 90.100 | 9.894 | 0.006 | 0.022 | |||||||
| ma101107_rel.cz11d_bee | 90.000 | 10.000 | 0.013 | ||||||||
| ma110401_rel.cz11b_bee | 89.967 | 10.033 | 0.014 |
Delete response time histogram: each cell has the percentage of responses that take <= the time in the header and max is the max response time in seconds. For max values in the top 25% of the range have a red background and in the bottom 25% of the range have a green background. The red background is not used when the min value is within 80% of the max value.
| dbms | 256us | 1ms | 4ms | 16ms | 64ms | 256ms | 1s | 4s | 16s | gt | max |
|---|---|---|---|---|---|---|---|---|---|---|---|
| ma100244_rel.cz11a_bee | 88.900 | 8.533 | 2.567 | 0.040 | |||||||
| ma100339_rel.cz11a_bee | 88.417 | 9.044 | 2.539 | 0.052 | |||||||
| ma100433_rel.cz11a_bee | 88.806 | 8.622 | 2.572 | 0.044 | |||||||
| ma100524_rel.cz11a_bee | 99.867 | 0.133 | 0.005 | ||||||||
| ma100617_rel.cz11a_bee | 99.883 | 0.111 | 0.006 | 0.017 | |||||||
| ma101107_rel.cz11a_bee | 90.472 | 9.528 | 0.012 | ||||||||
| ma101107_rel.cz11b_bee | 90.517 | 9.483 | 0.013 | ||||||||
| ma101107_rel.cz11d_bee | 90.417 | 9.583 | 0.014 | ||||||||
| ma110401_rel.cz11b_bee | 90.439 | 9.556 | 0.006 | 0.021 |
Performance metrics for the DBMS listed above. Some are normalized by throughput, others are not. Legend for results is here.
ips	qps	rps	rmbps	wps	wmbps	rpq	rkbpq	wpi	wkbpi	csps	cpups	cspq	cpupq	dbgb1	dbgb2	rss	maxop	p50	p99	tag
499	4231	0	0.0	3273.3	99.3	0.000	0.000	6.558	203.682	28113	17.1	6.644	323	6.1	22.0	6.7	0.017	4091	3629	ma100244_rel.cz11a_bee
499	4055	0	0.0	3301.2	100.1	0.000	0.000	6.614	205.423	27711	16.9	6.834	333	6.1	22.0	6.7	0.024	3915	3484	ma100339_rel.cz11a_bee
499	3805	0	0.0	3288.8	99.7	0.000	0.000	6.593	204.772	26618	16.7	6.996	351	6.1	22.0	NA	0.024	3692	3324	ma100433_rel.cz11a_bee
499	4015	0	0.0	2.5	0.5	0.000	0.000	0.005	1.115	17740	15.7	4.418	313	6.6	23.6	7.4	0.005	3852	3372	ma100524_rel.cz11a_bee
499	3813	0	0.0	78.4	2.7	0.000	0.000	0.157	5.534	16247	15.8	4.261	331	6.2	22.0	6.1	0.013	3612	3342	ma100617_rel.cz11a_bee
499	3818	18	0.1	78.6	2.7	0.005	0.018	0.157	5.556	16307	15.6	4.271	327	6.2	22.0	6.1	0.005	3612	3343	ma101107_rel.cz11a_bee
499	3791	18	0.1	79.9	2.7	0.005	0.019	0.160	5.549	16196	15.4	4.272	325	6.2	22.0	6.1	0.009	3580	3340	ma101107_rel.cz11b_bee
499	3802	18	0.1	78.8	2.7	0.005	0.018	0.158	5.559	16242	15.5	4.271	326	6.2	22.0	6.1	0.009	3580	3308	ma101107_rel.cz11d_bee
499	3835	17	0.1	80.7	2.7	0.005	0.018	0.162	5.595	16376	15.6	4.270	325	6.2	22.0	6.1	0.005	3627	3356	ma110401_rel.cz11b_bee
qr1000.L5
qr1000.L5: range queries with 1000 insert/s per client. Graphs for performance per 1-second interval are here.
Average throughput:
Query response time histogram: each cell has the percentage of responses that take <= the time in the header and max is the max response time in seconds. For max values in the top 25% of the range have a red background and in the bottom 25% of the range have a green background. The red background is not used when the min value is within 80% of the max value.
| dbms | 256us | 1ms | 4ms | 16ms | 64ms | 256ms | 1s | 4s | 16s | gt | max |
|---|---|---|---|---|---|---|---|---|---|---|---|
| ma100244_rel.cz11a_bee | 77.923 | 21.953 | 0.115 | 0.009 | nonzero | 0.022 | |||||
| ma100339_rel.cz11a_bee | 76.608 | 23.296 | 0.087 | 0.009 | 0.001 | 0.030 | |||||
| ma100433_rel.cz11a_bee | 67.370 | 32.519 | 0.099 | 0.011 | 0.001 | 0.025 | |||||
| ma100524_rel.cz11a_bee | 56.755 | 43.238 | 0.006 | nonzero | 0.006 | ||||||
| ma100617_rel.cz11a_bee | 55.617 | 44.380 | 0.003 | 0.001 | nonzero | 0.017 | |||||
| ma101107_rel.cz11a_bee | 55.299 | 44.696 | 0.005 | 0.001 | 0.007 | ||||||
| ma101107_rel.cz11b_bee | 56.042 | 43.953 | 0.003 | 0.002 | 0.013 | ||||||
| ma101107_rel.cz11d_bee | 56.328 | 43.668 | 0.003 | 0.001 | 0.011 | ||||||
| ma110401_rel.cz11b_bee | 58.142 | 41.854 | 0.003 | 0.001 | 0.014 |
Insert response time histogram: each cell has the percentage of responses that take <= the time in the header and max is the max response time in seconds. For max values in the top 25% of the range have a red background and in the bottom 25% of the range have a green background. The red background is not used when the min value is within 80% of the max value.
| dbms | 256us | 1ms | 4ms | 16ms | 64ms | 256ms | 1s | 4s | 16s | gt | max |
|---|---|---|---|---|---|---|---|---|---|---|---|
| ma100244_rel.cz11a_bee | 81.486 | 15.817 | 2.697 | 0.050 | |||||||
| ma100339_rel.cz11a_bee | 81.142 | 15.631 | 3.228 | 0.048 | |||||||
| ma100433_rel.cz11a_bee | 80.289 | 16.486 | 3.225 | 0.044 | |||||||
| ma100524_rel.cz11a_bee | 99.428 | 0.569 | 0.003 | 0.028 | |||||||
| ma100617_rel.cz11a_bee | 99.767 | 0.222 | 0.011 | 0.037 | |||||||
| ma101107_rel.cz11a_bee | 94.975 | 5.022 | 0.003 | 0.029 | |||||||
| ma101107_rel.cz11b_bee | 95.025 | 4.967 | 0.008 | 0.039 | |||||||
| ma101107_rel.cz11d_bee | 95.019 | 4.978 | 0.003 | 0.028 | |||||||
| ma110401_rel.cz11b_bee | 95.061 | 4.928 | 0.011 | 0.032 |
Delete response time histogram: each cell has the percentage of responses that take <= the time in the header and max is the max response time in seconds. For max values in the top 25% of the range have a red background and in the bottom 25% of the range have a green background. The red background is not used when the min value is within 80% of the max value.
| dbms | 256us | 1ms | 4ms | 16ms | 64ms | 256ms | 1s | 4s | 16s | gt | max |
|---|---|---|---|---|---|---|---|---|---|---|---|
| ma100244_rel.cz11a_bee | 83.603 | 14.111 | 2.286 | 0.044 | |||||||
| ma100339_rel.cz11a_bee | 83.592 | 13.936 | 2.472 | 0.039 | |||||||
| ma100433_rel.cz11a_bee | 83.203 | 14.142 | 2.656 | 0.040 | |||||||
| ma100524_rel.cz11a_bee | 99.869 | 0.128 | 0.003 | 0.029 | |||||||
| ma100617_rel.cz11a_bee | 99.842 | 0.150 | 0.008 | 0.037 | |||||||
| ma101107_rel.cz11a_bee | 95.136 | 4.861 | 0.003 | 0.028 | |||||||
| ma101107_rel.cz11b_bee | 95.167 | 4.828 | 0.006 | 0.028 | |||||||
| ma101107_rel.cz11d_bee | 95.119 | 4.878 | 0.003 | 0.028 | |||||||
| ma110401_rel.cz11b_bee | 95.183 | 4.806 | 0.011 | 0.030 |
Performance metrics for the DBMS listed above. Some are normalized by throughput, others are not. Legend for results is here.
ips	qps	rps	rmbps	wps	wmbps	rpq	rkbpq	wpi	wkbpi	csps	cpups	cspq	cpupq	dbgb1	dbgb2	rss	maxop	p50	p99	tag
998	4232	0	0.0	5877.1	178.4	0.000	0.000	5.887	183.031	36215	18.3	8.557	346	6.1	22.0	6.7	0.022	4173	3756	ma100244_rel.cz11a_bee
998	4182	0	0.0	5907.4	179.4	0.000	0.000	5.917	183.977	37354	18.3	8.931	350	6.1	22.0	6.7	0.030	4123	3644	ma100339_rel.cz11a_bee
998	3814	0	0.0	5912.1	179.5	0.000	0.000	5.922	184.111	35759	18.3	9.374	384	6.1	22.0	NA	0.025	3788	3420	ma100433_rel.cz11a_bee
998	3619	0	0.0	3.7	1.1	0.000	0.000	0.004	1.105	15667	14.9	4.329	329	6.6	23.6	7.4	0.006	3596	3372	ma100524_rel.cz11a_bee
998	3580	0	0.0	87.2	3.4	0.000	0.000	0.087	3.517	14802	14.9	4.135	333	6.2	22.0	6.1	0.017	3548	3388	ma100617_rel.cz11a_bee
998	3574	35	0.1	89.1	3.5	0.010	0.039	0.089	3.581	14887	14.9	4.165	334	6.2	22.0	6.1	0.007	3548	3404	ma101107_rel.cz11a_bee
998	3578	35	0.1	90.6	3.5	0.010	0.039	0.091	3.584	14895	14.8	4.163	331	6.2	22.0	6.1	0.013	3563	3404	ma101107_rel.cz11b_bee
998	3597	35	0.1	87.7	3.5	0.010	0.039	0.088	3.552	14953	15.0	4.157	334	6.2	22.0	6.1	0.011	3564	3420	ma101107_rel.cz11d_bee
998	3618	35	0.1	94.7	3.6	0.010	0.039	0.095	3.713	15105	14.9	4.175	329	6.2	22.0	6.1	0.014	3580	3420	ma110401_rel.cz11b_bee
qp1000.L6
qp1000.L6: point queries with 1000 insert/s per client. Graphs for performance per 1-second interval are here.
Average throughput:
Query response time histogram: each cell has the percentage of responses that take <= the time in the header and max is the max response time in seconds. For max values in the top 25% of the range have a red background and in the bottom 25% of the range have a green background. The red background is not used when the min value is within 80% of the max value.
| dbms | 256us | 1ms | 4ms | 16ms | 64ms | 256ms | 1s | 4s | 16s | gt | max |
|---|---|---|---|---|---|---|---|---|---|---|---|
| ma100244_rel.cz11a_bee | 91.365 | 8.610 | 0.024 | nonzero | nonzero | 0.023 | |||||
| ma100339_rel.cz11a_bee | 87.966 | 12.005 | 0.028 | 0.002 | nonzero | 0.022 | |||||
| ma100433_rel.cz11a_bee | 80.806 | 19.163 | 0.029 | 0.002 | nonzero | 0.021 | |||||
| ma100524_rel.cz11a_bee | 86.799 | 13.198 | 0.004 | nonzero | 0.004 | ||||||
| ma100617_rel.cz11a_bee | 75.857 | 24.141 | 0.002 | nonzero | 0.005 | ||||||
| ma101107_rel.cz11a_bee | 79.122 | 20.876 | 0.002 | nonzero | 0.004 | ||||||
| ma101107_rel.cz11b_bee | 74.856 | 25.141 | 0.003 | nonzero | 0.011 | ||||||
| ma101107_rel.cz11d_bee | 75.270 | 24.727 | 0.002 | nonzero | 0.005 | ||||||
| ma110401_rel.cz11b_bee | 80.549 | 19.448 | 0.003 | nonzero | 0.006 |
Insert response time histogram: each cell has the percentage of responses that take <= the time in the header and max is the max response time in seconds. For max values in the top 25% of the range have a red background and in the bottom 25% of the range have a green background. The red background is not used when the min value is within 80% of the max value.
| dbms | 256us | 1ms | 4ms | 16ms | 64ms | 256ms | 1s | 4s | 16s | gt | max |
|---|---|---|---|---|---|---|---|---|---|---|---|
| ma100244_rel.cz11a_bee | 82.531 | 14.889 | 2.581 | 0.048 | |||||||
| ma100339_rel.cz11a_bee | 81.450 | 15.597 | 2.953 | 0.047 | |||||||
| ma100433_rel.cz11a_bee | 81.250 | 15.883 | 2.867 | 0.049 | |||||||
| ma100524_rel.cz11a_bee | 99.492 | 0.506 | 0.003 | 0.038 | |||||||
| ma100617_rel.cz11a_bee | 99.761 | 0.231 | 0.008 | 0.038 | |||||||
| ma101107_rel.cz11a_bee | 95.039 | 4.956 | 0.006 | 0.028 | |||||||
| ma101107_rel.cz11b_bee | 95.011 | 4.983 | 0.006 | 0.039 | |||||||
| ma101107_rel.cz11d_bee | 95.058 | 4.939 | 0.003 | 0.037 | |||||||
| ma110401_rel.cz11b_bee | 95.008 | 4.983 | 0.008 | 0.042 |
Delete response time histogram: each cell has the percentage of responses that take <= the time in the header and max is the max response time in seconds. For max values in the top 25% of the range have a red background and in the bottom 25% of the range have a green background. The red background is not used when the min value is within 80% of the max value.
| dbms | 256us | 1ms | 4ms | 16ms | 64ms | 256ms | 1s | 4s | 16s | gt | max |
|---|---|---|---|---|---|---|---|---|---|---|---|
| ma100244_rel.cz11a_bee | 84.200 | 13.642 | 2.158 | 0.039 | |||||||
| ma100339_rel.cz11a_bee | 83.733 | 13.992 | 2.275 | 0.041 | |||||||
| ma100433_rel.cz11a_bee | 83.639 | 14.183 | 2.178 | 0.035 | |||||||
| ma100524_rel.cz11a_bee | 99.933 | 0.064 | 0.003 | 0.039 | |||||||
| ma100617_rel.cz11a_bee | 99.867 | 0.131 | 0.003 | 0.036 | |||||||
| ma101107_rel.cz11a_bee | 95.194 | 4.806 | 0.012 | ||||||||
| ma101107_rel.cz11b_bee | 95.136 | 4.861 | 0.003 | 0.028 | |||||||
| ma101107_rel.cz11d_bee | 95.169 | 4.828 | 0.003 | 0.026 | |||||||
| ma110401_rel.cz11b_bee | 95.169 | 4.822 | 0.008 | 0.042 |
Performance metrics for the DBMS listed above. Some are normalized by throughput, others are not. Legend for results is here.
ips	qps	rps	rmbps	wps	wmbps	rpq	rkbpq	wpi	wkbpi	csps	cpups	cspq	cpupq	dbgb1	dbgb2	rss	maxop	p50	p99	tag
998	4350	0	0.0	5861.5	178.0	0.000	0.000	5.872	182.549	37712	19.5	8.670	359	6.1	22.0	6.7	0.023	4253	3724	ma100244_rel.cz11a_bee
998	4093	0	0.0	5910.5	179.5	0.000	0.000	5.921	184.080	37871	19.2	9.253	375	6.1	22.0	6.7	0.022	4011	3564	ma100339_rel.cz11a_bee
998	3920	0	0.0	5904.8	179.3	0.000	0.000	5.915	183.894	37029	19.2	9.445	392	6.1	22.0	NA	0.021	3852	3388	ma100433_rel.cz11a_bee
998	4107	0	0.0	3.7	1.1	0.000	0.000	0.004	1.103	18583	16.6	4.525	323	6.6	23.6	7.4	0.004	4030	3388	ma100524_rel.cz11a_bee
998	3727	0	0.0	88.4	3.4	0.000	0.000	0.089	3.538	16349	16.8	4.386	361	6.2	22.0	6.1	0.005	3564	3324	ma100617_rel.cz11a_bee
998	3824	35	0.1	88.6	3.5	0.009	0.036	0.089	3.566	16846	16.3	4.405	341	6.2	22.0	6.1	0.004	3627	3324	ma101107_rel.cz11a_bee
998	3768	35	0.1	90.0	3.5	0.009	0.037	0.090	3.566	16600	16.5	4.406	350	6.2	22.0	6.1	0.011	3580	3308	ma101107_rel.cz11b_bee
998	3807	35	0.1	89.0	3.5	0.009	0.036	0.089	3.573	16754	16.3	4.401	343	6.2	22.0	6.1	0.005	3596	3308	ma101107_rel.cz11d_bee
998	3836	35	0.1	92.1	3.5	0.009	0.036	0.092	3.629	16918	16.4	4.411	342	6.2	22.0	6.1	0.006	3628	3356	ma110401_rel.cz11b_bee
l.i0
l.i0: load without secondary indexes
Performance metrics for all DBMS, not just the ones listed above. Some are normalized by throughput, others are not. Legend for results is here.
ips	qps	rps	rmbps	wps	wmbps	rpq	rkbpq	wpi	wkbpi	csps	cpups	cspq	cpupq	dbgb1	dbgb2	rss	maxop	p50	p99	tag
95541	0	0	0.0	453.9	33.7	0.000	0.000	0.005	0.361	10657	22.8	0.112	19	2.0	17.8	2.4	0.150	96391	77714	ma100244_rel.cz11a_bee
83565	0	0	0.0	538.7	35.5	0.000	0.000	0.006	0.435	27921	34.4	0.334	33	2.0	17.8	2.5	0.151	83909	69523	ma100339_rel.cz11a_bee
83102	0	0	0.0	459.9	32.9	0.000	0.000	0.006	0.405	27677	33.9	0.333	33	2.0	17.8	NA	0.153	83807	69221	ma100433_rel.cz11a_bee
76726	0	0	0.0	691.7	28.8	0.000	0.000	0.009	0.385	37639	27.1	0.491	28	2.0	17.8	2.4	0.140	77051	63457	ma100524_rel.cz11a_bee
81081	0	0	0.0	244.1	20.1	0.000	0.000	0.003	0.254	11013	25.3	0.136	25	2.0	17.8	2.3	0.179	81945	68623	ma100617_rel.cz11a_bee
83799	0	0	0.0	266.2	21.6	0.000	0.000	0.003	0.264	11299	25.8	0.135	25	2.0	17.8	2.4	0.182	84803	71353	ma101107_rel.cz11a_bee
83565	0	0	0.0	262.2	21.5	0.000	0.000	0.003	0.264	11334	25.9	0.136	25	2.0	17.8	2.4	0.229	84504	70719	ma101107_rel.cz11b_bee
83799	0	0	0.0	265.5	21.6	0.000	0.000	0.003	0.263	11312	25.8	0.135	25	2.0	17.8	2.4	0.190	84506	70520	ma101107_rel.cz11d_bee
82192	0	0	0.0	252.5	21.1	0.000	0.000	0.003	0.262	11329	25.9	0.138	25	2.0	17.8	2.3	0.206	82810	69657	ma110401_rel.cz11b_bee
l.x
l.x: create secondary indexes
Performance metrics for all DBMS, not just the ones listed above. Some are normalized by throughput, others are not. Legend for results is here.
ips	qps	rps	rmbps	wps	wmbps	rpq	rkbpq	wpi	wkbpi	csps	cpups	cspq	cpupq	dbgb1	dbgb2	rss	maxop	p50	p99	tag
155441	0	0	0.0	795.1	138.0	0.000	0.000	0.005	0.909	7023	12.4	0.045	6	4.6	20.4	4.1	0.002	NA	NA	ma100244_rel.cz11a_bee
150000	0	0	0.0	761.3	131.8	0.000	0.000	0.005	0.900	6987	12.5	0.047	7	4.6	20.4	4.0	0.002	NA	NA	ma100339_rel.cz11a_bee
152285	0	0	0.0	779.4	134.6	0.000	0.000	0.005	0.905	6906	12.4	0.045	7	4.5	20.3	NA	0.001	NA	NA	ma100433_rel.cz11a_bee
132744	0	0	0.0	226.6	103.9	0.000	0.000	0.002	0.801	597	11.8	0.004	7	4.5	20.3	3.9	0.002	NA	NA	ma100524_rel.cz11a_bee
131005	0	0	0.0	843.7	113.0	0.000	0.000	0.006	0.883	3060	12.0	0.023	7	4.5	20.3	3.8	0.002	NA	NA	ma100617_rel.cz11a_bee
130435	0	0	0.0	823.0	111.7	0.000	0.000	0.006	0.877	3016	12.1	0.023	7	4.5	20.3	3.8	0.002	NA	NA	ma101107_rel.cz11a_bee
130435	0	0	0.0	817.1	111.0	0.000	0.000	0.006	0.872	3151	12.1	0.024	7	4.5	20.3	3.8	0.002	NA	NA	ma101107_rel.cz11b_bee
130435	0	0	0.0	814.4	110.7	0.000	0.000	0.006	0.869	3054	12.1	0.023	7	4.5	20.3	3.8	0.002	NA	NA	ma101107_rel.cz11d_bee
128206	0	0	0.0	807.7	109.8	0.000	0.000	0.006	0.877	2916	12.1	0.023	8	4.5	20.3	3.8	0.002	NA	NA	ma110401_rel.cz11b_bee
l.i1
l.i1: continue load after secondary indexes created with 50 inserts per transaction
Performance metrics for all DBMS, not just the ones listed above. Some are normalized by throughput, others are not. Legend for results is here.
ips	qps	rps	rmbps	wps	wmbps	rpq	rkbpq	wpi	wkbpi	csps	cpups	cspq	cpupq	dbgb1	dbgb2	rss	maxop	p50	p99	tag
16454	0	0	0.0	7184.5	239.8	0.000	0.000	0.437	14.922	36861	53.3	2.240	259	6.1	22.0	6.7	0.069	16639	6693	ma100244_rel.cz11a_bee
16320	0	0	0.0	7115.8	237.9	0.000	0.000	0.436	14.926	42613	51.4	2.611	252	6.1	22.0	6.7	0.069	16782	5244	ma100339_rel.cz11a_bee
16522	0	0	0.0	6187.7	210.2	0.000	0.000	0.375	13.029	39510	51.5	2.391	249	6.1	22.0	NA	0.122	17231	4845	ma100433_rel.cz11a_bee
21345	0	0	0.0	9246.8	294.5	0.000	0.000	0.433	14.129	55601	40.1	2.605	150	6.6	23.6	7.5	0.399	22425	200	ma100524_rel.cz11a_bee
19286	0	0	0.0	2781.1	102.3	0.000	0.000	0.144	5.431	50183	35.3	2.602	146	6.2	22.0	6.1	0.111	20527	5194	ma100617_rel.cz11a_bee
19066	0	754	2.9	2800.7	102.6	0.040	0.158	0.147	5.511	50067	34.8	2.626	146	6.2	22.0	6.1	0.263	20328	5294	ma101107_rel.cz11a_bee
17730	0	698	2.7	2643.1	95.4	0.039	0.158	0.149	5.509	46805	32.9	2.640	148	6.2	22.0	6.1	0.235	18430	5294	ma101107_rel.cz11b_bee
19175	0	756	3.0	2809.4	103.0	0.039	0.158	0.147	5.502	50335	34.9	2.625	146	6.2	22.0	6.1	0.117	20427	5294	ma101107_rel.cz11d_bee
17770	0	685	2.7	2634.6	95.1	0.039	0.154	0.148	5.483	46630	32.8	2.624	148	6.2	22.0	6.1	0.189	18380	5194	ma110401_rel.cz11b_bee
l.i2
l.i2: continue load after secondary indexes created with 5 inserts per transaction
Performance metrics for all DBMS, not just the ones listed above. Some are normalized by throughput, others are not. Legend for results is here.
ips	qps	rps	rmbps	wps	wmbps	rpq	rkbpq	wpi	wkbpi	csps	cpups	cspq	cpupq	dbgb1	dbgb2	rss	maxop	p50	p99	tag
10111	0	0	0.0	8116.7	257.1	0.000	0.000	0.803	26.036	106666	46.6	10.549	369	6.1	22.0	6.7	0.046	10024	8531	ma100244_rel.cz11a_bee
10194	0	0	0.0	7912.9	251.5	0.000	0.000	0.776	25.264	122626	46.6	12.030	366	6.1	22.0	6.7	0.048	10143	8581	ma100339_rel.cz11a_bee
10040	0	0	0.0	7876.3	249.8	0.000	0.000	0.784	25.472	121492	46.5	12.101	371	6.1	22.0	NA	0.046	10014	8629	ma100433_rel.cz11a_bee
11947	0	0	0.0	10172.5	314.0	0.000	0.000	0.851	26.913	177415	44.6	14.850	299	6.6	23.6	7.4	0.064	11951	10923	ma100524_rel.cz11a_bee
11186	0	0	0.0	1288.7	49.2	0.000	0.000	0.115	4.507	58682	36.0	5.246	257	6.2	22.0	6.1	0.071	11262	9649	ma100617_rel.cz11a_bee
11136	0	1774	6.9	1327.5	50.6	0.159	0.637	0.119	4.652	62221	35.3	5.587	254	6.2	22.0	6.1	0.065	11163	9794	ma101107_rel.cz11a_bee
10941	0	1744	6.8	1335.0	50.0	0.159	0.638	0.122	4.677	61253	35.0	5.599	256	6.2	22.0	6.1	0.063	11043	9394	ma101107_rel.cz11b_bee
11198	0	1786	7.0	1355.9	51.5	0.159	0.638	0.121	4.712	62617	35.4	5.592	253	6.2	22.0	6.1	0.063	11223	10149	ma101107_rel.cz11d_bee
10799	0	1719	6.7	1320.2	49.4	0.159	0.637	0.122	4.680	60542	34.8	5.606	258	6.2	22.0	6.1	0.064	10913	9004	ma110401_rel.cz11b_bee
qr100.L1
qr100.L1: range queries with 100 insert/s per client
Performance metrics for all DBMS, not just the ones listed above. Some are normalized by throughput, others are not. Legend for results is here.
ips	qps	rps	rmbps	wps	wmbps	rpq	rkbpq	wpi	wkbpi	csps	cpups	cspq	cpupq	dbgb1	dbgb2	rss	maxop	p50	p99	tag
100	4128	0	0.0	787.4	23.7	0.000	0.000	7.889	243.326	19411	13.6	4.703	264	6.1	22.0	6.7	0.018	4059	3868	ma100244_rel.cz11a_bee
100	3970	0	0.0	789.6	23.8	0.000	0.000	7.912	244.035	18832	13.6	4.744	274	6.1	22.0	6.7	0.017	3915	3724	ma100339_rel.cz11a_bee
100	3713	0	0.0	786.2	23.7	0.000	0.000	7.878	243.009	17838	13.7	4.805	295	6.1	22.0	NA	0.021	3660	3500	ma100433_rel.cz11a_bee
100	3607	0	0.0	2.3	0.1	0.000	0.000	0.023	1.171	15190	12.9	4.211	286	6.6	23.6	7.4	0.003	3580	3404	ma100524_rel.cz11a_bee
100	3613	0	0.0	8.0	0.3	0.000	0.000	0.080	2.944	14030	12.9	3.883	286	6.2	22.0	6.1	0.011	3580	3420	ma100617_rel.cz11a_bee
100	3565	3	0.0	8.0	0.3	0.001	0.004	0.080	2.955	13852	12.8	3.886	287	6.2	22.0	6.1	0.005	3532	3388	ma101107_rel.cz11a_bee
100	3670	3	0.0	8.1	0.3	0.001	0.003	0.082	2.954	14267	12.8	3.888	279	6.2	22.0	6.1	0.012	3627	3452	ma101107_rel.cz11b_bee
100	3614	3	0.0	8.0	0.3	0.001	0.004	0.080	2.954	14052	12.9	3.888	286	6.2	22.0	6.1	0.004	3595	3436	ma101107_rel.cz11d_bee
100	3667	3	0.0	8.2	0.3	0.001	0.003	0.082	2.944	14247	13.0	3.885	284	6.2	22.0	6.1	0.004	3644	3484	ma110401_rel.cz11b_bee
qp100.L2
qp100.L2: point queries with 100 insert/s per client
Performance metrics for all DBMS, not just the ones listed above. Some are normalized by throughput, others are not. Legend for results is here.
ips	qps	rps	rmbps	wps	wmbps	rpq	rkbpq	wpi	wkbpi	csps	cpups	cspq	cpupq	dbgb1	dbgb2	rss	maxop	p50	p99	tag
100	4106	0	0.0	780.3	23.5	0.000	0.000	7.819	241.154	20115	15.0	4.899	292	6.1	22.0	6.7	0.016	3916	3564	ma100244_rel.cz11a_bee
100	3970	0	0.0	784.0	23.6	0.000	0.000	7.864	242.567	19623	14.4	4.943	290	6.1	22.0	6.7	0.016	3804	3468	ma100339_rel.cz11a_bee
100	3764	0	0.0	784.4	23.6	0.000	0.000	7.859	242.401	18800	14.3	4.995	304	6.1	22.0	NA	0.023	3596	3276	ma100433_rel.cz11a_bee
100	3801	0	0.0	2.2	0.1	0.000	0.000	0.022	1.156	16700	14.6	4.394	307	6.6	23.6	7.4	0.003	3595	3310	ma100524_rel.cz11a_bee
100	3698	0	0.0	19.5	0.6	0.000	0.000	0.196	6.476	15492	14.9	4.189	322	6.2	22.0	6.1	0.006	3532	3340	ma100617_rel.cz11a_bee
100	3729	3	0.0	19.6	0.6	0.001	0.003	0.196	6.478	15342	14.1	4.114	302	6.2	22.0	6.1	0.005	3548	3324	ma101107_rel.cz11a_bee
100	3588	3	0.0	19.9	0.6	0.001	0.004	0.200	6.476	14763	14.3	4.115	319	6.2	22.0	6.1	0.005	3484	3308	ma101107_rel.cz11b_bee
100	3720	3	0.0	13.8	0.5	0.001	0.003	0.138	4.716	15277	14.1	4.107	303	6.2	22.0	6.1	0.005	3532	3324	ma101107_rel.cz11d_bee
100	3728	3	0.0	14.0	0.5	0.001	0.003	0.140	4.715	15297	14.3	4.103	307	6.2	22.0	6.1	0.007	3580	3355	ma110401_rel.cz11b_bee
qr500.L3
qr500.L3: range queries with 500 insert/s per client
Performance metrics for all DBMS, not just the ones listed above. Some are normalized by throughput, others are not. Legend for results is here.
ips	qps	rps	rmbps	wps	wmbps	rpq	rkbpq	wpi	wkbpi	csps	cpups	cspq	cpupq	dbgb1	dbgb2	rss	maxop	p50	p99	tag
499	4184	0	0.0	3273.9	99.3	0.000	0.000	6.560	203.724	27004	15.7	6.454	300	6.1	22.0	6.7	0.023	4108	3836	ma100244_rel.cz11a_bee
499	4062	0	0.0	3305.0	100.2	0.000	0.000	6.622	205.651	26913	15.8	6.626	311	6.1	22.0	6.7	0.027	3995	3692	ma100339_rel.cz11a_bee
499	3757	0	0.0	3292.3	99.9	0.000	0.000	6.596	204.868	25610	15.7	6.816	334	6.1	22.0	NA	0.030	3724	3452	ma100433_rel.cz11a_bee
499	3650	0	0.0	2.5	0.5	0.000	0.000	0.005	1.117	15490	14.0	4.243	307	6.6	23.6	7.4	0.006	3612	3435	ma100524_rel.cz11a_bee
499	3573	0	0.0	8.3	0.7	0.000	0.000	0.017	1.462	14062	13.8	3.936	309	6.2	22.0	6.1	0.004	3548	3388	ma100617_rel.cz11a_bee
499	3516	17	0.1	2.6	0.6	0.005	0.020	0.005	1.143	13857	13.7	3.941	312	6.2	22.0	6.1	0.004	3500	3372	ma101107_rel.cz11a_bee
499	3621	17	0.1	7.4	0.7	0.005	0.019	0.015	1.433	14282	13.8	3.944	305	6.2	22.0	6.1	0.012	3595	3452	ma101107_rel.cz11b_bee
499	3580	17	0.1	2.6	0.6	0.005	0.019	0.005	1.142	14098	14.0	3.938	313	6.2	22.0	6.1	0.006	3548	3404	ma101107_rel.cz11d_bee
499	3593	17	0.1	3.1	0.6	0.005	0.019	0.006	1.165	14154	13.6	3.939	303	6.2	22.0	6.1	0.003	3580	3452	ma110401_rel.cz11b_bee
qp500.L4
qp500.L4: point queries with 500 insert/s per client
Performance metrics for all DBMS, not just the ones listed above. Some are normalized by throughput, others are not. Legend for results is here.
ips	qps	rps	rmbps	wps	wmbps	rpq	rkbpq	wpi	wkbpi	csps	cpups	cspq	cpupq	dbgb1	dbgb2	rss	maxop	p50	p99	tag
499	4231	0	0.0	3273.3	99.3	0.000	0.000	6.558	203.682	28113	17.1	6.644	323	6.1	22.0	6.7	0.017	4091	3629	ma100244_rel.cz11a_bee
499	4055	0	0.0	3301.2	100.1	0.000	0.000	6.614	205.423	27711	16.9	6.834	333	6.1	22.0	6.7	0.024	3915	3484	ma100339_rel.cz11a_bee
499	3805	0	0.0	3288.8	99.7	0.000	0.000	6.593	204.772	26618	16.7	6.996	351	6.1	22.0	NA	0.024	3692	3324	ma100433_rel.cz11a_bee
499	4015	0	0.0	2.5	0.5	0.000	0.000	0.005	1.115	17740	15.7	4.418	313	6.6	23.6	7.4	0.005	3852	3372	ma100524_rel.cz11a_bee
499	3813	0	0.0	78.4	2.7	0.000	0.000	0.157	5.534	16247	15.8	4.261	331	6.2	22.0	6.1	0.013	3612	3342	ma100617_rel.cz11a_bee
499	3818	18	0.1	78.6	2.7	0.005	0.018	0.157	5.556	16307	15.6	4.271	327	6.2	22.0	6.1	0.005	3612	3343	ma101107_rel.cz11a_bee
499	3791	18	0.1	79.9	2.7	0.005	0.019	0.160	5.549	16196	15.4	4.272	325	6.2	22.0	6.1	0.009	3580	3340	ma101107_rel.cz11b_bee
499	3802	18	0.1	78.8	2.7	0.005	0.018	0.158	5.559	16242	15.5	4.271	326	6.2	22.0	6.1	0.009	3580	3308	ma101107_rel.cz11d_bee
499	3835	17	0.1	80.7	2.7	0.005	0.018	0.162	5.595	16376	15.6	4.270	325	6.2	22.0	6.1	0.005	3627	3356	ma110401_rel.cz11b_bee
qr1000.L5
qr1000.L5: range queries with 1000 insert/s per client
Performance metrics for all DBMS, not just the ones listed above. Some are normalized by throughput, others are not. Legend for results is here.
ips	qps	rps	rmbps	wps	wmbps	rpq	rkbpq	wpi	wkbpi	csps	cpups	cspq	cpupq	dbgb1	dbgb2	rss	maxop	p50	p99	tag
998	4232	0	0.0	5877.1	178.4	0.000	0.000	5.887	183.031	36215	18.3	8.557	346	6.1	22.0	6.7	0.022	4173	3756	ma100244_rel.cz11a_bee
998	4182	0	0.0	5907.4	179.4	0.000	0.000	5.917	183.977	37354	18.3	8.931	350	6.1	22.0	6.7	0.030	4123	3644	ma100339_rel.cz11a_bee
998	3814	0	0.0	5912.1	179.5	0.000	0.000	5.922	184.111	35759	18.3	9.374	384	6.1	22.0	NA	0.025	3788	3420	ma100433_rel.cz11a_bee
998	3619	0	0.0	3.7	1.1	0.000	0.000	0.004	1.105	15667	14.9	4.329	329	6.6	23.6	7.4	0.006	3596	3372	ma100524_rel.cz11a_bee
998	3580	0	0.0	87.2	3.4	0.000	0.000	0.087	3.517	14802	14.9	4.135	333	6.2	22.0	6.1	0.017	3548	3388	ma100617_rel.cz11a_bee
998	3574	35	0.1	89.1	3.5	0.010	0.039	0.089	3.581	14887	14.9	4.165	334	6.2	22.0	6.1	0.007	3548	3404	ma101107_rel.cz11a_bee
998	3578	35	0.1	90.6	3.5	0.010	0.039	0.091	3.584	14895	14.8	4.163	331	6.2	22.0	6.1	0.013	3563	3404	ma101107_rel.cz11b_bee
998	3597	35	0.1	87.7	3.5	0.010	0.039	0.088	3.552	14953	15.0	4.157	334	6.2	22.0	6.1	0.011	3564	3420	ma101107_rel.cz11d_bee
998	3618	35	0.1	94.7	3.6	0.010	0.039	0.095	3.713	15105	14.9	4.175	329	6.2	22.0	6.1	0.014	3580	3420	ma110401_rel.cz11b_bee
qp1000.L6
qp1000.L6: point queries with 1000 insert/s per client
Performance metrics for all DBMS, not just the ones listed above. Some are normalized by throughput, others are not. Legend for results is here.
ips	qps	rps	rmbps	wps	wmbps	rpq	rkbpq	wpi	wkbpi	csps	cpups	cspq	cpupq	dbgb1	dbgb2	rss	maxop	p50	p99	tag
998	4350	0	0.0	5861.5	178.0	0.000	0.000	5.872	182.549	37712	19.5	8.670	359	6.1	22.0	6.7	0.023	4253	3724	ma100244_rel.cz11a_bee
998	4093	0	0.0	5910.5	179.5	0.000	0.000	5.921	184.080	37871	19.2	9.253	375	6.1	22.0	6.7	0.022	4011	3564	ma100339_rel.cz11a_bee
998	3920	0	0.0	5904.8	179.3	0.000	0.000	5.915	183.894	37029	19.2	9.445	392	6.1	22.0	NA	0.021	3852	3388	ma100433_rel.cz11a_bee
998	4107	0	0.0	3.7	1.1	0.000	0.000	0.004	1.103	18583	16.6	4.525	323	6.6	23.6	7.4	0.004	4030	3388	ma100524_rel.cz11a_bee
998	3727	0	0.0	88.4	3.4	0.000	0.000	0.089	3.538	16349	16.8	4.386	361	6.2	22.0	6.1	0.005	3564	3324	ma100617_rel.cz11a_bee
998	3824	35	0.1	88.6	3.5	0.009	0.036	0.089	3.566	16846	16.3	4.405	341	6.2	22.0	6.1	0.004	3627	3324	ma101107_rel.cz11a_bee
998	3768	35	0.1	90.0	3.5	0.009	0.037	0.090	3.566	16600	16.5	4.406	350	6.2	22.0	6.1	0.011	3580	3308	ma101107_rel.cz11b_bee
998	3807	35	0.1	89.0	3.5	0.009	0.036	0.089	3.573	16754	16.3	4.401	343	6.2	22.0	6.1	0.005	3596	3308	ma101107_rel.cz11d_bee
998	3836	35	0.1	92.1	3.5	0.009	0.036	0.092	3.629	16918	16.4	4.411	342	6.2	22.0	6.1	0.006	3628	3356	ma110401_rel.cz11b_bee
l.i0
- l.i0: load without secondary indexes
- Legend for results is here.
- Each entry lists the percentage of responses that fit in that bucket (slower than max time for previous bucket, faster than min time for next bucket).
Insert response time histogram
256us	1ms	4ms	16ms	64ms	256ms	1s	4s	16s	gt	max	tag
0.000	86.770	12.870	0.345	0.011	0.004	0.000	0.000	0.000	0.000	0.150	ma100244_rel.cz11a_bee
0.000	7.202	92.253	0.500	0.041	0.004	0.000	0.000	0.000	0.000	0.151	ma100339_rel.cz11a_bee
0.000	2.219	97.372	0.370	0.035	0.004	0.000	0.000	0.000	0.000	0.153	ma100433_rel.cz11a_bee
0.000	3.727	95.537	0.577	0.156	0.004	0.000	0.000	0.000	0.000	0.140	ma100524_rel.cz11a_bee
0.000	1.759	97.919	0.193	0.123	0.005	0.000	0.000	0.000	0.000	0.179	ma100617_rel.cz11a_bee
0.000	10.964	88.724	0.197	0.111	0.005	0.000	0.000	0.000	0.000	0.182	ma101107_rel.cz11a_bee
0.000	9.943	89.744	0.197	0.111	0.005	0.000	0.000	0.000	0.000	0.229	ma101107_rel.cz11b_bee
0.000	10.120	89.568	0.184	0.122	0.005	0.000	0.000	0.000	0.000	0.190	ma101107_rel.cz11d_bee
0.000	2.688	96.998	0.187	0.122	0.005	0.000	0.000	0.000	0.000	0.206	ma110401_rel.cz11b_bee
l.x
- l.x: create secondary indexes
- Legend for results is here.
- Each entry lists the percentage of responses that fit in that bucket (slower than max time for previous bucket, faster than min time for next bucket).
TODO - determine whether there is data for create index response time
l.i1
- l.i1: continue load after secondary indexes created with 50 inserts per transaction
- Legend for results is here.
- Each entry lists the percentage of responses that fit in that bucket (slower than max time for previous bucket, faster than min time for next bucket).
Insert response time histogram
256us	1ms	4ms	16ms	64ms	256ms	1s	4s	16s	gt	max	tag
0.000	0.000	89.039	10.852	0.108	0.001	0.000	0.000	0.000	0.000	0.069	ma100244_rel.cz11a_bee
0.000	0.000	88.676	11.202	0.121	0.001	0.000	0.000	0.000	0.000	0.069	ma100339_rel.cz11a_bee
0.000	0.000	89.775	10.104	0.120	0.001	0.000	0.000	0.000	0.000	0.122	ma100433_rel.cz11a_bee
0.000	0.000	96.792	3.098	0.097	0.001	0.012	0.000	0.000	0.000	0.399	ma100524_rel.cz11a_bee
0.000	0.000	95.970	3.930	0.100	0.001	0.000	0.000	0.000	0.000	0.111	ma100617_rel.cz11a_bee
0.000	0.000	95.914	4.010	0.075	nonzero	nonzero	0.000	0.000	0.000	0.263	ma101107_rel.cz11a_bee
0.000	0.000	94.287	5.220	0.489	0.004	0.000	0.000	0.000	0.000	0.235	ma101107_rel.cz11b_bee
0.000	0.000	95.916	4.012	0.071	nonzero	0.000	0.000	0.000	0.000	0.117	ma101107_rel.cz11d_bee
0.000	0.000	94.301	5.211	0.485	0.004	0.000	0.000	0.000	0.000	0.189	ma110401_rel.cz11b_bee
Delete response time histogram
256us	1ms	4ms	16ms	64ms	256ms	1s	4s	16s	gt	max	tag
0.000	0.000	91.345	8.604	0.050	0.001	0.000	0.000	0.000	0.000	0.068	ma100244_rel.cz11a_bee
0.000	0.000	91.777	8.178	0.044	0.001	0.000	0.000	0.000	0.000	0.069	ma100339_rel.cz11a_bee
0.000	0.000	92.937	7.026	0.036	0.001	0.000	0.000	0.000	0.000	0.074	ma100433_rel.cz11a_bee
0.000	0.000	98.049	1.884	0.055	0.001	0.012	0.000	0.000	0.000	0.398	ma100524_rel.cz11a_bee
0.000	0.000	97.234	2.699	0.067	nonzero	0.000	0.000	0.000	0.000	0.074	ma100617_rel.cz11a_bee
0.000	0.000	97.312	2.649	0.039	nonzero	0.000	0.000	0.000	0.000	0.255	ma101107_rel.cz11a_bee
0.000	0.000	96.131	3.470	0.396	0.003	0.000	0.000	0.000	0.000	0.234	ma101107_rel.cz11b_bee
0.000	0.000	97.301	2.656	0.043	0.000	0.000	0.000	0.000	0.000	0.063	ma101107_rel.cz11d_bee
0.000	0.000	96.023	3.587	0.388	0.003	0.000	0.000	0.000	0.000	0.188	ma110401_rel.cz11b_bee
l.i2
- l.i2: continue load after secondary indexes created with 5 inserts per transaction
- Legend for results is here.
- Each entry lists the percentage of responses that fit in that bucket (slower than max time for previous bucket, faster than min time for next bucket).
Insert response time histogram
256us	1ms	4ms	16ms	64ms	256ms	1s	4s	16s	gt	max	tag
1.814	96.575	0.417	1.191	0.003	0.000	0.000	0.000	0.000	0.000	0.046	ma100244_rel.cz11a_bee
0.745	97.757	0.372	1.123	0.003	0.000	0.000	0.000	0.000	0.000	0.048	ma100339_rel.cz11a_bee
0.175	98.321	0.371	1.130	0.003	0.000	0.000	0.000	0.000	0.000	0.046	ma100433_rel.cz11a_bee
0.955	98.487	0.432	0.124	0.002	0.000	0.000	0.000	0.000	0.000	0.064	ma100524_rel.cz11a_bee
0.316	99.556	0.104	0.022	nonzero	nonzero	0.000	0.000	0.000	0.000	0.071	ma100617_rel.cz11a_bee
0.384	99.465	0.131	0.021	nonzero	nonzero	0.000	0.000	0.000	0.000	0.065	ma101107_rel.cz11a_bee
0.518	99.260	0.117	0.102	0.002	0.000	0.000	0.000	0.000	0.000	0.063	ma101107_rel.cz11b_bee
0.428	99.415	0.135	0.021	0.001	0.000	0.000	0.000	0.000	0.000	0.063	ma101107_rel.cz11d_bee
0.358	99.424	0.111	0.104	0.003	nonzero	0.000	0.000	0.000	0.000	0.064	ma110401_rel.cz11b_bee
Delete response time histogram
256us	1ms	4ms	16ms	64ms	256ms	1s	4s	16s	gt	max	tag
3.577	94.789	0.447	1.185	0.002	0.000	0.000	0.000	0.000	0.000	0.046	ma100244_rel.cz11a_bee
3.985	94.502	0.394	1.117	0.002	0.000	0.000	0.000	0.000	0.000	0.048	ma100339_rel.cz11a_bee
2.983	95.468	0.424	1.123	0.002	0.000	0.000	0.000	0.000	0.000	0.046	ma100433_rel.cz11a_bee
1.820	97.601	0.457	0.119	0.002	0.000	0.000	0.000	0.000	0.000	0.064	ma100524_rel.cz11a_bee
2.485	97.387	0.107	0.020	nonzero	nonzero	0.000	0.000	0.000	0.000	0.071	ma100617_rel.cz11a_bee
3.060	96.786	0.134	0.020	nonzero	nonzero	0.000	0.000	0.000	0.000	0.065	ma101107_rel.cz11a_bee
2.748	97.043	0.113	0.094	0.002	0.000	0.000	0.000	0.000	0.000	0.063	ma101107_rel.cz11b_bee
2.951	96.891	0.137	0.021	0.001	0.000	0.000	0.000	0.000	0.000	0.063	ma101107_rel.cz11d_bee
1.129	98.652	0.117	0.098	0.003	nonzero	0.000	0.000	0.000	0.000	0.064	ma110401_rel.cz11b_bee
qr100.L1
- qr100.L1: range queries with 100 insert/s per client
- Legend for results is here.
- Each entry lists the percentage of responses that fit in that bucket (slower than max time for previous bucket, faster than min time for next bucket).
Query response time histogram
256us	1ms	4ms	16ms	64ms	256ms	1s	4s	16s	gt	max	tag
74.389	25.606	0.004	nonzero	nonzero	0.000	0.000	0.000	0.000	0.000	0.018	ma100244_rel.cz11a_bee
70.506	29.490	0.003	0.001	nonzero	0.000	0.000	0.000	0.000	0.000	0.017	ma100339_rel.cz11a_bee
62.255	37.741	0.003	nonzero	nonzero	0.000	0.000	0.000	0.000	0.000	0.021	ma100433_rel.cz11a_bee
56.972	43.028	0.001	0.000	0.000	0.000	0.000	0.000	0.000	0.000	0.003	ma100524_rel.cz11a_bee
56.594	43.406	0.001	nonzero	0.000	0.000	0.000	0.000	0.000	0.000	0.011	ma100617_rel.cz11a_bee
54.960	45.040	nonzero	nonzero	0.000	0.000	0.000	0.000	0.000	0.000	0.005	ma101107_rel.cz11a_bee
59.643	40.356	0.001	nonzero	0.000	0.000	0.000	0.000	0.000	0.000	0.012	ma101107_rel.cz11b_bee
57.715	42.284	nonzero	0.000	0.000	0.000	0.000	0.000	0.000	0.000	0.004	ma101107_rel.cz11d_bee
60.353	39.646	nonzero	nonzero	0.000	0.000	0.000	0.000	0.000	0.000	0.004	ma110401_rel.cz11b_bee
Insert response time histogram
256us	1ms	4ms	16ms	64ms	256ms	1s	4s	16s	gt	max	tag
0.000	0.000	95.056	3.750	1.194	0.000	0.000	0.000	0.000	0.000	0.040	ma100244_rel.cz11a_bee
0.000	0.000	95.472	3.333	1.194	0.000	0.000	0.000	0.000	0.000	0.036	ma100339_rel.cz11a_bee
0.000	0.000	95.250	3.167	1.583	0.000	0.000	0.000	0.000	0.000	0.038	ma100433_rel.cz11a_bee
0.000	0.000	97.167	2.833	0.000	0.000	0.000	0.000	0.000	0.000	0.005	ma100524_rel.cz11a_bee
0.000	0.000	99.889	0.056	0.056	0.000	0.000	0.000	0.000	0.000	0.021	ma100617_rel.cz11a_bee
0.000	0.000	53.306	46.667	0.028	0.000	0.000	0.000	0.000	0.000	0.024	ma101107_rel.cz11a_bee
0.000	0.000	53.194	46.778	0.028	0.000	0.000	0.000	0.000	0.000	0.044	ma101107_rel.cz11b_bee
0.000	0.000	53.278	46.694	0.028	0.000	0.000	0.000	0.000	0.000	0.026	ma101107_rel.cz11d_bee
0.000	0.000	53.250	46.722	0.028	0.000	0.000	0.000	0.000	0.000	0.020	ma110401_rel.cz11b_bee
Delete response time histogram
256us	1ms	4ms	16ms	64ms	256ms	1s	4s	16s	gt	max	tag
0.000	0.000	95.861	3.278	0.861	0.000	0.000	0.000	0.000	0.000	0.040	ma100244_rel.cz11a_bee
0.000	0.000	96.278	2.750	0.972	0.000	0.000	0.000	0.000	0.000	0.030	ma100339_rel.cz11a_bee
0.000	0.000	96.167	2.944	0.889	0.000	0.000	0.000	0.000	0.000	0.038	ma100433_rel.cz11a_bee
0.000	0.000	99.944	0.056	0.000	0.000	0.000	0.000	0.000	0.000	0.006	ma100524_rel.cz11a_bee
0.000	0.000	99.972	0.000	0.028	0.000	0.000	0.000	0.000	0.000	0.017	ma100617_rel.cz11a_bee
0.000	0.000	53.361	46.639	0.000	0.000	0.000	0.000	0.000	0.000	0.012	ma101107_rel.cz11a_bee
0.000	0.000	53.222	46.750	0.028	0.000	0.000	0.000	0.000	0.000	0.017	ma101107_rel.cz11b_bee
0.000	0.000	53.278	46.722	0.000	0.000	0.000	0.000	0.000	0.000	0.012	ma101107_rel.cz11d_bee
0.000	0.000	53.306	46.694	0.000	0.000	0.000	0.000	0.000	0.000	0.012	ma110401_rel.cz11b_bee
qp100.L2
- qp100.L2: point queries with 100 insert/s per client
- Legend for results is here.
- Each entry lists the percentage of responses that fit in that bucket (slower than max time for previous bucket, faster than min time for next bucket).
Query response time histogram
256us	1ms	4ms	16ms	64ms	256ms	1s	4s	16s	gt	max	tag
90.240	9.758	0.001	nonzero	nonzero	0.000	0.000	0.000	0.000	0.000	0.016	ma100244_rel.cz11a_bee
87.820	12.178	0.002	nonzero	nonzero	0.000	0.000	0.000	0.000	0.000	0.016	ma100339_rel.cz11a_bee
76.429	23.569	0.002	nonzero	nonzero	0.000	0.000	0.000	0.000	0.000	0.023	ma100433_rel.cz11a_bee
78.944	21.055	0.001	0.000	0.000	0.000	0.000	0.000	0.000	0.000	0.003	ma100524_rel.cz11a_bee
72.091	27.907	0.002	nonzero	0.000	0.000	0.000	0.000	0.000	0.000	0.006	ma100617_rel.cz11a_bee
74.190	25.809	0.002	nonzero	0.000	0.000	0.000	0.000	0.000	0.000	0.005	ma101107_rel.cz11a_bee
64.672	35.326	0.002	nonzero	0.000	0.000	0.000	0.000	0.000	0.000	0.005	ma101107_rel.cz11b_bee
65.846	34.152	0.001	nonzero	0.000	0.000	0.000	0.000	0.000	0.000	0.005	ma101107_rel.cz11d_bee
77.686	22.312	0.002	nonzero	0.000	0.000	0.000	0.000	0.000	0.000	0.007	ma110401_rel.cz11b_bee
Insert response time histogram
256us	1ms	4ms	16ms	64ms	256ms	1s	4s	16s	gt	max	tag
0.000	0.000	95.361	3.361	1.278	0.000	0.000	0.000	0.000	0.000	0.040	ma100244_rel.cz11a_bee
0.000	0.000	95.472	3.250	1.278	0.000	0.000	0.000	0.000	0.000	0.035	ma100339_rel.cz11a_bee
0.000	0.000	95.222	3.583	1.194	0.000	0.000	0.000	0.000	0.000	0.048	ma100433_rel.cz11a_bee
0.000	0.000	98.194	1.806	0.000	0.000	0.000	0.000	0.000	0.000	0.006	ma100524_rel.cz11a_bee
0.000	0.000	99.972	0.028	0.000	0.000	0.000	0.000	0.000	0.000	0.009	ma100617_rel.cz11a_bee
0.000	0.000	53.194	46.806	0.000	0.000	0.000	0.000	0.000	0.000	0.012	ma101107_rel.cz11a_bee
0.000	0.000	53.000	47.000	0.000	0.000	0.000	0.000	0.000	0.000	0.012	ma101107_rel.cz11b_bee
0.000	0.000	52.944	47.056	0.000	0.000	0.000	0.000	0.000	0.000	0.012	ma101107_rel.cz11d_bee
0.000	0.000	53.306	46.694	0.000	0.000	0.000	0.000	0.000	0.000	0.012	ma110401_rel.cz11b_bee
Delete response time histogram
256us	1ms	4ms	16ms	64ms	256ms	1s	4s	16s	gt	max	tag
0.000	0.000	96.361	3.111	0.528	0.000	0.000	0.000	0.000	0.000	0.023	ma100244_rel.cz11a_bee
0.000	0.000	96.111	2.889	1.000	0.000	0.000	0.000	0.000	0.000	0.034	ma100339_rel.cz11a_bee
0.000	0.000	96.361	2.750	0.889	0.000	0.000	0.000	0.000	0.000	0.043	ma100433_rel.cz11a_bee
0.000	0.000	100.000	0.000	0.000	0.000	0.000	0.000	0.000	0.000	0.004	ma100524_rel.cz11a_bee
0.000	0.000	100.000	0.000	0.000	0.000	0.000	0.000	0.000	0.000	0.004	ma100617_rel.cz11a_bee
0.000	0.000	53.333	46.667	0.000	0.000	0.000	0.000	0.000	0.000	0.012	ma101107_rel.cz11a_bee
0.000	0.000	53.083	46.917	0.000	0.000	0.000	0.000	0.000	0.000	0.012	ma101107_rel.cz11b_bee
0.000	0.000	53.000	47.000	0.000	0.000	0.000	0.000	0.000	0.000	0.012	ma101107_rel.cz11d_bee
0.000	0.000	53.333	46.667	0.000	0.000	0.000	0.000	0.000	0.000	0.012	ma110401_rel.cz11b_bee
qr500.L3
- qr500.L3: range queries with 500 insert/s per client
- Legend for results is here.
- Each entry lists the percentage of responses that fit in that bucket (slower than max time for previous bucket, faster than min time for next bucket).
Query response time histogram
256us	1ms	4ms	16ms	64ms	256ms	1s	4s	16s	gt	max	tag
75.986	23.986	0.024	0.004	nonzero	0.000	0.000	0.000	0.000	0.000	0.023	ma100244_rel.cz11a_bee
73.619	26.355	0.020	0.005	nonzero	0.000	0.000	0.000	0.000	0.000	0.027	ma100339_rel.cz11a_bee
64.700	35.273	0.022	0.004	0.001	0.000	0.000	0.000	0.000	0.000	0.030	ma100433_rel.cz11a_bee
58.624	41.373	0.003	nonzero	0.000	0.000	0.000	0.000	0.000	0.000	0.006	ma100524_rel.cz11a_bee
54.795	45.204	0.001	nonzero	0.000	0.000	0.000	0.000	0.000	0.000	0.004	ma100617_rel.cz11a_bee
51.804	48.195	0.001	nonzero	0.000	0.000	0.000	0.000	0.000	0.000	0.004	ma101107_rel.cz11a_bee
57.650	42.348	0.001	nonzero	0.000	0.000	0.000	0.000	0.000	0.000	0.012	ma101107_rel.cz11b_bee
55.796	44.203	0.001	nonzero	0.000	0.000	0.000	0.000	0.000	0.000	0.006	ma101107_rel.cz11d_bee
56.843	43.156	0.001	0.000	0.000	0.000	0.000	0.000	0.000	0.000	0.003	ma110401_rel.cz11b_bee
Insert response time histogram
256us	1ms	4ms	16ms	64ms	256ms	1s	4s	16s	gt	max	tag
0.000	0.000	87.822	9.150	3.028	0.000	0.000	0.000	0.000	0.000	0.047	ma100244_rel.cz11a_bee
0.000	0.000	87.322	9.467	3.211	0.000	0.000	0.000	0.000	0.000	0.047	ma100339_rel.cz11a_bee
0.000	0.000	87.678	9.194	3.128	0.000	0.000	0.000	0.000	0.000	0.046	ma100433_rel.cz11a_bee
0.000	0.000	99.283	0.717	0.000	0.000	0.000	0.000	0.000	0.000	0.007	ma100524_rel.cz11a_bee
0.000	0.000	99.789	0.211	0.000	0.000	0.000	0.000	0.000	0.000	0.005	ma100617_rel.cz11a_bee
0.000	0.000	90.061	9.939	0.000	0.000	0.000	0.000	0.000	0.000	0.012	ma101107_rel.cz11a_bee
0.000	0.000	90.128	9.872	0.000	0.000	0.000	0.000	0.000	0.000	0.012	ma101107_rel.cz11b_bee
0.000	0.000	90.106	9.894	0.000	0.000	0.000	0.000	0.000	0.000	0.012	ma101107_rel.cz11d_bee
0.000	0.000	90.122	9.878	0.000	0.000	0.000	0.000	0.000	0.000	0.012	ma110401_rel.cz11b_bee
Delete response time histogram
256us	1ms	4ms	16ms	64ms	256ms	1s	4s	16s	gt	max	tag
0.000	0.000	88.750	8.628	2.622	0.000	0.000	0.000	0.000	0.000	0.038	ma100244_rel.cz11a_bee
0.000	0.000	88.483	8.828	2.689	0.000	0.000	0.000	0.000	0.000	0.050	ma100339_rel.cz11a_bee
0.000	0.000	88.783	8.706	2.511	0.000	0.000	0.000	0.000	0.000	0.045	ma100433_rel.cz11a_bee
0.000	0.000	99.778	0.222	0.000	0.000	0.000	0.000	0.000	0.000	0.006	ma100524_rel.cz11a_bee
0.000	0.000	99.950	0.050	0.000	0.000	0.000	0.000	0.000	0.000	0.006	ma100617_rel.cz11a_bee
0.000	0.000	90.511	9.489	0.000	0.000	0.000	0.000	0.000	0.000	0.012	ma101107_rel.cz11a_bee
0.000	0.000	90.550	9.450	0.000	0.000	0.000	0.000	0.000	0.000	0.012	ma101107_rel.cz11b_bee
0.000	0.000	90.539	9.461	0.000	0.000	0.000	0.000	0.000	0.000	0.012	ma101107_rel.cz11d_bee
0.000	0.000	90.583	9.417	0.000	0.000	0.000	0.000	0.000	0.000	0.014	ma110401_rel.cz11b_bee
qp500.L4
- qp500.L4: point queries with 500 insert/s per client
- Legend for results is here.
- Each entry lists the percentage of responses that fit in that bucket (slower than max time for previous bucket, faster than min time for next bucket).
Query response time histogram
256us	1ms	4ms	16ms	64ms	256ms	1s	4s	16s	gt	max	tag
90.867	9.126	0.007	nonzero	nonzero	0.000	0.000	0.000	0.000	0.000	0.017	ma100244_rel.cz11a_bee
88.085	11.907	0.007	0.001	nonzero	0.000	0.000	0.000	0.000	0.000	0.024	ma100339_rel.cz11a_bee
77.171	22.820	0.008	0.001	nonzero	0.000	0.000	0.000	0.000	0.000	0.024	ma100433_rel.cz11a_bee
85.410	14.588	0.002	nonzero	0.000	0.000	0.000	0.000	0.000	0.000	0.005	ma100524_rel.cz11a_bee
79.221	20.778	0.001	nonzero	0.000	0.000	0.000	0.000	0.000	0.000	0.013	ma100617_rel.cz11a_bee
79.062	20.937	0.002	nonzero	0.000	0.000	0.000	0.000	0.000	0.000	0.005	ma101107_rel.cz11a_bee
75.394	24.604	0.002	nonzero	0.000	0.000	0.000	0.000	0.000	0.000	0.009	ma101107_rel.cz11b_bee
75.600	24.397	0.003	nonzero	0.000	0.000	0.000	0.000	0.000	0.000	0.009	ma101107_rel.cz11d_bee
81.114	18.884	0.002	nonzero	0.000	0.000	0.000	0.000	0.000	0.000	0.005	ma110401_rel.cz11b_bee
Insert response time histogram
256us	1ms	4ms	16ms	64ms	256ms	1s	4s	16s	gt	max	tag
0.000	0.000	88.078	8.806	3.117	0.000	0.000	0.000	0.000	0.000	0.049	ma100244_rel.cz11a_bee
0.000	0.000	87.361	9.344	3.294	0.000	0.000	0.000	0.000	0.000	0.055	ma100339_rel.cz11a_bee
0.000	0.000	87.483	9.322	3.194	0.000	0.000	0.000	0.000	0.000	0.045	ma100433_rel.cz11a_bee
0.000	0.000	99.278	0.722	0.000	0.000	0.000	0.000	0.000	0.000	0.007	ma100524_rel.cz11a_bee
0.000	0.000	99.606	0.389	0.006	0.000	0.000	0.000	0.000	0.000	0.016	ma100617_rel.cz11a_bee
0.000	0.000	90.061	9.939	0.000	0.000	0.000	0.000	0.000	0.000	0.013	ma101107_rel.cz11a_bee
0.000	0.000	90.100	9.894	0.006	0.000	0.000	0.000	0.000	0.000	0.022	ma101107_rel.cz11b_bee
0.000	0.000	90.000	10.000	0.000	0.000	0.000	0.000	0.000	0.000	0.013	ma101107_rel.cz11d_bee
0.000	0.000	89.967	10.033	0.000	0.000	0.000	0.000	0.000	0.000	0.014	ma110401_rel.cz11b_bee
Delete response time histogram
256us	1ms	4ms	16ms	64ms	256ms	1s	4s	16s	gt	max	tag
0.000	0.000	88.900	8.533	2.567	0.000	0.000	0.000	0.000	0.000	0.040	ma100244_rel.cz11a_bee
0.000	0.000	88.417	9.044	2.539	0.000	0.000	0.000	0.000	0.000	0.052	ma100339_rel.cz11a_bee
0.000	0.000	88.806	8.622	2.572	0.000	0.000	0.000	0.000	0.000	0.044	ma100433_rel.cz11a_bee
0.000	0.000	99.867	0.133	0.000	0.000	0.000	0.000	0.000	0.000	0.005	ma100524_rel.cz11a_bee
0.000	0.000	99.883	0.111	0.006	0.000	0.000	0.000	0.000	0.000	0.017	ma100617_rel.cz11a_bee
0.000	0.000	90.472	9.528	0.000	0.000	0.000	0.000	0.000	0.000	0.012	ma101107_rel.cz11a_bee
0.000	0.000	90.517	9.483	0.000	0.000	0.000	0.000	0.000	0.000	0.013	ma101107_rel.cz11b_bee
0.000	0.000	90.417	9.583	0.000	0.000	0.000	0.000	0.000	0.000	0.014	ma101107_rel.cz11d_bee
0.000	0.000	90.439	9.556	0.006	0.000	0.000	0.000	0.000	0.000	0.021	ma110401_rel.cz11b_bee
qr1000.L5
- qr1000.L5: range queries with 1000 insert/s per client
- Legend for results is here.
- Each entry lists the percentage of responses that fit in that bucket (slower than max time for previous bucket, faster than min time for next bucket).
Query response time histogram
256us	1ms	4ms	16ms	64ms	256ms	1s	4s	16s	gt	max	tag
77.923	21.953	0.115	0.009	nonzero	0.000	0.000	0.000	0.000	0.000	0.022	ma100244_rel.cz11a_bee
76.608	23.296	0.087	0.009	0.001	0.000	0.000	0.000	0.000	0.000	0.030	ma100339_rel.cz11a_bee
67.370	32.519	0.099	0.011	0.001	0.000	0.000	0.000	0.000	0.000	0.025	ma100433_rel.cz11a_bee
56.755	43.238	0.006	nonzero	0.000	0.000	0.000	0.000	0.000	0.000	0.006	ma100524_rel.cz11a_bee
55.617	44.380	0.003	0.001	nonzero	0.000	0.000	0.000	0.000	0.000	0.017	ma100617_rel.cz11a_bee
55.299	44.696	0.005	0.001	0.000	0.000	0.000	0.000	0.000	0.000	0.007	ma101107_rel.cz11a_bee
56.042	43.953	0.003	0.002	0.000	0.000	0.000	0.000	0.000	0.000	0.013	ma101107_rel.cz11b_bee
56.328	43.668	0.003	0.001	0.000	0.000	0.000	0.000	0.000	0.000	0.011	ma101107_rel.cz11d_bee
58.142	41.854	0.003	0.001	0.000	0.000	0.000	0.000	0.000	0.000	0.014	ma110401_rel.cz11b_bee
Insert response time histogram
256us	1ms	4ms	16ms	64ms	256ms	1s	4s	16s	gt	max	tag
0.000	0.000	81.486	15.817	2.697	0.000	0.000	0.000	0.000	0.000	0.050	ma100244_rel.cz11a_bee
0.000	0.000	81.142	15.631	3.228	0.000	0.000	0.000	0.000	0.000	0.048	ma100339_rel.cz11a_bee
0.000	0.000	80.289	16.486	3.225	0.000	0.000	0.000	0.000	0.000	0.044	ma100433_rel.cz11a_bee
0.000	0.000	99.428	0.569	0.003	0.000	0.000	0.000	0.000	0.000	0.028	ma100524_rel.cz11a_bee
0.000	0.000	99.767	0.222	0.011	0.000	0.000	0.000	0.000	0.000	0.037	ma100617_rel.cz11a_bee
0.000	0.000	94.975	5.022	0.003	0.000	0.000	0.000	0.000	0.000	0.029	ma101107_rel.cz11a_bee
0.000	0.000	95.025	4.967	0.008	0.000	0.000	0.000	0.000	0.000	0.039	ma101107_rel.cz11b_bee
0.000	0.000	95.019	4.978	0.003	0.000	0.000	0.000	0.000	0.000	0.028	ma101107_rel.cz11d_bee
0.000	0.000	95.061	4.928	0.011	0.000	0.000	0.000	0.000	0.000	0.032	ma110401_rel.cz11b_bee
Delete response time histogram
256us	1ms	4ms	16ms	64ms	256ms	1s	4s	16s	gt	max	tag
0.000	0.000	83.603	14.111	2.286	0.000	0.000	0.000	0.000	0.000	0.044	ma100244_rel.cz11a_bee
0.000	0.000	83.592	13.936	2.472	0.000	0.000	0.000	0.000	0.000	0.039	ma100339_rel.cz11a_bee
0.000	0.000	83.203	14.142	2.656	0.000	0.000	0.000	0.000	0.000	0.040	ma100433_rel.cz11a_bee
0.000	0.000	99.869	0.128	0.003	0.000	0.000	0.000	0.000	0.000	0.029	ma100524_rel.cz11a_bee
0.000	0.000	99.842	0.150	0.008	0.000	0.000	0.000	0.000	0.000	0.037	ma100617_rel.cz11a_bee
0.000	0.000	95.136	4.861	0.003	0.000	0.000	0.000	0.000	0.000	0.028	ma101107_rel.cz11a_bee
0.000	0.000	95.167	4.828	0.006	0.000	0.000	0.000	0.000	0.000	0.028	ma101107_rel.cz11b_bee
0.000	0.000	95.119	4.878	0.003	0.000	0.000	0.000	0.000	0.000	0.028	ma101107_rel.cz11d_bee
0.000	0.000	95.183	4.806	0.011	0.000	0.000	0.000	0.000	0.000	0.030	ma110401_rel.cz11b_bee
qp1000.L6
- qp1000.L6: point queries with 1000 insert/s per client
- Legend for results is here.
- Each entry lists the percentage of responses that fit in that bucket (slower than max time for previous bucket, faster than min time for next bucket).
Query response time histogram
256us	1ms	4ms	16ms	64ms	256ms	1s	4s	16s	gt	max	tag
91.365	8.610	0.024	nonzero	nonzero	0.000	0.000	0.000	0.000	0.000	0.023	ma100244_rel.cz11a_bee
87.966	12.005	0.028	0.002	nonzero	0.000	0.000	0.000	0.000	0.000	0.022	ma100339_rel.cz11a_bee
80.806	19.163	0.029	0.002	nonzero	0.000	0.000	0.000	0.000	0.000	0.021	ma100433_rel.cz11a_bee
86.799	13.198	0.004	nonzero	0.000	0.000	0.000	0.000	0.000	0.000	0.004	ma100524_rel.cz11a_bee
75.857	24.141	0.002	nonzero	0.000	0.000	0.000	0.000	0.000	0.000	0.005	ma100617_rel.cz11a_bee
79.122	20.876	0.002	nonzero	0.000	0.000	0.000	0.000	0.000	0.000	0.004	ma101107_rel.cz11a_bee
74.856	25.141	0.003	nonzero	0.000	0.000	0.000	0.000	0.000	0.000	0.011	ma101107_rel.cz11b_bee
75.270	24.727	0.002	nonzero	0.000	0.000	0.000	0.000	0.000	0.000	0.005	ma101107_rel.cz11d_bee
80.549	19.448	0.003	nonzero	0.000	0.000	0.000	0.000	0.000	0.000	0.006	ma110401_rel.cz11b_bee
Insert response time histogram
256us	1ms	4ms	16ms	64ms	256ms	1s	4s	16s	gt	max	tag
0.000	0.000	82.531	14.889	2.581	0.000	0.000	0.000	0.000	0.000	0.048	ma100244_rel.cz11a_bee
0.000	0.000	81.450	15.597	2.953	0.000	0.000	0.000	0.000	0.000	0.047	ma100339_rel.cz11a_bee
0.000	0.000	81.250	15.883	2.867	0.000	0.000	0.000	0.000	0.000	0.049	ma100433_rel.cz11a_bee
0.000	0.000	99.492	0.506	0.003	0.000	0.000	0.000	0.000	0.000	0.038	ma100524_rel.cz11a_bee
0.000	0.000	99.761	0.231	0.008	0.000	0.000	0.000	0.000	0.000	0.038	ma100617_rel.cz11a_bee
0.000	0.000	95.039	4.956	0.006	0.000	0.000	0.000	0.000	0.000	0.028	ma101107_rel.cz11a_bee
0.000	0.000	95.011	4.983	0.006	0.000	0.000	0.000	0.000	0.000	0.039	ma101107_rel.cz11b_bee
0.000	0.000	95.058	4.939	0.003	0.000	0.000	0.000	0.000	0.000	0.037	ma101107_rel.cz11d_bee
0.000	0.000	95.008	4.983	0.008	0.000	0.000	0.000	0.000	0.000	0.042	ma110401_rel.cz11b_bee
Delete response time histogram
256us	1ms	4ms	16ms	64ms	256ms	1s	4s	16s	gt	max	tag
0.000	0.000	84.200	13.642	2.158	0.000	0.000	0.000	0.000	0.000	0.039	ma100244_rel.cz11a_bee
0.000	0.000	83.733	13.992	2.275	0.000	0.000	0.000	0.000	0.000	0.041	ma100339_rel.cz11a_bee
0.000	0.000	83.639	14.183	2.178	0.000	0.000	0.000	0.000	0.000	0.035	ma100433_rel.cz11a_bee
0.000	0.000	99.933	0.064	0.003	0.000	0.000	0.000	0.000	0.000	0.039	ma100524_rel.cz11a_bee
0.000	0.000	99.867	0.131	0.003	0.000	0.000	0.000	0.000	0.000	0.036	ma100617_rel.cz11a_bee
0.000	0.000	95.194	4.806	0.000	0.000	0.000	0.000	0.000	0.000	0.012	ma101107_rel.cz11a_bee
0.000	0.000	95.136	4.861	0.003	0.000	0.000	0.000	0.000	0.000	0.028	ma101107_rel.cz11b_bee
0.000	0.000	95.169	4.828	0.003	0.000	0.000	0.000	0.000	0.000	0.026	ma101107_rel.cz11d_bee
0.000	0.000	95.169	4.822	0.008	0.000	0.000	0.000	0.000	0.000	0.042	ma110401_rel.cz11b_bee