Introduction
This is a report for the insert benchmark with 30M docs and 1 client(s). It is generated by scripts (bash, awk, sed) and Tufte might not be impressed. An overview of the insert benchmark is here and a short update is here. Below, by DBMS, I mean DBMS+version.config. An example is my8020.c10b40 where my means MySQL, 8020 is version 8.0.20 and c10b40 is the name for the configuration file.
The test server has 8 AMD cores, 16G RAM and an NVMe SSD. It is described here as the Beelink. The benchmark was run with 1 client and there were 1 or 3 connections per client (1 for queries or inserts without rate limits, 1+1 for rate limited inserts+deletes). It uses 1 table. It loads 30M rows per table without secondary indexes, creates 3 secondary indexes per table, then inserts 50m+50m rows per table with a delete per insert to avoid growing the table. It then does 6 read+write tests for 1800s each that do queries as fast as possible with 100,100,500,500,1000,1000 inserts/s and the same for deletes/s per client concurrent with the queries. The database is cached in memory. Clients and the DBMS share one server. The per-database configs are in the per-database subdirectories here.
The tested DBMS are:
- my5710_rel.cz10a_bee - MySQL 5.7.10, InnoDB, z10a_bee config
- my5720_rel.cz10a_bee - MySQL 5.7.20, InnoDB, z10a_bee config
- my5730_rel.cz10a_bee - MySQL 5.7.30, InnoDB, z10a_bee config
- my5744_rel.cz10a_bee - MySQL 5.7.44, InnoDB, z10a_bee config
Contents
- Summary
- l.i0: load without secondary indexes
- l.x: create secondary indexes
- l.i1: continue load after secondary indexes created with 50 inserts per transaction
- l.i2: continue load after secondary indexes created with 5 inserts per transaction
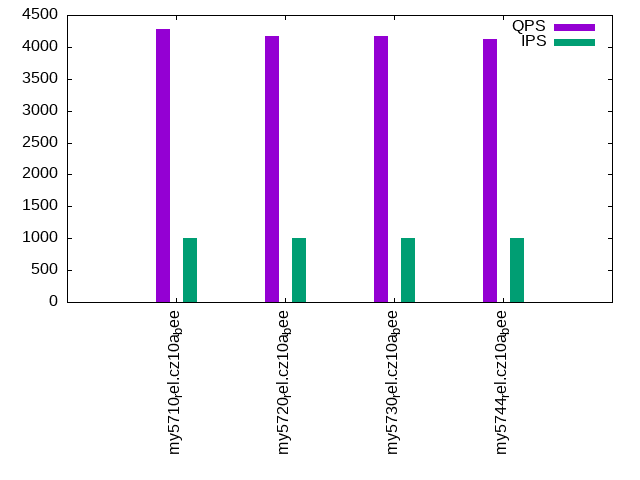
- qr100.L1: range queries with 100 insert/s per client
- qp100.L2: point queries with 100 insert/s per client
- qr500.L3: range queries with 500 insert/s per client
- qp500.L4: point queries with 500 insert/s per client
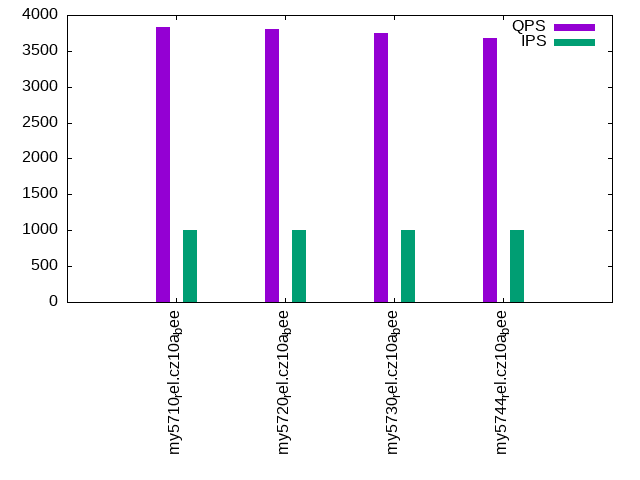
- qr1000.L5: range queries with 1000 insert/s per client
- qp1000.L6: point queries with 1000 insert/s per client
Summary
The numbers are inserts/s for l.i0, l.i1 and l.i2, indexed docs (or rows) /s for l.x and queries/s for qr100, qp100 thru qr1000, qp1000" The values are the average rate over the entire test for inserts (IPS) and queries (QPS). The range of values for IPS and QPS is split into 3 parts: bottom 25%, middle 50%, top 25%. Values in the bottom 25% have a red background, values in the top 25% have a green background and values in the middle have no color. A gray background is used for values that can be ignored because the DBMS did not sustain the target insert rate. Red backgrounds are not used when the minimum value is within 80% of the max value.
| dbms | l.i0 | l.x | l.i1 | l.i2 | qr100 | qp100 | qr500 | qp500 | qr1000 | qp1000 |
|---|---|---|---|---|---|---|---|---|---|---|
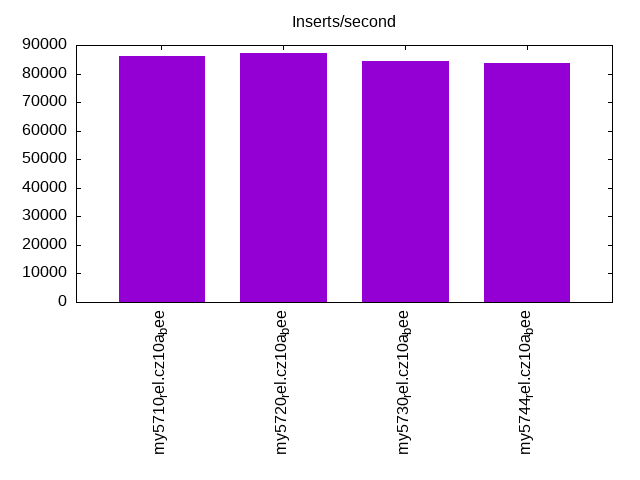
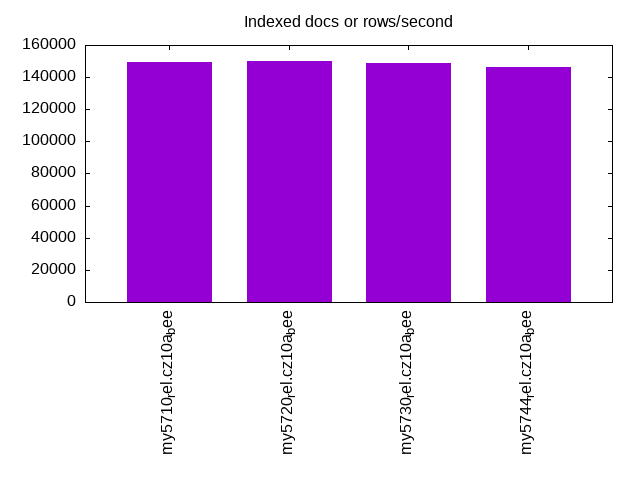
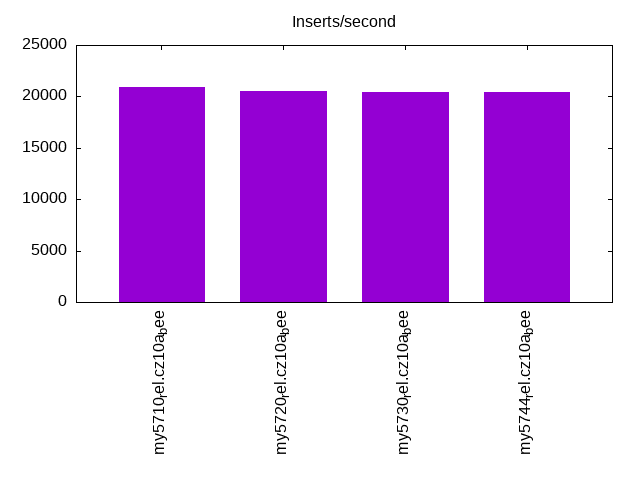
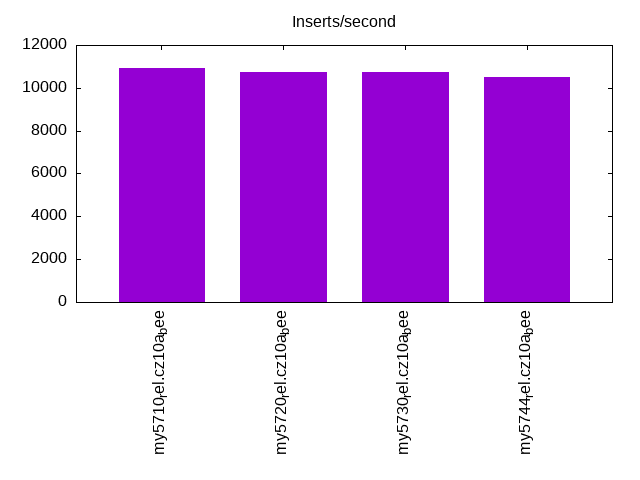
| my5710_rel.cz10a_bee | 86207 | 149254 | 20942 | 10941 | 4237 | 3924 | 4222 | 3780 | 4280 | 3832 |
| my5720_rel.cz10a_bee | 87209 | 150000 | 20555 | 10753 | 4187 | 3833 | 4197 | 3765 | 4174 | 3799 |
| my5730_rel.cz10a_bee | 84270 | 148515 | 20460 | 10753 | 4158 | 3796 | 4211 | 3790 | 4164 | 3745 |
| my5744_rel.cz10a_bee | 83799 | 146342 | 20418 | 10504 | 4124 | 3768 | 4108 | 3697 | 4118 | 3686 |
This table has relative throughput, throughput for the DBMS relative to the DBMS in the first line, using the absolute throughput from the previous table. Values less than 0.95 have a yellow background. Values greater than 1.05 have a blue background.
| dbms | l.i0 | l.x | l.i1 | l.i2 | qr100 | qp100 | qr500 | qp500 | qr1000 | qp1000 |
|---|---|---|---|---|---|---|---|---|---|---|
| my5710_rel.cz10a_bee | 1.00 | 1.00 | 1.00 | 1.00 | 1.00 | 1.00 | 1.00 | 1.00 | 1.00 | 1.00 |
| my5720_rel.cz10a_bee | 1.01 | 1.00 | 0.98 | 0.98 | 0.99 | 0.98 | 0.99 | 1.00 | 0.98 | 0.99 |
| my5730_rel.cz10a_bee | 0.98 | 1.00 | 0.98 | 0.98 | 0.98 | 0.97 | 1.00 | 1.00 | 0.97 | 0.98 |
| my5744_rel.cz10a_bee | 0.97 | 0.98 | 0.97 | 0.96 | 0.97 | 0.96 | 0.97 | 0.98 | 0.96 | 0.96 |
This lists the average rate of inserts/s for the tests that do inserts concurrent with queries. For such tests the query rate is listed in the table above. The read+write tests are setup so that the insert rate should match the target rate every second. Cells that are not at least 95% of the target have a red background to indicate a failure to satisfy the target.
| dbms | qr100.L1 | qp100.L2 | qr500.L3 | qp500.L4 | qr1000.L5 | qp1000.L6 |
|---|---|---|---|---|---|---|
| my5710_rel.cz10a_bee | 100 | 100 | 499 | 499 | 998 | 998 |
| my5720_rel.cz10a_bee | 100 | 100 | 499 | 499 | 998 | 997 |
| my5730_rel.cz10a_bee | 100 | 100 | 499 | 499 | 997 | 998 |
| my5744_rel.cz10a_bee | 100 | 100 | 499 | 499 | 998 | 998 |
| target | 100 | 100 | 500 | 500 | 1000 | 1000 |
l.i0
l.i0: load without secondary indexes. Graphs for performance per 1-second interval are here.
Average throughput:
Insert response time histogram: each cell has the percentage of responses that take <= the time in the header and max is the max response time in seconds. For the max column values in the top 25% of the range have a red background and in the bottom 25% of the range have a green background. The red background is not used when the min value is within 80% of the max value.
| dbms | 256us | 1ms | 4ms | 16ms | 64ms | 256ms | 1s | 4s | 16s | gt | max |
|---|---|---|---|---|---|---|---|---|---|---|---|
| my5710_rel.cz10a_bee | 4.581 | 95.127 | 0.284 | 0.006 | 0.002 | 0.118 | |||||
| my5720_rel.cz10a_bee | 8.024 | 91.683 | 0.286 | 0.005 | 0.002 | 0.105 | |||||
| my5730_rel.cz10a_bee | 3.060 | 96.600 | 0.199 | 0.139 | 0.002 | 0.111 | |||||
| my5744_rel.cz10a_bee | 2.324 | 97.334 | 0.200 | 0.140 | 0.002 | 0.111 |
Performance metrics for the DBMS listed above. Some are normalized by throughput, others are not. Legend for results is here.
ips	qps	rps	rmbps	wps	wmbps	rpq	rkbpq	wpi	wkbpi	csps	cpups	cspq	cpupq	dbgb1	dbgb2	rss	maxop	p50	p99	tag
86207	0	0	0.0	280.5	26.1	0.000	0.000	0.003	0.310	9029	21.8	0.105	20	2.0	18.5	2.8	0.118	86605	76444	my5710_rel.cz10a_bee
87209	0	0	0.0	283.8	26.5	0.000	0.000	0.003	0.311	9123	22.1	0.105	20	2.0	18.5	2.9	0.105	87805	76814	my5720_rel.cz10a_bee
84270	0	0	0.0	278.4	25.9	0.000	0.000	0.003	0.315	8844	21.6	0.105	21	2.0	18.5	2.9	0.111	84757	74217	my5730_rel.cz10a_bee
83799	0	0	0.0	276.1	25.8	0.000	0.000	0.003	0.315	8808	21.5	0.105	21	2.0	18.5	2.9	0.111	84512	73232	my5744_rel.cz10a_bee
l.x
l.x: create secondary indexes.
Average throughput:
Performance metrics for the DBMS listed above. Some are normalized by throughput, others are not. Legend for results is here.
ips	qps	rps	rmbps	wps	wmbps	rpq	rkbpq	wpi	wkbpi	csps	cpups	cspq	cpupq	dbgb1	dbgb2	rss	maxop	p50	p99	tag
149254	0	0	0.0	1539.6	144.6	0.000	0.000	0.010	0.992	9586	12.5	0.064	7	4.6	21.1	4.4	0.002	NA	NA	my5710_rel.cz10a_bee
150000	0	0	0.0	1681.2	146.5	0.000	0.000	0.011	1.000	9892	12.5	0.066	7	4.6	21.1	4.4	0.002	NA	NA	my5720_rel.cz10a_bee
148515	0	0	0.0	1370.0	141.3	0.000	0.000	0.009	0.974	8939	12.3	0.060	7	4.6	21.1	4.4	0.002	NA	NA	my5730_rel.cz10a_bee
146342	0	0	0.0	1518.2	141.4	0.000	0.000	0.010	0.989	9446	12.4	0.065	7	4.6	21.1	4.4	0.002	NA	NA	my5744_rel.cz10a_bee
l.i1
l.i1: continue load after secondary indexes created with 50 inserts per transaction. Graphs for performance per 1-second interval are here.
Average throughput:
Insert response time histogram: each cell has the percentage of responses that take <= the time in the header and max is the max response time in seconds. For the max column values in the top 25% of the range have a red background and in the bottom 25% of the range have a green background. The red background is not used when the min value is within 80% of the max value.
| dbms | 256us | 1ms | 4ms | 16ms | 64ms | 256ms | 1s | 4s | 16s | gt | max |
|---|---|---|---|---|---|---|---|---|---|---|---|
| my5710_rel.cz10a_bee | 97.367 | 2.603 | 0.027 | 0.003 | 0.098 | ||||||
| my5720_rel.cz10a_bee | 96.925 | 3.047 | 0.025 | 0.003 | 0.093 | ||||||
| my5730_rel.cz10a_bee | 96.991 | 2.937 | 0.069 | 0.003 | 0.086 | ||||||
| my5744_rel.cz10a_bee | 96.978 | 2.950 | 0.069 | 0.003 | 0.083 |
Delete response time histogram: each cell has the percentage of responses that take <= the time in the header and max is the max response time in seconds. For the max column values in the top 25% of the range have a red background and in the bottom 25% of the range have a green background. The red background is not used when the min value is within 80% of the max value.
| dbms | 256us | 1ms | 4ms | 16ms | 64ms | 256ms | 1s | 4s | 16s | gt | max |
|---|---|---|---|---|---|---|---|---|---|---|---|
| my5710_rel.cz10a_bee | 98.247 | 1.740 | 0.010 | 0.003 | 0.103 | ||||||
| my5720_rel.cz10a_bee | 97.768 | 2.219 | 0.010 | 0.003 | 0.093 | ||||||
| my5730_rel.cz10a_bee | 97.784 | 2.195 | 0.018 | 0.003 | 0.087 | ||||||
| my5744_rel.cz10a_bee | 97.721 | 2.261 | 0.015 | 0.003 | 0.088 |
Performance metrics for the DBMS listed above. Some are normalized by throughput, others are not. Legend for results is here.
ips	qps	rps	rmbps	wps	wmbps	rpq	rkbpq	wpi	wkbpi	csps	cpups	cspq	cpupq	dbgb1	dbgb2	rss	maxop	p50	p99	tag
20942	0	0	0.0	2069.2	89.8	0.000	0.000	0.099	4.390	15157	38.3	0.724	146	6.7	23.3	7.8	0.098	21475	7641	my5710_rel.cz10a_bee
20555	0	0	0.0	2074.2	90.6	0.000	0.000	0.101	4.512	15139	38.5	0.737	150	6.6	23.1	7.7	0.093	21277	7293	my5720_rel.cz10a_bee
20460	0	0	0.0	2058.3	90.5	0.000	0.000	0.101	4.528	15103	38.2	0.738	149	6.5	23.0	7.6	0.086	21226	7741	my5730_rel.cz10a_bee
20418	0	0	0.0	2062.5	90.8	0.000	0.000	0.101	4.555	15073	37.9	0.738	148	6.5	23.0	7.6	0.083	21127	8441	my5744_rel.cz10a_bee
l.i2
l.i2: continue load after secondary indexes created with 5 inserts per transaction. Graphs for performance per 1-second interval are here.
Average throughput:
Insert response time histogram: each cell has the percentage of responses that take <= the time in the header and max is the max response time in seconds. For the max column values in the top 25% of the range have a red background and in the bottom 25% of the range have a green background. The red background is not used when the min value is within 80% of the max value.
| dbms | 256us | 1ms | 4ms | 16ms | 64ms | 256ms | 1s | 4s | 16s | gt | max |
|---|---|---|---|---|---|---|---|---|---|---|---|
| my5710_rel.cz10a_bee | 0.142 | 99.604 | 0.052 | 0.201 | 0.001 | nonzero | 0.078 | ||||
| my5720_rel.cz10a_bee | 0.084 | 99.639 | 0.060 | 0.216 | 0.001 | nonzero | 0.075 | ||||
| my5730_rel.cz10a_bee | 0.026 | 99.712 | 0.046 | 0.214 | 0.001 | nonzero | 0.074 | ||||
| my5744_rel.cz10a_bee | 0.038 | 99.678 | 0.055 | 0.228 | 0.001 | nonzero | 0.074 |
Delete response time histogram: each cell has the percentage of responses that take <= the time in the header and max is the max response time in seconds. For the max column values in the top 25% of the range have a red background and in the bottom 25% of the range have a green background. The red background is not used when the min value is within 80% of the max value.
| dbms | 256us | 1ms | 4ms | 16ms | 64ms | 256ms | 1s | 4s | 16s | gt | max |
|---|---|---|---|---|---|---|---|---|---|---|---|
| my5710_rel.cz10a_bee | 0.169 | 99.605 | 0.024 | 0.201 | 0.001 | nonzero | 0.079 | ||||
| my5720_rel.cz10a_bee | 0.053 | 99.707 | 0.023 | 0.215 | 0.001 | nonzero | 0.075 | ||||
| my5730_rel.cz10a_bee | 0.066 | 99.696 | 0.024 | 0.213 | 0.001 | nonzero | 0.074 | ||||
| my5744_rel.cz10a_bee | 0.158 | 99.583 | 0.033 | 0.226 | 0.001 | nonzero | 0.074 |
Performance metrics for the DBMS listed above. Some are normalized by throughput, others are not. Legend for results is here.
ips	qps	rps	rmbps	wps	wmbps	rpq	rkbpq	wpi	wkbpi	csps	cpups	cspq	cpupq	dbgb1	dbgb2	rss	maxop	p50	p99	tag
10941	0	0	0.0	1132.1	46.9	0.000	0.000	0.103	4.389	49107	37.5	4.488	274	6.7	23.3	7.8	0.078	10918	9404	my5710_rel.cz10a_bee
10753	0	0	0.0	1120.6	46.5	0.000	0.000	0.104	4.426	48816	37.2	4.540	277	6.6	23.1	7.7	0.075	10778	9329	my5720_rel.cz10a_bee
10753	0	0	0.0	1139.0	47.0	0.000	0.000	0.106	4.475	48991	37.1	4.556	276	6.5	23.0	7.6	0.074	10733	9124	my5730_rel.cz10a_bee
10504	0	0	0.0	1111.1	46.0	0.000	0.000	0.106	4.482	44436	36.2	4.230	276	6.5	23.0	7.6	0.074	10518	9153	my5744_rel.cz10a_bee
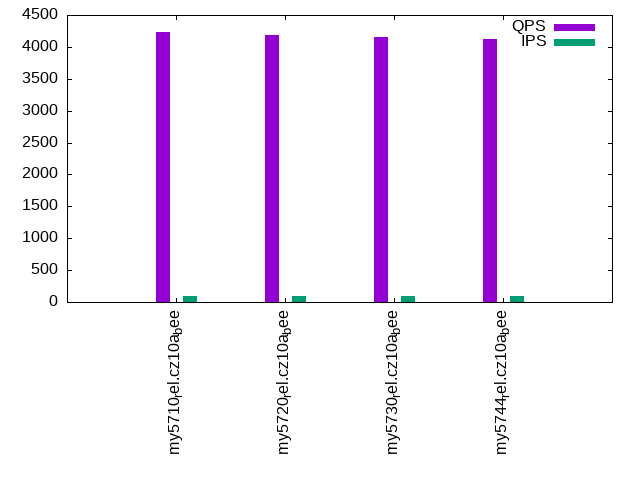
qr100.L1
qr100.L1: range queries with 100 insert/s per client. Graphs for performance per 1-second interval are here.
Average throughput:
Query response time histogram: each cell has the percentage of responses that take <= the time in the header and max is the max response time in seconds. For max values in the top 25% of the range have a red background and in the bottom 25% of the range have a green background. The red background is not used when the min value is within 80% of the max value.
| dbms | 256us | 1ms | 4ms | 16ms | 64ms | 256ms | 1s | 4s | 16s | gt | max |
|---|---|---|---|---|---|---|---|---|---|---|---|
| my5710_rel.cz10a_bee | 73.134 | 26.865 | nonzero | nonzero | 0.005 | ||||||
| my5720_rel.cz10a_bee | 72.645 | 27.355 | nonzero | 0.003 | |||||||
| my5730_rel.cz10a_bee | 70.938 | 29.061 | nonzero | nonzero | 0.008 | ||||||
| my5744_rel.cz10a_bee | 70.406 | 29.594 | nonzero | nonzero | 0.004 |
Insert response time histogram: each cell has the percentage of responses that take <= the time in the header and max is the max response time in seconds. For max values in the top 25% of the range have a red background and in the bottom 25% of the range have a green background. The red background is not used when the min value is within 80% of the max value.
| dbms | 256us | 1ms | 4ms | 16ms | 64ms | 256ms | 1s | 4s | 16s | gt | max |
|---|---|---|---|---|---|---|---|---|---|---|---|
| my5710_rel.cz10a_bee | 99.444 | 0.556 | 0.015 | ||||||||
| my5720_rel.cz10a_bee | 99.500 | 0.500 | 0.013 | ||||||||
| my5730_rel.cz10a_bee | 98.250 | 1.639 | 0.111 | 0.028 | |||||||
| my5744_rel.cz10a_bee | 99.583 | 0.417 | 0.009 |
Delete response time histogram: each cell has the percentage of responses that take <= the time in the header and max is the max response time in seconds. For max values in the top 25% of the range have a red background and in the bottom 25% of the range have a green background. The red background is not used when the min value is within 80% of the max value.
| dbms | 256us | 1ms | 4ms | 16ms | 64ms | 256ms | 1s | 4s | 16s | gt | max |
|---|---|---|---|---|---|---|---|---|---|---|---|
| my5710_rel.cz10a_bee | 99.417 | 0.583 | 0.012 | ||||||||
| my5720_rel.cz10a_bee | 99.611 | 0.389 | 0.014 | ||||||||
| my5730_rel.cz10a_bee | 98.611 | 1.333 | 0.056 | 0.023 | |||||||
| my5744_rel.cz10a_bee | 99.639 | 0.361 | 0.009 |
Performance metrics for the DBMS listed above. Some are normalized by throughput, others are not. Legend for results is here.
ips	qps	rps	rmbps	wps	wmbps	rpq	rkbpq	wpi	wkbpi	csps	cpups	cspq	cpupq	dbgb1	dbgb2	rss	maxop	p50	p99	tag
100	4237	0	0.0	113.7	3.2	0.000	0.000	1.140	32.916	16728	12.6	3.948	238	6.7	23.3	7.8	0.005	4190	3979	my5710_rel.cz10a_bee
100	4187	0	0.0	103.1	2.9	0.000	0.000	1.034	29.747	16501	12.6	3.941	241	6.6	23.1	7.7	0.003	4139	3916	my5720_rel.cz10a_bee
100	4158	0	0.0	109.7	3.1	0.000	0.000	1.101	31.727	16416	12.6	3.948	242	6.5	23.0	7.6	0.008	4093	3915	my5730_rel.cz10a_bee
100	4124	0	0.0	109.6	3.1	0.000	0.000	1.098	31.589	16287	12.5	3.949	242	6.5	23.0	7.6	0.004	4072	3869	my5744_rel.cz10a_bee
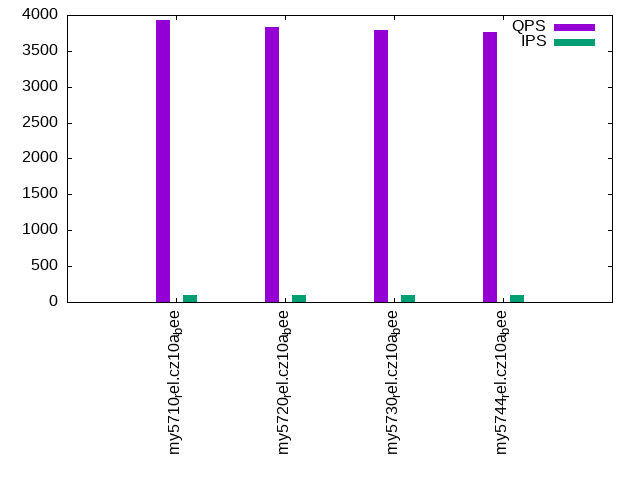
qp100.L2
qp100.L2: point queries with 100 insert/s per client. Graphs for performance per 1-second interval are here.
Average throughput:
Query response time histogram: each cell has the percentage of responses that take <= the time in the header and max is the max response time in seconds. For max values in the top 25% of the range have a red background and in the bottom 25% of the range have a green background. The red background is not used when the min value is within 80% of the max value.
| dbms | 256us | 1ms | 4ms | 16ms | 64ms | 256ms | 1s | 4s | 16s | gt | max |
|---|---|---|---|---|---|---|---|---|---|---|---|
| my5710_rel.cz10a_bee | 87.925 | 12.073 | 0.002 | nonzero | 0.006 | ||||||
| my5720_rel.cz10a_bee | 86.136 | 13.861 | 0.002 | nonzero | 0.006 | ||||||
| my5730_rel.cz10a_bee | 84.521 | 15.477 | 0.002 | nonzero | 0.005 | ||||||
| my5744_rel.cz10a_bee | 83.898 | 16.101 | 0.001 | 0.004 |
Insert response time histogram: each cell has the percentage of responses that take <= the time in the header and max is the max response time in seconds. For max values in the top 25% of the range have a red background and in the bottom 25% of the range have a green background. The red background is not used when the min value is within 80% of the max value.
| dbms | 256us | 1ms | 4ms | 16ms | 64ms | 256ms | 1s | 4s | 16s | gt | max |
|---|---|---|---|---|---|---|---|---|---|---|---|
| my5710_rel.cz10a_bee | 99.389 | 0.611 | 0.015 | ||||||||
| my5720_rel.cz10a_bee | 99.472 | 0.528 | 0.009 | ||||||||
| my5730_rel.cz10a_bee | 99.611 | 0.389 | 0.016 | ||||||||
| my5744_rel.cz10a_bee | 99.500 | 0.500 | 0.013 |
Delete response time histogram: each cell has the percentage of responses that take <= the time in the header and max is the max response time in seconds. For max values in the top 25% of the range have a red background and in the bottom 25% of the range have a green background. The red background is not used when the min value is within 80% of the max value.
| dbms | 256us | 1ms | 4ms | 16ms | 64ms | 256ms | 1s | 4s | 16s | gt | max |
|---|---|---|---|---|---|---|---|---|---|---|---|
| my5710_rel.cz10a_bee | 99.389 | 0.611 | 0.012 | ||||||||
| my5720_rel.cz10a_bee | 99.500 | 0.500 | 0.008 | ||||||||
| my5730_rel.cz10a_bee | 99.667 | 0.333 | 0.016 | ||||||||
| my5744_rel.cz10a_bee | 99.444 | 0.556 | 0.013 |
Performance metrics for the DBMS listed above. Some are normalized by throughput, others are not. Legend for results is here.
ips	qps	rps	rmbps	wps	wmbps	rpq	rkbpq	wpi	wkbpi	csps	cpups	cspq	cpupq	dbgb1	dbgb2	rss	maxop	p50	p99	tag
100	3924	0	0.0	24.0	0.5	0.000	0.000	0.241	5.358	16049	13.3	4.090	271	6.7	23.3	7.8	0.006	3836	3596	my5710_rel.cz10a_bee
100	3833	0	0.0	26.2	0.6	0.000	0.000	0.263	5.984	15683	13.4	4.092	280	6.6	23.1	7.7	0.006	3756	3564	my5720_rel.cz10a_bee
100	3796	0	0.0	25.8	0.6	0.000	0.000	0.258	5.872	15534	14.0	4.092	295	6.5	23.0	7.6	0.005	3708	3484	my5730_rel.cz10a_bee
100	3768	0	0.0	24.1	0.5	0.000	0.000	0.242	5.410	15446	13.8	4.100	293	6.5	23.0	7.6	0.004	3675	3436	my5744_rel.cz10a_bee
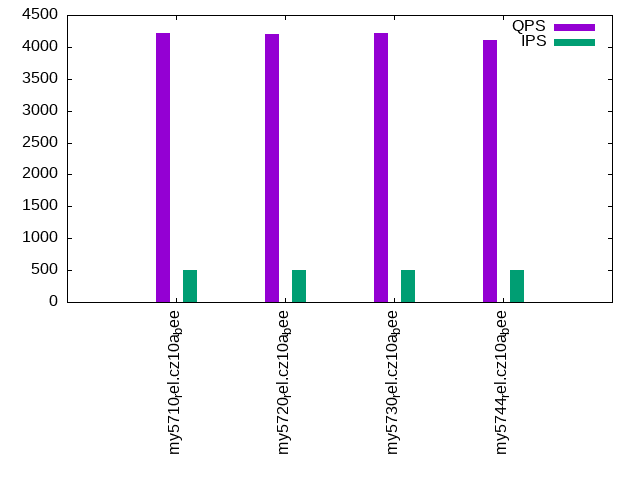
qr500.L3
qr500.L3: range queries with 500 insert/s per client. Graphs for performance per 1-second interval are here.
Average throughput:
Query response time histogram: each cell has the percentage of responses that take <= the time in the header and max is the max response time in seconds. For max values in the top 25% of the range have a red background and in the bottom 25% of the range have a green background. The red background is not used when the min value is within 80% of the max value.
| dbms | 256us | 1ms | 4ms | 16ms | 64ms | 256ms | 1s | 4s | 16s | gt | max |
|---|---|---|---|---|---|---|---|---|---|---|---|
| my5710_rel.cz10a_bee | 71.909 | 28.090 | nonzero | nonzero | 0.007 | ||||||
| my5720_rel.cz10a_bee | 71.551 | 28.449 | nonzero | nonzero | 0.004 | ||||||
| my5730_rel.cz10a_bee | 71.811 | 28.189 | 0.001 | 0.003 | |||||||
| my5744_rel.cz10a_bee | 69.972 | 30.028 | nonzero | 0.003 |
Insert response time histogram: each cell has the percentage of responses that take <= the time in the header and max is the max response time in seconds. For max values in the top 25% of the range have a red background and in the bottom 25% of the range have a green background. The red background is not used when the min value is within 80% of the max value.
| dbms | 256us | 1ms | 4ms | 16ms | 64ms | 256ms | 1s | 4s | 16s | gt | max |
|---|---|---|---|---|---|---|---|---|---|---|---|
| my5710_rel.cz10a_bee | 99.633 | 0.367 | 0.014 | ||||||||
| my5720_rel.cz10a_bee | 99.417 | 0.583 | 0.014 | ||||||||
| my5730_rel.cz10a_bee | 99.361 | 0.639 | 0.009 | ||||||||
| my5744_rel.cz10a_bee | 99.556 | 0.444 | 0.012 |
Delete response time histogram: each cell has the percentage of responses that take <= the time in the header and max is the max response time in seconds. For max values in the top 25% of the range have a red background and in the bottom 25% of the range have a green background. The red background is not used when the min value is within 80% of the max value.
| dbms | 256us | 1ms | 4ms | 16ms | 64ms | 256ms | 1s | 4s | 16s | gt | max |
|---|---|---|---|---|---|---|---|---|---|---|---|
| my5710_rel.cz10a_bee | 99.728 | 0.272 | 0.014 | ||||||||
| my5720_rel.cz10a_bee | 99.639 | 0.361 | 0.012 | ||||||||
| my5730_rel.cz10a_bee | 99.628 | 0.372 | 0.009 | ||||||||
| my5744_rel.cz10a_bee | 99.667 | 0.333 | 0.010 |
Performance metrics for the DBMS listed above. Some are normalized by throughput, others are not. Legend for results is here.
ips	qps	rps	rmbps	wps	wmbps	rpq	rkbpq	wpi	wkbpi	csps	cpups	cspq	cpupq	dbgb1	dbgb2	rss	maxop	p50	p99	tag
499	4222	0	0.0	57.9	1.9	0.000	0.000	0.116	3.954	16583	13.5	3.927	256	6.7	23.3	7.8	0.007	4172	3980	my5710_rel.cz10a_bee
499	4197	0	0.0	69.9	2.3	0.000	0.000	0.140	4.735	16532	13.6	3.939	259	6.6	23.1	7.7	0.004	4139	3946	my5720_rel.cz10a_bee
499	4211	0	0.0	62.2	2.1	0.000	0.000	0.125	4.266	16569	13.5	3.935	256	6.5	23.0	7.6	0.003	4141	3931	my5730_rel.cz10a_bee
499	4108	0	0.0	67.1	2.2	0.000	0.000	0.135	4.582	16193	13.5	3.942	263	6.5	23.0	7.6	0.003	4059	3868	my5744_rel.cz10a_bee
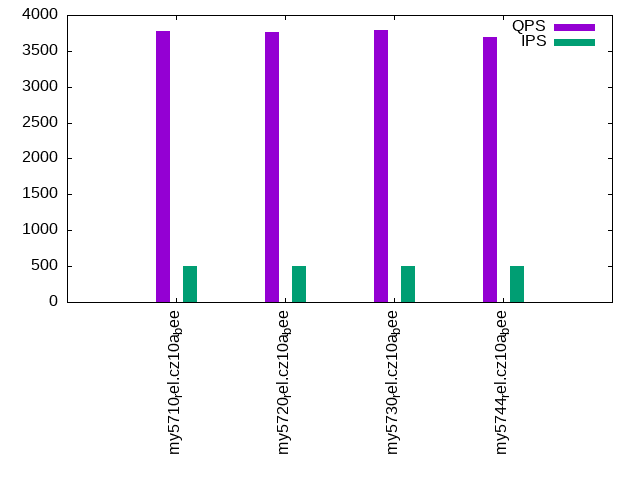
qp500.L4
qp500.L4: point queries with 500 insert/s per client. Graphs for performance per 1-second interval are here.
Average throughput:
Query response time histogram: each cell has the percentage of responses that take <= the time in the header and max is the max response time in seconds. For max values in the top 25% of the range have a red background and in the bottom 25% of the range have a green background. The red background is not used when the min value is within 80% of the max value.
| dbms | 256us | 1ms | 4ms | 16ms | 64ms | 256ms | 1s | 4s | 16s | gt | max |
|---|---|---|---|---|---|---|---|---|---|---|---|
| my5710_rel.cz10a_bee | 83.306 | 16.688 | 0.006 | nonzero | 0.007 | ||||||
| my5720_rel.cz10a_bee | 82.921 | 17.073 | 0.006 | nonzero | 0.008 | ||||||
| my5730_rel.cz10a_bee | 83.558 | 16.438 | 0.004 | nonzero | 0.005 | ||||||
| my5744_rel.cz10a_bee | 81.915 | 18.080 | 0.005 | nonzero | 0.005 |
Insert response time histogram: each cell has the percentage of responses that take <= the time in the header and max is the max response time in seconds. For max values in the top 25% of the range have a red background and in the bottom 25% of the range have a green background. The red background is not used when the min value is within 80% of the max value.
| dbms | 256us | 1ms | 4ms | 16ms | 64ms | 256ms | 1s | 4s | 16s | gt | max |
|---|---|---|---|---|---|---|---|---|---|---|---|
| my5710_rel.cz10a_bee | 99.544 | 0.456 | 0.015 | ||||||||
| my5720_rel.cz10a_bee | 99.317 | 0.683 | 0.014 | ||||||||
| my5730_rel.cz10a_bee | 99.500 | 0.500 | 0.011 | ||||||||
| my5744_rel.cz10a_bee | 99.556 | 0.444 | 0.011 |
Delete response time histogram: each cell has the percentage of responses that take <= the time in the header and max is the max response time in seconds. For max values in the top 25% of the range have a red background and in the bottom 25% of the range have a green background. The red background is not used when the min value is within 80% of the max value.
| dbms | 256us | 1ms | 4ms | 16ms | 64ms | 256ms | 1s | 4s | 16s | gt | max |
|---|---|---|---|---|---|---|---|---|---|---|---|
| my5710_rel.cz10a_bee | 99.656 | 0.344 | 0.013 | ||||||||
| my5720_rel.cz10a_bee | 99.561 | 0.439 | 0.014 | ||||||||
| my5730_rel.cz10a_bee | 99.672 | 0.328 | 0.011 | ||||||||
| my5744_rel.cz10a_bee | 99.661 | 0.339 | 0.011 |
Performance metrics for the DBMS listed above. Some are normalized by throughput, others are not. Legend for results is here.
ips	qps	rps	rmbps	wps	wmbps	rpq	rkbpq	wpi	wkbpi	csps	cpups	cspq	cpupq	dbgb1	dbgb2	rss	maxop	p50	p99	tag
499	3780	0	0.0	80.8	2.6	0.000	0.000	0.162	5.406	15731	14.2	4.162	301	6.7	23.3	7.8	0.007	3708	3500	my5710_rel.cz10a_bee
499	3765	0	0.0	82.6	2.7	0.000	0.000	0.166	5.541	15687	13.8	4.166	293	6.6	23.1	7.7	0.008	3724	3516	my5720_rel.cz10a_bee
499	3790	0	0.0	85.4	2.8	0.000	0.000	0.171	5.744	15791	14.4	4.167	304	6.5	23.0	7.6	0.005	3707	3467	my5730_rel.cz10a_bee
499	3697	0	0.0	88.6	2.9	0.000	0.000	0.178	5.918	15456	13.9	4.181	301	6.5	23.0	7.6	0.005	3645	3420	my5744_rel.cz10a_bee
qr1000.L5
qr1000.L5: range queries with 1000 insert/s per client. Graphs for performance per 1-second interval are here.
Average throughput:
Query response time histogram: each cell has the percentage of responses that take <= the time in the header and max is the max response time in seconds. For max values in the top 25% of the range have a red background and in the bottom 25% of the range have a green background. The red background is not used when the min value is within 80% of the max value.
| dbms | 256us | 1ms | 4ms | 16ms | 64ms | 256ms | 1s | 4s | 16s | gt | max |
|---|---|---|---|---|---|---|---|---|---|---|---|
| my5710_rel.cz10a_bee | 73.741 | 26.258 | 0.001 | nonzero | 0.007 | ||||||
| my5720_rel.cz10a_bee | 71.787 | 28.212 | 0.001 | nonzero | 0.005 | ||||||
| my5730_rel.cz10a_bee | 71.627 | 28.372 | 0.001 | nonzero | 0.008 | ||||||
| my5744_rel.cz10a_bee | 70.707 | 29.292 | 0.001 | nonzero | 0.004 |
Insert response time histogram: each cell has the percentage of responses that take <= the time in the header and max is the max response time in seconds. For max values in the top 25% of the range have a red background and in the bottom 25% of the range have a green background. The red background is not used when the min value is within 80% of the max value.
| dbms | 256us | 1ms | 4ms | 16ms | 64ms | 256ms | 1s | 4s | 16s | gt | max |
|---|---|---|---|---|---|---|---|---|---|---|---|
| my5710_rel.cz10a_bee | 99.539 | 0.458 | 0.003 | 0.039 | |||||||
| my5720_rel.cz10a_bee | 99.578 | 0.419 | 0.003 | 0.049 | |||||||
| my5730_rel.cz10a_bee | 99.286 | 0.711 | 0.003 | 0.040 | |||||||
| my5744_rel.cz10a_bee | 99.464 | 0.531 | 0.006 | 0.042 |
Delete response time histogram: each cell has the percentage of responses that take <= the time in the header and max is the max response time in seconds. For max values in the top 25% of the range have a red background and in the bottom 25% of the range have a green background. The red background is not used when the min value is within 80% of the max value.
| dbms | 256us | 1ms | 4ms | 16ms | 64ms | 256ms | 1s | 4s | 16s | gt | max |
|---|---|---|---|---|---|---|---|---|---|---|---|
| my5710_rel.cz10a_bee | 99.694 | 0.303 | 0.003 | 0.040 | |||||||
| my5720_rel.cz10a_bee | 99.764 | 0.233 | 0.003 | 0.048 | |||||||
| my5730_rel.cz10a_bee | 99.486 | 0.511 | 0.003 | 0.038 | |||||||
| my5744_rel.cz10a_bee | 99.608 | 0.389 | 0.003 | 0.043 |
Performance metrics for the DBMS listed above. Some are normalized by throughput, others are not. Legend for results is here.
ips	qps	rps	rmbps	wps	wmbps	rpq	rkbpq	wpi	wkbpi	csps	cpups	cspq	cpupq	dbgb1	dbgb2	rss	maxop	p50	p99	tag
998	4280	0	0.0	124.4	4.5	0.000	0.000	0.125	4.576	17176	14.6	4.013	273	6.7	23.3	7.8	0.007	4219	3995	my5710_rel.cz10a_bee
998	4174	0	0.0	119.1	4.3	0.000	0.000	0.119	4.437	16773	14.5	4.018	278	6.6	23.1	7.7	0.005	4126	3915	my5720_rel.cz10a_bee
997	4164	0	0.0	121.3	4.4	0.000	0.000	0.122	4.516	16757	14.6	4.025	281	6.5	23.0	7.6	0.008	4094	3884	my5730_rel.cz10a_bee
998	4118	0	0.0	121.3	4.4	0.000	0.000	0.122	4.517	16575	14.6	4.025	284	6.5	23.0	7.6	0.004	4060	3836	my5744_rel.cz10a_bee
qp1000.L6
qp1000.L6: point queries with 1000 insert/s per client. Graphs for performance per 1-second interval are here.
Average throughput:
Query response time histogram: each cell has the percentage of responses that take <= the time in the header and max is the max response time in seconds. For max values in the top 25% of the range have a red background and in the bottom 25% of the range have a green background. The red background is not used when the min value is within 80% of the max value.
| dbms | 256us | 1ms | 4ms | 16ms | 64ms | 256ms | 1s | 4s | 16s | gt | max |
|---|---|---|---|---|---|---|---|---|---|---|---|
| my5710_rel.cz10a_bee | 83.235 | 16.755 | 0.010 | nonzero | 0.007 | ||||||
| my5720_rel.cz10a_bee | 82.878 | 17.112 | 0.010 | nonzero | 0.004 | ||||||
| my5730_rel.cz10a_bee | 81.611 | 18.378 | 0.011 | nonzero | 0.006 | ||||||
| my5744_rel.cz10a_bee | 80.690 | 19.301 | 0.008 | nonzero | 0.006 |
Insert response time histogram: each cell has the percentage of responses that take <= the time in the header and max is the max response time in seconds. For max values in the top 25% of the range have a red background and in the bottom 25% of the range have a green background. The red background is not used when the min value is within 80% of the max value.
| dbms | 256us | 1ms | 4ms | 16ms | 64ms | 256ms | 1s | 4s | 16s | gt | max |
|---|---|---|---|---|---|---|---|---|---|---|---|
| my5710_rel.cz10a_bee | 99.386 | 0.608 | 0.006 | 0.046 | |||||||
| my5720_rel.cz10a_bee | 99.358 | 0.639 | 0.003 | 0.040 | |||||||
| my5730_rel.cz10a_bee | 99.325 | 0.672 | 0.003 | 0.049 | |||||||
| my5744_rel.cz10a_bee | 99.389 | 0.608 | 0.003 | 0.050 |
Delete response time histogram: each cell has the percentage of responses that take <= the time in the header and max is the max response time in seconds. For max values in the top 25% of the range have a red background and in the bottom 25% of the range have a green background. The red background is not used when the min value is within 80% of the max value.
| dbms | 256us | 1ms | 4ms | 16ms | 64ms | 256ms | 1s | 4s | 16s | gt | max |
|---|---|---|---|---|---|---|---|---|---|---|---|
| my5710_rel.cz10a_bee | 99.631 | 0.364 | 0.006 | 0.049 | |||||||
| my5720_rel.cz10a_bee | 99.608 | 0.389 | 0.003 | 0.041 | |||||||
| my5730_rel.cz10a_bee | 99.564 | 0.433 | 0.003 | 0.047 | |||||||
| my5744_rel.cz10a_bee | 99.614 | 0.383 | 0.003 | 0.047 |
Performance metrics for the DBMS listed above. Some are normalized by throughput, others are not. Legend for results is here.
ips	qps	rps	rmbps	wps	wmbps	rpq	rkbpq	wpi	wkbpi	csps	cpups	cspq	cpupq	dbgb1	dbgb2	rss	maxop	p50	p99	tag
998	3832	0	0.0	121.8	4.4	0.000	0.000	0.122	4.502	16243	15.1	4.239	315	6.7	23.3	7.8	0.007	3740	3530	my5710_rel.cz10a_bee
997	3799	0	0.0	121.8	4.4	0.000	0.000	0.122	4.532	16126	15.2	4.245	320	6.6	23.1	7.7	0.004	3724	3516	my5720_rel.cz10a_bee
998	3745	0	0.0	115.0	4.2	0.000	0.000	0.115	4.307	15882	15.0	4.240	320	6.5	23.0	7.6	0.006	3676	3452	my5730_rel.cz10a_bee
998	3686	0	0.0	115.9	4.2	0.000	0.000	0.116	4.338	15667	15.2	4.251	330	6.5	23.0	7.6	0.006	3629	3418	my5744_rel.cz10a_bee
l.i0
l.i0: load without secondary indexes
Performance metrics for all DBMS, not just the ones listed above. Some are normalized by throughput, others are not. Legend for results is here.
ips	qps	rps	rmbps	wps	wmbps	rpq	rkbpq	wpi	wkbpi	csps	cpups	cspq	cpupq	dbgb1	dbgb2	rss	maxop	p50	p99	tag
86207	0	0	0.0	280.5	26.1	0.000	0.000	0.003	0.310	9029	21.8	0.105	20	2.0	18.5	2.8	0.118	86605	76444	my5710_rel.cz10a_bee
87209	0	0	0.0	283.8	26.5	0.000	0.000	0.003	0.311	9123	22.1	0.105	20	2.0	18.5	2.9	0.105	87805	76814	my5720_rel.cz10a_bee
84270	0	0	0.0	278.4	25.9	0.000	0.000	0.003	0.315	8844	21.6	0.105	21	2.0	18.5	2.9	0.111	84757	74217	my5730_rel.cz10a_bee
83799	0	0	0.0	276.1	25.8	0.000	0.000	0.003	0.315	8808	21.5	0.105	21	2.0	18.5	2.9	0.111	84512	73232	my5744_rel.cz10a_bee
l.x
l.x: create secondary indexes
Performance metrics for all DBMS, not just the ones listed above. Some are normalized by throughput, others are not. Legend for results is here.
ips	qps	rps	rmbps	wps	wmbps	rpq	rkbpq	wpi	wkbpi	csps	cpups	cspq	cpupq	dbgb1	dbgb2	rss	maxop	p50	p99	tag
149254	0	0	0.0	1539.6	144.6	0.000	0.000	0.010	0.992	9586	12.5	0.064	7	4.6	21.1	4.4	0.002	NA	NA	my5710_rel.cz10a_bee
150000	0	0	0.0	1681.2	146.5	0.000	0.000	0.011	1.000	9892	12.5	0.066	7	4.6	21.1	4.4	0.002	NA	NA	my5720_rel.cz10a_bee
148515	0	0	0.0	1370.0	141.3	0.000	0.000	0.009	0.974	8939	12.3	0.060	7	4.6	21.1	4.4	0.002	NA	NA	my5730_rel.cz10a_bee
146342	0	0	0.0	1518.2	141.4	0.000	0.000	0.010	0.989	9446	12.4	0.065	7	4.6	21.1	4.4	0.002	NA	NA	my5744_rel.cz10a_bee
l.i1
l.i1: continue load after secondary indexes created with 50 inserts per transaction
Performance metrics for all DBMS, not just the ones listed above. Some are normalized by throughput, others are not. Legend for results is here.
ips	qps	rps	rmbps	wps	wmbps	rpq	rkbpq	wpi	wkbpi	csps	cpups	cspq	cpupq	dbgb1	dbgb2	rss	maxop	p50	p99	tag
20942	0	0	0.0	2069.2	89.8	0.000	0.000	0.099	4.390	15157	38.3	0.724	146	6.7	23.3	7.8	0.098	21475	7641	my5710_rel.cz10a_bee
20555	0	0	0.0	2074.2	90.6	0.000	0.000	0.101	4.512	15139	38.5	0.737	150	6.6	23.1	7.7	0.093	21277	7293	my5720_rel.cz10a_bee
20460	0	0	0.0	2058.3	90.5	0.000	0.000	0.101	4.528	15103	38.2	0.738	149	6.5	23.0	7.6	0.086	21226	7741	my5730_rel.cz10a_bee
20418	0	0	0.0	2062.5	90.8	0.000	0.000	0.101	4.555	15073	37.9	0.738	148	6.5	23.0	7.6	0.083	21127	8441	my5744_rel.cz10a_bee
l.i2
l.i2: continue load after secondary indexes created with 5 inserts per transaction
Performance metrics for all DBMS, not just the ones listed above. Some are normalized by throughput, others are not. Legend for results is here.
ips	qps	rps	rmbps	wps	wmbps	rpq	rkbpq	wpi	wkbpi	csps	cpups	cspq	cpupq	dbgb1	dbgb2	rss	maxop	p50	p99	tag
10941	0	0	0.0	1132.1	46.9	0.000	0.000	0.103	4.389	49107	37.5	4.488	274	6.7	23.3	7.8	0.078	10918	9404	my5710_rel.cz10a_bee
10753	0	0	0.0	1120.6	46.5	0.000	0.000	0.104	4.426	48816	37.2	4.540	277	6.6	23.1	7.7	0.075	10778	9329	my5720_rel.cz10a_bee
10753	0	0	0.0	1139.0	47.0	0.000	0.000	0.106	4.475	48991	37.1	4.556	276	6.5	23.0	7.6	0.074	10733	9124	my5730_rel.cz10a_bee
10504	0	0	0.0	1111.1	46.0	0.000	0.000	0.106	4.482	44436	36.2	4.230	276	6.5	23.0	7.6	0.074	10518	9153	my5744_rel.cz10a_bee
qr100.L1
qr100.L1: range queries with 100 insert/s per client
Performance metrics for all DBMS, not just the ones listed above. Some are normalized by throughput, others are not. Legend for results is here.
ips	qps	rps	rmbps	wps	wmbps	rpq	rkbpq	wpi	wkbpi	csps	cpups	cspq	cpupq	dbgb1	dbgb2	rss	maxop	p50	p99	tag
100	4237	0	0.0	113.7	3.2	0.000	0.000	1.140	32.916	16728	12.6	3.948	238	6.7	23.3	7.8	0.005	4190	3979	my5710_rel.cz10a_bee
100	4187	0	0.0	103.1	2.9	0.000	0.000	1.034	29.747	16501	12.6	3.941	241	6.6	23.1	7.7	0.003	4139	3916	my5720_rel.cz10a_bee
100	4158	0	0.0	109.7	3.1	0.000	0.000	1.101	31.727	16416	12.6	3.948	242	6.5	23.0	7.6	0.008	4093	3915	my5730_rel.cz10a_bee
100	4124	0	0.0	109.6	3.1	0.000	0.000	1.098	31.589	16287	12.5	3.949	242	6.5	23.0	7.6	0.004	4072	3869	my5744_rel.cz10a_bee
qp100.L2
qp100.L2: point queries with 100 insert/s per client
Performance metrics for all DBMS, not just the ones listed above. Some are normalized by throughput, others are not. Legend for results is here.
ips	qps	rps	rmbps	wps	wmbps	rpq	rkbpq	wpi	wkbpi	csps	cpups	cspq	cpupq	dbgb1	dbgb2	rss	maxop	p50	p99	tag
100	3924	0	0.0	24.0	0.5	0.000	0.000	0.241	5.358	16049	13.3	4.090	271	6.7	23.3	7.8	0.006	3836	3596	my5710_rel.cz10a_bee
100	3833	0	0.0	26.2	0.6	0.000	0.000	0.263	5.984	15683	13.4	4.092	280	6.6	23.1	7.7	0.006	3756	3564	my5720_rel.cz10a_bee
100	3796	0	0.0	25.8	0.6	0.000	0.000	0.258	5.872	15534	14.0	4.092	295	6.5	23.0	7.6	0.005	3708	3484	my5730_rel.cz10a_bee
100	3768	0	0.0	24.1	0.5	0.000	0.000	0.242	5.410	15446	13.8	4.100	293	6.5	23.0	7.6	0.004	3675	3436	my5744_rel.cz10a_bee
qr500.L3
qr500.L3: range queries with 500 insert/s per client
Performance metrics for all DBMS, not just the ones listed above. Some are normalized by throughput, others are not. Legend for results is here.
ips	qps	rps	rmbps	wps	wmbps	rpq	rkbpq	wpi	wkbpi	csps	cpups	cspq	cpupq	dbgb1	dbgb2	rss	maxop	p50	p99	tag
499	4222	0	0.0	57.9	1.9	0.000	0.000	0.116	3.954	16583	13.5	3.927	256	6.7	23.3	7.8	0.007	4172	3980	my5710_rel.cz10a_bee
499	4197	0	0.0	69.9	2.3	0.000	0.000	0.140	4.735	16532	13.6	3.939	259	6.6	23.1	7.7	0.004	4139	3946	my5720_rel.cz10a_bee
499	4211	0	0.0	62.2	2.1	0.000	0.000	0.125	4.266	16569	13.5	3.935	256	6.5	23.0	7.6	0.003	4141	3931	my5730_rel.cz10a_bee
499	4108	0	0.0	67.1	2.2	0.000	0.000	0.135	4.582	16193	13.5	3.942	263	6.5	23.0	7.6	0.003	4059	3868	my5744_rel.cz10a_bee
qp500.L4
qp500.L4: point queries with 500 insert/s per client
Performance metrics for all DBMS, not just the ones listed above. Some are normalized by throughput, others are not. Legend for results is here.
ips	qps	rps	rmbps	wps	wmbps	rpq	rkbpq	wpi	wkbpi	csps	cpups	cspq	cpupq	dbgb1	dbgb2	rss	maxop	p50	p99	tag
499	3780	0	0.0	80.8	2.6	0.000	0.000	0.162	5.406	15731	14.2	4.162	301	6.7	23.3	7.8	0.007	3708	3500	my5710_rel.cz10a_bee
499	3765	0	0.0	82.6	2.7	0.000	0.000	0.166	5.541	15687	13.8	4.166	293	6.6	23.1	7.7	0.008	3724	3516	my5720_rel.cz10a_bee
499	3790	0	0.0	85.4	2.8	0.000	0.000	0.171	5.744	15791	14.4	4.167	304	6.5	23.0	7.6	0.005	3707	3467	my5730_rel.cz10a_bee
499	3697	0	0.0	88.6	2.9	0.000	0.000	0.178	5.918	15456	13.9	4.181	301	6.5	23.0	7.6	0.005	3645	3420	my5744_rel.cz10a_bee
qr1000.L5
qr1000.L5: range queries with 1000 insert/s per client
Performance metrics for all DBMS, not just the ones listed above. Some are normalized by throughput, others are not. Legend for results is here.
ips	qps	rps	rmbps	wps	wmbps	rpq	rkbpq	wpi	wkbpi	csps	cpups	cspq	cpupq	dbgb1	dbgb2	rss	maxop	p50	p99	tag
998	4280	0	0.0	124.4	4.5	0.000	0.000	0.125	4.576	17176	14.6	4.013	273	6.7	23.3	7.8	0.007	4219	3995	my5710_rel.cz10a_bee
998	4174	0	0.0	119.1	4.3	0.000	0.000	0.119	4.437	16773	14.5	4.018	278	6.6	23.1	7.7	0.005	4126	3915	my5720_rel.cz10a_bee
997	4164	0	0.0	121.3	4.4	0.000	0.000	0.122	4.516	16757	14.6	4.025	281	6.5	23.0	7.6	0.008	4094	3884	my5730_rel.cz10a_bee
998	4118	0	0.0	121.3	4.4	0.000	0.000	0.122	4.517	16575	14.6	4.025	284	6.5	23.0	7.6	0.004	4060	3836	my5744_rel.cz10a_bee
qp1000.L6
qp1000.L6: point queries with 1000 insert/s per client
Performance metrics for all DBMS, not just the ones listed above. Some are normalized by throughput, others are not. Legend for results is here.
ips	qps	rps	rmbps	wps	wmbps	rpq	rkbpq	wpi	wkbpi	csps	cpups	cspq	cpupq	dbgb1	dbgb2	rss	maxop	p50	p99	tag
998	3832	0	0.0	121.8	4.4	0.000	0.000	0.122	4.502	16243	15.1	4.239	315	6.7	23.3	7.8	0.007	3740	3530	my5710_rel.cz10a_bee
997	3799	0	0.0	121.8	4.4	0.000	0.000	0.122	4.532	16126	15.2	4.245	320	6.6	23.1	7.7	0.004	3724	3516	my5720_rel.cz10a_bee
998	3745	0	0.0	115.0	4.2	0.000	0.000	0.115	4.307	15882	15.0	4.240	320	6.5	23.0	7.6	0.006	3676	3452	my5730_rel.cz10a_bee
998	3686	0	0.0	115.9	4.2	0.000	0.000	0.116	4.338	15667	15.2	4.251	330	6.5	23.0	7.6	0.006	3629	3418	my5744_rel.cz10a_bee
l.i0
- l.i0: load without secondary indexes
- Legend for results is here.
- Each entry lists the percentage of responses that fit in that bucket (slower than max time for previous bucket, faster than min time for next bucket).
Insert response time histogram
256us	1ms	4ms	16ms	64ms	256ms	1s	4s	16s	gt	max	tag
0.000	4.581	95.127	0.284	0.006	0.002	0.000	0.000	0.000	0.000	0.118	my5710_rel.cz10a_bee
0.000	8.024	91.683	0.286	0.005	0.002	0.000	0.000	0.000	0.000	0.105	my5720_rel.cz10a_bee
0.000	3.060	96.600	0.199	0.139	0.002	0.000	0.000	0.000	0.000	0.111	my5730_rel.cz10a_bee
0.000	2.324	97.334	0.200	0.140	0.002	0.000	0.000	0.000	0.000	0.111	my5744_rel.cz10a_bee
l.x
- l.x: create secondary indexes
- Legend for results is here.
- Each entry lists the percentage of responses that fit in that bucket (slower than max time for previous bucket, faster than min time for next bucket).
TODO - determine whether there is data for create index response time
l.i1
- l.i1: continue load after secondary indexes created with 50 inserts per transaction
- Legend for results is here.
- Each entry lists the percentage of responses that fit in that bucket (slower than max time for previous bucket, faster than min time for next bucket).
Insert response time histogram
256us	1ms	4ms	16ms	64ms	256ms	1s	4s	16s	gt	max	tag
0.000	0.000	97.367	2.603	0.027	0.003	0.000	0.000	0.000	0.000	0.098	my5710_rel.cz10a_bee
0.000	0.000	96.925	3.047	0.025	0.003	0.000	0.000	0.000	0.000	0.093	my5720_rel.cz10a_bee
0.000	0.000	96.991	2.937	0.069	0.003	0.000	0.000	0.000	0.000	0.086	my5730_rel.cz10a_bee
0.000	0.000	96.978	2.950	0.069	0.003	0.000	0.000	0.000	0.000	0.083	my5744_rel.cz10a_bee
Delete response time histogram
256us	1ms	4ms	16ms	64ms	256ms	1s	4s	16s	gt	max	tag
0.000	0.000	98.247	1.740	0.010	0.003	0.000	0.000	0.000	0.000	0.103	my5710_rel.cz10a_bee
0.000	0.000	97.768	2.219	0.010	0.003	0.000	0.000	0.000	0.000	0.093	my5720_rel.cz10a_bee
0.000	0.000	97.784	2.195	0.018	0.003	0.000	0.000	0.000	0.000	0.087	my5730_rel.cz10a_bee
0.000	0.000	97.721	2.261	0.015	0.003	0.000	0.000	0.000	0.000	0.088	my5744_rel.cz10a_bee
l.i2
- l.i2: continue load after secondary indexes created with 5 inserts per transaction
- Legend for results is here.
- Each entry lists the percentage of responses that fit in that bucket (slower than max time for previous bucket, faster than min time for next bucket).
Insert response time histogram
256us	1ms	4ms	16ms	64ms	256ms	1s	4s	16s	gt	max	tag
0.142	99.604	0.052	0.201	0.001	nonzero	0.000	0.000	0.000	0.000	0.078	my5710_rel.cz10a_bee
0.084	99.639	0.060	0.216	0.001	nonzero	0.000	0.000	0.000	0.000	0.075	my5720_rel.cz10a_bee
0.026	99.712	0.046	0.214	0.001	nonzero	0.000	0.000	0.000	0.000	0.074	my5730_rel.cz10a_bee
0.038	99.678	0.055	0.228	0.001	nonzero	0.000	0.000	0.000	0.000	0.074	my5744_rel.cz10a_bee
Delete response time histogram
256us	1ms	4ms	16ms	64ms	256ms	1s	4s	16s	gt	max	tag
0.169	99.605	0.024	0.201	0.001	nonzero	0.000	0.000	0.000	0.000	0.079	my5710_rel.cz10a_bee
0.053	99.707	0.023	0.215	0.001	nonzero	0.000	0.000	0.000	0.000	0.075	my5720_rel.cz10a_bee
0.066	99.696	0.024	0.213	0.001	nonzero	0.000	0.000	0.000	0.000	0.074	my5730_rel.cz10a_bee
0.158	99.583	0.033	0.226	0.001	nonzero	0.000	0.000	0.000	0.000	0.074	my5744_rel.cz10a_bee
qr100.L1
- qr100.L1: range queries with 100 insert/s per client
- Legend for results is here.
- Each entry lists the percentage of responses that fit in that bucket (slower than max time for previous bucket, faster than min time for next bucket).
Query response time histogram
256us	1ms	4ms	16ms	64ms	256ms	1s	4s	16s	gt	max	tag
73.134	26.865	nonzero	nonzero	0.000	0.000	0.000	0.000	0.000	0.000	0.005	my5710_rel.cz10a_bee
72.645	27.355	nonzero	0.000	0.000	0.000	0.000	0.000	0.000	0.000	0.003	my5720_rel.cz10a_bee
70.938	29.061	nonzero	nonzero	0.000	0.000	0.000	0.000	0.000	0.000	0.008	my5730_rel.cz10a_bee
70.406	29.594	nonzero	nonzero	0.000	0.000	0.000	0.000	0.000	0.000	0.004	my5744_rel.cz10a_bee
Insert response time histogram
256us	1ms	4ms	16ms	64ms	256ms	1s	4s	16s	gt	max	tag
0.000	0.000	99.444	0.556	0.000	0.000	0.000	0.000	0.000	0.000	0.015	my5710_rel.cz10a_bee
0.000	0.000	99.500	0.500	0.000	0.000	0.000	0.000	0.000	0.000	0.013	my5720_rel.cz10a_bee
0.000	0.000	98.250	1.639	0.111	0.000	0.000	0.000	0.000	0.000	0.028	my5730_rel.cz10a_bee
0.000	0.000	99.583	0.417	0.000	0.000	0.000	0.000	0.000	0.000	0.009	my5744_rel.cz10a_bee
Delete response time histogram
256us	1ms	4ms	16ms	64ms	256ms	1s	4s	16s	gt	max	tag
0.000	0.000	99.417	0.583	0.000	0.000	0.000	0.000	0.000	0.000	0.012	my5710_rel.cz10a_bee
0.000	0.000	99.611	0.389	0.000	0.000	0.000	0.000	0.000	0.000	0.014	my5720_rel.cz10a_bee
0.000	0.000	98.611	1.333	0.056	0.000	0.000	0.000	0.000	0.000	0.023	my5730_rel.cz10a_bee
0.000	0.000	99.639	0.361	0.000	0.000	0.000	0.000	0.000	0.000	0.009	my5744_rel.cz10a_bee
qp100.L2
- qp100.L2: point queries with 100 insert/s per client
- Legend for results is here.
- Each entry lists the percentage of responses that fit in that bucket (slower than max time for previous bucket, faster than min time for next bucket).
Query response time histogram
256us	1ms	4ms	16ms	64ms	256ms	1s	4s	16s	gt	max	tag
87.925	12.073	0.002	nonzero	0.000	0.000	0.000	0.000	0.000	0.000	0.006	my5710_rel.cz10a_bee
86.136	13.861	0.002	nonzero	0.000	0.000	0.000	0.000	0.000	0.000	0.006	my5720_rel.cz10a_bee
84.521	15.477	0.002	nonzero	0.000	0.000	0.000	0.000	0.000	0.000	0.005	my5730_rel.cz10a_bee
83.898	16.101	0.001	0.000	0.000	0.000	0.000	0.000	0.000	0.000	0.004	my5744_rel.cz10a_bee
Insert response time histogram
256us	1ms	4ms	16ms	64ms	256ms	1s	4s	16s	gt	max	tag
0.000	0.000	99.389	0.611	0.000	0.000	0.000	0.000	0.000	0.000	0.015	my5710_rel.cz10a_bee
0.000	0.000	99.472	0.528	0.000	0.000	0.000	0.000	0.000	0.000	0.009	my5720_rel.cz10a_bee
0.000	0.000	99.611	0.389	0.000	0.000	0.000	0.000	0.000	0.000	0.016	my5730_rel.cz10a_bee
0.000	0.000	99.500	0.500	0.000	0.000	0.000	0.000	0.000	0.000	0.013	my5744_rel.cz10a_bee
Delete response time histogram
256us	1ms	4ms	16ms	64ms	256ms	1s	4s	16s	gt	max	tag
0.000	0.000	99.389	0.611	0.000	0.000	0.000	0.000	0.000	0.000	0.012	my5710_rel.cz10a_bee
0.000	0.000	99.500	0.500	0.000	0.000	0.000	0.000	0.000	0.000	0.008	my5720_rel.cz10a_bee
0.000	0.000	99.667	0.333	0.000	0.000	0.000	0.000	0.000	0.000	0.016	my5730_rel.cz10a_bee
0.000	0.000	99.444	0.556	0.000	0.000	0.000	0.000	0.000	0.000	0.013	my5744_rel.cz10a_bee
qr500.L3
- qr500.L3: range queries with 500 insert/s per client
- Legend for results is here.
- Each entry lists the percentage of responses that fit in that bucket (slower than max time for previous bucket, faster than min time for next bucket).
Query response time histogram
256us	1ms	4ms	16ms	64ms	256ms	1s	4s	16s	gt	max	tag
71.909	28.090	nonzero	nonzero	0.000	0.000	0.000	0.000	0.000	0.000	0.007	my5710_rel.cz10a_bee
71.551	28.449	nonzero	nonzero	0.000	0.000	0.000	0.000	0.000	0.000	0.004	my5720_rel.cz10a_bee
71.811	28.189	0.001	0.000	0.000	0.000	0.000	0.000	0.000	0.000	0.003	my5730_rel.cz10a_bee
69.972	30.028	nonzero	0.000	0.000	0.000	0.000	0.000	0.000	0.000	0.003	my5744_rel.cz10a_bee
Insert response time histogram
256us	1ms	4ms	16ms	64ms	256ms	1s	4s	16s	gt	max	tag
0.000	0.000	99.633	0.367	0.000	0.000	0.000	0.000	0.000	0.000	0.014	my5710_rel.cz10a_bee
0.000	0.000	99.417	0.583	0.000	0.000	0.000	0.000	0.000	0.000	0.014	my5720_rel.cz10a_bee
0.000	0.000	99.361	0.639	0.000	0.000	0.000	0.000	0.000	0.000	0.009	my5730_rel.cz10a_bee
0.000	0.000	99.556	0.444	0.000	0.000	0.000	0.000	0.000	0.000	0.012	my5744_rel.cz10a_bee
Delete response time histogram
256us	1ms	4ms	16ms	64ms	256ms	1s	4s	16s	gt	max	tag
0.000	0.000	99.728	0.272	0.000	0.000	0.000	0.000	0.000	0.000	0.014	my5710_rel.cz10a_bee
0.000	0.000	99.639	0.361	0.000	0.000	0.000	0.000	0.000	0.000	0.012	my5720_rel.cz10a_bee
0.000	0.000	99.628	0.372	0.000	0.000	0.000	0.000	0.000	0.000	0.009	my5730_rel.cz10a_bee
0.000	0.000	99.667	0.333	0.000	0.000	0.000	0.000	0.000	0.000	0.010	my5744_rel.cz10a_bee
qp500.L4
- qp500.L4: point queries with 500 insert/s per client
- Legend for results is here.
- Each entry lists the percentage of responses that fit in that bucket (slower than max time for previous bucket, faster than min time for next bucket).
Query response time histogram
256us	1ms	4ms	16ms	64ms	256ms	1s	4s	16s	gt	max	tag
83.306	16.688	0.006	nonzero	0.000	0.000	0.000	0.000	0.000	0.000	0.007	my5710_rel.cz10a_bee
82.921	17.073	0.006	nonzero	0.000	0.000	0.000	0.000	0.000	0.000	0.008	my5720_rel.cz10a_bee
83.558	16.438	0.004	nonzero	0.000	0.000	0.000	0.000	0.000	0.000	0.005	my5730_rel.cz10a_bee
81.915	18.080	0.005	nonzero	0.000	0.000	0.000	0.000	0.000	0.000	0.005	my5744_rel.cz10a_bee
Insert response time histogram
256us	1ms	4ms	16ms	64ms	256ms	1s	4s	16s	gt	max	tag
0.000	0.000	99.544	0.456	0.000	0.000	0.000	0.000	0.000	0.000	0.015	my5710_rel.cz10a_bee
0.000	0.000	99.317	0.683	0.000	0.000	0.000	0.000	0.000	0.000	0.014	my5720_rel.cz10a_bee
0.000	0.000	99.500	0.500	0.000	0.000	0.000	0.000	0.000	0.000	0.011	my5730_rel.cz10a_bee
0.000	0.000	99.556	0.444	0.000	0.000	0.000	0.000	0.000	0.000	0.011	my5744_rel.cz10a_bee
Delete response time histogram
256us	1ms	4ms	16ms	64ms	256ms	1s	4s	16s	gt	max	tag
0.000	0.000	99.656	0.344	0.000	0.000	0.000	0.000	0.000	0.000	0.013	my5710_rel.cz10a_bee
0.000	0.000	99.561	0.439	0.000	0.000	0.000	0.000	0.000	0.000	0.014	my5720_rel.cz10a_bee
0.000	0.000	99.672	0.328	0.000	0.000	0.000	0.000	0.000	0.000	0.011	my5730_rel.cz10a_bee
0.000	0.000	99.661	0.339	0.000	0.000	0.000	0.000	0.000	0.000	0.011	my5744_rel.cz10a_bee
qr1000.L5
- qr1000.L5: range queries with 1000 insert/s per client
- Legend for results is here.
- Each entry lists the percentage of responses that fit in that bucket (slower than max time for previous bucket, faster than min time for next bucket).
Query response time histogram
256us	1ms	4ms	16ms	64ms	256ms	1s	4s	16s	gt	max	tag
73.741	26.258	0.001	nonzero	0.000	0.000	0.000	0.000	0.000	0.000	0.007	my5710_rel.cz10a_bee
71.787	28.212	0.001	nonzero	0.000	0.000	0.000	0.000	0.000	0.000	0.005	my5720_rel.cz10a_bee
71.627	28.372	0.001	nonzero	0.000	0.000	0.000	0.000	0.000	0.000	0.008	my5730_rel.cz10a_bee
70.707	29.292	0.001	nonzero	0.000	0.000	0.000	0.000	0.000	0.000	0.004	my5744_rel.cz10a_bee
Insert response time histogram
256us	1ms	4ms	16ms	64ms	256ms	1s	4s	16s	gt	max	tag
0.000	0.000	99.539	0.458	0.003	0.000	0.000	0.000	0.000	0.000	0.039	my5710_rel.cz10a_bee
0.000	0.000	99.578	0.419	0.003	0.000	0.000	0.000	0.000	0.000	0.049	my5720_rel.cz10a_bee
0.000	0.000	99.286	0.711	0.003	0.000	0.000	0.000	0.000	0.000	0.040	my5730_rel.cz10a_bee
0.000	0.000	99.464	0.531	0.006	0.000	0.000	0.000	0.000	0.000	0.042	my5744_rel.cz10a_bee
Delete response time histogram
256us	1ms	4ms	16ms	64ms	256ms	1s	4s	16s	gt	max	tag
0.000	0.000	99.694	0.303	0.003	0.000	0.000	0.000	0.000	0.000	0.040	my5710_rel.cz10a_bee
0.000	0.000	99.764	0.233	0.003	0.000	0.000	0.000	0.000	0.000	0.048	my5720_rel.cz10a_bee
0.000	0.000	99.486	0.511	0.003	0.000	0.000	0.000	0.000	0.000	0.038	my5730_rel.cz10a_bee
0.000	0.000	99.608	0.389	0.003	0.000	0.000	0.000	0.000	0.000	0.043	my5744_rel.cz10a_bee
qp1000.L6
- qp1000.L6: point queries with 1000 insert/s per client
- Legend for results is here.
- Each entry lists the percentage of responses that fit in that bucket (slower than max time for previous bucket, faster than min time for next bucket).
Query response time histogram
256us	1ms	4ms	16ms	64ms	256ms	1s	4s	16s	gt	max	tag
83.235	16.755	0.010	nonzero	0.000	0.000	0.000	0.000	0.000	0.000	0.007	my5710_rel.cz10a_bee
82.878	17.112	0.010	nonzero	0.000	0.000	0.000	0.000	0.000	0.000	0.004	my5720_rel.cz10a_bee
81.611	18.378	0.011	nonzero	0.000	0.000	0.000	0.000	0.000	0.000	0.006	my5730_rel.cz10a_bee
80.690	19.301	0.008	nonzero	0.000	0.000	0.000	0.000	0.000	0.000	0.006	my5744_rel.cz10a_bee
Insert response time histogram
256us	1ms	4ms	16ms	64ms	256ms	1s	4s	16s	gt	max	tag
0.000	0.000	99.386	0.608	0.006	0.000	0.000	0.000	0.000	0.000	0.046	my5710_rel.cz10a_bee
0.000	0.000	99.358	0.639	0.003	0.000	0.000	0.000	0.000	0.000	0.040	my5720_rel.cz10a_bee
0.000	0.000	99.325	0.672	0.003	0.000	0.000	0.000	0.000	0.000	0.049	my5730_rel.cz10a_bee
0.000	0.000	99.389	0.608	0.003	0.000	0.000	0.000	0.000	0.000	0.050	my5744_rel.cz10a_bee
Delete response time histogram
256us	1ms	4ms	16ms	64ms	256ms	1s	4s	16s	gt	max	tag
0.000	0.000	99.631	0.364	0.006	0.000	0.000	0.000	0.000	0.000	0.049	my5710_rel.cz10a_bee
0.000	0.000	99.608	0.389	0.003	0.000	0.000	0.000	0.000	0.000	0.041	my5720_rel.cz10a_bee
0.000	0.000	99.564	0.433	0.003	0.000	0.000	0.000	0.000	0.000	0.047	my5730_rel.cz10a_bee
0.000	0.000	99.614	0.383	0.003	0.000	0.000	0.000	0.000	0.000	0.047	my5744_rel.cz10a_bee