Introduction
This is a report for the insert benchmark with 160M docs and 8 client(s). It is generated by scripts (bash, awk, sed) and Tufte might not be impressed. An overview of the insert benchmark is here and a short update is here. Below, by DBMS, I mean DBMS+version.config. An example is my8020.c10b40 where my means MySQL, 8020 is version 8.0.20 and c10b40 is the name for the configuration file.
The test server is a c2-standard-30 from GCP with 15 cores, hyperthreads disabled, Ubuntu 22.04 and XFS using SW RAID 0 over 4 local SSDs. The benchmark was run with 8 clients and there were 1, 2 or 3 connections per client. It uses 8 tables with a client per table. It loads 20M rows per table without secondary indexes, creates 3 secondary indexes per table, then inserts 50m+50m rows per table with a delete per insert to avoid growing the table. It then does 6 read+write tests for 1200s each that do queries as fast as possible with 100,100,500,500,1000,1000 inserts/s and the same for deletes/s per client concurrent with the queries. The database is cached in memory. Clients and the DBMS share one server. The per-database configs are in the per-database subdirectories here.
The tested DBMS are:
- fbmy8028_rel_221222.cza1_gcp_c2s30 - MyRocks 8.0.28 compiled on Dec 22, 2023 at git hash 2ad105fc, RocksDB 8.7.0 at git hash 29005f0b, cza1_gcp_c2s30 config
- fbmy8028_rel_221222.cza1ps0_gcp_c2s30 - MyRocks 8.0.28 compiled on Dec 22, 2023 at git hash 2ad105fc, RocksDB 8.7.0 at git hash 29005f0b, cza1ps0_gcp_c2s30 config
- fbmy8032_rel_221222.cza1_gcp_c2s30 - MyRocks 8.0.32 compiled on Dec 22, 2023 at git hash 76707b44, RocksDB 8.7.0 at git hash 29005f0b, cza1_gcp_c2s30 config
- fbmy8032_rel_221222.cza1ps0_gcp_c2s30 - MyRocks 8.0.32 compiled on Dec 22, 2023 at git hash 76707b44, RocksDB 8.7.0 at git hash 29005f0b, cza1ps0_gcp_c2s30 config
Contents
- Summary
- l.i0: load without secondary indexes
- l.x: create secondary indexes
- l.i1: continue load after secondary indexes created with 50 inserts per transaction
- l.i2: continue load after secondary indexes created with 5 inserts per transaction
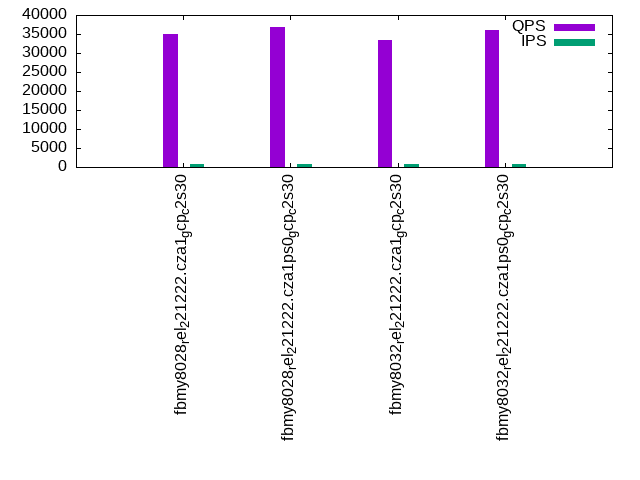
- qr100.L1: range queries with 100 insert/s per client
- qp100.L2: point queries with 100 insert/s per client
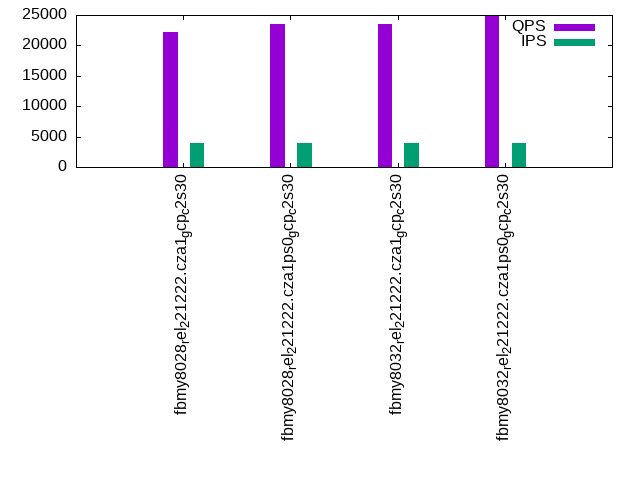
- qr500.L3: range queries with 500 insert/s per client
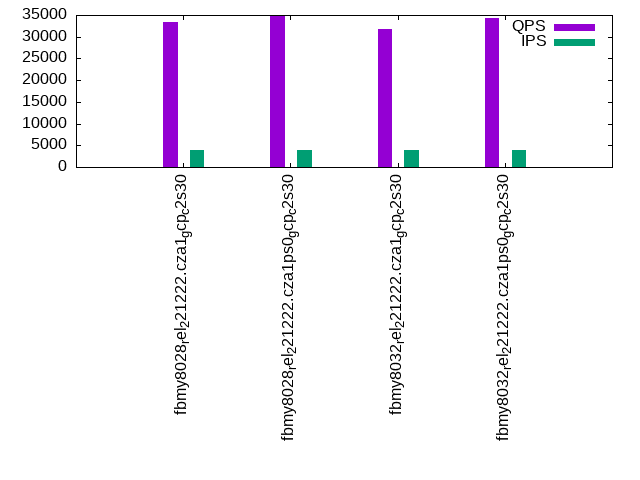
- qp500.L4: point queries with 500 insert/s per client
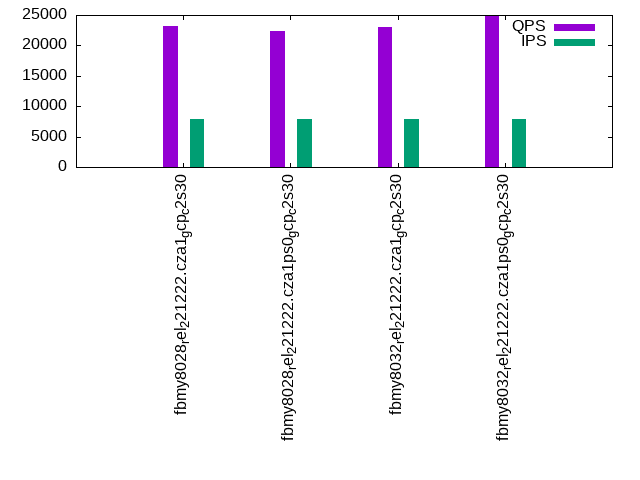
- qr1000.L5: range queries with 1000 insert/s per client
- qp1000.L6: point queries with 1000 insert/s per client
Summary
The numbers are inserts/s for l.i0, l.i1 and l.i2, indexed docs (or rows) /s for l.x and queries/s for qr100, qp100 thru qr1000, qp1000" The values are the average rate over the entire test for inserts (IPS) and queries (QPS). The range of values for IPS and QPS is split into 3 parts: bottom 25%, middle 50%, top 25%. Values in the bottom 25% have a red background, values in the top 25% have a green background and values in the middle have no color. A gray background is used for values that can be ignored because the DBMS did not sustain the target insert rate. Red backgrounds are not used when the minimum value is within 80% of the max value.
| dbms | l.i0 | l.x | l.i1 | l.i2 | qr100 | qp100 | qr500 | qp500 | qr1000 | qp1000 |
|---|---|---|---|---|---|---|---|---|---|---|
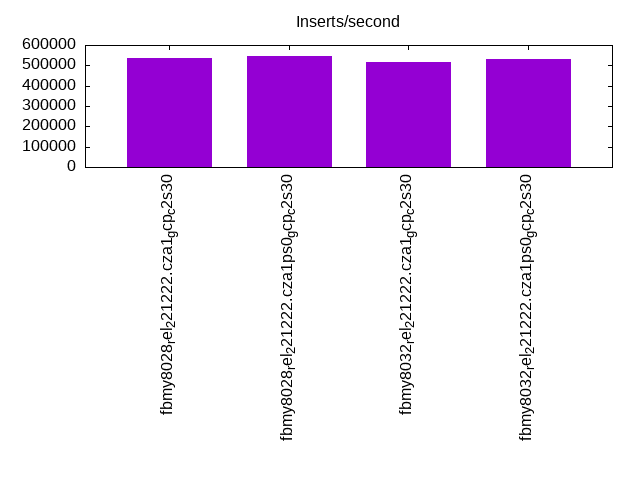
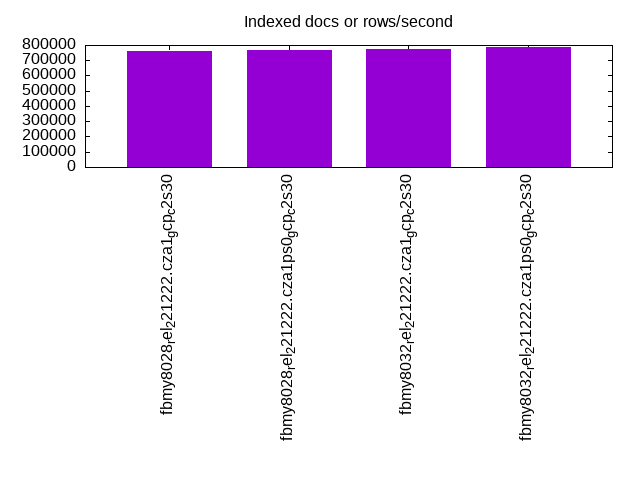
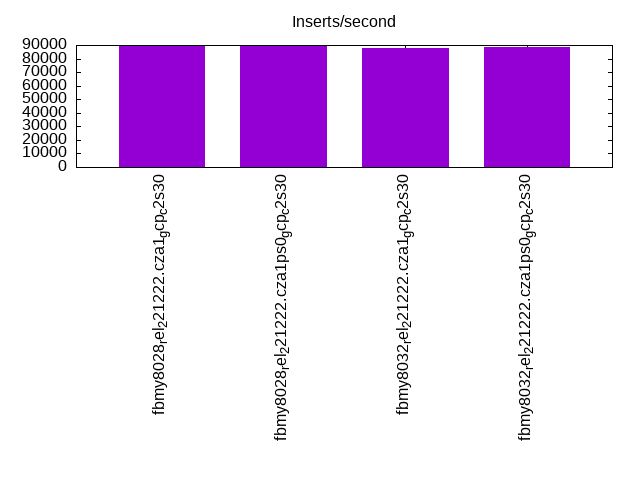
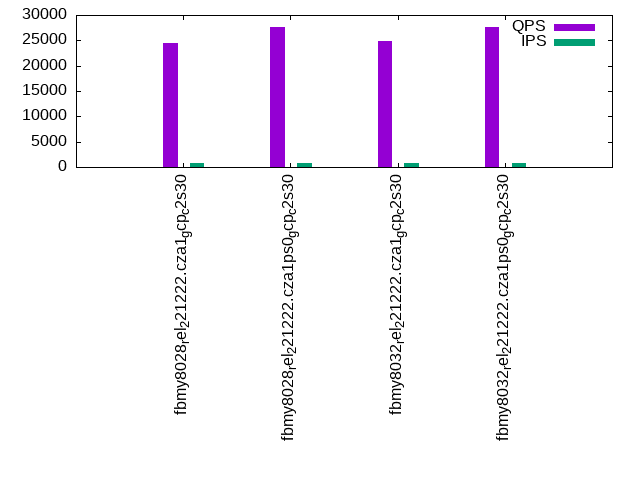
| fbmy8028_rel_221222.cza1_gcp_c2s30 | 536913 | 758294 | 89536 | 41195 | 24414 | 35102 | 22244 | 33340 | 23151 | 31341 |
| fbmy8028_rel_221222.cza1ps0_gcp_c2s30 | 547945 | 769231 | 89661 | 41841 | 27729 | 36801 | 23478 | 34899 | 22420 | 32535 |
| fbmy8032_rel_221222.cza1_gcp_c2s30 | 514469 | 776700 | 88033 | 39960 | 24778 | 33476 | 23576 | 31868 | 23008 | 29824 |
| fbmy8032_rel_221222.cza1ps0_gcp_c2s30 | 531561 | 784314 | 88766 | 41110 | 27605 | 35981 | 24829 | 34367 | 24778 | 32212 |
This table has relative throughput, throughput for the DBMS relative to the DBMS in the first line, using the absolute throughput from the previous table. Values less than 0.95 have a yellow background. Values greater than 1.05 have a blue background.
| dbms | l.i0 | l.x | l.i1 | l.i2 | qr100 | qp100 | qr500 | qp500 | qr1000 | qp1000 |
|---|---|---|---|---|---|---|---|---|---|---|
| fbmy8028_rel_221222.cza1_gcp_c2s30 | 1.00 | 1.00 | 1.00 | 1.00 | 1.00 | 1.00 | 1.00 | 1.00 | 1.00 | 1.00 |
| fbmy8028_rel_221222.cza1ps0_gcp_c2s30 | 1.02 | 1.01 | 1.00 | 1.02 | 1.14 | 1.05 | 1.06 | 1.05 | 0.97 | 1.04 |
| fbmy8032_rel_221222.cza1_gcp_c2s30 | 0.96 | 1.02 | 0.98 | 0.97 | 1.01 | 0.95 | 1.06 | 0.96 | 0.99 | 0.95 |
| fbmy8032_rel_221222.cza1ps0_gcp_c2s30 | 0.99 | 1.03 | 0.99 | 1.00 | 1.13 | 1.03 | 1.12 | 1.03 | 1.07 | 1.03 |
This lists the average rate of inserts/s for the tests that do inserts concurrent with queries. For such tests the query rate is listed in the table above. The read+write tests are setup so that the insert rate should match the target rate every second. Cells that are not at least 95% of the target have a red background to indicate a failure to satisfy the target.
| dbms | qr100.L1 | qp100.L2 | qr500.L3 | qp500.L4 | qr1000.L5 | qp1000.L6 |
|---|---|---|---|---|---|---|
| fbmy8028_rel_221222.cza1_gcp_c2s30 | 794 | 794 | 3970 | 3970 | 7947 | 7947 |
| fbmy8028_rel_221222.cza1ps0_gcp_c2s30 | 793 | 794 | 3970 | 3970 | 7947 | 7947 |
| fbmy8032_rel_221222.cza1_gcp_c2s30 | 794 | 794 | 3967 | 3967 | 7940 | 7940 |
| fbmy8032_rel_221222.cza1ps0_gcp_c2s30 | 793 | 793 | 3970 | 3970 | 7947 | 7947 |
| target | 800 | 800 | 4000 | 4000 | 8000 | 8000 |
l.i0
l.i0: load without secondary indexes. Graphs for performance per 1-second interval are here.
Average throughput:
Insert response time histogram: each cell has the percentage of responses that take <= the time in the header and max is the max response time in seconds. For the max column values in the top 25% of the range have a red background and in the bottom 25% of the range have a green background. The red background is not used when the min value is within 80% of the max value.
| dbms | 256us | 1ms | 4ms | 16ms | 64ms | 256ms | 1s | 4s | 16s | gt | max |
|---|---|---|---|---|---|---|---|---|---|---|---|
| fbmy8028_rel_221222.cza1_gcp_c2s30 | 7.254 | 92.607 | 0.116 | 0.007 | 0.012 | 0.004 | 0.333 | ||||
| fbmy8028_rel_221222.cza1ps0_gcp_c2s30 | 10.193 | 89.652 | 0.132 | 0.007 | 0.011 | 0.006 | 0.333 | ||||
| fbmy8032_rel_221222.cza1_gcp_c2s30 | 2.937 | 96.917 | 0.122 | 0.007 | 0.015 | 0.003 | 0.337 | ||||
| fbmy8032_rel_221222.cza1ps0_gcp_c2s30 | 7.803 | 92.052 | 0.122 | 0.006 | 0.015 | 0.002 | 0.371 |
Performance metrics for the DBMS listed above. Some are normalized by throughput, others are not. Legend for results is here.
ips	qps	rps	rmbps	wps	wmbps	rpq	rkbpq	wpi	wkbpi	csps	cpups	cspq	cpupq	dbgb1	dbgb2	rss	maxop	p50	p99	tag
536913	0	0	0.0	458.8	123.4	0.000	0.000	0.001	0.235	61941	73.2	0.115	20	4.7	6.4	1.7	0.333	72321	50345	fbmy8028_rel_221222.cza1_gcp_c2s30
547945	0	0	0.0	471.9	126.0	0.000	0.000	0.001	0.235	63150	73.1	0.115	20	4.7	6.3	1.4	0.333	74219	46749	fbmy8028_rel_221222.cza1ps0_gcp_c2s30
514469	0	0	0.0	442.3	119.0	0.000	0.000	0.001	0.237	59687	72.3	0.116	21	4.6	6.4	1.7	0.337	70622	46949	fbmy8032_rel_221222.cza1_gcp_c2s30
531561	0	0	0.0	458.5	121.9	0.000	0.000	0.001	0.235	61755	72.4	0.116	20	4.6	6.3	1.5	0.371	72022	48348	fbmy8032_rel_221222.cza1ps0_gcp_c2s30
l.x
l.x: create secondary indexes.
Average throughput:
Performance metrics for the DBMS listed above. Some are normalized by throughput, others are not. Legend for results is here.
ips	qps	rps	rmbps	wps	wmbps	rpq	rkbpq	wpi	wkbpi	csps	cpups	cspq	cpupq	dbgb1	dbgb2	rss	maxop	p50	p99	tag
758294	0	1	0.1	291.1	106.3	0.000	0.000	0.000	0.144	1428	48.6	0.002	10	10.4	12.0	13.2	0.003	NA	NA	fbmy8028_rel_221222.cza1_gcp_c2s30
769231	0	1	0.1	299.4	107.2	0.000	0.000	0.000	0.143	1576	49.8	0.002	10	10.5	12.1	12.8	0.002	NA	NA	fbmy8028_rel_221222.cza1ps0_gcp_c2s30
776700	0	1	0.1	292.9	108.0	0.000	0.000	0.000	0.142	1776	50.0	0.002	10	10.4	12.2	13.1	0.003	NA	NA	fbmy8032_rel_221222.cza1_gcp_c2s30
784314	0	1	0.1	297.7	110.5	0.000	0.000	0.000	0.144	1920	50.2	0.002	10	10.4	12.1	12.8	0.003	NA	NA	fbmy8032_rel_221222.cza1ps0_gcp_c2s30
l.i1
l.i1: continue load after secondary indexes created with 50 inserts per transaction. Graphs for performance per 1-second interval are here.
Average throughput:
Insert response time histogram: each cell has the percentage of responses that take <= the time in the header and max is the max response time in seconds. For the max column values in the top 25% of the range have a red background and in the bottom 25% of the range have a green background. The red background is not used when the min value is within 80% of the max value.
| dbms | 256us | 1ms | 4ms | 16ms | 64ms | 256ms | 1s | 4s | 16s | gt | max |
|---|---|---|---|---|---|---|---|---|---|---|---|
| fbmy8028_rel_221222.cza1_gcp_c2s30 | 0.015 | 35.087 | 64.776 | 0.103 | 0.014 | 0.004 | 0.467 | ||||
| fbmy8028_rel_221222.cza1ps0_gcp_c2s30 | 0.015 | 35.607 | 64.256 | 0.104 | 0.012 | 0.006 | 0.700 | ||||
| fbmy8032_rel_221222.cza1_gcp_c2s30 | 0.003 | 33.124 | 66.755 | 0.098 | 0.014 | 0.005 | nonzero | 1.012 | |||
| fbmy8032_rel_221222.cza1ps0_gcp_c2s30 | 0.009 | 33.943 | 65.927 | 0.102 | 0.014 | 0.005 | 0.388 |
Delete response time histogram: each cell has the percentage of responses that take <= the time in the header and max is the max response time in seconds. For the max column values in the top 25% of the range have a red background and in the bottom 25% of the range have a green background. The red background is not used when the min value is within 80% of the max value.
| dbms | 256us | 1ms | 4ms | 16ms | 64ms | 256ms | 1s | 4s | 16s | gt | max |
|---|---|---|---|---|---|---|---|---|---|---|---|
| fbmy8028_rel_221222.cza1_gcp_c2s30 | 0.019 | 38.363 | 61.502 | 0.098 | 0.014 | 0.004 | 0.477 | ||||
| fbmy8028_rel_221222.cza1ps0_gcp_c2s30 | 0.022 | 38.865 | 60.995 | 0.099 | 0.012 | 0.006 | 0.701 | ||||
| fbmy8032_rel_221222.cza1_gcp_c2s30 | 0.005 | 35.495 | 64.387 | 0.094 | 0.014 | 0.005 | nonzero | 1.011 | |||
| fbmy8032_rel_221222.cza1ps0_gcp_c2s30 | 0.011 | 36.682 | 63.191 | 0.097 | 0.014 | 0.005 | 0.386 |
Performance metrics for the DBMS listed above. Some are normalized by throughput, others are not. Legend for results is here.
ips	qps	rps	rmbps	wps	wmbps	rpq	rkbpq	wpi	wkbpi	csps	cpups	cspq	cpupq	dbgb1	dbgb2	rss	maxop	p50	p99	tag
89536	0	4	0.4	565.2	159.5	0.000	0.004	0.006	1.824	54886	63.3	0.613	106	13.1	13.6	51.7	0.467	11437	7941	fbmy8028_rel_221222.cza1_gcp_c2s30
89661	0	4	0.4	578.1	163.8	0.000	0.004	0.006	1.870	55123	63.5	0.615	106	12.1	12.7	50.4	0.700	11437	8090	fbmy8028_rel_221222.cza1ps0_gcp_c2s30
88033	0	4	0.4	568.6	161.6	0.000	0.004	0.006	1.880	53274	64.5	0.605	110	14.8	15.5	51.7	1.012	11192	7792	fbmy8032_rel_221222.cza1_gcp_c2s30
88766	0	4	0.4	581.8	164.8	0.000	0.004	0.007	1.901	54416	63.8	0.613	108	13.3	13.9	51.1	0.388	11288	8091	fbmy8032_rel_221222.cza1ps0_gcp_c2s30
l.i2
l.i2: continue load after secondary indexes created with 5 inserts per transaction. Graphs for performance per 1-second interval are here.
Average throughput:

Insert response time histogram: each cell has the percentage of responses that take <= the time in the header and max is the max response time in seconds. For the max column values in the top 25% of the range have a red background and in the bottom 25% of the range have a green background. The red background is not used when the min value is within 80% of the max value.
| dbms | 256us | 1ms | 4ms | 16ms | 64ms | 256ms | 1s | 4s | 16s | gt | max |
|---|---|---|---|---|---|---|---|---|---|---|---|
| fbmy8028_rel_221222.cza1_gcp_c2s30 | 0.003 | 79.350 | 20.536 | 0.106 | 0.003 | 0.002 | 0.001 | 0.311 | |||
| fbmy8028_rel_221222.cza1ps0_gcp_c2s30 | 0.011 | 80.828 | 19.054 | 0.102 | 0.003 | 0.002 | 0.001 | 0.334 | |||
| fbmy8032_rel_221222.cza1_gcp_c2s30 | 0.001 | 75.378 | 24.499 | 0.118 | 0.003 | 0.001 | nonzero | 0.315 | |||
| fbmy8032_rel_221222.cza1ps0_gcp_c2s30 | 0.005 | 78.815 | 21.063 | 0.112 | 0.003 | 0.002 | nonzero | 0.302 |
Delete response time histogram: each cell has the percentage of responses that take <= the time in the header and max is the max response time in seconds. For the max column values in the top 25% of the range have a red background and in the bottom 25% of the range have a green background. The red background is not used when the min value is within 80% of the max value.
| dbms | 256us | 1ms | 4ms | 16ms | 64ms | 256ms | 1s | 4s | 16s | gt | max |
|---|---|---|---|---|---|---|---|---|---|---|---|
| fbmy8028_rel_221222.cza1_gcp_c2s30 | 71.213 | 28.671 | 0.110 | 0.003 | 0.002 | 0.001 | 0.312 | ||||
| fbmy8028_rel_221222.cza1ps0_gcp_c2s30 | 73.275 | 26.614 | 0.106 | 0.003 | 0.002 | 0.001 | 0.333 | ||||
| fbmy8032_rel_221222.cza1_gcp_c2s30 | 66.447 | 33.428 | 0.120 | 0.003 | 0.001 | nonzero | 0.286 | ||||
| fbmy8032_rel_221222.cza1ps0_gcp_c2s30 | 70.821 | 29.060 | 0.113 | 0.003 | 0.002 | nonzero | 0.300 |
Performance metrics for the DBMS listed above. Some are normalized by throughput, others are not. Legend for results is here.
ips	qps	rps	rmbps	wps	wmbps	rpq	rkbpq	wpi	wkbpi	csps	cpups	cspq	cpupq	dbgb1	dbgb2	rss	maxop	p50	p99	tag
41195	0	0	0.0	318.3	71.8	0.000	0.000	0.008	1.785	224513	68.3	5.450	249	12.0	12.3	62.3	0.311	5394	3082	fbmy8028_rel_221222.cza1_gcp_c2s30
41841	0	0	0.0	325.2	75.0	0.000	0.000	0.008	1.835	229800	67.6	5.492	242	11.9	12.1	62.1	0.334	5476	3172	fbmy8028_rel_221222.cza1ps0_gcp_c2s30
39960	0	0	0.0	308.4	70.3	0.000	0.000	0.008	1.802	217218	68.4	5.436	257	12.0	12.3	62.4	0.315	5241	3061	fbmy8032_rel_221222.cza1_gcp_c2s30
41110	0	0	0.0	320.4	70.1	0.000	0.000	0.008	1.747	226774	67.6	5.516	247	12.2	12.5	62.4	0.302	5369	3117	fbmy8032_rel_221222.cza1ps0_gcp_c2s30
qr100.L1
qr100.L1: range queries with 100 insert/s per client. Graphs for performance per 1-second interval are here.
Average throughput:
Query response time histogram: each cell has the percentage of responses that take <= the time in the header and max is the max response time in seconds. For max values in the top 25% of the range have a red background and in the bottom 25% of the range have a green background. The red background is not used when the min value is within 80% of the max value.
| dbms | 256us | 1ms | 4ms | 16ms | 64ms | 256ms | 1s | 4s | 16s | gt | max |
|---|---|---|---|---|---|---|---|---|---|---|---|
| fbmy8028_rel_221222.cza1_gcp_c2s30 | 68.634 | 29.315 | 2.051 | nonzero | nonzero | 0.040 | |||||
| fbmy8028_rel_221222.cza1ps0_gcp_c2s30 | 67.027 | 32.090 | 0.883 | nonzero | nonzero | 0.055 | |||||
| fbmy8032_rel_221222.cza1_gcp_c2s30 | 67.401 | 30.173 | 2.426 | nonzero | nonzero | 0.029 | |||||
| fbmy8032_rel_221222.cza1ps0_gcp_c2s30 | 69.470 | 26.344 | 4.186 | nonzero | nonzero | 0.044 |
Insert response time histogram: each cell has the percentage of responses that take <= the time in the header and max is the max response time in seconds. For max values in the top 25% of the range have a red background and in the bottom 25% of the range have a green background. The red background is not used when the min value is within 80% of the max value.
| dbms | 256us | 1ms | 4ms | 16ms | 64ms | 256ms | 1s | 4s | 16s | gt | max |
|---|---|---|---|---|---|---|---|---|---|---|---|
| fbmy8028_rel_221222.cza1_gcp_c2s30 | 0.370 | 98.875 | 0.755 | 0.009 | |||||||
| fbmy8028_rel_221222.cza1ps0_gcp_c2s30 | 1.495 | 96.078 | 2.422 | 0.005 | 0.020 | ||||||
| fbmy8032_rel_221222.cza1_gcp_c2s30 | 0.453 | 99.219 | 0.328 | 0.005 | |||||||
| fbmy8032_rel_221222.cza1ps0_gcp_c2s30 | 1.953 | 98.026 | 0.021 | 0.008 |
Delete response time histogram: each cell has the percentage of responses that take <= the time in the header and max is the max response time in seconds. For max values in the top 25% of the range have a red background and in the bottom 25% of the range have a green background. The red background is not used when the min value is within 80% of the max value.
| dbms | 256us | 1ms | 4ms | 16ms | 64ms | 256ms | 1s | 4s | 16s | gt | max |
|---|---|---|---|---|---|---|---|---|---|---|---|
| fbmy8028_rel_221222.cza1_gcp_c2s30 | 4.224 | 95.260 | 0.510 | 0.005 | 0.019 | ||||||
| fbmy8028_rel_221222.cza1ps0_gcp_c2s30 | 6.328 | 91.833 | 1.839 | 0.008 | |||||||
| fbmy8032_rel_221222.cza1_gcp_c2s30 | 2.599 | 97.130 | 0.271 | 0.015 | |||||||
| fbmy8032_rel_221222.cza1ps0_gcp_c2s30 | 7.193 | 92.771 | 0.031 | 0.005 | 0.017 |
Performance metrics for the DBMS listed above. Some are normalized by throughput, others are not. Legend for results is here.
ips	qps	rps	rmbps	wps	wmbps	rpq	rkbpq	wpi	wkbpi	csps	cpups	cspq	cpupq	dbgb1	dbgb2	rss	maxop	p50	p99	tag
794	24414	0	0.0	15.1	3.3	0.000	0.000	0.019	4.258	94704	53.2	3.879	327	11.4	11.8	63.5	0.040	3676	3388	fbmy8028_rel_221222.cza1_gcp_c2s30
793	27729	0	0.0	14.3	3.0	0.000	0.000	0.018	3.881	107594	52.8	3.880	286	11.4	11.8	63.2	0.055	2701	2461	fbmy8028_rel_221222.cza1ps0_gcp_c2s30
794	24778	0	0.0	12.1	2.5	0.000	0.000	0.015	3.192	96044	53.0	3.876	321	11.4	11.8	63.6	0.029	3021	2765	fbmy8032_rel_221222.cza1_gcp_c2s30
793	27605	0	0.0	15.9	3.5	0.000	0.000	0.020	4.570	107111	52.9	3.880	287	11.4	11.8	63.9	0.044	4091	3693	fbmy8032_rel_221222.cza1ps0_gcp_c2s30
qp100.L2
qp100.L2: point queries with 100 insert/s per client. Graphs for performance per 1-second interval are here.
Average throughput:
Query response time histogram: each cell has the percentage of responses that take <= the time in the header and max is the max response time in seconds. For max values in the top 25% of the range have a red background and in the bottom 25% of the range have a green background. The red background is not used when the min value is within 80% of the max value.
| dbms | 256us | 1ms | 4ms | 16ms | 64ms | 256ms | 1s | 4s | 16s | gt | max |
|---|---|---|---|---|---|---|---|---|---|---|---|
| fbmy8028_rel_221222.cza1_gcp_c2s30 | 95.841 | 4.157 | 0.001 | nonzero | 0.001 | 0.020 | |||||
| fbmy8028_rel_221222.cza1ps0_gcp_c2s30 | 97.001 | 2.997 | 0.001 | nonzero | 0.001 | 0.039 | |||||
| fbmy8032_rel_221222.cza1_gcp_c2s30 | 93.339 | 6.659 | 0.001 | nonzero | 0.001 | 0.021 | |||||
| fbmy8032_rel_221222.cza1ps0_gcp_c2s30 | 96.377 | 3.621 | 0.001 | nonzero | 0.001 | 0.034 |
Insert response time histogram: each cell has the percentage of responses that take <= the time in the header and max is the max response time in seconds. For max values in the top 25% of the range have a red background and in the bottom 25% of the range have a green background. The red background is not used when the min value is within 80% of the max value.
| dbms | 256us | 1ms | 4ms | 16ms | 64ms | 256ms | 1s | 4s | 16s | gt | max |
|---|---|---|---|---|---|---|---|---|---|---|---|
| fbmy8028_rel_221222.cza1_gcp_c2s30 | 0.531 | 99.318 | 0.151 | 0.006 | |||||||
| fbmy8028_rel_221222.cza1ps0_gcp_c2s30 | 0.901 | 98.552 | 0.547 | 0.006 | |||||||
| fbmy8032_rel_221222.cza1_gcp_c2s30 | 0.302 | 99.208 | 0.490 | 0.008 | |||||||
| fbmy8032_rel_221222.cza1ps0_gcp_c2s30 | 0.344 | 98.510 | 1.146 | 0.007 |
Delete response time histogram: each cell has the percentage of responses that take <= the time in the header and max is the max response time in seconds. For max values in the top 25% of the range have a red background and in the bottom 25% of the range have a green background. The red background is not used when the min value is within 80% of the max value.
| dbms | 256us | 1ms | 4ms | 16ms | 64ms | 256ms | 1s | 4s | 16s | gt | max |
|---|---|---|---|---|---|---|---|---|---|---|---|
| fbmy8028_rel_221222.cza1_gcp_c2s30 | 6.396 | 93.438 | 0.167 | 0.006 | |||||||
| fbmy8028_rel_221222.cza1ps0_gcp_c2s30 | 8.328 | 91.292 | 0.380 | 0.014 | |||||||
| fbmy8032_rel_221222.cza1_gcp_c2s30 | 3.057 | 96.479 | 0.464 | 0.008 | |||||||
| fbmy8032_rel_221222.cza1ps0_gcp_c2s30 | 4.391 | 94.755 | 0.854 | 0.012 |
Performance metrics for the DBMS listed above. Some are normalized by throughput, others are not. Legend for results is here.
ips	qps	rps	rmbps	wps	wmbps	rpq	rkbpq	wpi	wkbpi	csps	cpups	cspq	cpupq	dbgb1	dbgb2	rss	maxop	p50	p99	tag
794	35102	0	0.0	12.5	3.3	0.000	0.000	0.016	4.265	145619	54.0	4.148	231	11.4	12.0	74.5	0.020	4443	3757	fbmy8028_rel_221222.cza1_gcp_c2s30
794	36801	0	0.0	12.8	3.4	0.000	0.000	0.016	4.410	153033	53.2	4.158	217	11.4	12.0	73.7	0.039	4651	4028	fbmy8028_rel_221222.cza1ps0_gcp_c2s30
794	33476	0	0.0	11.5	2.8	0.000	0.000	0.015	3.658	138206	53.9	4.128	242	11.5	12.1	73.8	0.021	4205	3596	fbmy8032_rel_221222.cza1_gcp_c2s30
793	35981	0	0.0	13.8	3.8	0.000	0.000	0.017	4.855	149559	53.2	4.157	222	11.4	12.0	74.9	0.034	4587	3932	fbmy8032_rel_221222.cza1ps0_gcp_c2s30
qr500.L3
qr500.L3: range queries with 500 insert/s per client. Graphs for performance per 1-second interval are here.
Average throughput:
Query response time histogram: each cell has the percentage of responses that take <= the time in the header and max is the max response time in seconds. For max values in the top 25% of the range have a red background and in the bottom 25% of the range have a green background. The red background is not used when the min value is within 80% of the max value.
| dbms | 256us | 1ms | 4ms | 16ms | 64ms | 256ms | 1s | 4s | 16s | gt | max |
|---|---|---|---|---|---|---|---|---|---|---|---|
| fbmy8028_rel_221222.cza1_gcp_c2s30 | 68.845 | 26.909 | 4.246 | 0.001 | nonzero | 0.060 | |||||
| fbmy8028_rel_221222.cza1ps0_gcp_c2s30 | 67.997 | 29.131 | 2.872 | 0.001 | nonzero | nonzero | 0.072 | ||||
| fbmy8032_rel_221222.cza1_gcp_c2s30 | 70.732 | 25.381 | 3.886 | 0.001 | nonzero | 0.061 | |||||
| fbmy8032_rel_221222.cza1ps0_gcp_c2s30 | 67.381 | 29.972 | 2.647 | 0.001 | nonzero | 0.061 |
Insert response time histogram: each cell has the percentage of responses that take <= the time in the header and max is the max response time in seconds. For max values in the top 25% of the range have a red background and in the bottom 25% of the range have a green background. The red background is not used when the min value is within 80% of the max value.
| dbms | 256us | 1ms | 4ms | 16ms | 64ms | 256ms | 1s | 4s | 16s | gt | max |
|---|---|---|---|---|---|---|---|---|---|---|---|
| fbmy8028_rel_221222.cza1_gcp_c2s30 | 0.721 | 75.793 | 23.472 | 0.015 | 0.022 | ||||||
| fbmy8028_rel_221222.cza1ps0_gcp_c2s30 | 0.973 | 72.482 | 26.522 | 0.023 | 0.022 | ||||||
| fbmy8032_rel_221222.cza1_gcp_c2s30 | 0.342 | 74.067 | 25.552 | 0.040 | 0.020 | ||||||
| fbmy8032_rel_221222.cza1ps0_gcp_c2s30 | 0.572 | 77.045 | 22.360 | 0.023 | 0.021 |
Delete response time histogram: each cell has the percentage of responses that take <= the time in the header and max is the max response time in seconds. For max values in the top 25% of the range have a red background and in the bottom 25% of the range have a green background. The red background is not used when the min value is within 80% of the max value.
| dbms | 256us | 1ms | 4ms | 16ms | 64ms | 256ms | 1s | 4s | 16s | gt | max |
|---|---|---|---|---|---|---|---|---|---|---|---|
| fbmy8028_rel_221222.cza1_gcp_c2s30 | 2.649 | 75.254 | 22.082 | 0.015 | 0.023 | ||||||
| fbmy8028_rel_221222.cza1ps0_gcp_c2s30 | 3.765 | 71.089 | 25.130 | 0.017 | 0.023 | ||||||
| fbmy8032_rel_221222.cza1_gcp_c2s30 | 1.418 | 74.323 | 24.216 | 0.044 | 0.030 | ||||||
| fbmy8032_rel_221222.cza1ps0_gcp_c2s30 | 2.048 | 76.842 | 21.089 | 0.022 | 0.026 |
Performance metrics for the DBMS listed above. Some are normalized by throughput, others are not. Legend for results is here.
ips	qps	rps	rmbps	wps	wmbps	rpq	rkbpq	wpi	wkbpi	csps	cpups	cspq	cpupq	dbgb1	dbgb2	rss	maxop	p50	p99	tag
3970	22244	0	0.0	53.8	17.8	0.000	0.000	0.014	4.598	87081	56.7	3.915	382	11.4	13.1	79.4	0.060	3069	2606	fbmy8028_rel_221222.cza1_gcp_c2s30
3970	23478	0	0.0	59.0	19.4	0.000	0.000	0.015	4.994	92048	56.2	3.921	359	11.4	13.1	79.1	0.072	3037	2269	fbmy8028_rel_221222.cza1ps0_gcp_c2s30
3967	23576	0	0.0	55.2	18.2	0.000	0.000	0.014	4.708	92281	56.8	3.914	361	11.5	13.2	78.7	0.061	3932	2493	fbmy8032_rel_221222.cza1_gcp_c2s30
3970	24829	0	0.0	58.0	18.7	0.000	0.000	0.015	4.823	97213	56.2	3.915	340	11.5	13.2	79.5	0.061	3788	3196	fbmy8032_rel_221222.cza1ps0_gcp_c2s30
qp500.L4
qp500.L4: point queries with 500 insert/s per client. Graphs for performance per 1-second interval are here.
Average throughput:
Query response time histogram: each cell has the percentage of responses that take <= the time in the header and max is the max response time in seconds. For max values in the top 25% of the range have a red background and in the bottom 25% of the range have a green background. The red background is not used when the min value is within 80% of the max value.
| dbms | 256us | 1ms | 4ms | 16ms | 64ms | 256ms | 1s | 4s | 16s | gt | max |
|---|---|---|---|---|---|---|---|---|---|---|---|
| fbmy8028_rel_221222.cza1_gcp_c2s30 | 89.777 | 10.211 | 0.011 | nonzero | nonzero | 0.024 | |||||
| fbmy8028_rel_221222.cza1ps0_gcp_c2s30 | 92.283 | 7.708 | 0.010 | nonzero | 0.012 | ||||||
| fbmy8032_rel_221222.cza1_gcp_c2s30 | 83.841 | 16.145 | 0.013 | nonzero | 0.015 | ||||||
| fbmy8032_rel_221222.cza1ps0_gcp_c2s30 | 91.515 | 8.474 | 0.011 | nonzero | 0.009 |
Insert response time histogram: each cell has the percentage of responses that take <= the time in the header and max is the max response time in seconds. For max values in the top 25% of the range have a red background and in the bottom 25% of the range have a green background. The red background is not used when the min value is within 80% of the max value.
| dbms | 256us | 1ms | 4ms | 16ms | 64ms | 256ms | 1s | 4s | 16s | gt | max |
|---|---|---|---|---|---|---|---|---|---|---|---|
| fbmy8028_rel_221222.cza1_gcp_c2s30 | 0.263 | 70.123 | 29.599 | 0.016 | 0.020 | ||||||
| fbmy8028_rel_221222.cza1ps0_gcp_c2s30 | 0.516 | 72.100 | 27.381 | 0.003 | 0.018 | ||||||
| fbmy8032_rel_221222.cza1_gcp_c2s30 | 0.027 | 64.300 | 35.653 | 0.020 | 0.022 | ||||||
| fbmy8032_rel_221222.cza1ps0_gcp_c2s30 | 0.221 | 71.620 | 28.139 | 0.021 | 0.033 |
Delete response time histogram: each cell has the percentage of responses that take <= the time in the header and max is the max response time in seconds. For max values in the top 25% of the range have a red background and in the bottom 25% of the range have a green background. The red background is not used when the min value is within 80% of the max value.
| dbms | 256us | 1ms | 4ms | 16ms | 64ms | 256ms | 1s | 4s | 16s | gt | max |
|---|---|---|---|---|---|---|---|---|---|---|---|
| fbmy8028_rel_221222.cza1_gcp_c2s30 | 2.032 | 69.915 | 28.030 | 0.022 | 0.001 | 0.069 | |||||
| fbmy8028_rel_221222.cza1ps0_gcp_c2s30 | 2.449 | 71.898 | 25.649 | 0.004 | 0.019 | ||||||
| fbmy8032_rel_221222.cza1_gcp_c2s30 | 0.596 | 65.174 | 34.216 | 0.015 | 0.024 | ||||||
| fbmy8032_rel_221222.cza1ps0_gcp_c2s30 | 1.661 | 71.959 | 26.363 | 0.017 | 0.026 |
Performance metrics for the DBMS listed above. Some are normalized by throughput, others are not. Legend for results is here.
ips	qps	rps	rmbps	wps	wmbps	rpq	rkbpq	wpi	wkbpi	csps	cpups	cspq	cpupq	dbgb1	dbgb2	rss	maxop	p50	p99	tag
3970	33340	0	0.0	58.6	17.9	0.000	0.000	0.015	4.613	141677	57.4	4.249	258	11.6	12.3	81.2	0.024	4251	3708	fbmy8028_rel_221222.cza1_gcp_c2s30
3970	34899	0	0.0	62.2	19.1	0.000	0.000	0.016	4.932	148721	56.7	4.261	244	11.5	12.3	81.5	0.012	4475	3852	fbmy8028_rel_221222.cza1ps0_gcp_c2s30
3967	31868	0	0.0	63.4	18.6	0.000	0.000	0.016	4.798	134512	57.7	4.221	272	11.6	12.3	81.4	0.015	4044	3484	fbmy8032_rel_221222.cza1_gcp_c2s30
3970	34367	0	0.0	61.1	17.7	0.000	0.000	0.015	4.573	145842	56.7	4.244	247	11.6	12.3	81.0	0.009	4428	3852	fbmy8032_rel_221222.cza1ps0_gcp_c2s30
qr1000.L5
qr1000.L5: range queries with 1000 insert/s per client. Graphs for performance per 1-second interval are here.
Average throughput:
Query response time histogram: each cell has the percentage of responses that take <= the time in the header and max is the max response time in seconds. For max values in the top 25% of the range have a red background and in the bottom 25% of the range have a green background. The red background is not used when the min value is within 80% of the max value.
| dbms | 256us | 1ms | 4ms | 16ms | 64ms | 256ms | 1s | 4s | 16s | gt | max |
|---|---|---|---|---|---|---|---|---|---|---|---|
| fbmy8028_rel_221222.cza1_gcp_c2s30 | 66.289 | 29.076 | 4.634 | 0.001 | nonzero | nonzero | 0.080 | ||||
| fbmy8028_rel_221222.cza1ps0_gcp_c2s30 | 67.715 | 25.896 | 6.388 | 0.001 | nonzero | nonzero | 0.071 | ||||
| fbmy8032_rel_221222.cza1_gcp_c2s30 | 67.675 | 26.876 | 5.448 | 0.001 | nonzero | nonzero | 0.074 | ||||
| fbmy8032_rel_221222.cza1ps0_gcp_c2s30 | 69.336 | 24.813 | 5.850 | 0.001 | nonzero | nonzero | 0.068 |
Insert response time histogram: each cell has the percentage of responses that take <= the time in the header and max is the max response time in seconds. For max values in the top 25% of the range have a red background and in the bottom 25% of the range have a green background. The red background is not used when the min value is within 80% of the max value.
| dbms | 256us | 1ms | 4ms | 16ms | 64ms | 256ms | 1s | 4s | 16s | gt | max |
|---|---|---|---|---|---|---|---|---|---|---|---|
| fbmy8028_rel_221222.cza1_gcp_c2s30 | 0.144 | 53.642 | 46.157 | 0.057 | 0.030 | ||||||
| fbmy8028_rel_221222.cza1ps0_gcp_c2s30 | 0.464 | 57.193 | 42.312 | 0.031 | 0.027 | ||||||
| fbmy8032_rel_221222.cza1_gcp_c2s30 | 0.052 | 56.131 | 43.785 | 0.032 | 0.028 | ||||||
| fbmy8032_rel_221222.cza1ps0_gcp_c2s30 | 0.136 | 53.779 | 46.043 | 0.041 | 0.046 |
Delete response time histogram: each cell has the percentage of responses that take <= the time in the header and max is the max response time in seconds. For max values in the top 25% of the range have a red background and in the bottom 25% of the range have a green background. The red background is not used when the min value is within 80% of the max value.
| dbms | 256us | 1ms | 4ms | 16ms | 64ms | 256ms | 1s | 4s | 16s | gt | max |
|---|---|---|---|---|---|---|---|---|---|---|---|
| fbmy8028_rel_221222.cza1_gcp_c2s30 | 1.042 | 54.515 | 44.383 | 0.061 | 0.030 | ||||||
| fbmy8028_rel_221222.cza1ps0_gcp_c2s30 | 1.739 | 57.497 | 40.747 | 0.017 | 0.001 | 0.065 | |||||
| fbmy8032_rel_221222.cza1_gcp_c2s30 | 0.449 | 57.255 | 42.270 | 0.026 | 0.031 | ||||||
| fbmy8032_rel_221222.cza1ps0_gcp_c2s30 | 0.819 | 54.664 | 44.482 | 0.035 | 0.001 | 0.067 |
Performance metrics for the DBMS listed above. Some are normalized by throughput, others are not. Legend for results is here.
ips	qps	rps	rmbps	wps	wmbps	rpq	rkbpq	wpi	wkbpi	csps	cpups	cspq	cpupq	dbgb1	dbgb2	rss	maxop	p50	p99	tag
7947	23151	0	0.0	124.1	36.2	0.000	0.000	0.016	4.667	91296	61.3	3.943	397	12.2	13.1	81.9	0.080	3294	2270	fbmy8028_rel_221222.cza1_gcp_c2s30
7947	22420	0	0.0	119.5	33.5	0.000	0.000	0.015	4.315	88856	60.3	3.963	403	12.2	13.0	81.2	0.071	3292	2541	fbmy8028_rel_221222.cza1ps0_gcp_c2s30
7940	23008	0	0.0	120.0	34.2	0.000	0.000	0.015	4.405	90647	61.2	3.940	399	12.1	13.0	81.7	0.074	3037	2365	fbmy8032_rel_221222.cza1_gcp_c2s30
7947	24778	0	0.0	118.6	33.8	0.000	0.000	0.015	4.359	97497	60.4	3.935	366	12.1	13.0	81.8	0.068	3468	2685	fbmy8032_rel_221222.cza1ps0_gcp_c2s30
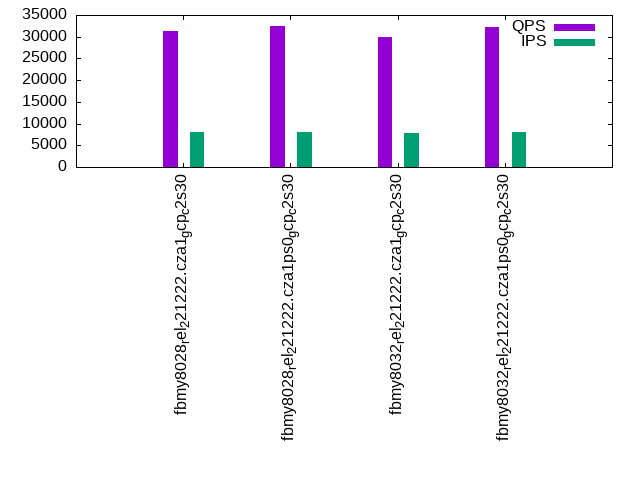
qp1000.L6
qp1000.L6: point queries with 1000 insert/s per client. Graphs for performance per 1-second interval are here.
Average throughput:
Query response time histogram: each cell has the percentage of responses that take <= the time in the header and max is the max response time in seconds. For max values in the top 25% of the range have a red background and in the bottom 25% of the range have a green background. The red background is not used when the min value is within 80% of the max value.
| dbms | 256us | 1ms | 4ms | 16ms | 64ms | 256ms | 1s | 4s | 16s | gt | max |
|---|---|---|---|---|---|---|---|---|---|---|---|
| fbmy8028_rel_221222.cza1_gcp_c2s30 | 77.968 | 21.993 | 0.038 | 0.001 | 0.001 | 0.042 | |||||
| fbmy8028_rel_221222.cza1ps0_gcp_c2s30 | 82.152 | 17.810 | 0.036 | nonzero | 0.001 | 0.042 | |||||
| fbmy8032_rel_221222.cza1_gcp_c2s30 | 66.708 | 33.248 | 0.042 | 0.001 | 0.001 | 0.042 | |||||
| fbmy8032_rel_221222.cza1ps0_gcp_c2s30 | 81.525 | 18.437 | 0.036 | nonzero | 0.001 | 0.042 |
Insert response time histogram: each cell has the percentage of responses that take <= the time in the header and max is the max response time in seconds. For max values in the top 25% of the range have a red background and in the bottom 25% of the range have a green background. The red background is not used when the min value is within 80% of the max value.
| dbms | 256us | 1ms | 4ms | 16ms | 64ms | 256ms | 1s | 4s | 16s | gt | max |
|---|---|---|---|---|---|---|---|---|---|---|---|
| fbmy8028_rel_221222.cza1_gcp_c2s30 | 0.067 | 52.315 | 47.586 | 0.032 | 0.042 | ||||||
| fbmy8028_rel_221222.cza1ps0_gcp_c2s30 | 0.131 | 54.203 | 45.624 | 0.042 | 0.041 | ||||||
| fbmy8032_rel_221222.cza1_gcp_c2s30 | 0.011 | 50.972 | 48.965 | 0.052 | 0.041 | ||||||
| fbmy8032_rel_221222.cza1ps0_gcp_c2s30 | 0.047 | 53.372 | 46.543 | 0.038 | 0.029 |
Delete response time histogram: each cell has the percentage of responses that take <= the time in the header and max is the max response time in seconds. For max values in the top 25% of the range have a red background and in the bottom 25% of the range have a green background. The red background is not used when the min value is within 80% of the max value.
| dbms | 256us | 1ms | 4ms | 16ms | 64ms | 256ms | 1s | 4s | 16s | gt | max |
|---|---|---|---|---|---|---|---|---|---|---|---|
| fbmy8028_rel_221222.cza1_gcp_c2s30 | 0.857 | 53.685 | 45.424 | 0.033 | 0.001 | 0.074 | |||||
| fbmy8028_rel_221222.cza1ps0_gcp_c2s30 | 1.185 | 55.067 | 43.698 | 0.049 | 0.042 | ||||||
| fbmy8032_rel_221222.cza1_gcp_c2s30 | 0.231 | 52.488 | 47.219 | 0.061 | 0.001 | 0.065 | |||||
| fbmy8032_rel_221222.cza1ps0_gcp_c2s30 | 0.716 | 54.799 | 44.441 | 0.043 | 0.001 | 0.070 |
Performance metrics for the DBMS listed above. Some are normalized by throughput, others are not. Legend for results is here.
ips	qps	rps	rmbps	wps	wmbps	rpq	rkbpq	wpi	wkbpi	csps	cpups	cspq	cpupq	dbgb1	dbgb2	rss	maxop	p50	p99	tag
7947	31341	0	0.0	118.5	34.8	0.000	0.000	0.015	4.480	135937	61.6	4.337	295	12.3	13.3	83.3	0.042	3948	3390	fbmy8028_rel_221222.cza1_gcp_c2s30
7947	32535	0	0.0	126.3	35.7	0.000	0.000	0.016	4.596	141789	61.1	4.358	282	12.2	13.2	83.7	0.042	4123	3388	fbmy8028_rel_221222.cza1ps0_gcp_c2s30
7940	29824	0	0.0	124.9	35.0	0.000	0.000	0.016	4.517	128712	62.0	4.316	312	12.3	13.2	83.7	0.042	3756	3101	fbmy8032_rel_221222.cza1_gcp_c2s30
7947	32212	0	0.0	119.0	34.5	0.000	0.000	0.015	4.441	139819	60.8	4.341	283	12.2	13.2	83.7	0.042	4091	3532	fbmy8032_rel_221222.cza1ps0_gcp_c2s30
l.i0
l.i0: load without secondary indexes
Performance metrics for all DBMS, not just the ones listed above. Some are normalized by throughput, others are not. Legend for results is here.
ips	qps	rps	rmbps	wps	wmbps	rpq	rkbpq	wpi	wkbpi	csps	cpups	cspq	cpupq	dbgb1	dbgb2	rss	maxop	p50	p99	tag
536913	0	0	0.0	458.8	123.4	0.000	0.000	0.001	0.235	61941	73.2	0.115	20	4.7	6.4	1.7	0.333	72321	50345	fbmy8028_rel_221222.cza1_gcp_c2s30
547945	0	0	0.0	471.9	126.0	0.000	0.000	0.001	0.235	63150	73.1	0.115	20	4.7	6.3	1.4	0.333	74219	46749	fbmy8028_rel_221222.cza1ps0_gcp_c2s30
514469	0	0	0.0	442.3	119.0	0.000	0.000	0.001	0.237	59687	72.3	0.116	21	4.6	6.4	1.7	0.337	70622	46949	fbmy8032_rel_221222.cza1_gcp_c2s30
531561	0	0	0.0	458.5	121.9	0.000	0.000	0.001	0.235	61755	72.4	0.116	20	4.6	6.3	1.5	0.371	72022	48348	fbmy8032_rel_221222.cza1ps0_gcp_c2s30
l.x
l.x: create secondary indexes
Performance metrics for all DBMS, not just the ones listed above. Some are normalized by throughput, others are not. Legend for results is here.
ips	qps	rps	rmbps	wps	wmbps	rpq	rkbpq	wpi	wkbpi	csps	cpups	cspq	cpupq	dbgb1	dbgb2	rss	maxop	p50	p99	tag
758294	0	1	0.1	291.1	106.3	0.000	0.000	0.000	0.144	1428	48.6	0.002	10	10.4	12.0	13.2	0.003	NA	NA	fbmy8028_rel_221222.cza1_gcp_c2s30
769231	0	1	0.1	299.4	107.2	0.000	0.000	0.000	0.143	1576	49.8	0.002	10	10.5	12.1	12.8	0.002	NA	NA	fbmy8028_rel_221222.cza1ps0_gcp_c2s30
776700	0	1	0.1	292.9	108.0	0.000	0.000	0.000	0.142	1776	50.0	0.002	10	10.4	12.2	13.1	0.003	NA	NA	fbmy8032_rel_221222.cza1_gcp_c2s30
784314	0	1	0.1	297.7	110.5	0.000	0.000	0.000	0.144	1920	50.2	0.002	10	10.4	12.1	12.8	0.003	NA	NA	fbmy8032_rel_221222.cza1ps0_gcp_c2s30
l.i1
l.i1: continue load after secondary indexes created with 50 inserts per transaction
Performance metrics for all DBMS, not just the ones listed above. Some are normalized by throughput, others are not. Legend for results is here.
ips	qps	rps	rmbps	wps	wmbps	rpq	rkbpq	wpi	wkbpi	csps	cpups	cspq	cpupq	dbgb1	dbgb2	rss	maxop	p50	p99	tag
89536	0	4	0.4	565.2	159.5	0.000	0.004	0.006	1.824	54886	63.3	0.613	106	13.1	13.6	51.7	0.467	11437	7941	fbmy8028_rel_221222.cza1_gcp_c2s30
89661	0	4	0.4	578.1	163.8	0.000	0.004	0.006	1.870	55123	63.5	0.615	106	12.1	12.7	50.4	0.700	11437	8090	fbmy8028_rel_221222.cza1ps0_gcp_c2s30
88033	0	4	0.4	568.6	161.6	0.000	0.004	0.006	1.880	53274	64.5	0.605	110	14.8	15.5	51.7	1.012	11192	7792	fbmy8032_rel_221222.cza1_gcp_c2s30
88766	0	4	0.4	581.8	164.8	0.000	0.004	0.007	1.901	54416	63.8	0.613	108	13.3	13.9	51.1	0.388	11288	8091	fbmy8032_rel_221222.cza1ps0_gcp_c2s30
l.i2
l.i2: continue load after secondary indexes created with 5 inserts per transaction
Performance metrics for all DBMS, not just the ones listed above. Some are normalized by throughput, others are not. Legend for results is here.
ips	qps	rps	rmbps	wps	wmbps	rpq	rkbpq	wpi	wkbpi	csps	cpups	cspq	cpupq	dbgb1	dbgb2	rss	maxop	p50	p99	tag
41195	0	0	0.0	318.3	71.8	0.000	0.000	0.008	1.785	224513	68.3	5.450	249	12.0	12.3	62.3	0.311	5394	3082	fbmy8028_rel_221222.cza1_gcp_c2s30
41841	0	0	0.0	325.2	75.0	0.000	0.000	0.008	1.835	229800	67.6	5.492	242	11.9	12.1	62.1	0.334	5476	3172	fbmy8028_rel_221222.cza1ps0_gcp_c2s30
39960	0	0	0.0	308.4	70.3	0.000	0.000	0.008	1.802	217218	68.4	5.436	257	12.0	12.3	62.4	0.315	5241	3061	fbmy8032_rel_221222.cza1_gcp_c2s30
41110	0	0	0.0	320.4	70.1	0.000	0.000	0.008	1.747	226774	67.6	5.516	247	12.2	12.5	62.4	0.302	5369	3117	fbmy8032_rel_221222.cza1ps0_gcp_c2s30
qr100.L1
qr100.L1: range queries with 100 insert/s per client
Performance metrics for all DBMS, not just the ones listed above. Some are normalized by throughput, others are not. Legend for results is here.
ips	qps	rps	rmbps	wps	wmbps	rpq	rkbpq	wpi	wkbpi	csps	cpups	cspq	cpupq	dbgb1	dbgb2	rss	maxop	p50	p99	tag
794	24414	0	0.0	15.1	3.3	0.000	0.000	0.019	4.258	94704	53.2	3.879	327	11.4	11.8	63.5	0.040	3676	3388	fbmy8028_rel_221222.cza1_gcp_c2s30
793	27729	0	0.0	14.3	3.0	0.000	0.000	0.018	3.881	107594	52.8	3.880	286	11.4	11.8	63.2	0.055	2701	2461	fbmy8028_rel_221222.cza1ps0_gcp_c2s30
794	24778	0	0.0	12.1	2.5	0.000	0.000	0.015	3.192	96044	53.0	3.876	321	11.4	11.8	63.6	0.029	3021	2765	fbmy8032_rel_221222.cza1_gcp_c2s30
793	27605	0	0.0	15.9	3.5	0.000	0.000	0.020	4.570	107111	52.9	3.880	287	11.4	11.8	63.9	0.044	4091	3693	fbmy8032_rel_221222.cza1ps0_gcp_c2s30
qp100.L2
qp100.L2: point queries with 100 insert/s per client
Performance metrics for all DBMS, not just the ones listed above. Some are normalized by throughput, others are not. Legend for results is here.
ips	qps	rps	rmbps	wps	wmbps	rpq	rkbpq	wpi	wkbpi	csps	cpups	cspq	cpupq	dbgb1	dbgb2	rss	maxop	p50	p99	tag
794	35102	0	0.0	12.5	3.3	0.000	0.000	0.016	4.265	145619	54.0	4.148	231	11.4	12.0	74.5	0.020	4443	3757	fbmy8028_rel_221222.cza1_gcp_c2s30
794	36801	0	0.0	12.8	3.4	0.000	0.000	0.016	4.410	153033	53.2	4.158	217	11.4	12.0	73.7	0.039	4651	4028	fbmy8028_rel_221222.cza1ps0_gcp_c2s30
794	33476	0	0.0	11.5	2.8	0.000	0.000	0.015	3.658	138206	53.9	4.128	242	11.5	12.1	73.8	0.021	4205	3596	fbmy8032_rel_221222.cza1_gcp_c2s30
793	35981	0	0.0	13.8	3.8	0.000	0.000	0.017	4.855	149559	53.2	4.157	222	11.4	12.0	74.9	0.034	4587	3932	fbmy8032_rel_221222.cza1ps0_gcp_c2s30
qr500.L3
qr500.L3: range queries with 500 insert/s per client
Performance metrics for all DBMS, not just the ones listed above. Some are normalized by throughput, others are not. Legend for results is here.
ips	qps	rps	rmbps	wps	wmbps	rpq	rkbpq	wpi	wkbpi	csps	cpups	cspq	cpupq	dbgb1	dbgb2	rss	maxop	p50	p99	tag
3970	22244	0	0.0	53.8	17.8	0.000	0.000	0.014	4.598	87081	56.7	3.915	382	11.4	13.1	79.4	0.060	3069	2606	fbmy8028_rel_221222.cza1_gcp_c2s30
3970	23478	0	0.0	59.0	19.4	0.000	0.000	0.015	4.994	92048	56.2	3.921	359	11.4	13.1	79.1	0.072	3037	2269	fbmy8028_rel_221222.cza1ps0_gcp_c2s30
3967	23576	0	0.0	55.2	18.2	0.000	0.000	0.014	4.708	92281	56.8	3.914	361	11.5	13.2	78.7	0.061	3932	2493	fbmy8032_rel_221222.cza1_gcp_c2s30
3970	24829	0	0.0	58.0	18.7	0.000	0.000	0.015	4.823	97213	56.2	3.915	340	11.5	13.2	79.5	0.061	3788	3196	fbmy8032_rel_221222.cza1ps0_gcp_c2s30
qp500.L4
qp500.L4: point queries with 500 insert/s per client
Performance metrics for all DBMS, not just the ones listed above. Some are normalized by throughput, others are not. Legend for results is here.
ips	qps	rps	rmbps	wps	wmbps	rpq	rkbpq	wpi	wkbpi	csps	cpups	cspq	cpupq	dbgb1	dbgb2	rss	maxop	p50	p99	tag
3970	33340	0	0.0	58.6	17.9	0.000	0.000	0.015	4.613	141677	57.4	4.249	258	11.6	12.3	81.2	0.024	4251	3708	fbmy8028_rel_221222.cza1_gcp_c2s30
3970	34899	0	0.0	62.2	19.1	0.000	0.000	0.016	4.932	148721	56.7	4.261	244	11.5	12.3	81.5	0.012	4475	3852	fbmy8028_rel_221222.cza1ps0_gcp_c2s30
3967	31868	0	0.0	63.4	18.6	0.000	0.000	0.016	4.798	134512	57.7	4.221	272	11.6	12.3	81.4	0.015	4044	3484	fbmy8032_rel_221222.cza1_gcp_c2s30
3970	34367	0	0.0	61.1	17.7	0.000	0.000	0.015	4.573	145842	56.7	4.244	247	11.6	12.3	81.0	0.009	4428	3852	fbmy8032_rel_221222.cza1ps0_gcp_c2s30
qr1000.L5
qr1000.L5: range queries with 1000 insert/s per client
Performance metrics for all DBMS, not just the ones listed above. Some are normalized by throughput, others are not. Legend for results is here.
ips	qps	rps	rmbps	wps	wmbps	rpq	rkbpq	wpi	wkbpi	csps	cpups	cspq	cpupq	dbgb1	dbgb2	rss	maxop	p50	p99	tag
7947	23151	0	0.0	124.1	36.2	0.000	0.000	0.016	4.667	91296	61.3	3.943	397	12.2	13.1	81.9	0.080	3294	2270	fbmy8028_rel_221222.cza1_gcp_c2s30
7947	22420	0	0.0	119.5	33.5	0.000	0.000	0.015	4.315	88856	60.3	3.963	403	12.2	13.0	81.2	0.071	3292	2541	fbmy8028_rel_221222.cza1ps0_gcp_c2s30
7940	23008	0	0.0	120.0	34.2	0.000	0.000	0.015	4.405	90647	61.2	3.940	399	12.1	13.0	81.7	0.074	3037	2365	fbmy8032_rel_221222.cza1_gcp_c2s30
7947	24778	0	0.0	118.6	33.8	0.000	0.000	0.015	4.359	97497	60.4	3.935	366	12.1	13.0	81.8	0.068	3468	2685	fbmy8032_rel_221222.cza1ps0_gcp_c2s30
qp1000.L6
qp1000.L6: point queries with 1000 insert/s per client
Performance metrics for all DBMS, not just the ones listed above. Some are normalized by throughput, others are not. Legend for results is here.
ips	qps	rps	rmbps	wps	wmbps	rpq	rkbpq	wpi	wkbpi	csps	cpups	cspq	cpupq	dbgb1	dbgb2	rss	maxop	p50	p99	tag
7947	31341	0	0.0	118.5	34.8	0.000	0.000	0.015	4.480	135937	61.6	4.337	295	12.3	13.3	83.3	0.042	3948	3390	fbmy8028_rel_221222.cza1_gcp_c2s30
7947	32535	0	0.0	126.3	35.7	0.000	0.000	0.016	4.596	141789	61.1	4.358	282	12.2	13.2	83.7	0.042	4123	3388	fbmy8028_rel_221222.cza1ps0_gcp_c2s30
7940	29824	0	0.0	124.9	35.0	0.000	0.000	0.016	4.517	128712	62.0	4.316	312	12.3	13.2	83.7	0.042	3756	3101	fbmy8032_rel_221222.cza1_gcp_c2s30
7947	32212	0	0.0	119.0	34.5	0.000	0.000	0.015	4.441	139819	60.8	4.341	283	12.2	13.2	83.7	0.042	4091	3532	fbmy8032_rel_221222.cza1ps0_gcp_c2s30
l.i0
- l.i0: load without secondary indexes
- Legend for results is here.
- Each entry lists the percentage of responses that fit in that bucket (slower than max time for previous bucket, faster than min time for next bucket).
Insert response time histogram
256us	1ms	4ms	16ms	64ms	256ms	1s	4s	16s	gt	max	tag
0.000	7.254	92.607	0.116	0.007	0.012	0.004	0.000	0.000	0.000	0.333	fbmy8028_rel_221222.cza1_gcp_c2s30
0.000	10.193	89.652	0.132	0.007	0.011	0.006	0.000	0.000	0.000	0.333	fbmy8028_rel_221222.cza1ps0_gcp_c2s30
0.000	2.937	96.917	0.122	0.007	0.015	0.003	0.000	0.000	0.000	0.337	fbmy8032_rel_221222.cza1_gcp_c2s30
0.000	7.803	92.052	0.122	0.006	0.015	0.002	0.000	0.000	0.000	0.371	fbmy8032_rel_221222.cza1ps0_gcp_c2s30
l.x
- l.x: create secondary indexes
- Legend for results is here.
- Each entry lists the percentage of responses that fit in that bucket (slower than max time for previous bucket, faster than min time for next bucket).
TODO - determine whether there is data for create index response time
l.i1
- l.i1: continue load after secondary indexes created with 50 inserts per transaction
- Legend for results is here.
- Each entry lists the percentage of responses that fit in that bucket (slower than max time for previous bucket, faster than min time for next bucket).
Insert response time histogram
256us	1ms	4ms	16ms	64ms	256ms	1s	4s	16s	gt	max	tag
0.000	0.015	35.087	64.776	0.103	0.014	0.004	0.000	0.000	0.000	0.467	fbmy8028_rel_221222.cza1_gcp_c2s30
0.000	0.015	35.607	64.256	0.104	0.012	0.006	0.000	0.000	0.000	0.700	fbmy8028_rel_221222.cza1ps0_gcp_c2s30
0.000	0.003	33.124	66.755	0.098	0.014	0.005	nonzero	0.000	0.000	1.012	fbmy8032_rel_221222.cza1_gcp_c2s30
0.000	0.009	33.943	65.927	0.102	0.014	0.005	0.000	0.000	0.000	0.388	fbmy8032_rel_221222.cza1ps0_gcp_c2s30
Delete response time histogram
256us	1ms	4ms	16ms	64ms	256ms	1s	4s	16s	gt	max	tag
0.000	0.019	38.363	61.502	0.098	0.014	0.004	0.000	0.000	0.000	0.477	fbmy8028_rel_221222.cza1_gcp_c2s30
0.000	0.022	38.865	60.995	0.099	0.012	0.006	0.000	0.000	0.000	0.701	fbmy8028_rel_221222.cza1ps0_gcp_c2s30
0.000	0.005	35.495	64.387	0.094	0.014	0.005	nonzero	0.000	0.000	1.011	fbmy8032_rel_221222.cza1_gcp_c2s30
0.000	0.011	36.682	63.191	0.097	0.014	0.005	0.000	0.000	0.000	0.386	fbmy8032_rel_221222.cza1ps0_gcp_c2s30
l.i2
- l.i2: continue load after secondary indexes created with 5 inserts per transaction
- Legend for results is here.
- Each entry lists the percentage of responses that fit in that bucket (slower than max time for previous bucket, faster than min time for next bucket).
Insert response time histogram
256us	1ms	4ms	16ms	64ms	256ms	1s	4s	16s	gt	max	tag
0.003	79.350	20.536	0.106	0.003	0.002	0.001	0.000	0.000	0.000	0.311	fbmy8028_rel_221222.cza1_gcp_c2s30
0.011	80.828	19.054	0.102	0.003	0.002	0.001	0.000	0.000	0.000	0.334	fbmy8028_rel_221222.cza1ps0_gcp_c2s30
0.001	75.378	24.499	0.118	0.003	0.001	nonzero	0.000	0.000	0.000	0.315	fbmy8032_rel_221222.cza1_gcp_c2s30
0.005	78.815	21.063	0.112	0.003	0.002	nonzero	0.000	0.000	0.000	0.302	fbmy8032_rel_221222.cza1ps0_gcp_c2s30
Delete response time histogram
256us	1ms	4ms	16ms	64ms	256ms	1s	4s	16s	gt	max	tag
0.000	71.213	28.671	0.110	0.003	0.002	0.001	0.000	0.000	0.000	0.312	fbmy8028_rel_221222.cza1_gcp_c2s30
0.000	73.275	26.614	0.106	0.003	0.002	0.001	0.000	0.000	0.000	0.333	fbmy8028_rel_221222.cza1ps0_gcp_c2s30
0.000	66.447	33.428	0.120	0.003	0.001	nonzero	0.000	0.000	0.000	0.286	fbmy8032_rel_221222.cza1_gcp_c2s30
0.000	70.821	29.060	0.113	0.003	0.002	nonzero	0.000	0.000	0.000	0.300	fbmy8032_rel_221222.cza1ps0_gcp_c2s30
qr100.L1
- qr100.L1: range queries with 100 insert/s per client
- Legend for results is here.
- Each entry lists the percentage of responses that fit in that bucket (slower than max time for previous bucket, faster than min time for next bucket).
Query response time histogram
256us	1ms	4ms	16ms	64ms	256ms	1s	4s	16s	gt	max	tag
68.634	29.315	2.051	nonzero	nonzero	0.000	0.000	0.000	0.000	0.000	0.040	fbmy8028_rel_221222.cza1_gcp_c2s30
67.027	32.090	0.883	nonzero	nonzero	0.000	0.000	0.000	0.000	0.000	0.055	fbmy8028_rel_221222.cza1ps0_gcp_c2s30
67.401	30.173	2.426	nonzero	nonzero	0.000	0.000	0.000	0.000	0.000	0.029	fbmy8032_rel_221222.cza1_gcp_c2s30
69.470	26.344	4.186	nonzero	nonzero	0.000	0.000	0.000	0.000	0.000	0.044	fbmy8032_rel_221222.cza1ps0_gcp_c2s30
Insert response time histogram
256us	1ms	4ms	16ms	64ms	256ms	1s	4s	16s	gt	max	tag
0.000	0.370	98.875	0.755	0.000	0.000	0.000	0.000	0.000	0.000	0.009	fbmy8028_rel_221222.cza1_gcp_c2s30
0.000	1.495	96.078	2.422	0.005	0.000	0.000	0.000	0.000	0.000	0.020	fbmy8028_rel_221222.cza1ps0_gcp_c2s30
0.000	0.453	99.219	0.328	0.000	0.000	0.000	0.000	0.000	0.000	0.005	fbmy8032_rel_221222.cza1_gcp_c2s30
0.000	1.953	98.026	0.021	0.000	0.000	0.000	0.000	0.000	0.000	0.008	fbmy8032_rel_221222.cza1ps0_gcp_c2s30
Delete response time histogram
256us	1ms	4ms	16ms	64ms	256ms	1s	4s	16s	gt	max	tag
0.000	4.224	95.260	0.510	0.005	0.000	0.000	0.000	0.000	0.000	0.019	fbmy8028_rel_221222.cza1_gcp_c2s30
0.000	6.328	91.833	1.839	0.000	0.000	0.000	0.000	0.000	0.000	0.008	fbmy8028_rel_221222.cza1ps0_gcp_c2s30
0.000	2.599	97.130	0.271	0.000	0.000	0.000	0.000	0.000	0.000	0.015	fbmy8032_rel_221222.cza1_gcp_c2s30
0.000	7.193	92.771	0.031	0.005	0.000	0.000	0.000	0.000	0.000	0.017	fbmy8032_rel_221222.cza1ps0_gcp_c2s30
qp100.L2
- qp100.L2: point queries with 100 insert/s per client
- Legend for results is here.
- Each entry lists the percentage of responses that fit in that bucket (slower than max time for previous bucket, faster than min time for next bucket).
Query response time histogram
256us	1ms	4ms	16ms	64ms	256ms	1s	4s	16s	gt	max	tag
95.841	4.157	0.001	nonzero	0.001	0.000	0.000	0.000	0.000	0.000	0.020	fbmy8028_rel_221222.cza1_gcp_c2s30
97.001	2.997	0.001	nonzero	0.001	0.000	0.000	0.000	0.000	0.000	0.039	fbmy8028_rel_221222.cza1ps0_gcp_c2s30
93.339	6.659	0.001	nonzero	0.001	0.000	0.000	0.000	0.000	0.000	0.021	fbmy8032_rel_221222.cza1_gcp_c2s30
96.377	3.621	0.001	nonzero	0.001	0.000	0.000	0.000	0.000	0.000	0.034	fbmy8032_rel_221222.cza1ps0_gcp_c2s30
Insert response time histogram
256us	1ms	4ms	16ms	64ms	256ms	1s	4s	16s	gt	max	tag
0.000	0.531	99.318	0.151	0.000	0.000	0.000	0.000	0.000	0.000	0.006	fbmy8028_rel_221222.cza1_gcp_c2s30
0.000	0.901	98.552	0.547	0.000	0.000	0.000	0.000	0.000	0.000	0.006	fbmy8028_rel_221222.cza1ps0_gcp_c2s30
0.000	0.302	99.208	0.490	0.000	0.000	0.000	0.000	0.000	0.000	0.008	fbmy8032_rel_221222.cza1_gcp_c2s30
0.000	0.344	98.510	1.146	0.000	0.000	0.000	0.000	0.000	0.000	0.007	fbmy8032_rel_221222.cza1ps0_gcp_c2s30
Delete response time histogram
256us	1ms	4ms	16ms	64ms	256ms	1s	4s	16s	gt	max	tag
0.000	6.396	93.438	0.167	0.000	0.000	0.000	0.000	0.000	0.000	0.006	fbmy8028_rel_221222.cza1_gcp_c2s30
0.000	8.328	91.292	0.380	0.000	0.000	0.000	0.000	0.000	0.000	0.014	fbmy8028_rel_221222.cza1ps0_gcp_c2s30
0.000	3.057	96.479	0.464	0.000	0.000	0.000	0.000	0.000	0.000	0.008	fbmy8032_rel_221222.cza1_gcp_c2s30
0.000	4.391	94.755	0.854	0.000	0.000	0.000	0.000	0.000	0.000	0.012	fbmy8032_rel_221222.cza1ps0_gcp_c2s30
qr500.L3
- qr500.L3: range queries with 500 insert/s per client
- Legend for results is here.
- Each entry lists the percentage of responses that fit in that bucket (slower than max time for previous bucket, faster than min time for next bucket).
Query response time histogram
256us	1ms	4ms	16ms	64ms	256ms	1s	4s	16s	gt	max	tag
68.845	26.909	4.246	0.001	nonzero	0.000	0.000	0.000	0.000	0.000	0.060	fbmy8028_rel_221222.cza1_gcp_c2s30
67.997	29.131	2.872	0.001	nonzero	nonzero	0.000	0.000	0.000	0.000	0.072	fbmy8028_rel_221222.cza1ps0_gcp_c2s30
70.732	25.381	3.886	0.001	nonzero	0.000	0.000	0.000	0.000	0.000	0.061	fbmy8032_rel_221222.cza1_gcp_c2s30
67.381	29.972	2.647	0.001	nonzero	0.000	0.000	0.000	0.000	0.000	0.061	fbmy8032_rel_221222.cza1ps0_gcp_c2s30
Insert response time histogram
256us	1ms	4ms	16ms	64ms	256ms	1s	4s	16s	gt	max	tag
0.000	0.721	75.793	23.472	0.015	0.000	0.000	0.000	0.000	0.000	0.022	fbmy8028_rel_221222.cza1_gcp_c2s30
0.000	0.973	72.482	26.522	0.023	0.000	0.000	0.000	0.000	0.000	0.022	fbmy8028_rel_221222.cza1ps0_gcp_c2s30
0.000	0.342	74.067	25.552	0.040	0.000	0.000	0.000	0.000	0.000	0.020	fbmy8032_rel_221222.cza1_gcp_c2s30
0.000	0.572	77.045	22.360	0.023	0.000	0.000	0.000	0.000	0.000	0.021	fbmy8032_rel_221222.cza1ps0_gcp_c2s30
Delete response time histogram
256us	1ms	4ms	16ms	64ms	256ms	1s	4s	16s	gt	max	tag
0.000	2.649	75.254	22.082	0.015	0.000	0.000	0.000	0.000	0.000	0.023	fbmy8028_rel_221222.cza1_gcp_c2s30
0.000	3.765	71.089	25.130	0.017	0.000	0.000	0.000	0.000	0.000	0.023	fbmy8028_rel_221222.cza1ps0_gcp_c2s30
0.000	1.418	74.323	24.216	0.044	0.000	0.000	0.000	0.000	0.000	0.030	fbmy8032_rel_221222.cza1_gcp_c2s30
0.000	2.048	76.842	21.089	0.022	0.000	0.000	0.000	0.000	0.000	0.026	fbmy8032_rel_221222.cza1ps0_gcp_c2s30
qp500.L4
- qp500.L4: point queries with 500 insert/s per client
- Legend for results is here.
- Each entry lists the percentage of responses that fit in that bucket (slower than max time for previous bucket, faster than min time for next bucket).
Query response time histogram
256us	1ms	4ms	16ms	64ms	256ms	1s	4s	16s	gt	max	tag
89.777	10.211	0.011	nonzero	nonzero	0.000	0.000	0.000	0.000	0.000	0.024	fbmy8028_rel_221222.cza1_gcp_c2s30
92.283	7.708	0.010	nonzero	0.000	0.000	0.000	0.000	0.000	0.000	0.012	fbmy8028_rel_221222.cza1ps0_gcp_c2s30
83.841	16.145	0.013	nonzero	0.000	0.000	0.000	0.000	0.000	0.000	0.015	fbmy8032_rel_221222.cza1_gcp_c2s30
91.515	8.474	0.011	nonzero	0.000	0.000	0.000	0.000	0.000	0.000	0.009	fbmy8032_rel_221222.cza1ps0_gcp_c2s30
Insert response time histogram
256us	1ms	4ms	16ms	64ms	256ms	1s	4s	16s	gt	max	tag
0.000	0.263	70.123	29.599	0.016	0.000	0.000	0.000	0.000	0.000	0.020	fbmy8028_rel_221222.cza1_gcp_c2s30
0.000	0.516	72.100	27.381	0.003	0.000	0.000	0.000	0.000	0.000	0.018	fbmy8028_rel_221222.cza1ps0_gcp_c2s30
0.000	0.027	64.300	35.653	0.020	0.000	0.000	0.000	0.000	0.000	0.022	fbmy8032_rel_221222.cza1_gcp_c2s30
0.000	0.221	71.620	28.139	0.021	0.000	0.000	0.000	0.000	0.000	0.033	fbmy8032_rel_221222.cza1ps0_gcp_c2s30
Delete response time histogram
256us	1ms	4ms	16ms	64ms	256ms	1s	4s	16s	gt	max	tag
0.000	2.032	69.915	28.030	0.022	0.001	0.000	0.000	0.000	0.000	0.069	fbmy8028_rel_221222.cza1_gcp_c2s30
0.000	2.449	71.898	25.649	0.004	0.000	0.000	0.000	0.000	0.000	0.019	fbmy8028_rel_221222.cza1ps0_gcp_c2s30
0.000	0.596	65.174	34.216	0.015	0.000	0.000	0.000	0.000	0.000	0.024	fbmy8032_rel_221222.cza1_gcp_c2s30
0.000	1.661	71.959	26.363	0.017	0.000	0.000	0.000	0.000	0.000	0.026	fbmy8032_rel_221222.cza1ps0_gcp_c2s30
qr1000.L5
- qr1000.L5: range queries with 1000 insert/s per client
- Legend for results is here.
- Each entry lists the percentage of responses that fit in that bucket (slower than max time for previous bucket, faster than min time for next bucket).
Query response time histogram
256us	1ms	4ms	16ms	64ms	256ms	1s	4s	16s	gt	max	tag
66.289	29.076	4.634	0.001	nonzero	nonzero	0.000	0.000	0.000	0.000	0.080	fbmy8028_rel_221222.cza1_gcp_c2s30
67.715	25.896	6.388	0.001	nonzero	nonzero	0.000	0.000	0.000	0.000	0.071	fbmy8028_rel_221222.cza1ps0_gcp_c2s30
67.675	26.876	5.448	0.001	nonzero	nonzero	0.000	0.000	0.000	0.000	0.074	fbmy8032_rel_221222.cza1_gcp_c2s30
69.336	24.813	5.850	0.001	nonzero	nonzero	0.000	0.000	0.000	0.000	0.068	fbmy8032_rel_221222.cza1ps0_gcp_c2s30
Insert response time histogram
256us	1ms	4ms	16ms	64ms	256ms	1s	4s	16s	gt	max	tag
0.000	0.144	53.642	46.157	0.057	0.000	0.000	0.000	0.000	0.000	0.030	fbmy8028_rel_221222.cza1_gcp_c2s30
0.000	0.464	57.193	42.312	0.031	0.000	0.000	0.000	0.000	0.000	0.027	fbmy8028_rel_221222.cza1ps0_gcp_c2s30
0.000	0.052	56.131	43.785	0.032	0.000	0.000	0.000	0.000	0.000	0.028	fbmy8032_rel_221222.cza1_gcp_c2s30
0.000	0.136	53.779	46.043	0.041	0.000	0.000	0.000	0.000	0.000	0.046	fbmy8032_rel_221222.cza1ps0_gcp_c2s30
Delete response time histogram
256us	1ms	4ms	16ms	64ms	256ms	1s	4s	16s	gt	max	tag
0.000	1.042	54.515	44.383	0.061	0.000	0.000	0.000	0.000	0.000	0.030	fbmy8028_rel_221222.cza1_gcp_c2s30
0.000	1.739	57.497	40.747	0.017	0.001	0.000	0.000	0.000	0.000	0.065	fbmy8028_rel_221222.cza1ps0_gcp_c2s30
0.000	0.449	57.255	42.270	0.026	0.000	0.000	0.000	0.000	0.000	0.031	fbmy8032_rel_221222.cza1_gcp_c2s30
0.000	0.819	54.664	44.482	0.035	0.001	0.000	0.000	0.000	0.000	0.067	fbmy8032_rel_221222.cza1ps0_gcp_c2s30
qp1000.L6
- qp1000.L6: point queries with 1000 insert/s per client
- Legend for results is here.
- Each entry lists the percentage of responses that fit in that bucket (slower than max time for previous bucket, faster than min time for next bucket).
Query response time histogram
256us	1ms	4ms	16ms	64ms	256ms	1s	4s	16s	gt	max	tag
77.968	21.993	0.038	0.001	0.001	0.000	0.000	0.000	0.000	0.000	0.042	fbmy8028_rel_221222.cza1_gcp_c2s30
82.152	17.810	0.036	nonzero	0.001	0.000	0.000	0.000	0.000	0.000	0.042	fbmy8028_rel_221222.cza1ps0_gcp_c2s30
66.708	33.248	0.042	0.001	0.001	0.000	0.000	0.000	0.000	0.000	0.042	fbmy8032_rel_221222.cza1_gcp_c2s30
81.525	18.437	0.036	nonzero	0.001	0.000	0.000	0.000	0.000	0.000	0.042	fbmy8032_rel_221222.cza1ps0_gcp_c2s30
Insert response time histogram
256us	1ms	4ms	16ms	64ms	256ms	1s	4s	16s	gt	max	tag
0.000	0.067	52.315	47.586	0.032	0.000	0.000	0.000	0.000	0.000	0.042	fbmy8028_rel_221222.cza1_gcp_c2s30
0.000	0.131	54.203	45.624	0.042	0.000	0.000	0.000	0.000	0.000	0.041	fbmy8028_rel_221222.cza1ps0_gcp_c2s30
0.000	0.011	50.972	48.965	0.052	0.000	0.000	0.000	0.000	0.000	0.041	fbmy8032_rel_221222.cza1_gcp_c2s30
0.000	0.047	53.372	46.543	0.038	0.000	0.000	0.000	0.000	0.000	0.029	fbmy8032_rel_221222.cza1ps0_gcp_c2s30
Delete response time histogram
256us	1ms	4ms	16ms	64ms	256ms	1s	4s	16s	gt	max	tag
0.000	0.857	53.685	45.424	0.033	0.001	0.000	0.000	0.000	0.000	0.074	fbmy8028_rel_221222.cza1_gcp_c2s30
0.000	1.185	55.067	43.698	0.049	0.000	0.000	0.000	0.000	0.000	0.042	fbmy8028_rel_221222.cza1ps0_gcp_c2s30
0.000	0.231	52.488	47.219	0.061	0.001	0.000	0.000	0.000	0.000	0.065	fbmy8032_rel_221222.cza1_gcp_c2s30
0.000	0.716	54.799	44.441	0.043	0.001	0.000	0.000	0.000	0.000	0.070	fbmy8032_rel_221222.cza1ps0_gcp_c2s30