Introduction
This is a report for the insert benchmark with 160M docs and 8 client(s). It is generated by scripts (bash, awk, sed) and Tufte might not be impressed. An overview of the insert benchmark is here and a short update is here. Below, by DBMS, I mean DBMS+version.config. An example is my8020.c10b40 where my means MySQL, 8020 is version 8.0.20 and c10b40 is the name for the configuration file.
The test server is a c2-standard-30 from GCP with 15 cores, hyperthreads disabled, Ubuntu 22.04 and XFS using SW RAID 0 over 4 local SSDs. The benchmark was run with 8 clients and there were 1, 2 or 3 connections per client. It uses 8 tables with a client per table. It loads 20M rows per table without secondary indexes, creates 3 secondary indexes per table, then inserts 50m+50m rows per table with a delete per insert to avoid growing the table. It then does 6 read+write tests for 1200s each that do queries as fast as possible with 100,100,500,500,1000,1000 inserts/s and the same for deletes/s per client concurrent with the queries. The database is cached in memory. Clients and the DBMS share one server. The per-database configs are in the per-database subdirectories here.
The tested DBMS are:
- fbmy5635_rel_221222.cza1_gcp_c2s30 - MyRocks 5.6.35 compiled on Dec 22, 2023 at git hash 4f3a57a1, RocksDB 8.7.0 at git hash 29005f0b, cza1_gcp_c2s30 config
- fbmy8028_rel_221222.cza1_gcp_c2s30 - MyRocks 8.0.28 compiled on Dec 22, 2023 at git hash 2ad105fc, RocksDB 8.7.0 at git hash 29005f0b, cza1_gcp_c2s30 config
- fbmy8028_rel_221222.cza1ps0_gcp_c2s30 - MyRocks 8.0.28 compiled on Dec 22, 2023 at git hash 2ad105fc, RocksDB 8.7.0 at git hash 29005f0b, cza1ps0_gcp_c2s30 config
- fbmy8032_rel_221222.cza1_gcp_c2s30 - MyRocks 8.0.32 compiled on Dec 22, 2023 at git hash 76707b44, RocksDB 8.7.0 at git hash 29005f0b, cza1_gcp_c2s30 config
- fbmy8032_rel_221222.cza1ps0_gcp_c2s30 - MyRocks 8.0.32 compiled on Dec 22, 2023 at git hash 76707b44, RocksDB 8.7.0 at git hash 29005f0b, cza1ps0_gcp_c2s30 config
Contents
- Summary
- l.i0: load without secondary indexes
- l.x: create secondary indexes
- l.i1: continue load after secondary indexes created with 50 inserts per transaction
- l.i2: continue load after secondary indexes created with 5 inserts per transaction
- qr100.L1: range queries with 100 insert/s per client
- qp100.L2: point queries with 100 insert/s per client
- qr500.L3: range queries with 500 insert/s per client
- qp500.L4: point queries with 500 insert/s per client
- qr1000.L5: range queries with 1000 insert/s per client
- qp1000.L6: point queries with 1000 insert/s per client
Summary
The numbers are inserts/s for l.i0, l.i1 and l.i2, indexed docs (or rows) /s for l.x and queries/s for qr100, qp100 thru qr1000, qp1000" The values are the average rate over the entire test for inserts (IPS) and queries (QPS). The range of values for IPS and QPS is split into 3 parts: bottom 25%, middle 50%, top 25%. Values in the bottom 25% have a red background, values in the top 25% have a green background and values in the middle have no color. A gray background is used for values that can be ignored because the DBMS did not sustain the target insert rate. Red backgrounds are not used when the minimum value is within 80% of the max value.
| dbms | l.i0 | l.x | l.i1 | l.i2 | qr100 | qp100 | qr500 | qp500 | qr1000 | qp1000 |
|---|---|---|---|---|---|---|---|---|---|---|
| fbmy5635_rel_221222.cza1_gcp_c2s30 | 622568 | 800000 | 90370 | 41216 | 23293 | 31148 | 22313 | 29668 | 20198 | 27849 |
| fbmy8028_rel_221222.cza1_gcp_c2s30 | 536913 | 758294 | 89536 | 41195 | 24414 | 35102 | 22244 | 33340 | 23151 | 31341 |
| fbmy8032_rel_221222.cza1_gcp_c2s30 | 514469 | 776700 | 88033 | 39960 | 24778 | 33476 | 23576 | 31868 | 23008 | 29824 |
This table has relative throughput, throughput for the DBMS relative to the DBMS in the first line, using the absolute throughput from the previous table. Values less than 0.95 have a yellow background. Values greater than 1.05 have a blue background.
| dbms | l.i0 | l.x | l.i1 | l.i2 | qr100 | qp100 | qr500 | qp500 | qr1000 | qp1000 |
|---|---|---|---|---|---|---|---|---|---|---|
| fbmy5635_rel_221222.cza1_gcp_c2s30 | 1.00 | 1.00 | 1.00 | 1.00 | 1.00 | 1.00 | 1.00 | 1.00 | 1.00 | 1.00 |
| fbmy8028_rel_221222.cza1_gcp_c2s30 | 0.86 | 0.95 | 0.99 | 1.00 | 1.05 | 1.13 | 1.00 | 1.12 | 1.15 | 1.13 |
| fbmy8032_rel_221222.cza1_gcp_c2s30 | 0.83 | 0.97 | 0.97 | 0.97 | 1.06 | 1.07 | 1.06 | 1.07 | 1.14 | 1.07 |
This lists the average rate of inserts/s for the tests that do inserts concurrent with queries. For such tests the query rate is listed in the table above. The read+write tests are setup so that the insert rate should match the target rate every second. Cells that are not at least 95% of the target have a red background to indicate a failure to satisfy the target.
| dbms | qr100.L1 | qp100.L2 | qr500.L3 | qp500.L4 | qr1000.L5 | qp1000.L6 |
|---|---|---|---|---|---|---|
| fbmy5635_rel_221222.cza1_gcp_c2s30 | 794 | 793 | 3970 | 3970 | 7947 | 7947 |
| fbmy8028_rel_221222.cza1_gcp_c2s30 | 794 | 794 | 3970 | 3970 | 7947 | 7947 |
| fbmy8032_rel_221222.cza1_gcp_c2s30 | 794 | 794 | 3967 | 3967 | 7940 | 7940 |
| target | 800 | 800 | 4000 | 4000 | 8000 | 8000 |
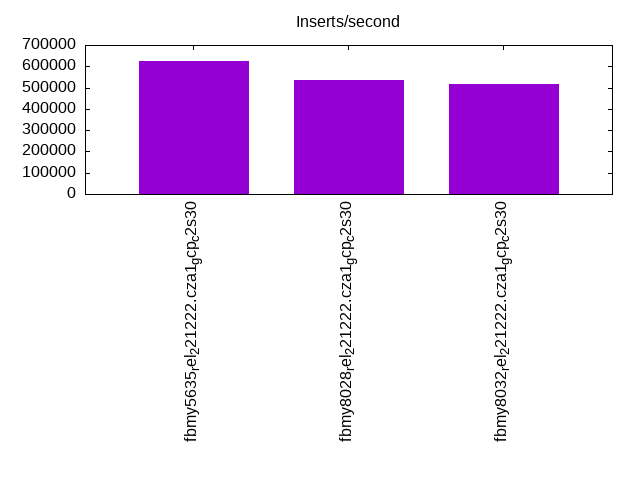
l.i0
l.i0: load without secondary indexes. Graphs for performance per 1-second interval are here.
Average throughput:
Insert response time histogram: each cell has the percentage of responses that take <= the time in the header and max is the max response time in seconds. For the max column values in the top 25% of the range have a red background and in the bottom 25% of the range have a green background. The red background is not used when the min value is within 80% of the max value.
| dbms | 256us | 1ms | 4ms | 16ms | 64ms | 256ms | 1s | 4s | 16s | gt | max |
|---|---|---|---|---|---|---|---|---|---|---|---|
| fbmy5635_rel_221222.cza1_gcp_c2s30 | 37.038 | 62.935 | 0.012 | 0.001 | 0.008 | 0.006 | 0.391 | ||||
| fbmy8028_rel_221222.cza1_gcp_c2s30 | 7.254 | 92.607 | 0.116 | 0.007 | 0.012 | 0.004 | 0.333 | ||||
| fbmy8032_rel_221222.cza1_gcp_c2s30 | 2.937 | 96.917 | 0.122 | 0.007 | 0.015 | 0.003 | 0.337 |
Performance metrics for the DBMS listed above. Some are normalized by throughput, others are not. Legend for results is here.
ips	qps	rps	rmbps	wps	wmbps	rpq	rkbpq	wpi	wkbpi	csps	cpups	cspq	cpupq	dbgb1	dbgb2	rss	maxop	p50	p99	tag
622568	0	0	0.0	519.1	142.7	0.000	0.000	0.001	0.235	71944	72.4	0.116	17	4.7	6.2	1.3	0.391	85036	55140	fbmy5635_rel_221222.cza1_gcp_c2s30
536913	0	0	0.0	458.8	123.4	0.000	0.000	0.001	0.235	61941	73.2	0.115	20	4.7	6.4	1.7	0.333	72321	50345	fbmy8028_rel_221222.cza1_gcp_c2s30
514469	0	0	0.0	442.3	119.0	0.000	0.000	0.001	0.237	59687	72.3	0.116	21	4.6	6.4	1.7	0.337	70622	46949	fbmy8032_rel_221222.cza1_gcp_c2s30
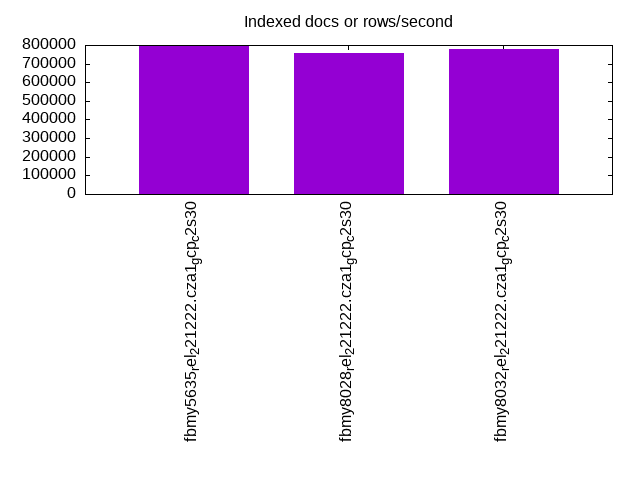
l.x
l.x: create secondary indexes.
Average throughput:
Performance metrics for the DBMS listed above. Some are normalized by throughput, others are not. Legend for results is here.
ips	qps	rps	rmbps	wps	wmbps	rpq	rkbpq	wpi	wkbpi	csps	cpups	cspq	cpupq	dbgb1	dbgb2	rss	maxop	p50	p99	tag
800000	0	1	0.1	304.2	108.2	0.000	0.000	0.000	0.139	1341	49.2	0.002	9	10.5	12.0	11.0	0.002	NA	NA	fbmy5635_rel_221222.cza1_gcp_c2s30
758294	0	1	0.1	291.1	106.3	0.000	0.000	0.000	0.144	1428	48.6	0.002	10	10.4	12.0	13.2	0.003	NA	NA	fbmy8028_rel_221222.cza1_gcp_c2s30
776700	0	1	0.1	292.9	108.0	0.000	0.000	0.000	0.142	1776	50.0	0.002	10	10.4	12.2	13.1	0.003	NA	NA	fbmy8032_rel_221222.cza1_gcp_c2s30
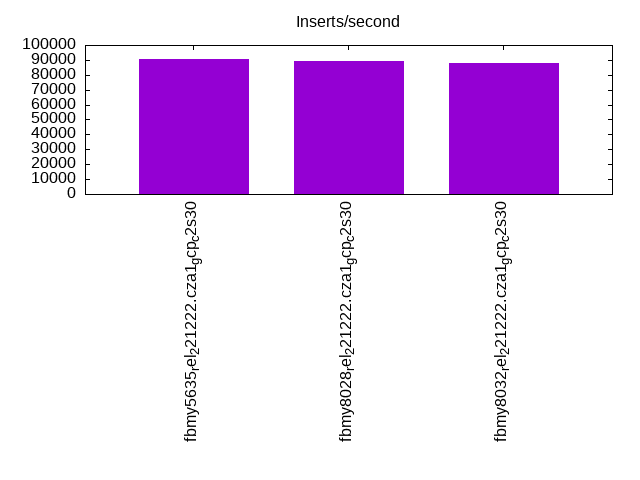
l.i1
l.i1: continue load after secondary indexes created with 50 inserts per transaction. Graphs for performance per 1-second interval are here.
Average throughput:
Insert response time histogram: each cell has the percentage of responses that take <= the time in the header and max is the max response time in seconds. For the max column values in the top 25% of the range have a red background and in the bottom 25% of the range have a green background. The red background is not used when the min value is within 80% of the max value.
| dbms | 256us | 1ms | 4ms | 16ms | 64ms | 256ms | 1s | 4s | 16s | gt | max |
|---|---|---|---|---|---|---|---|---|---|---|---|
| fbmy5635_rel_221222.cza1_gcp_c2s30 | 0.044 | 36.867 | 62.973 | 0.100 | 0.010 | 0.006 | 0.443 | ||||
| fbmy8028_rel_221222.cza1_gcp_c2s30 | 0.015 | 35.087 | 64.776 | 0.103 | 0.014 | 0.004 | 0.467 | ||||
| fbmy8032_rel_221222.cza1_gcp_c2s30 | 0.003 | 33.124 | 66.755 | 0.098 | 0.014 | 0.005 | nonzero | 1.012 |
Delete response time histogram: each cell has the percentage of responses that take <= the time in the header and max is the max response time in seconds. For the max column values in the top 25% of the range have a red background and in the bottom 25% of the range have a green background. The red background is not used when the min value is within 80% of the max value.
| dbms | 256us | 1ms | 4ms | 16ms | 64ms | 256ms | 1s | 4s | 16s | gt | max |
|---|---|---|---|---|---|---|---|---|---|---|---|
| fbmy5635_rel_221222.cza1_gcp_c2s30 | 0.044 | 37.774 | 62.068 | 0.099 | 0.010 | 0.005 | 0.445 | ||||
| fbmy8028_rel_221222.cza1_gcp_c2s30 | 0.019 | 38.363 | 61.502 | 0.098 | 0.014 | 0.004 | 0.477 | ||||
| fbmy8032_rel_221222.cza1_gcp_c2s30 | 0.005 | 35.495 | 64.387 | 0.094 | 0.014 | 0.005 | nonzero | 1.011 |
Performance metrics for the DBMS listed above. Some are normalized by throughput, others are not. Legend for results is here.
ips	qps	rps	rmbps	wps	wmbps	rpq	rkbpq	wpi	wkbpi	csps	cpups	cspq	cpupq	dbgb1	dbgb2	rss	maxop	p50	p99	tag
90370	0	4	0.4	553.0	161.6	0.000	0.004	0.006	1.831	60246	59.6	0.667	99	12.2	12.6	50.3	0.443	11587	8444	fbmy5635_rel_221222.cza1_gcp_c2s30
89536	0	4	0.4	565.2	159.5	0.000	0.004	0.006	1.824	54886	63.3	0.613	106	13.1	13.6	51.7	0.467	11437	7941	fbmy8028_rel_221222.cza1_gcp_c2s30
88033	0	4	0.4	568.6	161.6	0.000	0.004	0.006	1.880	53274	64.5	0.605	110	14.8	15.5	51.7	1.012	11192	7792	fbmy8032_rel_221222.cza1_gcp_c2s30
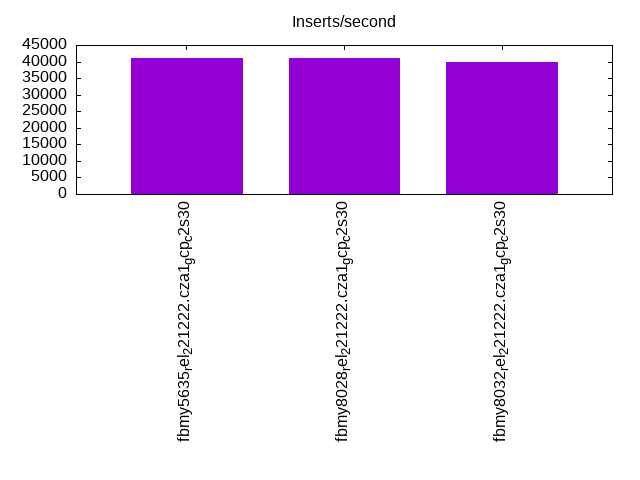
l.i2
l.i2: continue load after secondary indexes created with 5 inserts per transaction. Graphs for performance per 1-second interval are here.
Average throughput:
Insert response time histogram: each cell has the percentage of responses that take <= the time in the header and max is the max response time in seconds. For the max column values in the top 25% of the range have a red background and in the bottom 25% of the range have a green background. The red background is not used when the min value is within 80% of the max value.
| dbms | 256us | 1ms | 4ms | 16ms | 64ms | 256ms | 1s | 4s | 16s | gt | max |
|---|---|---|---|---|---|---|---|---|---|---|---|
| fbmy5635_rel_221222.cza1_gcp_c2s30 | 0.068 | 84.539 | 15.354 | 0.035 | 0.005 | 0.050 | |||||
| fbmy8028_rel_221222.cza1_gcp_c2s30 | 0.003 | 79.350 | 20.536 | 0.106 | 0.003 | 0.002 | 0.001 | 0.311 | |||
| fbmy8032_rel_221222.cza1_gcp_c2s30 | 0.001 | 75.378 | 24.499 | 0.118 | 0.003 | 0.001 | nonzero | 0.315 |
Delete response time histogram: each cell has the percentage of responses that take <= the time in the header and max is the max response time in seconds. For the max column values in the top 25% of the range have a red background and in the bottom 25% of the range have a green background. The red background is not used when the min value is within 80% of the max value.
| dbms | 256us | 1ms | 4ms | 16ms | 64ms | 256ms | 1s | 4s | 16s | gt | max |
|---|---|---|---|---|---|---|---|---|---|---|---|
| fbmy5635_rel_221222.cza1_gcp_c2s30 | 0.002 | 65.324 | 34.630 | 0.038 | 0.006 | 0.050 | |||||
| fbmy8028_rel_221222.cza1_gcp_c2s30 | 71.213 | 28.671 | 0.110 | 0.003 | 0.002 | 0.001 | 0.312 | ||||
| fbmy8032_rel_221222.cza1_gcp_c2s30 | 66.447 | 33.428 | 0.120 | 0.003 | 0.001 | nonzero | 0.286 |
Performance metrics for the DBMS listed above. Some are normalized by throughput, others are not. Legend for results is here.
ips	qps	rps	rmbps	wps	wmbps	rpq	rkbpq	wpi	wkbpi	csps	cpups	cspq	cpupq	dbgb1	dbgb2	rss	maxop	p50	p99	tag
41216	0	0	0.0	302.9	66.7	0.000	0.000	0.007	1.657	249372	64.3	6.050	234	11.8	11.9	61.3	0.050	5281	3218	fbmy5635_rel_221222.cza1_gcp_c2s30
41195	0	0	0.0	318.3	71.8	0.000	0.000	0.008	1.785	224513	68.3	5.450	249	12.0	12.3	62.3	0.311	5394	3082	fbmy8028_rel_221222.cza1_gcp_c2s30
39960	0	0	0.0	308.4	70.3	0.000	0.000	0.008	1.802	217218	68.4	5.436	257	12.0	12.3	62.4	0.315	5241	3061	fbmy8032_rel_221222.cza1_gcp_c2s30
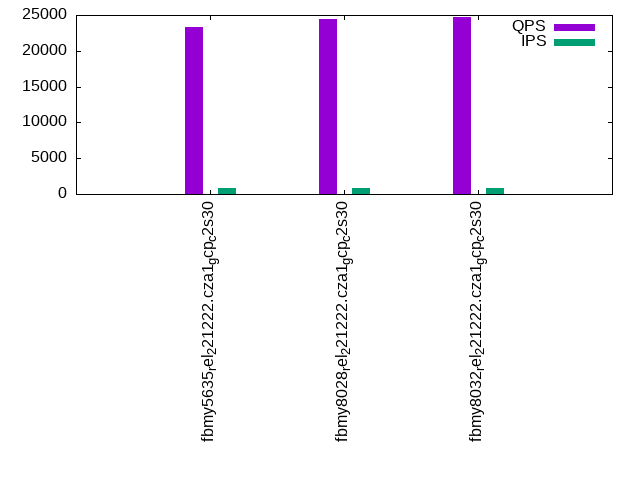
qr100.L1
qr100.L1: range queries with 100 insert/s per client. Graphs for performance per 1-second interval are here.
Average throughput:
Query response time histogram: each cell has the percentage of responses that take <= the time in the header and max is the max response time in seconds. For max values in the top 25% of the range have a red background and in the bottom 25% of the range have a green background. The red background is not used when the min value is within 80% of the max value.
| dbms | 256us | 1ms | 4ms | 16ms | 64ms | 256ms | 1s | 4s | 16s | gt | max |
|---|---|---|---|---|---|---|---|---|---|---|---|
| fbmy5635_rel_221222.cza1_gcp_c2s30 | 66.840 | 29.441 | 3.719 | nonzero | nonzero | 0.055 | |||||
| fbmy8028_rel_221222.cza1_gcp_c2s30 | 68.634 | 29.315 | 2.051 | nonzero | nonzero | 0.040 | |||||
| fbmy8032_rel_221222.cza1_gcp_c2s30 | 67.401 | 30.173 | 2.426 | nonzero | nonzero | 0.029 |
Insert response time histogram: each cell has the percentage of responses that take <= the time in the header and max is the max response time in seconds. For max values in the top 25% of the range have a red background and in the bottom 25% of the range have a green background. The red background is not used when the min value is within 80% of the max value.
| dbms | 256us | 1ms | 4ms | 16ms | 64ms | 256ms | 1s | 4s | 16s | gt | max |
|---|---|---|---|---|---|---|---|---|---|---|---|
| fbmy5635_rel_221222.cza1_gcp_c2s30 | 2.474 | 93.229 | 4.276 | 0.021 | 0.042 | ||||||
| fbmy8028_rel_221222.cza1_gcp_c2s30 | 0.370 | 98.875 | 0.755 | 0.009 | |||||||
| fbmy8032_rel_221222.cza1_gcp_c2s30 | 0.453 | 99.219 | 0.328 | 0.005 |
Delete response time histogram: each cell has the percentage of responses that take <= the time in the header and max is the max response time in seconds. For max values in the top 25% of the range have a red background and in the bottom 25% of the range have a green background. The red background is not used when the min value is within 80% of the max value.
| dbms | 256us | 1ms | 4ms | 16ms | 64ms | 256ms | 1s | 4s | 16s | gt | max |
|---|---|---|---|---|---|---|---|---|---|---|---|
| fbmy5635_rel_221222.cza1_gcp_c2s30 | 2.708 | 93.016 | 4.255 | 0.021 | 0.042 | ||||||
| fbmy8028_rel_221222.cza1_gcp_c2s30 | 4.224 | 95.260 | 0.510 | 0.005 | 0.019 | ||||||
| fbmy8032_rel_221222.cza1_gcp_c2s30 | 2.599 | 97.130 | 0.271 | 0.015 |
Performance metrics for the DBMS listed above. Some are normalized by throughput, others are not. Legend for results is here.
ips	qps	rps	rmbps	wps	wmbps	rpq	rkbpq	wpi	wkbpi	csps	cpups	cspq	cpupq	dbgb1	dbgb2	rss	maxop	p50	p99	tag
794	23293	0	0.0	14.0	3.0	0.000	0.000	0.018	3.888	90555	52.8	3.888	340	11.4	11.6	62.7	0.055	3101	2814	fbmy5635_rel_221222.cza1_gcp_c2s30
794	24414	0	0.0	15.1	3.3	0.000	0.000	0.019	4.258	94704	53.2	3.879	327	11.4	11.8	63.5	0.040	3676	3388	fbmy8028_rel_221222.cza1_gcp_c2s30
794	24778	0	0.0	12.1	2.5	0.000	0.000	0.015	3.192	96044	53.0	3.876	321	11.4	11.8	63.6	0.029	3021	2765	fbmy8032_rel_221222.cza1_gcp_c2s30
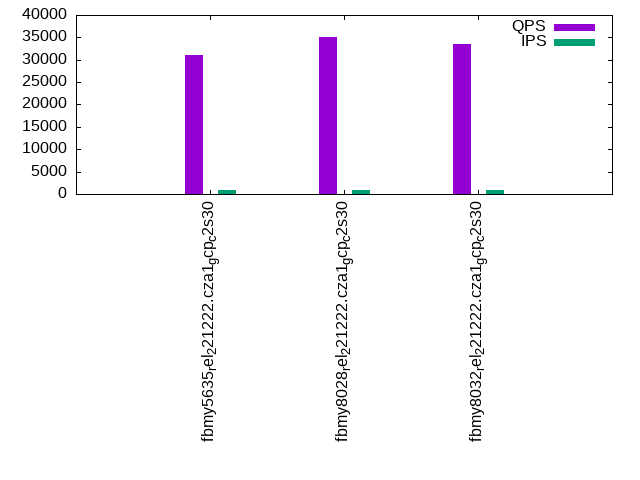
qp100.L2
qp100.L2: point queries with 100 insert/s per client. Graphs for performance per 1-second interval are here.
Average throughput:
Query response time histogram: each cell has the percentage of responses that take <= the time in the header and max is the max response time in seconds. For max values in the top 25% of the range have a red background and in the bottom 25% of the range have a green background. The red background is not used when the min value is within 80% of the max value.
| dbms | 256us | 1ms | 4ms | 16ms | 64ms | 256ms | 1s | 4s | 16s | gt | max |
|---|---|---|---|---|---|---|---|---|---|---|---|
| fbmy5635_rel_221222.cza1_gcp_c2s30 | 81.240 | 18.758 | 0.001 | nonzero | 0.001 | 0.033 | |||||
| fbmy8028_rel_221222.cza1_gcp_c2s30 | 95.841 | 4.157 | 0.001 | nonzero | 0.001 | 0.020 | |||||
| fbmy8032_rel_221222.cza1_gcp_c2s30 | 93.339 | 6.659 | 0.001 | nonzero | 0.001 | 0.021 |
Insert response time histogram: each cell has the percentage of responses that take <= the time in the header and max is the max response time in seconds. For max values in the top 25% of the range have a red background and in the bottom 25% of the range have a green background. The red background is not used when the min value is within 80% of the max value.
| dbms | 256us | 1ms | 4ms | 16ms | 64ms | 256ms | 1s | 4s | 16s | gt | max |
|---|---|---|---|---|---|---|---|---|---|---|---|
| fbmy5635_rel_221222.cza1_gcp_c2s30 | 1.396 | 84.245 | 14.359 | 0.014 | |||||||
| fbmy8028_rel_221222.cza1_gcp_c2s30 | 0.531 | 99.318 | 0.151 | 0.006 | |||||||
| fbmy8032_rel_221222.cza1_gcp_c2s30 | 0.302 | 99.208 | 0.490 | 0.008 |
Delete response time histogram: each cell has the percentage of responses that take <= the time in the header and max is the max response time in seconds. For max values in the top 25% of the range have a red background and in the bottom 25% of the range have a green background. The red background is not used when the min value is within 80% of the max value.
| dbms | 256us | 1ms | 4ms | 16ms | 64ms | 256ms | 1s | 4s | 16s | gt | max |
|---|---|---|---|---|---|---|---|---|---|---|---|
| fbmy5635_rel_221222.cza1_gcp_c2s30 | 2.573 | 82.979 | 14.448 | 0.014 | |||||||
| fbmy8028_rel_221222.cza1_gcp_c2s30 | 6.396 | 93.438 | 0.167 | 0.006 | |||||||
| fbmy8032_rel_221222.cza1_gcp_c2s30 | 3.057 | 96.479 | 0.464 | 0.008 |
Performance metrics for the DBMS listed above. Some are normalized by throughput, others are not. Legend for results is here.
ips	qps	rps	rmbps	wps	wmbps	rpq	rkbpq	wpi	wkbpi	csps	cpups	cspq	cpupq	dbgb1	dbgb2	rss	maxop	p50	p99	tag
793	31148	0	0.0	12.8	3.1	0.000	0.000	0.016	3.970	130140	53.3	4.178	257	11.4	11.8	73.1	0.033	3948	3468	fbmy5635_rel_221222.cza1_gcp_c2s30
794	35102	0	0.0	12.5	3.3	0.000	0.000	0.016	4.265	145619	54.0	4.148	231	11.4	12.0	74.5	0.020	4443	3757	fbmy8028_rel_221222.cza1_gcp_c2s30
794	33476	0	0.0	11.5	2.8	0.000	0.000	0.015	3.658	138206	53.9	4.128	242	11.5	12.1	73.8	0.021	4205	3596	fbmy8032_rel_221222.cza1_gcp_c2s30
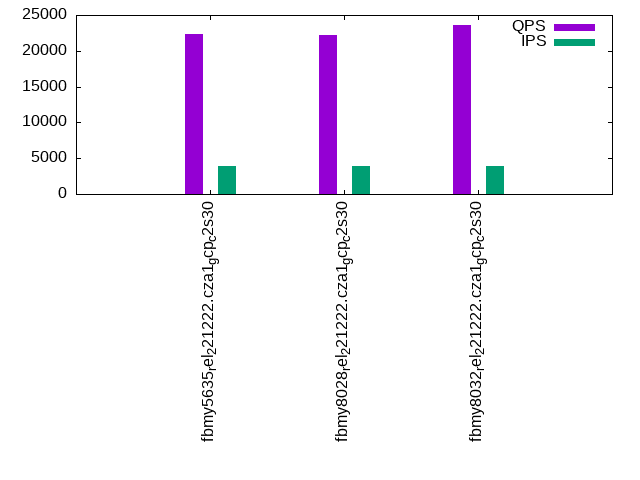
qr500.L3
qr500.L3: range queries with 500 insert/s per client. Graphs for performance per 1-second interval are here.
Average throughput:
Query response time histogram: each cell has the percentage of responses that take <= the time in the header and max is the max response time in seconds. For max values in the top 25% of the range have a red background and in the bottom 25% of the range have a green background. The red background is not used when the min value is within 80% of the max value.
| dbms | 256us | 1ms | 4ms | 16ms | 64ms | 256ms | 1s | 4s | 16s | gt | max |
|---|---|---|---|---|---|---|---|---|---|---|---|
| fbmy5635_rel_221222.cza1_gcp_c2s30 | 64.927 | 31.473 | 3.599 | 0.001 | nonzero | nonzero | 0.070 | ||||
| fbmy8028_rel_221222.cza1_gcp_c2s30 | 68.845 | 26.909 | 4.246 | 0.001 | nonzero | 0.060 | |||||
| fbmy8032_rel_221222.cza1_gcp_c2s30 | 70.732 | 25.381 | 3.886 | 0.001 | nonzero | 0.061 |
Insert response time histogram: each cell has the percentage of responses that take <= the time in the header and max is the max response time in seconds. For max values in the top 25% of the range have a red background and in the bottom 25% of the range have a green background. The red background is not used when the min value is within 80% of the max value.
| dbms | 256us | 1ms | 4ms | 16ms | 64ms | 256ms | 1s | 4s | 16s | gt | max |
|---|---|---|---|---|---|---|---|---|---|---|---|
| fbmy5635_rel_221222.cza1_gcp_c2s30 | 2.191 | 58.028 | 39.740 | 0.042 | 0.021 | ||||||
| fbmy8028_rel_221222.cza1_gcp_c2s30 | 0.721 | 75.793 | 23.472 | 0.015 | 0.022 | ||||||
| fbmy8032_rel_221222.cza1_gcp_c2s30 | 0.342 | 74.067 | 25.552 | 0.040 | 0.020 |
Delete response time histogram: each cell has the percentage of responses that take <= the time in the header and max is the max response time in seconds. For max values in the top 25% of the range have a red background and in the bottom 25% of the range have a green background. The red background is not used when the min value is within 80% of the max value.
| dbms | 256us | 1ms | 4ms | 16ms | 64ms | 256ms | 1s | 4s | 16s | gt | max |
|---|---|---|---|---|---|---|---|---|---|---|---|
| fbmy5635_rel_221222.cza1_gcp_c2s30 | 2.323 | 58.329 | 39.307 | 0.041 | 0.020 | ||||||
| fbmy8028_rel_221222.cza1_gcp_c2s30 | 2.649 | 75.254 | 22.082 | 0.015 | 0.023 | ||||||
| fbmy8032_rel_221222.cza1_gcp_c2s30 | 1.418 | 74.323 | 24.216 | 0.044 | 0.030 |
Performance metrics for the DBMS listed above. Some are normalized by throughput, others are not. Legend for results is here.
ips	qps	rps	rmbps	wps	wmbps	rpq	rkbpq	wpi	wkbpi	csps	cpups	cspq	cpupq	dbgb1	dbgb2	rss	maxop	p50	p99	tag
3970	22313	0	0.0	54.4	17.3	0.000	0.000	0.014	4.471	87683	56.0	3.930	376	11.5	12.9	78.7	0.070	2605	2190	fbmy5635_rel_221222.cza1_gcp_c2s30
3970	22244	0	0.0	53.8	17.8	0.000	0.000	0.014	4.598	87081	56.7	3.915	382	11.4	13.1	79.4	0.060	3069	2606	fbmy8028_rel_221222.cza1_gcp_c2s30
3967	23576	0	0.0	55.2	18.2	0.000	0.000	0.014	4.708	92281	56.8	3.914	361	11.5	13.2	78.7	0.061	3932	2493	fbmy8032_rel_221222.cza1_gcp_c2s30
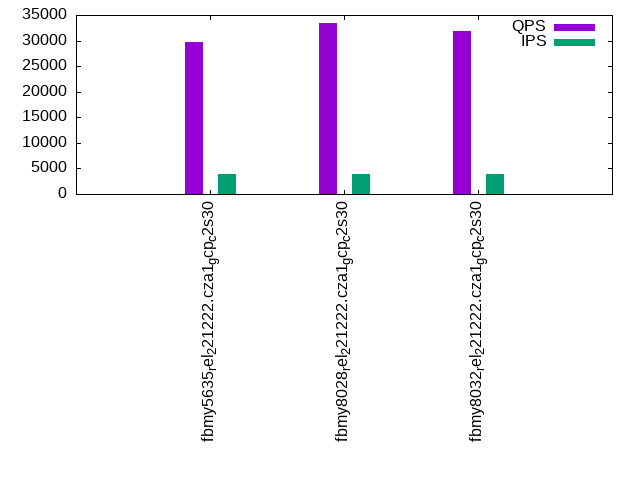
qp500.L4
qp500.L4: point queries with 500 insert/s per client. Graphs for performance per 1-second interval are here.
Average throughput:
Query response time histogram: each cell has the percentage of responses that take <= the time in the header and max is the max response time in seconds. For max values in the top 25% of the range have a red background and in the bottom 25% of the range have a green background. The red background is not used when the min value is within 80% of the max value.
| dbms | 256us | 1ms | 4ms | 16ms | 64ms | 256ms | 1s | 4s | 16s | gt | max |
|---|---|---|---|---|---|---|---|---|---|---|---|
| fbmy5635_rel_221222.cza1_gcp_c2s30 | 61.325 | 38.661 | 0.014 | nonzero | nonzero | 0.027 | |||||
| fbmy8028_rel_221222.cza1_gcp_c2s30 | 89.777 | 10.211 | 0.011 | nonzero | nonzero | 0.024 | |||||
| fbmy8032_rel_221222.cza1_gcp_c2s30 | 83.841 | 16.145 | 0.013 | nonzero | 0.015 |
Insert response time histogram: each cell has the percentage of responses that take <= the time in the header and max is the max response time in seconds. For max values in the top 25% of the range have a red background and in the bottom 25% of the range have a green background. The red background is not used when the min value is within 80% of the max value.
| dbms | 256us | 1ms | 4ms | 16ms | 64ms | 256ms | 1s | 4s | 16s | gt | max |
|---|---|---|---|---|---|---|---|---|---|---|---|
| fbmy5635_rel_221222.cza1_gcp_c2s30 | 0.449 | 43.562 | 55.925 | 0.064 | 0.024 | ||||||
| fbmy8028_rel_221222.cza1_gcp_c2s30 | 0.263 | 70.123 | 29.599 | 0.016 | 0.020 | ||||||
| fbmy8032_rel_221222.cza1_gcp_c2s30 | 0.027 | 64.300 | 35.653 | 0.020 | 0.022 |
Delete response time histogram: each cell has the percentage of responses that take <= the time in the header and max is the max response time in seconds. For max values in the top 25% of the range have a red background and in the bottom 25% of the range have a green background. The red background is not used when the min value is within 80% of the max value.
| dbms | 256us | 1ms | 4ms | 16ms | 64ms | 256ms | 1s | 4s | 16s | gt | max |
|---|---|---|---|---|---|---|---|---|---|---|---|
| fbmy5635_rel_221222.cza1_gcp_c2s30 | 0.694 | 44.695 | 54.538 | 0.074 | 0.025 | ||||||
| fbmy8028_rel_221222.cza1_gcp_c2s30 | 2.032 | 69.915 | 28.030 | 0.022 | 0.001 | 0.069 | |||||
| fbmy8032_rel_221222.cza1_gcp_c2s30 | 0.596 | 65.174 | 34.216 | 0.015 | 0.024 |
Performance metrics for the DBMS listed above. Some are normalized by throughput, others are not. Legend for results is here.
ips	qps	rps	rmbps	wps	wmbps	rpq	rkbpq	wpi	wkbpi	csps	cpups	cspq	cpupq	dbgb1	dbgb2	rss	maxop	p50	p99	tag
3970	29668	0	0.0	62.0	17.9	0.000	0.000	0.016	4.619	127702	56.8	4.304	287	11.6	12.1	80.1	0.027	3804	3356	fbmy5635_rel_221222.cza1_gcp_c2s30
3970	33340	0	0.0	58.6	17.9	0.000	0.000	0.015	4.613	141677	57.4	4.249	258	11.6	12.3	81.2	0.024	4251	3708	fbmy8028_rel_221222.cza1_gcp_c2s30
3967	31868	0	0.0	63.4	18.6	0.000	0.000	0.016	4.798	134512	57.7	4.221	272	11.6	12.3	81.4	0.015	4044	3484	fbmy8032_rel_221222.cza1_gcp_c2s30
qr1000.L5
qr1000.L5: range queries with 1000 insert/s per client. Graphs for performance per 1-second interval are here.
Average throughput:
Query response time histogram: each cell has the percentage of responses that take <= the time in the header and max is the max response time in seconds. For max values in the top 25% of the range have a red background and in the bottom 25% of the range have a green background. The red background is not used when the min value is within 80% of the max value.
| dbms | 256us | 1ms | 4ms | 16ms | 64ms | 256ms | 1s | 4s | 16s | gt | max |
|---|---|---|---|---|---|---|---|---|---|---|---|
| fbmy5635_rel_221222.cza1_gcp_c2s30 | 60.789 | 31.946 | 7.263 | 0.002 | nonzero | nonzero | 0.075 | ||||
| fbmy8028_rel_221222.cza1_gcp_c2s30 | 66.289 | 29.076 | 4.634 | 0.001 | nonzero | nonzero | 0.080 | ||||
| fbmy8032_rel_221222.cza1_gcp_c2s30 | 67.675 | 26.876 | 5.448 | 0.001 | nonzero | nonzero | 0.074 |
Insert response time histogram: each cell has the percentage of responses that take <= the time in the header and max is the max response time in seconds. For max values in the top 25% of the range have a red background and in the bottom 25% of the range have a green background. The red background is not used when the min value is within 80% of the max value.
| dbms | 256us | 1ms | 4ms | 16ms | 64ms | 256ms | 1s | 4s | 16s | gt | max |
|---|---|---|---|---|---|---|---|---|---|---|---|
| fbmy5635_rel_221222.cza1_gcp_c2s30 | 1.091 | 44.479 | 54.348 | 0.082 | 0.030 | ||||||
| fbmy8028_rel_221222.cza1_gcp_c2s30 | 0.144 | 53.642 | 46.157 | 0.057 | 0.030 | ||||||
| fbmy8032_rel_221222.cza1_gcp_c2s30 | 0.052 | 56.131 | 43.785 | 0.032 | 0.028 |
Delete response time histogram: each cell has the percentage of responses that take <= the time in the header and max is the max response time in seconds. For max values in the top 25% of the range have a red background and in the bottom 25% of the range have a green background. The red background is not used when the min value is within 80% of the max value.
| dbms | 256us | 1ms | 4ms | 16ms | 64ms | 256ms | 1s | 4s | 16s | gt | max |
|---|---|---|---|---|---|---|---|---|---|---|---|
| fbmy5635_rel_221222.cza1_gcp_c2s30 | 1.169 | 45.075 | 53.674 | 0.082 | 0.001 | 0.068 | |||||
| fbmy8028_rel_221222.cza1_gcp_c2s30 | 1.042 | 54.515 | 44.383 | 0.061 | 0.030 | ||||||
| fbmy8032_rel_221222.cza1_gcp_c2s30 | 0.449 | 57.255 | 42.270 | 0.026 | 0.031 |
Performance metrics for the DBMS listed above. Some are normalized by throughput, others are not. Legend for results is here.
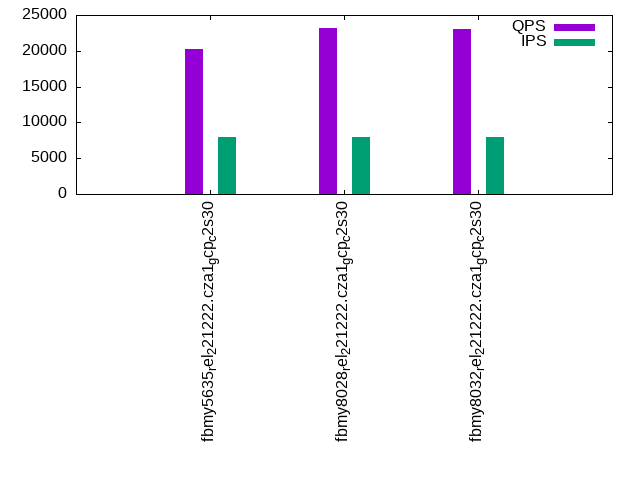
ips	qps	rps	rmbps	wps	wmbps	rpq	rkbpq	wpi	wkbpi	csps	cpups	cspq	cpupq	dbgb1	dbgb2	rss	maxop	p50	p99	tag
7947	20198	0	0.0	120.3	33.6	0.000	0.000	0.015	4.335	80559	60.5	3.989	449	12.1	12.8	80.7	0.075	2830	2286	fbmy5635_rel_221222.cza1_gcp_c2s30
7947	23151	0	0.0	124.1	36.2	0.000	0.000	0.016	4.667	91296	61.3	3.943	397	12.2	13.1	81.9	0.080	3294	2270	fbmy8028_rel_221222.cza1_gcp_c2s30
7940	23008	0	0.0	120.0	34.2	0.000	0.000	0.015	4.405	90647	61.2	3.940	399	12.1	13.0	81.7	0.074	3037	2365	fbmy8032_rel_221222.cza1_gcp_c2s30
qp1000.L6
qp1000.L6: point queries with 1000 insert/s per client. Graphs for performance per 1-second interval are here.
Average throughput:
Query response time histogram: each cell has the percentage of responses that take <= the time in the header and max is the max response time in seconds. For max values in the top 25% of the range have a red background and in the bottom 25% of the range have a green background. The red background is not used when the min value is within 80% of the max value.
| dbms | 256us | 1ms | 4ms | 16ms | 64ms | 256ms | 1s | 4s | 16s | gt | max |
|---|---|---|---|---|---|---|---|---|---|---|---|
| fbmy5635_rel_221222.cza1_gcp_c2s30 | 36.933 | 63.014 | 0.051 | 0.001 | 0.002 | 0.042 | |||||
| fbmy8028_rel_221222.cza1_gcp_c2s30 | 77.968 | 21.993 | 0.038 | 0.001 | 0.001 | 0.042 | |||||
| fbmy8032_rel_221222.cza1_gcp_c2s30 | 66.708 | 33.248 | 0.042 | 0.001 | 0.001 | 0.042 |
Insert response time histogram: each cell has the percentage of responses that take <= the time in the header and max is the max response time in seconds. For max values in the top 25% of the range have a red background and in the bottom 25% of the range have a green background. The red background is not used when the min value is within 80% of the max value.
| dbms | 256us | 1ms | 4ms | 16ms | 64ms | 256ms | 1s | 4s | 16s | gt | max |
|---|---|---|---|---|---|---|---|---|---|---|---|
| fbmy5635_rel_221222.cza1_gcp_c2s30 | 0.452 | 41.249 | 58.217 | 0.081 | 0.040 | ||||||
| fbmy8028_rel_221222.cza1_gcp_c2s30 | 0.067 | 52.315 | 47.586 | 0.032 | 0.042 | ||||||
| fbmy8032_rel_221222.cza1_gcp_c2s30 | 0.011 | 50.972 | 48.965 | 0.052 | 0.041 |
Delete response time histogram: each cell has the percentage of responses that take <= the time in the header and max is the max response time in seconds. For max values in the top 25% of the range have a red background and in the bottom 25% of the range have a green background. The red background is not used when the min value is within 80% of the max value.
| dbms | 256us | 1ms | 4ms | 16ms | 64ms | 256ms | 1s | 4s | 16s | gt | max |
|---|---|---|---|---|---|---|---|---|---|---|---|
| fbmy5635_rel_221222.cza1_gcp_c2s30 | 0.683 | 42.282 | 56.954 | 0.081 | 0.044 | ||||||
| fbmy8028_rel_221222.cza1_gcp_c2s30 | 0.857 | 53.685 | 45.424 | 0.033 | 0.001 | 0.074 | |||||
| fbmy8032_rel_221222.cza1_gcp_c2s30 | 0.231 | 52.488 | 47.219 | 0.061 | 0.001 | 0.065 |
Performance metrics for the DBMS listed above. Some are normalized by throughput, others are not. Legend for results is here.
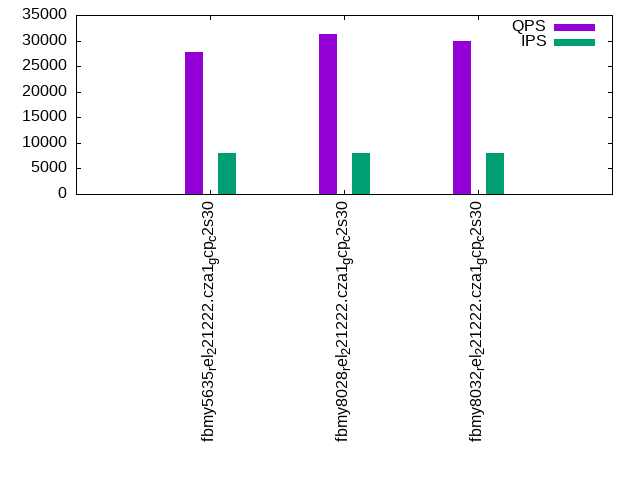
ips	qps	rps	rmbps	wps	wmbps	rpq	rkbpq	wpi	wkbpi	csps	cpups	cspq	cpupq	dbgb1	dbgb2	rss	maxop	p50	p99	tag
7947	27849	0	0.0	117.0	32.8	0.000	0.000	0.015	4.230	123892	60.7	4.449	327	12.3	13.1	81.9	0.042	3533	3021	fbmy5635_rel_221222.cza1_gcp_c2s30
7947	31341	0	0.0	118.5	34.8	0.000	0.000	0.015	4.480	135937	61.6	4.337	295	12.3	13.3	83.3	0.042	3948	3390	fbmy8028_rel_221222.cza1_gcp_c2s30
7940	29824	0	0.0	124.9	35.0	0.000	0.000	0.016	4.517	128712	62.0	4.316	312	12.3	13.2	83.7	0.042	3756	3101	fbmy8032_rel_221222.cza1_gcp_c2s30
l.i0
l.i0: load without secondary indexes
Performance metrics for all DBMS, not just the ones listed above. Some are normalized by throughput, others are not. Legend for results is here.
ips	qps	rps	rmbps	wps	wmbps	rpq	rkbpq	wpi	wkbpi	csps	cpups	cspq	cpupq	dbgb1	dbgb2	rss	maxop	p50	p99	tag
622568	0	0	0.0	519.1	142.7	0.000	0.000	0.001	0.235	71944	72.4	0.116	17	4.7	6.2	1.3	0.391	85036	55140	fbmy5635_rel_221222.cza1_gcp_c2s30
536913	0	0	0.0	458.8	123.4	0.000	0.000	0.001	0.235	61941	73.2	0.115	20	4.7	6.4	1.7	0.333	72321	50345	fbmy8028_rel_221222.cza1_gcp_c2s30
514469	0	0	0.0	442.3	119.0	0.000	0.000	0.001	0.237	59687	72.3	0.116	21	4.6	6.4	1.7	0.337	70622	46949	fbmy8032_rel_221222.cza1_gcp_c2s30
l.x
l.x: create secondary indexes
Performance metrics for all DBMS, not just the ones listed above. Some are normalized by throughput, others are not. Legend for results is here.
ips	qps	rps	rmbps	wps	wmbps	rpq	rkbpq	wpi	wkbpi	csps	cpups	cspq	cpupq	dbgb1	dbgb2	rss	maxop	p50	p99	tag
800000	0	1	0.1	304.2	108.2	0.000	0.000	0.000	0.139	1341	49.2	0.002	9	10.5	12.0	11.0	0.002	NA	NA	fbmy5635_rel_221222.cza1_gcp_c2s30
758294	0	1	0.1	291.1	106.3	0.000	0.000	0.000	0.144	1428	48.6	0.002	10	10.4	12.0	13.2	0.003	NA	NA	fbmy8028_rel_221222.cza1_gcp_c2s30
776700	0	1	0.1	292.9	108.0	0.000	0.000	0.000	0.142	1776	50.0	0.002	10	10.4	12.2	13.1	0.003	NA	NA	fbmy8032_rel_221222.cza1_gcp_c2s30
l.i1
l.i1: continue load after secondary indexes created with 50 inserts per transaction
Performance metrics for all DBMS, not just the ones listed above. Some are normalized by throughput, others are not. Legend for results is here.
ips	qps	rps	rmbps	wps	wmbps	rpq	rkbpq	wpi	wkbpi	csps	cpups	cspq	cpupq	dbgb1	dbgb2	rss	maxop	p50	p99	tag
90370	0	4	0.4	553.0	161.6	0.000	0.004	0.006	1.831	60246	59.6	0.667	99	12.2	12.6	50.3	0.443	11587	8444	fbmy5635_rel_221222.cza1_gcp_c2s30
89536	0	4	0.4	565.2	159.5	0.000	0.004	0.006	1.824	54886	63.3	0.613	106	13.1	13.6	51.7	0.467	11437	7941	fbmy8028_rel_221222.cza1_gcp_c2s30
88033	0	4	0.4	568.6	161.6	0.000	0.004	0.006	1.880	53274	64.5	0.605	110	14.8	15.5	51.7	1.012	11192	7792	fbmy8032_rel_221222.cza1_gcp_c2s30
l.i2
l.i2: continue load after secondary indexes created with 5 inserts per transaction
Performance metrics for all DBMS, not just the ones listed above. Some are normalized by throughput, others are not. Legend for results is here.
ips	qps	rps	rmbps	wps	wmbps	rpq	rkbpq	wpi	wkbpi	csps	cpups	cspq	cpupq	dbgb1	dbgb2	rss	maxop	p50	p99	tag
41216	0	0	0.0	302.9	66.7	0.000	0.000	0.007	1.657	249372	64.3	6.050	234	11.8	11.9	61.3	0.050	5281	3218	fbmy5635_rel_221222.cza1_gcp_c2s30
41195	0	0	0.0	318.3	71.8	0.000	0.000	0.008	1.785	224513	68.3	5.450	249	12.0	12.3	62.3	0.311	5394	3082	fbmy8028_rel_221222.cza1_gcp_c2s30
39960	0	0	0.0	308.4	70.3	0.000	0.000	0.008	1.802	217218	68.4	5.436	257	12.0	12.3	62.4	0.315	5241	3061	fbmy8032_rel_221222.cza1_gcp_c2s30
qr100.L1
qr100.L1: range queries with 100 insert/s per client
Performance metrics for all DBMS, not just the ones listed above. Some are normalized by throughput, others are not. Legend for results is here.
ips	qps	rps	rmbps	wps	wmbps	rpq	rkbpq	wpi	wkbpi	csps	cpups	cspq	cpupq	dbgb1	dbgb2	rss	maxop	p50	p99	tag
794	23293	0	0.0	14.0	3.0	0.000	0.000	0.018	3.888	90555	52.8	3.888	340	11.4	11.6	62.7	0.055	3101	2814	fbmy5635_rel_221222.cza1_gcp_c2s30
794	24414	0	0.0	15.1	3.3	0.000	0.000	0.019	4.258	94704	53.2	3.879	327	11.4	11.8	63.5	0.040	3676	3388	fbmy8028_rel_221222.cza1_gcp_c2s30
794	24778	0	0.0	12.1	2.5	0.000	0.000	0.015	3.192	96044	53.0	3.876	321	11.4	11.8	63.6	0.029	3021	2765	fbmy8032_rel_221222.cza1_gcp_c2s30
qp100.L2
qp100.L2: point queries with 100 insert/s per client
Performance metrics for all DBMS, not just the ones listed above. Some are normalized by throughput, others are not. Legend for results is here.
ips	qps	rps	rmbps	wps	wmbps	rpq	rkbpq	wpi	wkbpi	csps	cpups	cspq	cpupq	dbgb1	dbgb2	rss	maxop	p50	p99	tag
793	31148	0	0.0	12.8	3.1	0.000	0.000	0.016	3.970	130140	53.3	4.178	257	11.4	11.8	73.1	0.033	3948	3468	fbmy5635_rel_221222.cza1_gcp_c2s30
794	35102	0	0.0	12.5	3.3	0.000	0.000	0.016	4.265	145619	54.0	4.148	231	11.4	12.0	74.5	0.020	4443	3757	fbmy8028_rel_221222.cza1_gcp_c2s30
794	33476	0	0.0	11.5	2.8	0.000	0.000	0.015	3.658	138206	53.9	4.128	242	11.5	12.1	73.8	0.021	4205	3596	fbmy8032_rel_221222.cza1_gcp_c2s30
qr500.L3
qr500.L3: range queries with 500 insert/s per client
Performance metrics for all DBMS, not just the ones listed above. Some are normalized by throughput, others are not. Legend for results is here.
ips	qps	rps	rmbps	wps	wmbps	rpq	rkbpq	wpi	wkbpi	csps	cpups	cspq	cpupq	dbgb1	dbgb2	rss	maxop	p50	p99	tag
3970	22313	0	0.0	54.4	17.3	0.000	0.000	0.014	4.471	87683	56.0	3.930	376	11.5	12.9	78.7	0.070	2605	2190	fbmy5635_rel_221222.cza1_gcp_c2s30
3970	22244	0	0.0	53.8	17.8	0.000	0.000	0.014	4.598	87081	56.7	3.915	382	11.4	13.1	79.4	0.060	3069	2606	fbmy8028_rel_221222.cza1_gcp_c2s30
3967	23576	0	0.0	55.2	18.2	0.000	0.000	0.014	4.708	92281	56.8	3.914	361	11.5	13.2	78.7	0.061	3932	2493	fbmy8032_rel_221222.cza1_gcp_c2s30
qp500.L4
qp500.L4: point queries with 500 insert/s per client
Performance metrics for all DBMS, not just the ones listed above. Some are normalized by throughput, others are not. Legend for results is here.
ips	qps	rps	rmbps	wps	wmbps	rpq	rkbpq	wpi	wkbpi	csps	cpups	cspq	cpupq	dbgb1	dbgb2	rss	maxop	p50	p99	tag
3970	29668	0	0.0	62.0	17.9	0.000	0.000	0.016	4.619	127702	56.8	4.304	287	11.6	12.1	80.1	0.027	3804	3356	fbmy5635_rel_221222.cza1_gcp_c2s30
3970	33340	0	0.0	58.6	17.9	0.000	0.000	0.015	4.613	141677	57.4	4.249	258	11.6	12.3	81.2	0.024	4251	3708	fbmy8028_rel_221222.cza1_gcp_c2s30
3967	31868	0	0.0	63.4	18.6	0.000	0.000	0.016	4.798	134512	57.7	4.221	272	11.6	12.3	81.4	0.015	4044	3484	fbmy8032_rel_221222.cza1_gcp_c2s30
qr1000.L5
qr1000.L5: range queries with 1000 insert/s per client
Performance metrics for all DBMS, not just the ones listed above. Some are normalized by throughput, others are not. Legend for results is here.
ips	qps	rps	rmbps	wps	wmbps	rpq	rkbpq	wpi	wkbpi	csps	cpups	cspq	cpupq	dbgb1	dbgb2	rss	maxop	p50	p99	tag
7947	20198	0	0.0	120.3	33.6	0.000	0.000	0.015	4.335	80559	60.5	3.989	449	12.1	12.8	80.7	0.075	2830	2286	fbmy5635_rel_221222.cza1_gcp_c2s30
7947	23151	0	0.0	124.1	36.2	0.000	0.000	0.016	4.667	91296	61.3	3.943	397	12.2	13.1	81.9	0.080	3294	2270	fbmy8028_rel_221222.cza1_gcp_c2s30
7940	23008	0	0.0	120.0	34.2	0.000	0.000	0.015	4.405	90647	61.2	3.940	399	12.1	13.0	81.7	0.074	3037	2365	fbmy8032_rel_221222.cza1_gcp_c2s30
qp1000.L6
qp1000.L6: point queries with 1000 insert/s per client
Performance metrics for all DBMS, not just the ones listed above. Some are normalized by throughput, others are not. Legend for results is here.
ips	qps	rps	rmbps	wps	wmbps	rpq	rkbpq	wpi	wkbpi	csps	cpups	cspq	cpupq	dbgb1	dbgb2	rss	maxop	p50	p99	tag
7947	27849	0	0.0	117.0	32.8	0.000	0.000	0.015	4.230	123892	60.7	4.449	327	12.3	13.1	81.9	0.042	3533	3021	fbmy5635_rel_221222.cza1_gcp_c2s30
7947	31341	0	0.0	118.5	34.8	0.000	0.000	0.015	4.480	135937	61.6	4.337	295	12.3	13.3	83.3	0.042	3948	3390	fbmy8028_rel_221222.cza1_gcp_c2s30
7940	29824	0	0.0	124.9	35.0	0.000	0.000	0.016	4.517	128712	62.0	4.316	312	12.3	13.2	83.7	0.042	3756	3101	fbmy8032_rel_221222.cza1_gcp_c2s30
l.i0
- l.i0: load without secondary indexes
- Legend for results is here.
- Each entry lists the percentage of responses that fit in that bucket (slower than max time for previous bucket, faster than min time for next bucket).
Insert response time histogram
256us	1ms	4ms	16ms	64ms	256ms	1s	4s	16s	gt	max	tag
0.000	37.038	62.935	0.012	0.001	0.008	0.006	0.000	0.000	0.000	0.391	fbmy5635_rel_221222.cza1_gcp_c2s30
0.000	7.254	92.607	0.116	0.007	0.012	0.004	0.000	0.000	0.000	0.333	fbmy8028_rel_221222.cza1_gcp_c2s30
0.000	2.937	96.917	0.122	0.007	0.015	0.003	0.000	0.000	0.000	0.337	fbmy8032_rel_221222.cza1_gcp_c2s30
l.x
- l.x: create secondary indexes
- Legend for results is here.
- Each entry lists the percentage of responses that fit in that bucket (slower than max time for previous bucket, faster than min time for next bucket).
TODO - determine whether there is data for create index response time
l.i1
- l.i1: continue load after secondary indexes created with 50 inserts per transaction
- Legend for results is here.
- Each entry lists the percentage of responses that fit in that bucket (slower than max time for previous bucket, faster than min time for next bucket).
Insert response time histogram
256us	1ms	4ms	16ms	64ms	256ms	1s	4s	16s	gt	max	tag
0.000	0.044	36.867	62.973	0.100	0.010	0.006	0.000	0.000	0.000	0.443	fbmy5635_rel_221222.cza1_gcp_c2s30
0.000	0.015	35.087	64.776	0.103	0.014	0.004	0.000	0.000	0.000	0.467	fbmy8028_rel_221222.cza1_gcp_c2s30
0.000	0.003	33.124	66.755	0.098	0.014	0.005	nonzero	0.000	0.000	1.012	fbmy8032_rel_221222.cza1_gcp_c2s30
Delete response time histogram
256us	1ms	4ms	16ms	64ms	256ms	1s	4s	16s	gt	max	tag
0.000	0.044	37.774	62.068	0.099	0.010	0.005	0.000	0.000	0.000	0.445	fbmy5635_rel_221222.cza1_gcp_c2s30
0.000	0.019	38.363	61.502	0.098	0.014	0.004	0.000	0.000	0.000	0.477	fbmy8028_rel_221222.cza1_gcp_c2s30
0.000	0.005	35.495	64.387	0.094	0.014	0.005	nonzero	0.000	0.000	1.011	fbmy8032_rel_221222.cza1_gcp_c2s30
l.i2
- l.i2: continue load after secondary indexes created with 5 inserts per transaction
- Legend for results is here.
- Each entry lists the percentage of responses that fit in that bucket (slower than max time for previous bucket, faster than min time for next bucket).
Insert response time histogram
256us	1ms	4ms	16ms	64ms	256ms	1s	4s	16s	gt	max	tag
0.068	84.539	15.354	0.035	0.005	0.000	0.000	0.000	0.000	0.000	0.050	fbmy5635_rel_221222.cza1_gcp_c2s30
0.003	79.350	20.536	0.106	0.003	0.002	0.001	0.000	0.000	0.000	0.311	fbmy8028_rel_221222.cza1_gcp_c2s30
0.001	75.378	24.499	0.118	0.003	0.001	nonzero	0.000	0.000	0.000	0.315	fbmy8032_rel_221222.cza1_gcp_c2s30
Delete response time histogram
256us	1ms	4ms	16ms	64ms	256ms	1s	4s	16s	gt	max	tag
0.002	65.324	34.630	0.038	0.006	0.000	0.000	0.000	0.000	0.000	0.050	fbmy5635_rel_221222.cza1_gcp_c2s30
0.000	71.213	28.671	0.110	0.003	0.002	0.001	0.000	0.000	0.000	0.312	fbmy8028_rel_221222.cza1_gcp_c2s30
0.000	66.447	33.428	0.120	0.003	0.001	nonzero	0.000	0.000	0.000	0.286	fbmy8032_rel_221222.cza1_gcp_c2s30
qr100.L1
- qr100.L1: range queries with 100 insert/s per client
- Legend for results is here.
- Each entry lists the percentage of responses that fit in that bucket (slower than max time for previous bucket, faster than min time for next bucket).
Query response time histogram
256us	1ms	4ms	16ms	64ms	256ms	1s	4s	16s	gt	max	tag
66.840	29.441	3.719	nonzero	nonzero	0.000	0.000	0.000	0.000	0.000	0.055	fbmy5635_rel_221222.cza1_gcp_c2s30
68.634	29.315	2.051	nonzero	nonzero	0.000	0.000	0.000	0.000	0.000	0.040	fbmy8028_rel_221222.cza1_gcp_c2s30
67.401	30.173	2.426	nonzero	nonzero	0.000	0.000	0.000	0.000	0.000	0.029	fbmy8032_rel_221222.cza1_gcp_c2s30
Insert response time histogram
256us	1ms	4ms	16ms	64ms	256ms	1s	4s	16s	gt	max	tag
0.000	2.474	93.229	4.276	0.021	0.000	0.000	0.000	0.000	0.000	0.042	fbmy5635_rel_221222.cza1_gcp_c2s30
0.000	0.370	98.875	0.755	0.000	0.000	0.000	0.000	0.000	0.000	0.009	fbmy8028_rel_221222.cza1_gcp_c2s30
0.000	0.453	99.219	0.328	0.000	0.000	0.000	0.000	0.000	0.000	0.005	fbmy8032_rel_221222.cza1_gcp_c2s30
Delete response time histogram
256us	1ms	4ms	16ms	64ms	256ms	1s	4s	16s	gt	max	tag
0.000	2.708	93.016	4.255	0.021	0.000	0.000	0.000	0.000	0.000	0.042	fbmy5635_rel_221222.cza1_gcp_c2s30
0.000	4.224	95.260	0.510	0.005	0.000	0.000	0.000	0.000	0.000	0.019	fbmy8028_rel_221222.cza1_gcp_c2s30
0.000	2.599	97.130	0.271	0.000	0.000	0.000	0.000	0.000	0.000	0.015	fbmy8032_rel_221222.cza1_gcp_c2s30
qp100.L2
- qp100.L2: point queries with 100 insert/s per client
- Legend for results is here.
- Each entry lists the percentage of responses that fit in that bucket (slower than max time for previous bucket, faster than min time for next bucket).
Query response time histogram
256us	1ms	4ms	16ms	64ms	256ms	1s	4s	16s	gt	max	tag
81.240	18.758	0.001	nonzero	0.001	0.000	0.000	0.000	0.000	0.000	0.033	fbmy5635_rel_221222.cza1_gcp_c2s30
95.841	4.157	0.001	nonzero	0.001	0.000	0.000	0.000	0.000	0.000	0.020	fbmy8028_rel_221222.cza1_gcp_c2s30
93.339	6.659	0.001	nonzero	0.001	0.000	0.000	0.000	0.000	0.000	0.021	fbmy8032_rel_221222.cza1_gcp_c2s30
Insert response time histogram
256us	1ms	4ms	16ms	64ms	256ms	1s	4s	16s	gt	max	tag
0.000	1.396	84.245	14.359	0.000	0.000	0.000	0.000	0.000	0.000	0.014	fbmy5635_rel_221222.cza1_gcp_c2s30
0.000	0.531	99.318	0.151	0.000	0.000	0.000	0.000	0.000	0.000	0.006	fbmy8028_rel_221222.cza1_gcp_c2s30
0.000	0.302	99.208	0.490	0.000	0.000	0.000	0.000	0.000	0.000	0.008	fbmy8032_rel_221222.cza1_gcp_c2s30
Delete response time histogram
256us	1ms	4ms	16ms	64ms	256ms	1s	4s	16s	gt	max	tag
0.000	2.573	82.979	14.448	0.000	0.000	0.000	0.000	0.000	0.000	0.014	fbmy5635_rel_221222.cza1_gcp_c2s30
0.000	6.396	93.438	0.167	0.000	0.000	0.000	0.000	0.000	0.000	0.006	fbmy8028_rel_221222.cza1_gcp_c2s30
0.000	3.057	96.479	0.464	0.000	0.000	0.000	0.000	0.000	0.000	0.008	fbmy8032_rel_221222.cza1_gcp_c2s30
qr500.L3
- qr500.L3: range queries with 500 insert/s per client
- Legend for results is here.
- Each entry lists the percentage of responses that fit in that bucket (slower than max time for previous bucket, faster than min time for next bucket).
Query response time histogram
256us	1ms	4ms	16ms	64ms	256ms	1s	4s	16s	gt	max	tag
64.927	31.473	3.599	0.001	nonzero	nonzero	0.000	0.000	0.000	0.000	0.070	fbmy5635_rel_221222.cza1_gcp_c2s30
68.845	26.909	4.246	0.001	nonzero	0.000	0.000	0.000	0.000	0.000	0.060	fbmy8028_rel_221222.cza1_gcp_c2s30
70.732	25.381	3.886	0.001	nonzero	0.000	0.000	0.000	0.000	0.000	0.061	fbmy8032_rel_221222.cza1_gcp_c2s30
Insert response time histogram
256us	1ms	4ms	16ms	64ms	256ms	1s	4s	16s	gt	max	tag
0.000	2.191	58.028	39.740	0.042	0.000	0.000	0.000	0.000	0.000	0.021	fbmy5635_rel_221222.cza1_gcp_c2s30
0.000	0.721	75.793	23.472	0.015	0.000	0.000	0.000	0.000	0.000	0.022	fbmy8028_rel_221222.cza1_gcp_c2s30
0.000	0.342	74.067	25.552	0.040	0.000	0.000	0.000	0.000	0.000	0.020	fbmy8032_rel_221222.cza1_gcp_c2s30
Delete response time histogram
256us	1ms	4ms	16ms	64ms	256ms	1s	4s	16s	gt	max	tag
0.000	2.323	58.329	39.307	0.041	0.000	0.000	0.000	0.000	0.000	0.020	fbmy5635_rel_221222.cza1_gcp_c2s30
0.000	2.649	75.254	22.082	0.015	0.000	0.000	0.000	0.000	0.000	0.023	fbmy8028_rel_221222.cza1_gcp_c2s30
0.000	1.418	74.323	24.216	0.044	0.000	0.000	0.000	0.000	0.000	0.030	fbmy8032_rel_221222.cza1_gcp_c2s30
qp500.L4
- qp500.L4: point queries with 500 insert/s per client
- Legend for results is here.
- Each entry lists the percentage of responses that fit in that bucket (slower than max time for previous bucket, faster than min time for next bucket).
Query response time histogram
256us	1ms	4ms	16ms	64ms	256ms	1s	4s	16s	gt	max	tag
61.325	38.661	0.014	nonzero	nonzero	0.000	0.000	0.000	0.000	0.000	0.027	fbmy5635_rel_221222.cza1_gcp_c2s30
89.777	10.211	0.011	nonzero	nonzero	0.000	0.000	0.000	0.000	0.000	0.024	fbmy8028_rel_221222.cza1_gcp_c2s30
83.841	16.145	0.013	nonzero	0.000	0.000	0.000	0.000	0.000	0.000	0.015	fbmy8032_rel_221222.cza1_gcp_c2s30
Insert response time histogram
256us	1ms	4ms	16ms	64ms	256ms	1s	4s	16s	gt	max	tag
0.000	0.449	43.562	55.925	0.064	0.000	0.000	0.000	0.000	0.000	0.024	fbmy5635_rel_221222.cza1_gcp_c2s30
0.000	0.263	70.123	29.599	0.016	0.000	0.000	0.000	0.000	0.000	0.020	fbmy8028_rel_221222.cza1_gcp_c2s30
0.000	0.027	64.300	35.653	0.020	0.000	0.000	0.000	0.000	0.000	0.022	fbmy8032_rel_221222.cza1_gcp_c2s30
Delete response time histogram
256us	1ms	4ms	16ms	64ms	256ms	1s	4s	16s	gt	max	tag
0.000	0.694	44.695	54.538	0.074	0.000	0.000	0.000	0.000	0.000	0.025	fbmy5635_rel_221222.cza1_gcp_c2s30
0.000	2.032	69.915	28.030	0.022	0.001	0.000	0.000	0.000	0.000	0.069	fbmy8028_rel_221222.cza1_gcp_c2s30
0.000	0.596	65.174	34.216	0.015	0.000	0.000	0.000	0.000	0.000	0.024	fbmy8032_rel_221222.cza1_gcp_c2s30
qr1000.L5
- qr1000.L5: range queries with 1000 insert/s per client
- Legend for results is here.
- Each entry lists the percentage of responses that fit in that bucket (slower than max time for previous bucket, faster than min time for next bucket).
Query response time histogram
256us	1ms	4ms	16ms	64ms	256ms	1s	4s	16s	gt	max	tag
60.789	31.946	7.263	0.002	nonzero	nonzero	0.000	0.000	0.000	0.000	0.075	fbmy5635_rel_221222.cza1_gcp_c2s30
66.289	29.076	4.634	0.001	nonzero	nonzero	0.000	0.000	0.000	0.000	0.080	fbmy8028_rel_221222.cza1_gcp_c2s30
67.675	26.876	5.448	0.001	nonzero	nonzero	0.000	0.000	0.000	0.000	0.074	fbmy8032_rel_221222.cza1_gcp_c2s30
Insert response time histogram
256us	1ms	4ms	16ms	64ms	256ms	1s	4s	16s	gt	max	tag
0.000	1.091	44.479	54.348	0.082	0.000	0.000	0.000	0.000	0.000	0.030	fbmy5635_rel_221222.cza1_gcp_c2s30
0.000	0.144	53.642	46.157	0.057	0.000	0.000	0.000	0.000	0.000	0.030	fbmy8028_rel_221222.cza1_gcp_c2s30
0.000	0.052	56.131	43.785	0.032	0.000	0.000	0.000	0.000	0.000	0.028	fbmy8032_rel_221222.cza1_gcp_c2s30
Delete response time histogram
256us	1ms	4ms	16ms	64ms	256ms	1s	4s	16s	gt	max	tag
0.000	1.169	45.075	53.674	0.082	0.001	0.000	0.000	0.000	0.000	0.068	fbmy5635_rel_221222.cza1_gcp_c2s30
0.000	1.042	54.515	44.383	0.061	0.000	0.000	0.000	0.000	0.000	0.030	fbmy8028_rel_221222.cza1_gcp_c2s30
0.000	0.449	57.255	42.270	0.026	0.000	0.000	0.000	0.000	0.000	0.031	fbmy8032_rel_221222.cza1_gcp_c2s30
qp1000.L6
- qp1000.L6: point queries with 1000 insert/s per client
- Legend for results is here.
- Each entry lists the percentage of responses that fit in that bucket (slower than max time for previous bucket, faster than min time for next bucket).
Query response time histogram
256us	1ms	4ms	16ms	64ms	256ms	1s	4s	16s	gt	max	tag
36.933	63.014	0.051	0.001	0.002	0.000	0.000	0.000	0.000	0.000	0.042	fbmy5635_rel_221222.cza1_gcp_c2s30
77.968	21.993	0.038	0.001	0.001	0.000	0.000	0.000	0.000	0.000	0.042	fbmy8028_rel_221222.cza1_gcp_c2s30
66.708	33.248	0.042	0.001	0.001	0.000	0.000	0.000	0.000	0.000	0.042	fbmy8032_rel_221222.cza1_gcp_c2s30
Insert response time histogram
256us	1ms	4ms	16ms	64ms	256ms	1s	4s	16s	gt	max	tag
0.000	0.452	41.249	58.217	0.081	0.000	0.000	0.000	0.000	0.000	0.040	fbmy5635_rel_221222.cza1_gcp_c2s30
0.000	0.067	52.315	47.586	0.032	0.000	0.000	0.000	0.000	0.000	0.042	fbmy8028_rel_221222.cza1_gcp_c2s30
0.000	0.011	50.972	48.965	0.052	0.000	0.000	0.000	0.000	0.000	0.041	fbmy8032_rel_221222.cza1_gcp_c2s30
Delete response time histogram
256us	1ms	4ms	16ms	64ms	256ms	1s	4s	16s	gt	max	tag
0.000	0.683	42.282	56.954	0.081	0.000	0.000	0.000	0.000	0.000	0.044	fbmy5635_rel_221222.cza1_gcp_c2s30
0.000	0.857	53.685	45.424	0.033	0.001	0.000	0.000	0.000	0.000	0.074	fbmy8028_rel_221222.cza1_gcp_c2s30
0.000	0.231	52.488	47.219	0.061	0.001	0.000	0.000	0.000	0.000	0.065	fbmy8032_rel_221222.cza1_gcp_c2s30