Introduction
This is a report for the insert benchmark with 60M docs and 1 client(s). It is generated by scripts (bash, awk, sed) and Tufte might not be impressed. An overview of the insert benchmark is here and a short update is here. Below, by DBMS, I mean DBMS+version.config. An example is my8020.c10b40 where my means MySQL, 8020 is version 8.0.20 and c10b40 is the name for the configuration file.
The test server has a Beelink SER7 with 8 AMD cores, 32G RAM and an NVMe SSD. It is described here. The benchmark was run with 1 client and there were 1 or 3 connections per client (1 for queries or inserts without rate limits, 1+1 for rate limited inserts+deletes). It uses 1 table. It loads 60M rows per table without secondary indexes, creates 3 secondary indexes per table, then inserts 50m+50m rows per table with a delete per insert to avoid growing the table. It then does 6 read+write tests for 1800s each that do queries as fast as possible with 100,100,500,500,1000,1000 inserts/s and the same for deletes/s per client concurrent with the queries. The database is cached in memory. Clients and the DBMS share one server. The per-database configs are in the per-database subdirectories here.
The tested DBMS are:
- fbmy5635_rel_221222.cza1_ser7 - MyRocks 5.6.35 from code as of 2023-12-22 at git hash 4f3a57a1, RocksDB 8.7.0 at git hash 29005f0b, cza1_ser7 config
- fbmy8028_rel_221222.cza1_ser7 - MyRocks 8.0.28 from code as of 2023-12-22 at git hash 2ad105fc, RocksDB 8.7.0 at git hash 29005f0b, cza1_ser7 config
- fbmy8032_rel_221222.cza1_ser7 - MyRocks 8.0.32 from code as of 2023-12-22 at git hash 76707b44, RocksDB 8.7.0 at git hash 29005f0b, cza1_ser7 config
Contents
- Summary
- l.i0: load without secondary indexes
- l.x: create secondary indexes
- l.i1: continue load after secondary indexes created with 50 inserts per transaction
- l.i2: continue load after secondary indexes created with 5 inserts per transaction
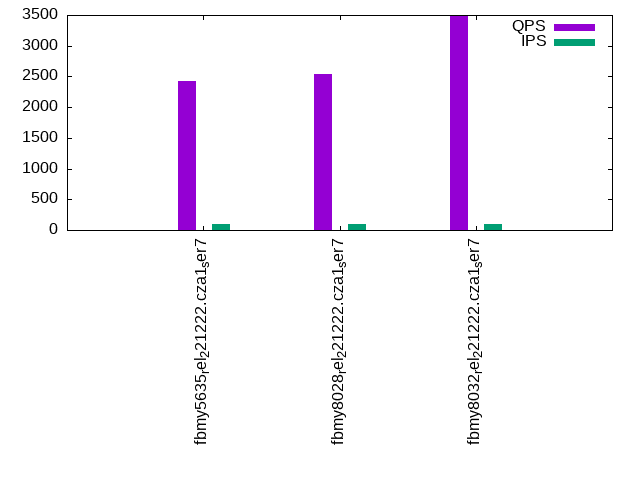
- qr100.L1: range queries with 100 insert/s per client
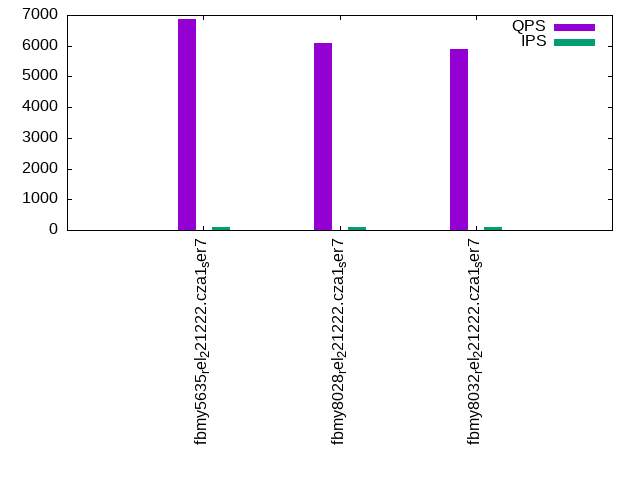
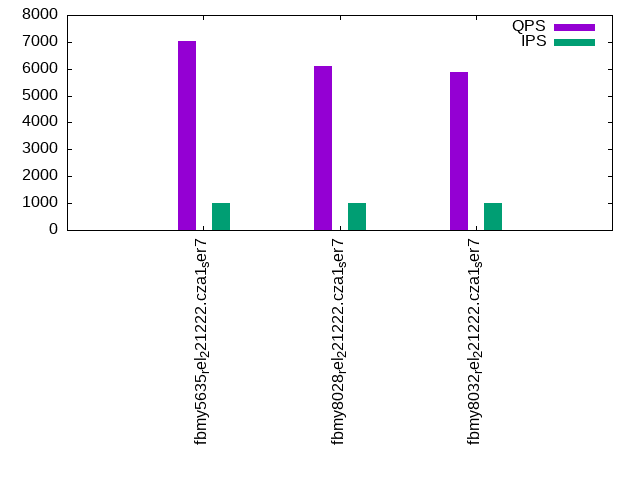
- qp100.L2: point queries with 100 insert/s per client
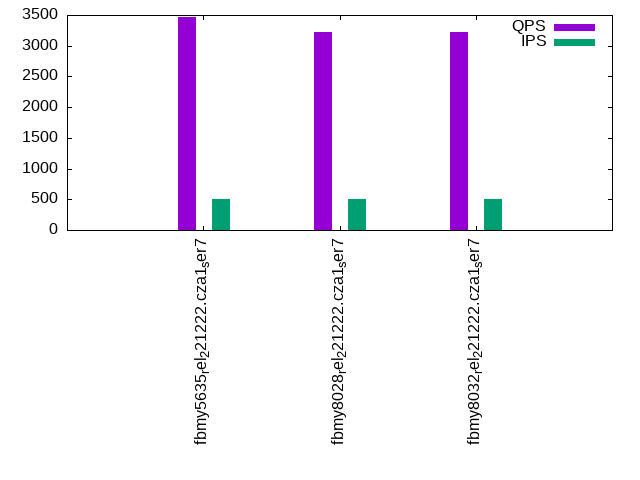
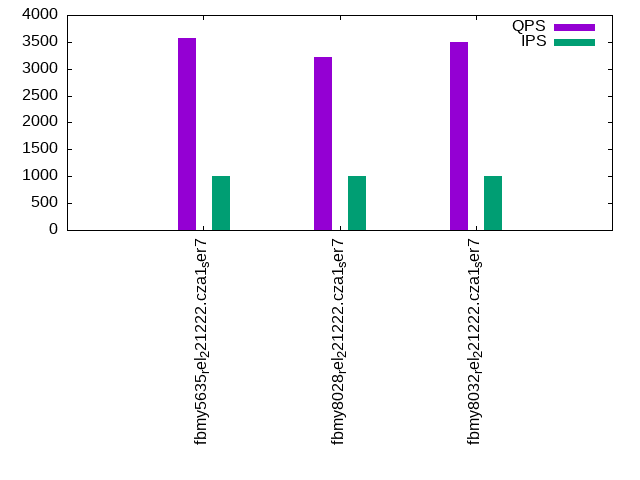
- qr500.L3: range queries with 500 insert/s per client
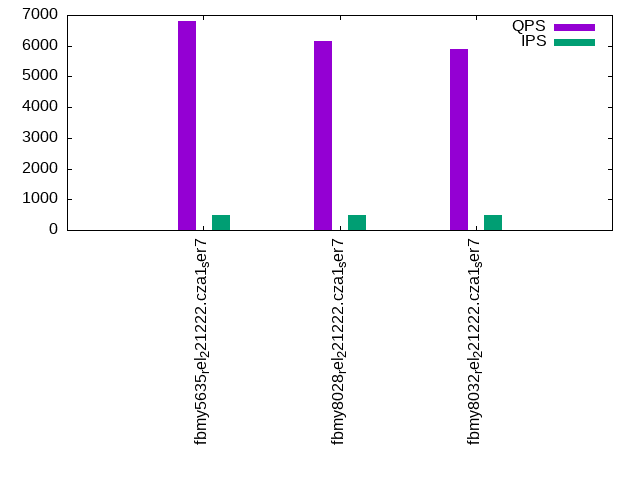
- qp500.L4: point queries with 500 insert/s per client
- qr1000.L5: range queries with 1000 insert/s per client
- qp1000.L6: point queries with 1000 insert/s per client
Summary
The numbers are inserts/s for l.i0, l.i1 and l.i2, indexed docs (or rows) /s for l.x and queries/s for qr100, qp100 thru qr1000, qp1000" The values are the average rate over the entire test for inserts (IPS) and queries (QPS). The range of values for IPS and QPS is split into 3 parts: bottom 25%, middle 50%, top 25%. Values in the bottom 25% have a red background, values in the top 25% have a green background and values in the middle have no color. A gray background is used for values that can be ignored because the DBMS did not sustain the target insert rate. Red backgrounds are not used when the minimum value is within 80% of the max value.
| dbms | l.i0 | l.x | l.i1 | l.i2 | qr100 | qp100 | qr500 | qp500 | qr1000 | qp1000 |
|---|---|---|---|---|---|---|---|---|---|---|
| fbmy5635_rel_221222.cza1_ser7 | 206896 | 194175 | 69565 | 24038 | 2425 | 6862 | 3462 | 6789 | 3577 | 7020 |
| fbmy8028_rel_221222.cza1_ser7 | 148148 | 174927 | 59524 | 20877 | 2536 | 6086 | 3229 | 6158 | 3225 | 6101 |
| fbmy8032_rel_221222.cza1_ser7 | 143198 | 175953 | 58824 | 20284 | 3485 | 5903 | 3227 | 5909 | 3499 | 5865 |
This table has relative throughput, throughput for the DBMS relative to the DBMS in the first line, using the absolute throughput from the previous table. Values less than 0.95 have a yellow background. Values greater than 1.05 have a blue background.
| dbms | l.i0 | l.x | l.i1 | l.i2 | qr100 | qp100 | qr500 | qp500 | qr1000 | qp1000 |
|---|---|---|---|---|---|---|---|---|---|---|
| fbmy5635_rel_221222.cza1_ser7 | 1.00 | 1.00 | 1.00 | 1.00 | 1.00 | 1.00 | 1.00 | 1.00 | 1.00 | 1.00 |
| fbmy8028_rel_221222.cza1_ser7 | 0.72 | 0.90 | 0.86 | 0.87 | 1.05 | 0.89 | 0.93 | 0.91 | 0.90 | 0.87 |
| fbmy8032_rel_221222.cza1_ser7 | 0.69 | 0.91 | 0.85 | 0.84 | 1.44 | 0.86 | 0.93 | 0.87 | 0.98 | 0.84 |
This lists the average rate of inserts/s for the tests that do inserts concurrent with queries. For such tests the query rate is listed in the table above. The read+write tests are setup so that the insert rate should match the target rate every second. Cells that are not at least 95% of the target have a red background to indicate a failure to satisfy the target.
| dbms | qr100.L1 | qp100.L2 | qr500.L3 | qp500.L4 | qr1000.L5 | qp1000.L6 |
|---|---|---|---|---|---|---|
| fbmy5635_rel_221222.cza1_ser7 | 100 | 100 | 499 | 499 | 998 | 998 |
| fbmy8028_rel_221222.cza1_ser7 | 100 | 100 | 499 | 499 | 998 | 998 |
| fbmy8032_rel_221222.cza1_ser7 | 100 | 100 | 499 | 499 | 998 | 998 |
| target | 100 | 100 | 500 | 500 | 1000 | 1000 |
l.i0
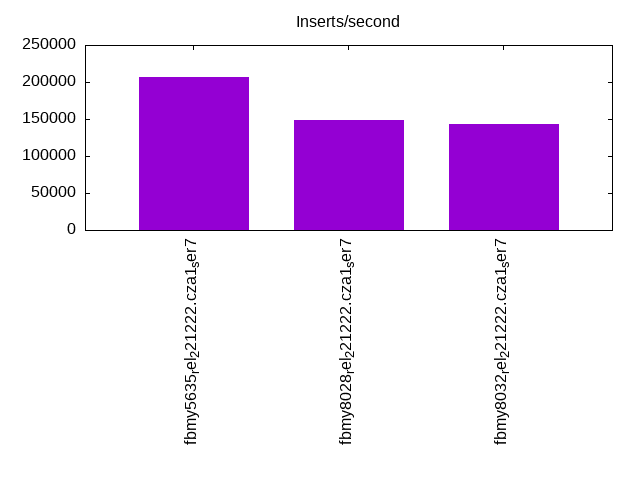
l.i0: load without secondary indexes. Graphs for performance per 1-second interval are here.
Average throughput:
Insert response time histogram: each cell has the percentage of responses that take <= the time in the header and max is the max response time in seconds. For the max column values in the top 25% of the range have a red background and in the bottom 25% of the range have a green background. The red background is not used when the min value is within 80% of the max value.
| dbms | 256us | 1ms | 4ms | 16ms | 64ms | 256ms | 1s | 4s | 16s | gt | max |
|---|---|---|---|---|---|---|---|---|---|---|---|
| fbmy5635_rel_221222.cza1_ser7 | 99.873 | 0.075 | 0.048 | nonzero | 0.003 | 0.114 | |||||
| fbmy8028_rel_221222.cza1_ser7 | 99.444 | 0.385 | 0.129 | 0.039 | 0.004 | 0.120 | |||||
| fbmy8032_rel_221222.cza1_ser7 | 99.299 | 0.529 | 0.130 | 0.038 | 0.004 | 0.096 |
Performance metrics for the DBMS listed above. Some are normalized by throughput, others are not. Legend for results is here.
ips	qps	rps	rmbps	wps	wmbps	rpq	rkbpq	wpi	wkbpi	csps	cpups	cspq	cpupq	dbgb1	dbgb2	rss	maxop	p50	p99	tag
206896	0	0	0.0	96.2	35.9	0.000	0.000	0.000	0.177	21625	10.9	0.105	4	1.8	3.2	0.3	0.114	207983	179297	fbmy5635_rel_221222.cza1_ser7
148148	0	0	0.0	94.1	32.3	0.000	0.000	0.001	0.223	16494	10.1	0.111	5	1.8	3.4	0.7	0.120	148839	128264	fbmy8028_rel_221222.cza1_ser7
143198	0	0	0.0	91.3	31.2	0.000	0.000	0.001	0.223	16232	10.6	0.113	6	1.8	3.4	0.7	0.096	144338	115223	fbmy8032_rel_221222.cza1_ser7
l.x
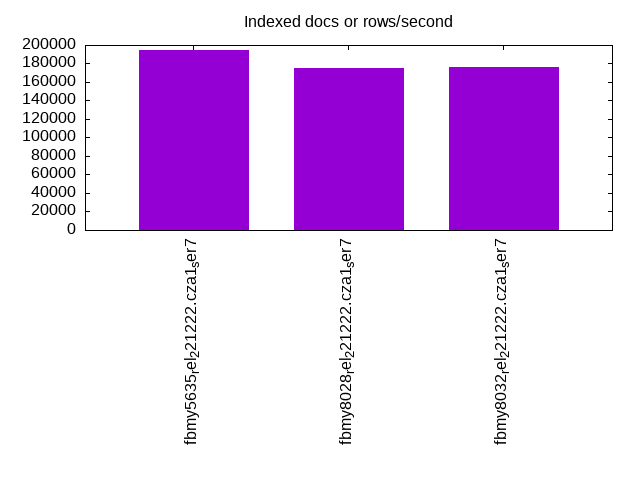
l.x: create secondary indexes.
Average throughput:
Performance metrics for the DBMS listed above. Some are normalized by throughput, others are not. Legend for results is here.
ips	qps	rps	rmbps	wps	wmbps	rpq	rkbpq	wpi	wkbpi	csps	cpups	cspq	cpupq	dbgb1	dbgb2	rss	maxop	p50	p99	tag
194175	0	0	0.0	77.5	30.8	0.000	0.000	0.000	0.162	208	5.9	0.001	2	4.0	5.4	4.0	0.002	NA	NA	fbmy5635_rel_221222.cza1_ser7
174927	0	0	0.0	67.4	27.0	0.000	0.000	0.000	0.158	352	5.8	0.002	3	4.0	5.6	4.6	0.002	NA	NA	fbmy8028_rel_221222.cza1_ser7
175953	0	0	0.0	68.0	27.2	0.000	0.000	0.000	0.158	565	5.8	0.003	3	4.0	5.6	4.6	0.008	NA	NA	fbmy8032_rel_221222.cza1_ser7
l.i1
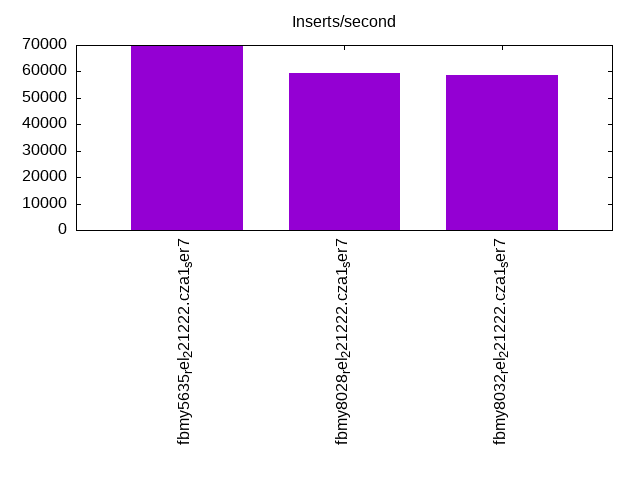
l.i1: continue load after secondary indexes created with 50 inserts per transaction. Graphs for performance per 1-second interval are here.
Average throughput:
Insert response time histogram: each cell has the percentage of responses that take <= the time in the header and max is the max response time in seconds. For the max column values in the top 25% of the range have a red background and in the bottom 25% of the range have a green background. The red background is not used when the min value is within 80% of the max value.
| dbms | 256us | 1ms | 4ms | 16ms | 64ms | 256ms | 1s | 4s | 16s | gt | max |
|---|---|---|---|---|---|---|---|---|---|---|---|
| fbmy5635_rel_221222.cza1_ser7 | 98.844 | 1.081 | 0.070 | 0.001 | 0.004 | 0.101 | |||||
| fbmy8028_rel_221222.cza1_ser7 | 97.193 | 2.614 | 0.167 | 0.023 | 0.004 | 0.108 | |||||
| fbmy8032_rel_221222.cza1_ser7 | 97.305 | 2.501 | 0.169 | 0.021 | 0.004 | 0.101 |
Delete response time histogram: each cell has the percentage of responses that take <= the time in the header and max is the max response time in seconds. For the max column values in the top 25% of the range have a red background and in the bottom 25% of the range have a green background. The red background is not used when the min value is within 80% of the max value.
| dbms | 256us | 1ms | 4ms | 16ms | 64ms | 256ms | 1s | 4s | 16s | gt | max |
|---|---|---|---|---|---|---|---|---|---|---|---|
| fbmy5635_rel_221222.cza1_ser7 | 98.997 | 0.921 | 0.073 | 0.004 | 0.004 | 0.102 | |||||
| fbmy8028_rel_221222.cza1_ser7 | 97.655 | 2.143 | 0.162 | 0.036 | 0.004 | 0.114 | |||||
| fbmy8032_rel_221222.cza1_ser7 | 97.799 | 2.000 | 0.165 | 0.032 | 0.004 | 0.094 |
Performance metrics for the DBMS listed above. Some are normalized by throughput, others are not. Legend for results is here.
ips	qps	rps	rmbps	wps	wmbps	rpq	rkbpq	wpi	wkbpi	csps	cpups	cspq	cpupq	dbgb1	dbgb2	rss	maxop	p50	p99	tag
69565	0	683	3.9	361.9	145.5	0.010	0.057	0.005	2.142	34366	25.1	0.494	29	4.9	5.3	6.7	0.101	69880	57336	fbmy5635_rel_221222.cza1_ser7
59524	0	587	3.3	324.4	127.3	0.010	0.057	0.005	2.190	30116	23.9	0.506	32	4.6	5.2	6.9	0.108	59886	49346	fbmy8028_rel_221222.cza1_ser7
58824	0	583	3.3	314.6	123.2	0.010	0.058	0.005	2.145	30005	23.6	0.510	32	5.0	5.6	6.8	0.101	59035	49946	fbmy8032_rel_221222.cza1_ser7
l.i2
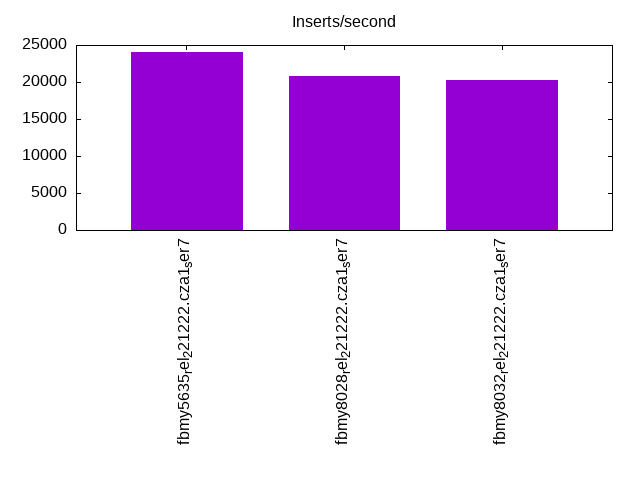
l.i2: continue load after secondary indexes created with 5 inserts per transaction. Graphs for performance per 1-second interval are here.
Average throughput:
Insert response time histogram: each cell has the percentage of responses that take <= the time in the header and max is the max response time in seconds. For the max column values in the top 25% of the range have a red background and in the bottom 25% of the range have a green background. The red background is not used when the min value is within 80% of the max value.
| dbms | 256us | 1ms | 4ms | 16ms | 64ms | 256ms | 1s | 4s | 16s | gt | max |
|---|---|---|---|---|---|---|---|---|---|---|---|
| fbmy5635_rel_221222.cza1_ser7 | 99.793 | 0.185 | 0.001 | 0.020 | 0.001 | nonzero | 0.087 | ||||
| fbmy8028_rel_221222.cza1_ser7 | 99.200 | 0.755 | nonzero | 0.042 | 0.001 | 0.001 | 0.112 | ||||
| fbmy8032_rel_221222.cza1_ser7 | 99.001 | 0.954 | 0.001 | 0.042 | 0.002 | nonzero | 0.097 |
Delete response time histogram: each cell has the percentage of responses that take <= the time in the header and max is the max response time in seconds. For the max column values in the top 25% of the range have a red background and in the bottom 25% of the range have a green background. The red background is not used when the min value is within 80% of the max value.
| dbms | 256us | 1ms | 4ms | 16ms | 64ms | 256ms | 1s | 4s | 16s | gt | max |
|---|---|---|---|---|---|---|---|---|---|---|---|
| fbmy5635_rel_221222.cza1_ser7 | 99.230 | 0.748 | 0.001 | 0.021 | 0.001 | nonzero | 0.087 | ||||
| fbmy8028_rel_221222.cza1_ser7 | 97.138 | 2.817 | 0.001 | 0.043 | 0.001 | 0.001 | 0.111 | ||||
| fbmy8032_rel_221222.cza1_ser7 | 96.013 | 3.940 | 0.001 | 0.044 | 0.002 | nonzero | 0.086 |
Performance metrics for the DBMS listed above. Some are normalized by throughput, others are not. Legend for results is here.
ips	qps	rps	rmbps	wps	wmbps	rpq	rkbpq	wpi	wkbpi	csps	cpups	cspq	cpupq	dbgb1	dbgb2	rss	maxop	p50	p99	tag
24038	0	0	0.0	241.3	88.6	0.000	0.000	0.010	3.773	100168	20.4	4.167	68	4.4	4.6	8.0	0.087	24170	21377	fbmy5635_rel_221222.cza1_ser7
20877	0	0	0.0	238.4	85.1	0.000	0.000	0.011	4.175	85922	20.3	4.116	78	4.2	4.6	8.4	0.112	20922	18115	fbmy8028_rel_221222.cza1_ser7
20284	0	0	0.0	238.9	86.2	0.000	0.000	0.012	4.352	84031	20.7	4.143	82	4.3	4.6	8.5	0.097	20339	17825	fbmy8032_rel_221222.cza1_ser7
qr100.L1
qr100.L1: range queries with 100 insert/s per client. Graphs for performance per 1-second interval are here.
Average throughput:
Query response time histogram: each cell has the percentage of responses that take <= the time in the header and max is the max response time in seconds. For max values in the top 25% of the range have a red background and in the bottom 25% of the range have a green background. The red background is not used when the min value is within 80% of the max value.
| dbms | 256us | 1ms | 4ms | 16ms | 64ms | 256ms | 1s | 4s | 16s | gt | max |
|---|---|---|---|---|---|---|---|---|---|---|---|
| fbmy5635_rel_221222.cza1_ser7 | 66.506 | 26.737 | 6.757 | nonzero | 0.039 | ||||||
| fbmy8028_rel_221222.cza1_ser7 | 69.046 | 16.602 | 14.352 | nonzero | 0.040 | ||||||
| fbmy8032_rel_221222.cza1_ser7 | 72.896 | 20.157 | 6.948 | nonzero | 0.036 |
Insert response time histogram: each cell has the percentage of responses that take <= the time in the header and max is the max response time in seconds. For max values in the top 25% of the range have a red background and in the bottom 25% of the range have a green background. The red background is not used when the min value is within 80% of the max value.
| dbms | 256us | 1ms | 4ms | 16ms | 64ms | 256ms | 1s | 4s | 16s | gt | max |
|---|---|---|---|---|---|---|---|---|---|---|---|
| fbmy5635_rel_221222.cza1_ser7 | 4.306 | 95.389 | 0.306 | 0.015 | |||||||
| fbmy8028_rel_221222.cza1_ser7 | 0.667 | 98.833 | 0.444 | 0.056 | 0.017 | ||||||
| fbmy8032_rel_221222.cza1_ser7 | 0.361 | 99.139 | 0.444 | 0.056 | 0.017 |
Delete response time histogram: each cell has the percentage of responses that take <= the time in the header and max is the max response time in seconds. For max values in the top 25% of the range have a red background and in the bottom 25% of the range have a green background. The red background is not used when the min value is within 80% of the max value.
| dbms | 256us | 1ms | 4ms | 16ms | 64ms | 256ms | 1s | 4s | 16s | gt | max |
|---|---|---|---|---|---|---|---|---|---|---|---|
| fbmy5635_rel_221222.cza1_ser7 | 8.056 | 91.639 | 0.306 | 0.015 | |||||||
| fbmy8028_rel_221222.cza1_ser7 | 1.167 | 98.472 | 0.333 | 0.028 | 0.017 | ||||||
| fbmy8032_rel_221222.cza1_ser7 | 0.333 | 99.278 | 0.361 | 0.028 | 0.017 |
Performance metrics for the DBMS listed above. Some are normalized by throughput, others are not. Legend for results is here.
ips	qps	rps	rmbps	wps	wmbps	rpq	rkbpq	wpi	wkbpi	csps	cpups	cspq	cpupq	dbgb1	dbgb2	rss	maxop	p50	p99	tag
100	2425	0	0.0	4.6	0.5	0.000	0.000	0.046	4.996	9407	6.6	3.879	218	4.2	4.2	8.6	0.039	2429	2254	fbmy5635_rel_221222.cza1_ser7
100	2536	0	0.0	5.2	0.7	0.000	0.000	0.052	7.036	9987	6.4	3.937	202	4.1	4.4	9.0	0.040	2381	2238	fbmy8028_rel_221222.cza1_ser7
100	3485	0	0.0	5.0	0.6	0.000	0.000	0.050	6.092	13786	6.4	3.956	147	4.2	4.4	9.0	0.036	3900	2685	fbmy8032_rel_221222.cza1_ser7
qp100.L2
qp100.L2: point queries with 100 insert/s per client. Graphs for performance per 1-second interval are here.
Average throughput:
Query response time histogram: each cell has the percentage of responses that take <= the time in the header and max is the max response time in seconds. For max values in the top 25% of the range have a red background and in the bottom 25% of the range have a green background. The red background is not used when the min value is within 80% of the max value.
| dbms | 256us | 1ms | 4ms | 16ms | 64ms | 256ms | 1s | 4s | 16s | gt | max |
|---|---|---|---|---|---|---|---|---|---|---|---|
| fbmy5635_rel_221222.cza1_ser7 | 99.800 | 0.200 | nonzero | 0.001 | |||||||
| fbmy8028_rel_221222.cza1_ser7 | 99.627 | 0.373 | nonzero | 0.001 | |||||||
| fbmy8032_rel_221222.cza1_ser7 | 99.575 | 0.425 | nonzero | 0.001 |
Insert response time histogram: each cell has the percentage of responses that take <= the time in the header and max is the max response time in seconds. For max values in the top 25% of the range have a red background and in the bottom 25% of the range have a green background. The red background is not used when the min value is within 80% of the max value.
| dbms | 256us | 1ms | 4ms | 16ms | 64ms | 256ms | 1s | 4s | 16s | gt | max |
|---|---|---|---|---|---|---|---|---|---|---|---|
| fbmy5635_rel_221222.cza1_ser7 | 5.806 | 93.889 | 0.306 | 0.009 | |||||||
| fbmy8028_rel_221222.cza1_ser7 | 1.111 | 98.472 | 0.361 | 0.056 | 0.017 | ||||||
| fbmy8032_rel_221222.cza1_ser7 | 1.111 | 98.417 | 0.417 | 0.056 | 0.017 |
Delete response time histogram: each cell has the percentage of responses that take <= the time in the header and max is the max response time in seconds. For max values in the top 25% of the range have a red background and in the bottom 25% of the range have a green background. The red background is not used when the min value is within 80% of the max value.
| dbms | 256us | 1ms | 4ms | 16ms | 64ms | 256ms | 1s | 4s | 16s | gt | max |
|---|---|---|---|---|---|---|---|---|---|---|---|
| fbmy5635_rel_221222.cza1_ser7 | 8.556 | 91.167 | 0.278 | 0.008 | |||||||
| fbmy8028_rel_221222.cza1_ser7 | 3.639 | 96.028 | 0.306 | 0.028 | 0.016 | ||||||
| fbmy8032_rel_221222.cza1_ser7 | 0.806 | 98.778 | 0.389 | 0.028 | 0.017 |
Performance metrics for the DBMS listed above. Some are normalized by throughput, others are not. Legend for results is here.
ips	qps	rps	rmbps	wps	wmbps	rpq	rkbpq	wpi	wkbpi	csps	cpups	cspq	cpupq	dbgb1	dbgb2	rss	maxop	p50	p99	tag
100	6862	0	0.0	4.6	0.6	0.000	0.000	0.046	5.697	27583	6.3	4.020	73	4.2	4.2	11.6	0.001	6489	6217	fbmy5635_rel_221222.cza1_ser7
100	6086	0	0.0	4.3	0.4	0.000	0.000	0.043	4.601	24662	6.5	4.052	85	4.2	4.4	12.0	0.001	5881	5418	fbmy8028_rel_221222.cza1_ser7
100	5903	0	0.0	4.3	0.5	0.000	0.000	0.043	4.981	24110	6.3	4.084	85	4.2	4.4	12.1	0.001	5723	5546	fbmy8032_rel_221222.cza1_ser7
qr500.L3
qr500.L3: range queries with 500 insert/s per client. Graphs for performance per 1-second interval are here.
Average throughput:
Query response time histogram: each cell has the percentage of responses that take <= the time in the header and max is the max response time in seconds. For max values in the top 25% of the range have a red background and in the bottom 25% of the range have a green background. The red background is not used when the min value is within 80% of the max value.
| dbms | 256us | 1ms | 4ms | 16ms | 64ms | 256ms | 1s | 4s | 16s | gt | max |
|---|---|---|---|---|---|---|---|---|---|---|---|
| fbmy5635_rel_221222.cza1_ser7 | 76.803 | 19.126 | 4.072 | nonzero | nonzero | 0.034 | |||||
| fbmy8028_rel_221222.cza1_ser7 | 72.863 | 21.889 | 5.247 | nonzero | 0.036 | ||||||
| fbmy8032_rel_221222.cza1_ser7 | 68.580 | 25.963 | 5.457 | nonzero | 0.036 |
Insert response time histogram: each cell has the percentage of responses that take <= the time in the header and max is the max response time in seconds. For max values in the top 25% of the range have a red background and in the bottom 25% of the range have a green background. The red background is not used when the min value is within 80% of the max value.
| dbms | 256us | 1ms | 4ms | 16ms | 64ms | 256ms | 1s | 4s | 16s | gt | max |
|---|---|---|---|---|---|---|---|---|---|---|---|
| fbmy5635_rel_221222.cza1_ser7 | 7.867 | 91.939 | 0.194 | 0.013 | |||||||
| fbmy8028_rel_221222.cza1_ser7 | 1.483 | 98.206 | 0.244 | 0.067 | 0.017 | ||||||
| fbmy8032_rel_221222.cza1_ser7 | 1.378 | 98.289 | 0.256 | 0.078 | 0.017 |
Delete response time histogram: each cell has the percentage of responses that take <= the time in the header and max is the max response time in seconds. For max values in the top 25% of the range have a red background and in the bottom 25% of the range have a green background. The red background is not used when the min value is within 80% of the max value.
| dbms | 256us | 1ms | 4ms | 16ms | 64ms | 256ms | 1s | 4s | 16s | gt | max |
|---|---|---|---|---|---|---|---|---|---|---|---|
| fbmy5635_rel_221222.cza1_ser7 | 6.806 | 93.033 | 0.161 | 0.014 | |||||||
| fbmy8028_rel_221222.cza1_ser7 | 5.311 | 94.400 | 0.222 | 0.067 | 0.022 | ||||||
| fbmy8032_rel_221222.cza1_ser7 | 3.361 | 96.311 | 0.261 | 0.067 | 0.017 |
Performance metrics for the DBMS listed above. Some are normalized by throughput, others are not. Legend for results is here.
ips	qps	rps	rmbps	wps	wmbps	rpq	rkbpq	wpi	wkbpi	csps	cpups	cspq	cpupq	dbgb1	dbgb2	rss	maxop	p50	p99	tag
499	3462	0	0.0	10.2	3.3	0.000	0.000	0.020	6.686	13651	6.6	3.943	153	4.1	4.4	12.9	0.034	3196	2685	fbmy5635_rel_221222.cza1_ser7
499	3229	0	0.0	9.7	3.1	0.000	0.000	0.019	6.266	12918	6.8	4.001	168	4.2	4.6	13.2	0.036	3133	2685	fbmy8028_rel_221222.cza1_ser7
499	3227	0	0.0	10.2	3.3	0.000	0.000	0.020	6.672	13112	6.9	4.063	171	4.2	4.6	13.3	0.036	3212	2749	fbmy8032_rel_221222.cza1_ser7
qp500.L4
qp500.L4: point queries with 500 insert/s per client. Graphs for performance per 1-second interval are here.
Average throughput:
Query response time histogram: each cell has the percentage of responses that take <= the time in the header and max is the max response time in seconds. For max values in the top 25% of the range have a red background and in the bottom 25% of the range have a green background. The red background is not used when the min value is within 80% of the max value.
| dbms | 256us | 1ms | 4ms | 16ms | 64ms | 256ms | 1s | 4s | 16s | gt | max |
|---|---|---|---|---|---|---|---|---|---|---|---|
| fbmy5635_rel_221222.cza1_ser7 | 99.768 | 0.232 | nonzero | 0.003 | |||||||
| fbmy8028_rel_221222.cza1_ser7 | 99.538 | 0.462 | nonzero | nonzero | 0.005 | ||||||
| fbmy8032_rel_221222.cza1_ser7 | 99.487 | 0.513 | nonzero | 0.004 |
Insert response time histogram: each cell has the percentage of responses that take <= the time in the header and max is the max response time in seconds. For max values in the top 25% of the range have a red background and in the bottom 25% of the range have a green background. The red background is not used when the min value is within 80% of the max value.
| dbms | 256us | 1ms | 4ms | 16ms | 64ms | 256ms | 1s | 4s | 16s | gt | max |
|---|---|---|---|---|---|---|---|---|---|---|---|
| fbmy5635_rel_221222.cza1_ser7 | 10.117 | 89.672 | 0.211 | 0.008 | |||||||
| fbmy8028_rel_221222.cza1_ser7 | 4.289 | 95.350 | 0.289 | 0.072 | 0.018 | ||||||
| fbmy8032_rel_221222.cza1_ser7 | 5.044 | 94.633 | 0.233 | 0.089 | 0.017 |
Delete response time histogram: each cell has the percentage of responses that take <= the time in the header and max is the max response time in seconds. For max values in the top 25% of the range have a red background and in the bottom 25% of the range have a green background. The red background is not used when the min value is within 80% of the max value.
| dbms | 256us | 1ms | 4ms | 16ms | 64ms | 256ms | 1s | 4s | 16s | gt | max |
|---|---|---|---|---|---|---|---|---|---|---|---|
| fbmy5635_rel_221222.cza1_ser7 | 13.633 | 86.156 | 0.211 | 0.008 | |||||||
| fbmy8028_rel_221222.cza1_ser7 | 4.472 | 95.194 | 0.267 | 0.067 | 0.018 | ||||||
| fbmy8032_rel_221222.cza1_ser7 | 8.533 | 91.139 | 0.244 | 0.083 | 0.017 |
Performance metrics for the DBMS listed above. Some are normalized by throughput, others are not. Legend for results is here.
ips	qps	rps	rmbps	wps	wmbps	rpq	rkbpq	wpi	wkbpi	csps	cpups	cspq	cpupq	dbgb1	dbgb2	rss	maxop	p50	p99	tag
499	6789	0	0.0	9.3	2.9	0.000	0.000	0.019	6.052	27582	6.9	4.063	81	4.1	4.6	13.7	0.003	6489	6221	fbmy5635_rel_221222.cza1_ser7
499	6158	0	0.0	9.2	2.9	0.000	0.000	0.018	5.915	25212	6.8	4.094	88	4.2	4.8	14.0	0.005	5865	5644	fbmy8028_rel_221222.cza1_ser7
499	5909	0	0.0	9.8	3.0	0.000	0.000	0.020	6.083	24413	6.6	4.131	89	4.2	4.8	14.1	0.004	5689	5482	fbmy8032_rel_221222.cza1_ser7
qr1000.L5
qr1000.L5: range queries with 1000 insert/s per client. Graphs for performance per 1-second interval are here.
Average throughput:
Query response time histogram: each cell has the percentage of responses that take <= the time in the header and max is the max response time in seconds. For max values in the top 25% of the range have a red background and in the bottom 25% of the range have a green background. The red background is not used when the min value is within 80% of the max value.
| dbms | 256us | 1ms | 4ms | 16ms | 64ms | 256ms | 1s | 4s | 16s | gt | max |
|---|---|---|---|---|---|---|---|---|---|---|---|
| fbmy5635_rel_221222.cza1_ser7 | 72.737 | 25.033 | 2.229 | nonzero | nonzero | 0.036 | |||||
| fbmy8028_rel_221222.cza1_ser7 | 68.019 | 29.783 | 2.197 | nonzero | 0.043 | ||||||
| fbmy8032_rel_221222.cza1_ser7 | 71.004 | 24.821 | 4.174 | nonzero | nonzero | 0.049 |
Insert response time histogram: each cell has the percentage of responses that take <= the time in the header and max is the max response time in seconds. For max values in the top 25% of the range have a red background and in the bottom 25% of the range have a green background. The red background is not used when the min value is within 80% of the max value.
| dbms | 256us | 1ms | 4ms | 16ms | 64ms | 256ms | 1s | 4s | 16s | gt | max |
|---|---|---|---|---|---|---|---|---|---|---|---|
| fbmy5635_rel_221222.cza1_ser7 | 10.378 | 89.444 | 0.175 | 0.003 | 0.049 | ||||||
| fbmy8028_rel_221222.cza1_ser7 | 2.239 | 97.478 | 0.211 | 0.072 | 0.056 | ||||||
| fbmy8032_rel_221222.cza1_ser7 | 4.886 | 94.825 | 0.214 | 0.075 | 0.041 |
Delete response time histogram: each cell has the percentage of responses that take <= the time in the header and max is the max response time in seconds. For max values in the top 25% of the range have a red background and in the bottom 25% of the range have a green background. The red background is not used when the min value is within 80% of the max value.
| dbms | 256us | 1ms | 4ms | 16ms | 64ms | 256ms | 1s | 4s | 16s | gt | max |
|---|---|---|---|---|---|---|---|---|---|---|---|
| fbmy5635_rel_221222.cza1_ser7 | 9.931 | 89.883 | 0.178 | 0.008 | 0.056 | ||||||
| fbmy8028_rel_221222.cza1_ser7 | 3.567 | 96.164 | 0.194 | 0.075 | 0.056 | ||||||
| fbmy8032_rel_221222.cza1_ser7 | 3.164 | 96.567 | 0.197 | 0.072 | 0.055 |
Performance metrics for the DBMS listed above. Some are normalized by throughput, others are not. Legend for results is here.
ips	qps	rps	rmbps	wps	wmbps	rpq	rkbpq	wpi	wkbpi	csps	cpups	cspq	cpupq	dbgb1	dbgb2	rss	maxop	p50	p99	tag
998	3577	0	0.0	15.9	6.1	0.000	0.000	0.016	6.301	14450	7.0	4.040	157	4.2	5.1	15.8	0.036	3548	2781	fbmy5635_rel_221222.cza1_ser7
998	3225	0	0.0	16.5	6.4	0.000	0.000	0.017	6.527	13338	7.1	4.135	176	4.1	5.2	16.3	0.043	3164	2429	fbmy8028_rel_221222.cza1_ser7
998	3499	0	0.0	16.5	6.2	0.000	0.000	0.016	6.382	14571	7.1	4.164	162	4.2	5.2	16.1	0.049	3612	2589	fbmy8032_rel_221222.cza1_ser7
qp1000.L6
qp1000.L6: point queries with 1000 insert/s per client. Graphs for performance per 1-second interval are here.
Average throughput:
Query response time histogram: each cell has the percentage of responses that take <= the time in the header and max is the max response time in seconds. For max values in the top 25% of the range have a red background and in the bottom 25% of the range have a green background. The red background is not used when the min value is within 80% of the max value.
| dbms | 256us | 1ms | 4ms | 16ms | 64ms | 256ms | 1s | 4s | 16s | gt | max |
|---|---|---|---|---|---|---|---|---|---|---|---|
| fbmy5635_rel_221222.cza1_ser7 | 99.746 | 0.254 | nonzero | 0.004 | |||||||
| fbmy8028_rel_221222.cza1_ser7 | 99.481 | 0.519 | nonzero | nonzero | 0.005 | ||||||
| fbmy8032_rel_221222.cza1_ser7 | 99.453 | 0.547 | nonzero | 0.002 |
Insert response time histogram: each cell has the percentage of responses that take <= the time in the header and max is the max response time in seconds. For max values in the top 25% of the range have a red background and in the bottom 25% of the range have a green background. The red background is not used when the min value is within 80% of the max value.
| dbms | 256us | 1ms | 4ms | 16ms | 64ms | 256ms | 1s | 4s | 16s | gt | max |
|---|---|---|---|---|---|---|---|---|---|---|---|
| fbmy5635_rel_221222.cza1_ser7 | 12.467 | 87.358 | 0.172 | 0.003 | 0.037 | ||||||
| fbmy8028_rel_221222.cza1_ser7 | 3.867 | 95.836 | 0.219 | 0.078 | 0.050 | ||||||
| fbmy8032_rel_221222.cza1_ser7 | 4.928 | 94.778 | 0.225 | 0.069 | 0.033 |
Delete response time histogram: each cell has the percentage of responses that take <= the time in the header and max is the max response time in seconds. For max values in the top 25% of the range have a red background and in the bottom 25% of the range have a green background. The red background is not used when the min value is within 80% of the max value.
| dbms | 256us | 1ms | 4ms | 16ms | 64ms | 256ms | 1s | 4s | 16s | gt | max |
|---|---|---|---|---|---|---|---|---|---|---|---|
| fbmy5635_rel_221222.cza1_ser7 | 11.703 | 88.128 | 0.167 | 0.003 | 0.037 | ||||||
| fbmy8028_rel_221222.cza1_ser7 | 4.875 | 94.839 | 0.211 | 0.072 | 0.003 | 0.064 | |||||
| fbmy8032_rel_221222.cza1_ser7 | 7.256 | 92.444 | 0.231 | 0.069 | 0.047 |
Performance metrics for the DBMS listed above. Some are normalized by throughput, others are not. Legend for results is here.
ips	qps	rps	rmbps	wps	wmbps	rpq	rkbpq	wpi	wkbpi	csps	cpups	cspq	cpupq	dbgb1	dbgb2	rss	maxop	p50	p99	tag
998	7020	6	0.0	16.0	6.1	0.001	0.005	0.016	6.225	28903	7.1	4.117	81	4.2	5.5	17.3	0.004	6633	6201	fbmy5635_rel_221222.cza1_ser7
998	6101	34	0.2	16.5	6.0	0.006	0.032	0.017	6.104	25411	7.2	4.165	94	4.2	5.6	17.9	0.005	5837	5546	fbmy8028_rel_221222.cza1_ser7
998	5865	36	0.2	16.6	6.1	0.006	0.036	0.017	6.251	24738	7.7	4.218	105	4.1	5.6	17.9	0.002	5656	5454	fbmy8032_rel_221222.cza1_ser7
l.i0
l.i0: load without secondary indexes
Performance metrics for all DBMS, not just the ones listed above. Some are normalized by throughput, others are not. Legend for results is here.
ips	qps	rps	rmbps	wps	wmbps	rpq	rkbpq	wpi	wkbpi	csps	cpups	cspq	cpupq	dbgb1	dbgb2	rss	maxop	p50	p99	tag
206896	0	0	0.0	96.2	35.9	0.000	0.000	0.000	0.177	21625	10.9	0.105	4	1.8	3.2	0.3	0.114	207983	179297	fbmy5635_rel_221222.cza1_ser7
148148	0	0	0.0	94.1	32.3	0.000	0.000	0.001	0.223	16494	10.1	0.111	5	1.8	3.4	0.7	0.120	148839	128264	fbmy8028_rel_221222.cza1_ser7
143198	0	0	0.0	91.3	31.2	0.000	0.000	0.001	0.223	16232	10.6	0.113	6	1.8	3.4	0.7	0.096	144338	115223	fbmy8032_rel_221222.cza1_ser7
l.x
l.x: create secondary indexes
Performance metrics for all DBMS, not just the ones listed above. Some are normalized by throughput, others are not. Legend for results is here.
ips	qps	rps	rmbps	wps	wmbps	rpq	rkbpq	wpi	wkbpi	csps	cpups	cspq	cpupq	dbgb1	dbgb2	rss	maxop	p50	p99	tag
194175	0	0	0.0	77.5	30.8	0.000	0.000	0.000	0.162	208	5.9	0.001	2	4.0	5.4	4.0	0.002	NA	NA	fbmy5635_rel_221222.cza1_ser7
174927	0	0	0.0	67.4	27.0	0.000	0.000	0.000	0.158	352	5.8	0.002	3	4.0	5.6	4.6	0.002	NA	NA	fbmy8028_rel_221222.cza1_ser7
175953	0	0	0.0	68.0	27.2	0.000	0.000	0.000	0.158	565	5.8	0.003	3	4.0	5.6	4.6	0.008	NA	NA	fbmy8032_rel_221222.cza1_ser7
l.i1
l.i1: continue load after secondary indexes created with 50 inserts per transaction
Performance metrics for all DBMS, not just the ones listed above. Some are normalized by throughput, others are not. Legend for results is here.
ips	qps	rps	rmbps	wps	wmbps	rpq	rkbpq	wpi	wkbpi	csps	cpups	cspq	cpupq	dbgb1	dbgb2	rss	maxop	p50	p99	tag
69565	0	683	3.9	361.9	145.5	0.010	0.057	0.005	2.142	34366	25.1	0.494	29	4.9	5.3	6.7	0.101	69880	57336	fbmy5635_rel_221222.cza1_ser7
59524	0	587	3.3	324.4	127.3	0.010	0.057	0.005	2.190	30116	23.9	0.506	32	4.6	5.2	6.9	0.108	59886	49346	fbmy8028_rel_221222.cza1_ser7
58824	0	583	3.3	314.6	123.2	0.010	0.058	0.005	2.145	30005	23.6	0.510	32	5.0	5.6	6.8	0.101	59035	49946	fbmy8032_rel_221222.cza1_ser7
l.i2
l.i2: continue load after secondary indexes created with 5 inserts per transaction
Performance metrics for all DBMS, not just the ones listed above. Some are normalized by throughput, others are not. Legend for results is here.
ips	qps	rps	rmbps	wps	wmbps	rpq	rkbpq	wpi	wkbpi	csps	cpups	cspq	cpupq	dbgb1	dbgb2	rss	maxop	p50	p99	tag
24038	0	0	0.0	241.3	88.6	0.000	0.000	0.010	3.773	100168	20.4	4.167	68	4.4	4.6	8.0	0.087	24170	21377	fbmy5635_rel_221222.cza1_ser7
20877	0	0	0.0	238.4	85.1	0.000	0.000	0.011	4.175	85922	20.3	4.116	78	4.2	4.6	8.4	0.112	20922	18115	fbmy8028_rel_221222.cza1_ser7
20284	0	0	0.0	238.9	86.2	0.000	0.000	0.012	4.352	84031	20.7	4.143	82	4.3	4.6	8.5	0.097	20339	17825	fbmy8032_rel_221222.cza1_ser7
qr100.L1
qr100.L1: range queries with 100 insert/s per client
Performance metrics for all DBMS, not just the ones listed above. Some are normalized by throughput, others are not. Legend for results is here.
ips	qps	rps	rmbps	wps	wmbps	rpq	rkbpq	wpi	wkbpi	csps	cpups	cspq	cpupq	dbgb1	dbgb2	rss	maxop	p50	p99	tag
100	2425	0	0.0	4.6	0.5	0.000	0.000	0.046	4.996	9407	6.6	3.879	218	4.2	4.2	8.6	0.039	2429	2254	fbmy5635_rel_221222.cza1_ser7
100	2536	0	0.0	5.2	0.7	0.000	0.000	0.052	7.036	9987	6.4	3.937	202	4.1	4.4	9.0	0.040	2381	2238	fbmy8028_rel_221222.cza1_ser7
100	3485	0	0.0	5.0	0.6	0.000	0.000	0.050	6.092	13786	6.4	3.956	147	4.2	4.4	9.0	0.036	3900	2685	fbmy8032_rel_221222.cza1_ser7
qp100.L2
qp100.L2: point queries with 100 insert/s per client
Performance metrics for all DBMS, not just the ones listed above. Some are normalized by throughput, others are not. Legend for results is here.
ips	qps	rps	rmbps	wps	wmbps	rpq	rkbpq	wpi	wkbpi	csps	cpups	cspq	cpupq	dbgb1	dbgb2	rss	maxop	p50	p99	tag
100	6862	0	0.0	4.6	0.6	0.000	0.000	0.046	5.697	27583	6.3	4.020	73	4.2	4.2	11.6	0.001	6489	6217	fbmy5635_rel_221222.cza1_ser7
100	6086	0	0.0	4.3	0.4	0.000	0.000	0.043	4.601	24662	6.5	4.052	85	4.2	4.4	12.0	0.001	5881	5418	fbmy8028_rel_221222.cza1_ser7
100	5903	0	0.0	4.3	0.5	0.000	0.000	0.043	4.981	24110	6.3	4.084	85	4.2	4.4	12.1	0.001	5723	5546	fbmy8032_rel_221222.cza1_ser7
qr500.L3
qr500.L3: range queries with 500 insert/s per client
Performance metrics for all DBMS, not just the ones listed above. Some are normalized by throughput, others are not. Legend for results is here.
ips	qps	rps	rmbps	wps	wmbps	rpq	rkbpq	wpi	wkbpi	csps	cpups	cspq	cpupq	dbgb1	dbgb2	rss	maxop	p50	p99	tag
499	3462	0	0.0	10.2	3.3	0.000	0.000	0.020	6.686	13651	6.6	3.943	153	4.1	4.4	12.9	0.034	3196	2685	fbmy5635_rel_221222.cza1_ser7
499	3229	0	0.0	9.7	3.1	0.000	0.000	0.019	6.266	12918	6.8	4.001	168	4.2	4.6	13.2	0.036	3133	2685	fbmy8028_rel_221222.cza1_ser7
499	3227	0	0.0	10.2	3.3	0.000	0.000	0.020	6.672	13112	6.9	4.063	171	4.2	4.6	13.3	0.036	3212	2749	fbmy8032_rel_221222.cza1_ser7
qp500.L4
qp500.L4: point queries with 500 insert/s per client
Performance metrics for all DBMS, not just the ones listed above. Some are normalized by throughput, others are not. Legend for results is here.
ips	qps	rps	rmbps	wps	wmbps	rpq	rkbpq	wpi	wkbpi	csps	cpups	cspq	cpupq	dbgb1	dbgb2	rss	maxop	p50	p99	tag
499	6789	0	0.0	9.3	2.9	0.000	0.000	0.019	6.052	27582	6.9	4.063	81	4.1	4.6	13.7	0.003	6489	6221	fbmy5635_rel_221222.cza1_ser7
499	6158	0	0.0	9.2	2.9	0.000	0.000	0.018	5.915	25212	6.8	4.094	88	4.2	4.8	14.0	0.005	5865	5644	fbmy8028_rel_221222.cza1_ser7
499	5909	0	0.0	9.8	3.0	0.000	0.000	0.020	6.083	24413	6.6	4.131	89	4.2	4.8	14.1	0.004	5689	5482	fbmy8032_rel_221222.cza1_ser7
qr1000.L5
qr1000.L5: range queries with 1000 insert/s per client
Performance metrics for all DBMS, not just the ones listed above. Some are normalized by throughput, others are not. Legend for results is here.
ips	qps	rps	rmbps	wps	wmbps	rpq	rkbpq	wpi	wkbpi	csps	cpups	cspq	cpupq	dbgb1	dbgb2	rss	maxop	p50	p99	tag
998	3577	0	0.0	15.9	6.1	0.000	0.000	0.016	6.301	14450	7.0	4.040	157	4.2	5.1	15.8	0.036	3548	2781	fbmy5635_rel_221222.cza1_ser7
998	3225	0	0.0	16.5	6.4	0.000	0.000	0.017	6.527	13338	7.1	4.135	176	4.1	5.2	16.3	0.043	3164	2429	fbmy8028_rel_221222.cza1_ser7
998	3499	0	0.0	16.5	6.2	0.000	0.000	0.016	6.382	14571	7.1	4.164	162	4.2	5.2	16.1	0.049	3612	2589	fbmy8032_rel_221222.cza1_ser7
qp1000.L6
qp1000.L6: point queries with 1000 insert/s per client
Performance metrics for all DBMS, not just the ones listed above. Some are normalized by throughput, others are not. Legend for results is here.
ips	qps	rps	rmbps	wps	wmbps	rpq	rkbpq	wpi	wkbpi	csps	cpups	cspq	cpupq	dbgb1	dbgb2	rss	maxop	p50	p99	tag
998	7020	6	0.0	16.0	6.1	0.001	0.005	0.016	6.225	28903	7.1	4.117	81	4.2	5.5	17.3	0.004	6633	6201	fbmy5635_rel_221222.cza1_ser7
998	6101	34	0.2	16.5	6.0	0.006	0.032	0.017	6.104	25411	7.2	4.165	94	4.2	5.6	17.9	0.005	5837	5546	fbmy8028_rel_221222.cza1_ser7
998	5865	36	0.2	16.6	6.1	0.006	0.036	0.017	6.251	24738	7.7	4.218	105	4.1	5.6	17.9	0.002	5656	5454	fbmy8032_rel_221222.cza1_ser7
l.i0
- l.i0: load without secondary indexes
- Legend for results is here.
- Each entry lists the percentage of responses that fit in that bucket (slower than max time for previous bucket, faster than min time for next bucket).
Insert response time histogram
256us	1ms	4ms	16ms	64ms	256ms	1s	4s	16s	gt	max	tag
0.000	99.873	0.075	0.048	nonzero	0.003	0.000	0.000	0.000	0.000	0.114	fbmy5635_rel_221222.cza1_ser7
0.000	99.444	0.385	0.129	0.039	0.004	0.000	0.000	0.000	0.000	0.120	fbmy8028_rel_221222.cza1_ser7
0.000	99.299	0.529	0.130	0.038	0.004	0.000	0.000	0.000	0.000	0.096	fbmy8032_rel_221222.cza1_ser7
l.x
- l.x: create secondary indexes
- Legend for results is here.
- Each entry lists the percentage of responses that fit in that bucket (slower than max time for previous bucket, faster than min time for next bucket).
TODO - determine whether there is data for create index response time
l.i1
- l.i1: continue load after secondary indexes created with 50 inserts per transaction
- Legend for results is here.
- Each entry lists the percentage of responses that fit in that bucket (slower than max time for previous bucket, faster than min time for next bucket).
Insert response time histogram
256us	1ms	4ms	16ms	64ms	256ms	1s	4s	16s	gt	max	tag
0.000	98.844	1.081	0.070	0.001	0.004	0.000	0.000	0.000	0.000	0.101	fbmy5635_rel_221222.cza1_ser7
0.000	97.193	2.614	0.167	0.023	0.004	0.000	0.000	0.000	0.000	0.108	fbmy8028_rel_221222.cza1_ser7
0.000	97.305	2.501	0.169	0.021	0.004	0.000	0.000	0.000	0.000	0.101	fbmy8032_rel_221222.cza1_ser7
Delete response time histogram
256us	1ms	4ms	16ms	64ms	256ms	1s	4s	16s	gt	max	tag
0.000	98.997	0.921	0.073	0.004	0.004	0.000	0.000	0.000	0.000	0.102	fbmy5635_rel_221222.cza1_ser7
0.000	97.655	2.143	0.162	0.036	0.004	0.000	0.000	0.000	0.000	0.114	fbmy8028_rel_221222.cza1_ser7
0.000	97.799	2.000	0.165	0.032	0.004	0.000	0.000	0.000	0.000	0.094	fbmy8032_rel_221222.cza1_ser7
l.i2
- l.i2: continue load after secondary indexes created with 5 inserts per transaction
- Legend for results is here.
- Each entry lists the percentage of responses that fit in that bucket (slower than max time for previous bucket, faster than min time for next bucket).
Insert response time histogram
256us	1ms	4ms	16ms	64ms	256ms	1s	4s	16s	gt	max	tag
99.793	0.185	0.001	0.020	0.001	nonzero	0.000	0.000	0.000	0.000	0.087	fbmy5635_rel_221222.cza1_ser7
99.200	0.755	nonzero	0.042	0.001	0.001	0.000	0.000	0.000	0.000	0.112	fbmy8028_rel_221222.cza1_ser7
99.001	0.954	0.001	0.042	0.002	nonzero	0.000	0.000	0.000	0.000	0.097	fbmy8032_rel_221222.cza1_ser7
Delete response time histogram
256us	1ms	4ms	16ms	64ms	256ms	1s	4s	16s	gt	max	tag
99.230	0.748	0.001	0.021	0.001	nonzero	0.000	0.000	0.000	0.000	0.087	fbmy5635_rel_221222.cza1_ser7
97.138	2.817	0.001	0.043	0.001	0.001	0.000	0.000	0.000	0.000	0.111	fbmy8028_rel_221222.cza1_ser7
96.013	3.940	0.001	0.044	0.002	nonzero	0.000	0.000	0.000	0.000	0.086	fbmy8032_rel_221222.cza1_ser7
qr100.L1
- qr100.L1: range queries with 100 insert/s per client
- Legend for results is here.
- Each entry lists the percentage of responses that fit in that bucket (slower than max time for previous bucket, faster than min time for next bucket).
Query response time histogram
256us	1ms	4ms	16ms	64ms	256ms	1s	4s	16s	gt	max	tag
66.506	26.737	6.757	0.000	nonzero	0.000	0.000	0.000	0.000	0.000	0.039	fbmy5635_rel_221222.cza1_ser7
69.046	16.602	14.352	0.000	nonzero	0.000	0.000	0.000	0.000	0.000	0.040	fbmy8028_rel_221222.cza1_ser7
72.896	20.157	6.948	0.000	nonzero	0.000	0.000	0.000	0.000	0.000	0.036	fbmy8032_rel_221222.cza1_ser7
Insert response time histogram
256us	1ms	4ms	16ms	64ms	256ms	1s	4s	16s	gt	max	tag
0.000	4.306	95.389	0.306	0.000	0.000	0.000	0.000	0.000	0.000	0.015	fbmy5635_rel_221222.cza1_ser7
0.000	0.667	98.833	0.444	0.056	0.000	0.000	0.000	0.000	0.000	0.017	fbmy8028_rel_221222.cza1_ser7
0.000	0.361	99.139	0.444	0.056	0.000	0.000	0.000	0.000	0.000	0.017	fbmy8032_rel_221222.cza1_ser7
Delete response time histogram
256us	1ms	4ms	16ms	64ms	256ms	1s	4s	16s	gt	max	tag
0.000	8.056	91.639	0.306	0.000	0.000	0.000	0.000	0.000	0.000	0.015	fbmy5635_rel_221222.cza1_ser7
0.000	1.167	98.472	0.333	0.028	0.000	0.000	0.000	0.000	0.000	0.017	fbmy8028_rel_221222.cza1_ser7
0.000	0.333	99.278	0.361	0.028	0.000	0.000	0.000	0.000	0.000	0.017	fbmy8032_rel_221222.cza1_ser7
qp100.L2
- qp100.L2: point queries with 100 insert/s per client
- Legend for results is here.
- Each entry lists the percentage of responses that fit in that bucket (slower than max time for previous bucket, faster than min time for next bucket).
Query response time histogram
256us	1ms	4ms	16ms	64ms	256ms	1s	4s	16s	gt	max	tag
99.800	0.200	nonzero	0.000	0.000	0.000	0.000	0.000	0.000	0.000	0.001	fbmy5635_rel_221222.cza1_ser7
99.627	0.373	nonzero	0.000	0.000	0.000	0.000	0.000	0.000	0.000	0.001	fbmy8028_rel_221222.cza1_ser7
99.575	0.425	nonzero	0.000	0.000	0.000	0.000	0.000	0.000	0.000	0.001	fbmy8032_rel_221222.cza1_ser7
Insert response time histogram
256us	1ms	4ms	16ms	64ms	256ms	1s	4s	16s	gt	max	tag
0.000	5.806	93.889	0.306	0.000	0.000	0.000	0.000	0.000	0.000	0.009	fbmy5635_rel_221222.cza1_ser7
0.000	1.111	98.472	0.361	0.056	0.000	0.000	0.000	0.000	0.000	0.017	fbmy8028_rel_221222.cza1_ser7
0.000	1.111	98.417	0.417	0.056	0.000	0.000	0.000	0.000	0.000	0.017	fbmy8032_rel_221222.cza1_ser7
Delete response time histogram
256us	1ms	4ms	16ms	64ms	256ms	1s	4s	16s	gt	max	tag
0.000	8.556	91.167	0.278	0.000	0.000	0.000	0.000	0.000	0.000	0.008	fbmy5635_rel_221222.cza1_ser7
0.000	3.639	96.028	0.306	0.028	0.000	0.000	0.000	0.000	0.000	0.016	fbmy8028_rel_221222.cza1_ser7
0.000	0.806	98.778	0.389	0.028	0.000	0.000	0.000	0.000	0.000	0.017	fbmy8032_rel_221222.cza1_ser7
qr500.L3
- qr500.L3: range queries with 500 insert/s per client
- Legend for results is here.
- Each entry lists the percentage of responses that fit in that bucket (slower than max time for previous bucket, faster than min time for next bucket).
Query response time histogram
256us	1ms	4ms	16ms	64ms	256ms	1s	4s	16s	gt	max	tag
76.803	19.126	4.072	nonzero	nonzero	0.000	0.000	0.000	0.000	0.000	0.034	fbmy5635_rel_221222.cza1_ser7
72.863	21.889	5.247	0.000	nonzero	0.000	0.000	0.000	0.000	0.000	0.036	fbmy8028_rel_221222.cza1_ser7
68.580	25.963	5.457	0.000	nonzero	0.000	0.000	0.000	0.000	0.000	0.036	fbmy8032_rel_221222.cza1_ser7
Insert response time histogram
256us	1ms	4ms	16ms	64ms	256ms	1s	4s	16s	gt	max	tag
0.000	7.867	91.939	0.194	0.000	0.000	0.000	0.000	0.000	0.000	0.013	fbmy5635_rel_221222.cza1_ser7
0.000	1.483	98.206	0.244	0.067	0.000	0.000	0.000	0.000	0.000	0.017	fbmy8028_rel_221222.cza1_ser7
0.000	1.378	98.289	0.256	0.078	0.000	0.000	0.000	0.000	0.000	0.017	fbmy8032_rel_221222.cza1_ser7
Delete response time histogram
256us	1ms	4ms	16ms	64ms	256ms	1s	4s	16s	gt	max	tag
0.000	6.806	93.033	0.161	0.000	0.000	0.000	0.000	0.000	0.000	0.014	fbmy5635_rel_221222.cza1_ser7
0.000	5.311	94.400	0.222	0.067	0.000	0.000	0.000	0.000	0.000	0.022	fbmy8028_rel_221222.cza1_ser7
0.000	3.361	96.311	0.261	0.067	0.000	0.000	0.000	0.000	0.000	0.017	fbmy8032_rel_221222.cza1_ser7
qp500.L4
- qp500.L4: point queries with 500 insert/s per client
- Legend for results is here.
- Each entry lists the percentage of responses that fit in that bucket (slower than max time for previous bucket, faster than min time for next bucket).
Query response time histogram
256us	1ms	4ms	16ms	64ms	256ms	1s	4s	16s	gt	max	tag
99.768	0.232	nonzero	0.000	0.000	0.000	0.000	0.000	0.000	0.000	0.003	fbmy5635_rel_221222.cza1_ser7
99.538	0.462	nonzero	nonzero	0.000	0.000	0.000	0.000	0.000	0.000	0.005	fbmy8028_rel_221222.cza1_ser7
99.487	0.513	nonzero	0.000	0.000	0.000	0.000	0.000	0.000	0.000	0.004	fbmy8032_rel_221222.cza1_ser7
Insert response time histogram
256us	1ms	4ms	16ms	64ms	256ms	1s	4s	16s	gt	max	tag
0.000	10.117	89.672	0.211	0.000	0.000	0.000	0.000	0.000	0.000	0.008	fbmy5635_rel_221222.cza1_ser7
0.000	4.289	95.350	0.289	0.072	0.000	0.000	0.000	0.000	0.000	0.018	fbmy8028_rel_221222.cza1_ser7
0.000	5.044	94.633	0.233	0.089	0.000	0.000	0.000	0.000	0.000	0.017	fbmy8032_rel_221222.cza1_ser7
Delete response time histogram
256us	1ms	4ms	16ms	64ms	256ms	1s	4s	16s	gt	max	tag
0.000	13.633	86.156	0.211	0.000	0.000	0.000	0.000	0.000	0.000	0.008	fbmy5635_rel_221222.cza1_ser7
0.000	4.472	95.194	0.267	0.067	0.000	0.000	0.000	0.000	0.000	0.018	fbmy8028_rel_221222.cza1_ser7
0.000	8.533	91.139	0.244	0.083	0.000	0.000	0.000	0.000	0.000	0.017	fbmy8032_rel_221222.cza1_ser7
qr1000.L5
- qr1000.L5: range queries with 1000 insert/s per client
- Legend for results is here.
- Each entry lists the percentage of responses that fit in that bucket (slower than max time for previous bucket, faster than min time for next bucket).
Query response time histogram
256us	1ms	4ms	16ms	64ms	256ms	1s	4s	16s	gt	max	tag
72.737	25.033	2.229	nonzero	nonzero	0.000	0.000	0.000	0.000	0.000	0.036	fbmy5635_rel_221222.cza1_ser7
68.019	29.783	2.197	0.000	nonzero	0.000	0.000	0.000	0.000	0.000	0.043	fbmy8028_rel_221222.cza1_ser7
71.004	24.821	4.174	nonzero	nonzero	0.000	0.000	0.000	0.000	0.000	0.049	fbmy8032_rel_221222.cza1_ser7
Insert response time histogram
256us	1ms	4ms	16ms	64ms	256ms	1s	4s	16s	gt	max	tag
0.000	10.378	89.444	0.175	0.003	0.000	0.000	0.000	0.000	0.000	0.049	fbmy5635_rel_221222.cza1_ser7
0.000	2.239	97.478	0.211	0.072	0.000	0.000	0.000	0.000	0.000	0.056	fbmy8028_rel_221222.cza1_ser7
0.000	4.886	94.825	0.214	0.075	0.000	0.000	0.000	0.000	0.000	0.041	fbmy8032_rel_221222.cza1_ser7
Delete response time histogram
256us	1ms	4ms	16ms	64ms	256ms	1s	4s	16s	gt	max	tag
0.000	9.931	89.883	0.178	0.008	0.000	0.000	0.000	0.000	0.000	0.056	fbmy5635_rel_221222.cza1_ser7
0.000	3.567	96.164	0.194	0.075	0.000	0.000	0.000	0.000	0.000	0.056	fbmy8028_rel_221222.cza1_ser7
0.000	3.164	96.567	0.197	0.072	0.000	0.000	0.000	0.000	0.000	0.055	fbmy8032_rel_221222.cza1_ser7
qp1000.L6
- qp1000.L6: point queries with 1000 insert/s per client
- Legend for results is here.
- Each entry lists the percentage of responses that fit in that bucket (slower than max time for previous bucket, faster than min time for next bucket).
Query response time histogram
256us	1ms	4ms	16ms	64ms	256ms	1s	4s	16s	gt	max	tag
99.746	0.254	nonzero	0.000	0.000	0.000	0.000	0.000	0.000	0.000	0.004	fbmy5635_rel_221222.cza1_ser7
99.481	0.519	nonzero	nonzero	0.000	0.000	0.000	0.000	0.000	0.000	0.005	fbmy8028_rel_221222.cza1_ser7
99.453	0.547	nonzero	0.000	0.000	0.000	0.000	0.000	0.000	0.000	0.002	fbmy8032_rel_221222.cza1_ser7
Insert response time histogram
256us	1ms	4ms	16ms	64ms	256ms	1s	4s	16s	gt	max	tag
0.000	12.467	87.358	0.172	0.003	0.000	0.000	0.000	0.000	0.000	0.037	fbmy5635_rel_221222.cza1_ser7
0.000	3.867	95.836	0.219	0.078	0.000	0.000	0.000	0.000	0.000	0.050	fbmy8028_rel_221222.cza1_ser7
0.000	4.928	94.778	0.225	0.069	0.000	0.000	0.000	0.000	0.000	0.033	fbmy8032_rel_221222.cza1_ser7
Delete response time histogram
256us	1ms	4ms	16ms	64ms	256ms	1s	4s	16s	gt	max	tag
0.000	11.703	88.128	0.167	0.003	0.000	0.000	0.000	0.000	0.000	0.037	fbmy5635_rel_221222.cza1_ser7
0.000	4.875	94.839	0.211	0.072	0.003	0.000	0.000	0.000	0.000	0.064	fbmy8028_rel_221222.cza1_ser7
0.000	7.256	92.444	0.231	0.069	0.000	0.000	0.000	0.000	0.000	0.047	fbmy8032_rel_221222.cza1_ser7