Introduction
This is a report for the insert benchmark with 20M docs and 1 client(s). It is generated by scripts (bash, awk, sed) and Tufte might not be impressed. An overview of the insert benchmark is here and a short update is here. Below, by DBMS, I mean DBMS+version.config. An example is my8020.c10b40 where my means MySQL, 8020 is version 8.0.20 and c10b40 is the name for the configuration file.
The test server has 8 AMD cores, 16G RAM and an NVMe SSD. It is described here as the Beelink. The benchmark was run with 1 client and there were 1 or 3 connections per client (1 for queries or inserts without rate limits, 1+1 for rate limited inserts+deletes). It uses 1 table. It loads 20M rows per table without secondary indexes, creates 3 secondary indexes per table, then inserts 50m+50m rows per table with a delete per insert to avoid growing the table. It then does 6 read+write tests for 1800s each that do queries as fast as possible with 100,100,500,500,1000,1000 inserts/s and the same for deletes/s per client concurrent with the queries. The database is cached in memory. Clients and the DBMS share one server. The per-database configs are in the per-database subdirectories here.
The tested DBMS are:
- fbmy8028_rel_221222.cza1_bee - MyRocks 8.0.28 compiled with gcc 11.4.0 from code as of 2023-12-22 at git hash 2ad105fc, RocksDB 8.7.0 at git hash 29005f0b, cza1_bee config
- fbmy8028_rel_221222.cza1ps0_bee - MyRocks 8.0.28 compiled with gcc 11.4.0 from code as of 2023-12-22 at git hash 2ad105fc, RocksDB 8.7.0 at git hash 29005f0b, cza1ps0_bee config that disables the perf schema
- fbmy8028_rel_clang14_221222.cza1_bee - MyRocks 8.0.28 compiled with clang 14.0.0 from code as of 2023-12-22 at git hash 2ad105fc, RocksDB 8.7.0 at git hash 29005f0b, cza1_bee config
- fbmy8028_rel_clang15_221222.cza1_bee - MyRocks 8.0.28 compiled with clang 15.0.7 from code as of 2023-12-22 at git hash 2ad105fc, RocksDB 8.7.0 at git hash 29005f0b, cza1_bee config
Contents
- Summary
- l.i0: load without secondary indexes
- l.x: create secondary indexes
- l.i1: continue load after secondary indexes created with 50 inserts per transaction
- l.i2: continue load after secondary indexes created with 5 inserts per transaction
- qr100.L1: range queries with 100 insert/s per client
- qp100.L2: point queries with 100 insert/s per client
- qr500.L3: range queries with 500 insert/s per client
- qp500.L4: point queries with 500 insert/s per client
- qr1000.L5: range queries with 1000 insert/s per client
- qp1000.L6: point queries with 1000 insert/s per client
Summary
The numbers are inserts/s for l.i0, l.i1 and l.i2, indexed docs (or rows) /s for l.x and queries/s for qr100, qp100 thru qr1000, qp1000" The values are the average rate over the entire test for inserts (IPS) and queries (QPS). The range of values for IPS and QPS is split into 3 parts: bottom 25%, middle 50%, top 25%. Values in the bottom 25% have a red background, values in the top 25% have a green background and values in the middle have no color. A gray background is used for values that can be ignored because the DBMS did not sustain the target insert rate. Red backgrounds are not used when the minimum value is within 80% of the max value.
| dbms | l.i0 | l.x | l.i1 | l.i2 | qr100 | qp100 | qr500 | qp500 | qr1000 | qp1000 |
|---|---|---|---|---|---|---|---|---|---|---|
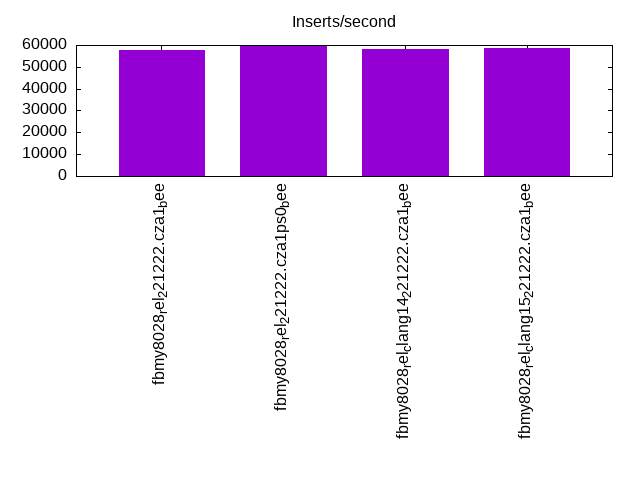
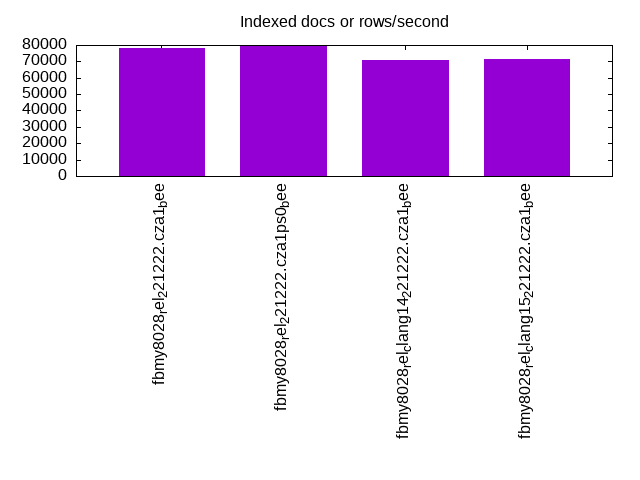
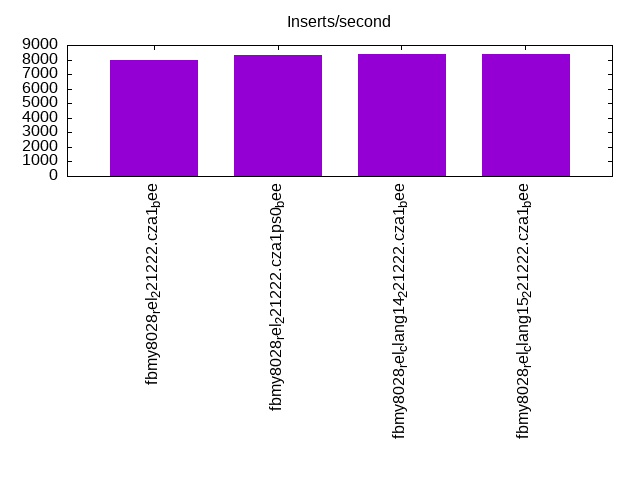
| fbmy8028_rel_221222.cza1_bee | 57803 | 78432 | 22896 | 7968 | 1704 | 2480 | 1498 | 2393 | 1212 | 2358 |
| fbmy8028_rel_221222.cza1ps0_bee | 59701 | 79682 | 23460 | 8326 | 1776 | 2306 | 1594 | 2336 | 1366 | 2368 |
| fbmy8028_rel_clang14_221222.cza1_bee | 58140 | 70672 | 23585 | 8382 | 1146 | 2442 | 1447 | 2442 | 1423 | 2380 |
| fbmy8028_rel_clang15_221222.cza1_bee | 58824 | 71429 | 23711 | 8389 | 1309 | 2521 | 1325 | 2438 | 1337 | 2428 |
This table has relative throughput, throughput for the DBMS relative to the DBMS in the first line, using the absolute throughput from the previous table. Values less than 0.95 have a yellow background. Values greater than 1.05 have a blue background.
| dbms | l.i0 | l.x | l.i1 | l.i2 | qr100 | qp100 | qr500 | qp500 | qr1000 | qp1000 |
|---|---|---|---|---|---|---|---|---|---|---|
| fbmy8028_rel_221222.cza1_bee | 1.00 | 1.00 | 1.00 | 1.00 | 1.00 | 1.00 | 1.00 | 1.00 | 1.00 | 1.00 |
| fbmy8028_rel_221222.cza1ps0_bee | 1.03 | 1.02 | 1.02 | 1.04 | 1.04 | 0.93 | 1.06 | 0.98 | 1.13 | 1.00 |
| fbmy8028_rel_clang14_221222.cza1_bee | 1.01 | 0.90 | 1.03 | 1.05 | 0.67 | 0.98 | 0.97 | 1.02 | 1.17 | 1.01 |
| fbmy8028_rel_clang15_221222.cza1_bee | 1.02 | 0.91 | 1.04 | 1.05 | 0.77 | 1.02 | 0.88 | 1.02 | 1.10 | 1.03 |
This lists the average rate of inserts/s for the tests that do inserts concurrent with queries. For such tests the query rate is listed in the table above. The read+write tests are setup so that the insert rate should match the target rate every second. Cells that are not at least 95% of the target have a red background to indicate a failure to satisfy the target.
| dbms | qr100.L1 | qp100.L2 | qr500.L3 | qp500.L4 | qr1000.L5 | qp1000.L6 |
|---|---|---|---|---|---|---|
| fbmy8028_rel_221222.cza1_bee | 100 | 100 | 499 | 499 | 998 | 998 |
| fbmy8028_rel_221222.cza1ps0_bee | 100 | 100 | 499 | 499 | 998 | 998 |
| fbmy8028_rel_clang14_221222.cza1_bee | 100 | 100 | 499 | 499 | 998 | 998 |
| fbmy8028_rel_clang15_221222.cza1_bee | 100 | 100 | 499 | 499 | 998 | 998 |
| target | 100 | 100 | 500 | 500 | 1000 | 1000 |
l.i0
l.i0: load without secondary indexes. Graphs for performance per 1-second interval are here.
Average throughput:
Insert response time histogram: each cell has the percentage of responses that take <= the time in the header and max is the max response time in seconds. For the max column values in the top 25% of the range have a red background and in the bottom 25% of the range have a green background. The red background is not used when the min value is within 80% of the max value.
| dbms | 256us | 1ms | 4ms | 16ms | 64ms | 256ms | 1s | 4s | 16s | gt | max |
|---|---|---|---|---|---|---|---|---|---|---|---|
| fbmy8028_rel_221222.cza1_bee | 99.723 | 0.200 | 0.074 | 0.003 | 0.077 | ||||||
| fbmy8028_rel_221222.cza1ps0_bee | 99.729 | 0.193 | 0.076 | 0.003 | 0.076 | ||||||
| fbmy8028_rel_clang14_221222.cza1_bee | 99.725 | 0.199 | 0.073 | 0.003 | 0.081 | ||||||
| fbmy8028_rel_clang15_221222.cza1_bee | 99.728 | 0.201 | 0.068 | 0.002 | 0.070 |
Performance metrics for the DBMS listed above. Some are normalized by throughput, others are not. Legend for results is here.
ips	qps	rps	rmbps	wps	wmbps	rpq	rkbpq	wpi	wkbpi	csps	cpups	cspq	cpupq	dbgb1	dbgb2	rss	maxop	p50	p99	tag
57803	0	0	0.0	34.6	11.1	0.000	0.000	0.001	0.196	5985	22.0	0.104	30	0.7	1.9	0.6	0.077	58042	52741	fbmy8028_rel_221222.cza1_bee
59701	0	0	0.0	35.9	11.4	0.000	0.000	0.001	0.196	6155	22.3	0.103	30	0.7	1.9	0.4	0.076	59934	53443	fbmy8028_rel_221222.cza1ps0_bee
58140	0	0	0.0	34.7	11.0	0.000	0.000	0.001	0.195	6034	22.1	0.104	30	0.7	1.9	0.6	0.081	58435	52742	fbmy8028_rel_clang14_221222.cza1_bee
58824	0	0	0.0	35.1	11.2	0.000	0.000	0.001	0.196	6108	22.5	0.104	31	0.7	1.9	0.6	0.070	59231	53160	fbmy8028_rel_clang15_221222.cza1_bee
l.x
l.x: create secondary indexes.
Average throughput:
Performance metrics for the DBMS listed above. Some are normalized by throughput, others are not. Legend for results is here.
ips	qps	rps	rmbps	wps	wmbps	rpq	rkbpq	wpi	wkbpi	csps	cpups	cspq	cpupq	dbgb1	dbgb2	rss	maxop	p50	p99	tag
78432	0	0	0.0	30.5	12.1	0.000	0.000	0.000	0.158	351	11.8	0.004	12	1.4	2.6	2.0	0.003	NA	NA	fbmy8028_rel_221222.cza1_bee
79682	0	0	0.0	31.5	12.4	0.000	0.000	0.000	0.159	344	11.8	0.004	12	1.4	2.6	1.8	0.004	NA	NA	fbmy8028_rel_221222.cza1ps0_bee
70672	0	0	0.0	27.8	10.9	0.000	0.000	0.000	0.158	372	11.8	0.005	13	1.4	2.6	2.0	0.003	NA	NA	fbmy8028_rel_clang14_221222.cza1_bee
71429	0	0	0.0	27.8	10.9	0.000	0.000	0.000	0.157	342	11.9	0.005	13	1.4	2.6	2.0	0.003	NA	NA	fbmy8028_rel_clang15_221222.cza1_bee
l.i1
l.i1: continue load after secondary indexes created with 50 inserts per transaction. Graphs for performance per 1-second interval are here.
Average throughput:

Insert response time histogram: each cell has the percentage of responses that take <= the time in the header and max is the max response time in seconds. For the max column values in the top 25% of the range have a red background and in the bottom 25% of the range have a green background. The red background is not used when the min value is within 80% of the max value.
| dbms | 256us | 1ms | 4ms | 16ms | 64ms | 256ms | 1s | 4s | 16s | gt | max |
|---|---|---|---|---|---|---|---|---|---|---|---|
| fbmy8028_rel_221222.cza1_bee | 99.671 | 0.254 | 0.072 | 0.003 | 0.090 | ||||||
| fbmy8028_rel_221222.cza1ps0_bee | 99.675 | 0.251 | 0.070 | 0.003 | 0.090 | ||||||
| fbmy8028_rel_clang14_221222.cza1_bee | 99.678 | 0.252 | 0.067 | 0.004 | 0.100 | ||||||
| fbmy8028_rel_clang15_221222.cza1_bee | 99.679 | 0.249 | 0.068 | 0.003 | 0.087 |
Delete response time histogram: each cell has the percentage of responses that take <= the time in the header and max is the max response time in seconds. For the max column values in the top 25% of the range have a red background and in the bottom 25% of the range have a green background. The red background is not used when the min value is within 80% of the max value.
| dbms | 256us | 1ms | 4ms | 16ms | 64ms | 256ms | 1s | 4s | 16s | gt | max |
|---|---|---|---|---|---|---|---|---|---|---|---|
| fbmy8028_rel_221222.cza1_bee | 99.662 | 0.255 | 0.080 | 0.003 | 0.095 | ||||||
| fbmy8028_rel_221222.cza1ps0_bee | 99.667 | 0.251 | 0.079 | 0.003 | 0.088 | ||||||
| fbmy8028_rel_clang14_221222.cza1_bee | 99.669 | 0.254 | 0.075 | 0.003 | 0.093 | ||||||
| fbmy8028_rel_clang15_221222.cza1_bee | 99.669 | 0.252 | 0.077 | 0.003 | 0.094 |
Performance metrics for the DBMS listed above. Some are normalized by throughput, others are not. Legend for results is here.
ips	qps	rps	rmbps	wps	wmbps	rpq	rkbpq	wpi	wkbpi	csps	cpups	cspq	cpupq	dbgb1	dbgb2	rss	maxop	p50	p99	tag
22896	0	76	0.4	111.8	42.5	0.003	0.019	0.005	1.899	10203	46.1	0.446	161	1.9	4.0	5.5	0.090	22874	20427	fbmy8028_rel_221222.cza1_bee
23460	0	78	0.4	111.2	42.4	0.003	0.019	0.005	1.851	10405	46.0	0.444	157	1.7	3.8	5.1	0.090	23394	20727	fbmy8028_rel_221222.cza1ps0_bee
23585	0	78	0.4	108.9	41.4	0.003	0.019	0.005	1.797	10397	46.2	0.441	157	1.7	3.8	5.2	0.100	23535	20877	fbmy8028_rel_clang14_221222.cza1_bee
23711	0	78	0.4	110.7	42.0	0.003	0.019	0.005	1.815	10484	46.3	0.442	156	1.8	3.9	5.3	0.087	23676	20828	fbmy8028_rel_clang15_221222.cza1_bee
l.i2
l.i2: continue load after secondary indexes created with 5 inserts per transaction. Graphs for performance per 1-second interval are here.
Average throughput:
Insert response time histogram: each cell has the percentage of responses that take <= the time in the header and max is the max response time in seconds. For the max column values in the top 25% of the range have a red background and in the bottom 25% of the range have a green background. The red background is not used when the min value is within 80% of the max value.
| dbms | 256us | 1ms | 4ms | 16ms | 64ms | 256ms | 1s | 4s | 16s | gt | max |
|---|---|---|---|---|---|---|---|---|---|---|---|
| fbmy8028_rel_221222.cza1_bee | 99.834 | 0.082 | 0.080 | 0.003 | nonzero | 0.081 | |||||
| fbmy8028_rel_221222.cza1ps0_bee | 99.860 | 0.059 | 0.078 | 0.003 | nonzero | 0.072 | |||||
| fbmy8028_rel_clang14_221222.cza1_bee | 99.871 | 0.048 | 0.077 | 0.003 | nonzero | 0.073 | |||||
| fbmy8028_rel_clang15_221222.cza1_bee | 99.870 | 0.050 | 0.077 | 0.003 | nonzero | 0.109 |
Delete response time histogram: each cell has the percentage of responses that take <= the time in the header and max is the max response time in seconds. For the max column values in the top 25% of the range have a red background and in the bottom 25% of the range have a green background. The red background is not used when the min value is within 80% of the max value.
| dbms | 256us | 1ms | 4ms | 16ms | 64ms | 256ms | 1s | 4s | 16s | gt | max |
|---|---|---|---|---|---|---|---|---|---|---|---|
| fbmy8028_rel_221222.cza1_bee | 99.796 | 0.119 | 0.081 | 0.003 | nonzero | 0.077 | |||||
| fbmy8028_rel_221222.cza1ps0_bee | 99.842 | 0.076 | 0.079 | 0.003 | nonzero | 0.081 | |||||
| fbmy8028_rel_clang14_221222.cza1_bee | 99.843 | 0.075 | 0.078 | 0.003 | nonzero | 0.083 | |||||
| fbmy8028_rel_clang15_221222.cza1_bee | 99.836 | 0.082 | 0.078 | 0.004 | nonzero | 0.089 |
Performance metrics for the DBMS listed above. Some are normalized by throughput, others are not. Legend for results is here.
ips	qps	rps	rmbps	wps	wmbps	rpq	rkbpq	wpi	wkbpi	csps	cpups	cspq	cpupq	dbgb1	dbgb2	rss	maxop	p50	p99	tag
7968	0	0	0.0	99.3	35.9	0.000	0.000	0.012	4.608	33145	43.2	4.160	434	1.5	1.7	7.6	0.081	7929	7042	fbmy8028_rel_221222.cza1_bee
8326	0	0	0.0	102.8	37.8	0.000	0.000	0.012	4.653	34370	43.7	4.128	420	1.5	1.7	7.4	0.072	8266	7322	fbmy8028_rel_221222.cza1ps0_bee
8382	0	0	0.0	101.8	36.7	0.000	0.000	0.012	4.478	34477	43.8	4.113	418	1.5	1.7	7.4	0.073	8373	7201	fbmy8028_rel_clang14_221222.cza1_bee
8389	0	0	0.0	101.7	36.7	0.000	0.000	0.012	4.477	34516	43.9	4.114	419	1.6	1.8	7.4	0.109	8341	7357	fbmy8028_rel_clang15_221222.cza1_bee
qr100.L1
qr100.L1: range queries with 100 insert/s per client. Graphs for performance per 1-second interval are here.
Average throughput:
Query response time histogram: each cell has the percentage of responses that take <= the time in the header and max is the max response time in seconds. For max values in the top 25% of the range have a red background and in the bottom 25% of the range have a green background. The red background is not used when the min value is within 80% of the max value.
| dbms | 256us | 1ms | 4ms | 16ms | 64ms | 256ms | 1s | 4s | 16s | gt | max |
|---|---|---|---|---|---|---|---|---|---|---|---|
| fbmy8028_rel_221222.cza1_bee | 9.647 | 81.277 | 9.075 | 0.001 | nonzero | 0.018 | |||||
| fbmy8028_rel_221222.cza1ps0_bee | 10.774 | 73.695 | 15.531 | nonzero | 0.027 | ||||||
| fbmy8028_rel_clang14_221222.cza1_bee | 3.472 | 66.398 | 30.130 | nonzero | nonzero | 0.030 | |||||
| fbmy8028_rel_clang15_221222.cza1_bee | 4.708 | 62.000 | 33.292 | nonzero | 0.005 |
Insert response time histogram: each cell has the percentage of responses that take <= the time in the header and max is the max response time in seconds. For max values in the top 25% of the range have a red background and in the bottom 25% of the range have a green background. The red background is not used when the min value is within 80% of the max value.
| dbms | 256us | 1ms | 4ms | 16ms | 64ms | 256ms | 1s | 4s | 16s | gt | max |
|---|---|---|---|---|---|---|---|---|---|---|---|
| fbmy8028_rel_221222.cza1_bee | 99.444 | 0.500 | 0.056 | 0.018 | |||||||
| fbmy8028_rel_221222.cza1ps0_bee | 99.361 | 0.583 | 0.056 | 0.018 | |||||||
| fbmy8028_rel_clang14_221222.cza1_bee | 99.889 | 0.056 | 0.056 | 0.017 | |||||||
| fbmy8028_rel_clang15_221222.cza1_bee | 99.694 | 0.250 | 0.056 | 0.018 |
Delete response time histogram: each cell has the percentage of responses that take <= the time in the header and max is the max response time in seconds. For max values in the top 25% of the range have a red background and in the bottom 25% of the range have a green background. The red background is not used when the min value is within 80% of the max value.
| dbms | 256us | 1ms | 4ms | 16ms | 64ms | 256ms | 1s | 4s | 16s | gt | max |
|---|---|---|---|---|---|---|---|---|---|---|---|
| fbmy8028_rel_221222.cza1_bee | 99.556 | 0.389 | 0.056 | 0.018 | |||||||
| fbmy8028_rel_221222.cza1ps0_bee | 99.528 | 0.444 | 0.028 | 0.017 | |||||||
| fbmy8028_rel_clang14_221222.cza1_bee | 99.944 | 0.028 | 0.028 | 0.017 | |||||||
| fbmy8028_rel_clang15_221222.cza1_bee | 99.750 | 0.222 | 0.028 | 0.018 |
Performance metrics for the DBMS listed above. Some are normalized by throughput, others are not. Legend for results is here.
ips	qps	rps	rmbps	wps	wmbps	rpq	rkbpq	wpi	wkbpi	csps	cpups	cspq	cpupq	dbgb1	dbgb2	rss	maxop	p50	p99	tag
100	1704	0	0.0	4.3	0.4	0.000	0.000	0.043	4.015	6794	12.6	3.987	591	1.5	1.7	7.9	0.018	1885	1167	fbmy8028_rel_221222.cza1_bee
100	1776	0	0.0	4.4	0.4	0.000	0.000	0.044	4.450	7060	12.5	3.974	563	1.5	1.7	7.6	0.027	1870	1214	fbmy8028_rel_221222.cza1ps0_bee
100	1146	0	0.0	4.1	0.3	0.000	0.000	0.041	3.456	4670	12.6	4.074	879	1.5	1.7	7.7	0.030	1151	1055	fbmy8028_rel_clang14_221222.cza1_bee
100	1309	0	0.0	4.1	0.4	0.000	0.000	0.041	3.677	5294	12.5	4.043	764	1.5	1.7	7.7	0.005	1311	1215	fbmy8028_rel_clang15_221222.cza1_bee
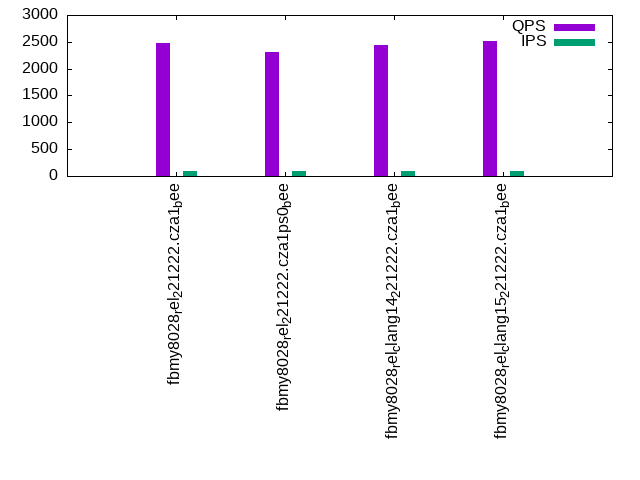
qp100.L2
qp100.L2: point queries with 100 insert/s per client. Graphs for performance per 1-second interval are here.
Average throughput:
Query response time histogram: each cell has the percentage of responses that take <= the time in the header and max is the max response time in seconds. For max values in the top 25% of the range have a red background and in the bottom 25% of the range have a green background. The red background is not used when the min value is within 80% of the max value.
| dbms | 256us | 1ms | 4ms | 16ms | 64ms | 256ms | 1s | 4s | 16s | gt | max |
|---|---|---|---|---|---|---|---|---|---|---|---|
| fbmy8028_rel_221222.cza1_bee | nonzero | 99.986 | 0.013 | 0.001 | 0.010 | ||||||
| fbmy8028_rel_221222.cza1ps0_bee | 0.004 | 99.991 | 0.004 | 0.001 | 0.010 | ||||||
| fbmy8028_rel_clang14_221222.cza1_bee | 99.996 | 0.004 | 0.003 | ||||||||
| fbmy8028_rel_clang15_221222.cza1_bee | 99.997 | 0.003 | 0.003 |
Insert response time histogram: each cell has the percentage of responses that take <= the time in the header and max is the max response time in seconds. For max values in the top 25% of the range have a red background and in the bottom 25% of the range have a green background. The red background is not used when the min value is within 80% of the max value.
| dbms | 256us | 1ms | 4ms | 16ms | 64ms | 256ms | 1s | 4s | 16s | gt | max |
|---|---|---|---|---|---|---|---|---|---|---|---|
| fbmy8028_rel_221222.cza1_bee | 99.611 | 0.333 | 0.056 | 0.018 | |||||||
| fbmy8028_rel_221222.cza1ps0_bee | 99.417 | 0.500 | 0.083 | 0.018 | |||||||
| fbmy8028_rel_clang14_221222.cza1_bee | 99.611 | 0.333 | 0.056 | 0.017 | |||||||
| fbmy8028_rel_clang15_221222.cza1_bee | 99.778 | 0.167 | 0.056 | 0.018 |
Delete response time histogram: each cell has the percentage of responses that take <= the time in the header and max is the max response time in seconds. For max values in the top 25% of the range have a red background and in the bottom 25% of the range have a green background. The red background is not used when the min value is within 80% of the max value.
| dbms | 256us | 1ms | 4ms | 16ms | 64ms | 256ms | 1s | 4s | 16s | gt | max |
|---|---|---|---|---|---|---|---|---|---|---|---|
| fbmy8028_rel_221222.cza1_bee | 99.750 | 0.194 | 0.056 | 0.018 | |||||||
| fbmy8028_rel_221222.cza1ps0_bee | 99.528 | 0.389 | 0.083 | 0.017 | |||||||
| fbmy8028_rel_clang14_221222.cza1_bee | 99.583 | 0.361 | 0.056 | 0.017 | |||||||
| fbmy8028_rel_clang15_221222.cza1_bee | 99.778 | 0.167 | 0.056 | 0.018 |
Performance metrics for the DBMS listed above. Some are normalized by throughput, others are not. Legend for results is here.
ips	qps	rps	rmbps	wps	wmbps	rpq	rkbpq	wpi	wkbpi	csps	cpups	cspq	cpupq	dbgb1	dbgb2	rss	maxop	p50	p99	tag
100	2480	23	0.1	4.1	0.3	0.009	0.058	0.041	3.476	10320	13.2	4.161	426	1.5	1.8	8.6	0.010	2446	2045	fbmy8028_rel_221222.cza1_bee
100	2306	6	0.0	4.0	0.3	0.003	0.018	0.040	3.466	9585	12.8	4.157	444	1.5	1.8	8.5	0.010	2237	2045	fbmy8028_rel_221222.cza1ps0_bee
100	2442	0	0.0	4.1	0.4	0.000	0.000	0.041	4.056	10128	13.4	4.147	439	1.5	1.7	8.6	0.003	2413	2013	fbmy8028_rel_clang14_221222.cza1_bee
100	2521	0	0.0	4.2	0.4	0.000	0.000	0.042	4.262	10461	13.8	4.150	438	1.5	1.7	8.6	0.003	2463	2045	fbmy8028_rel_clang15_221222.cza1_bee
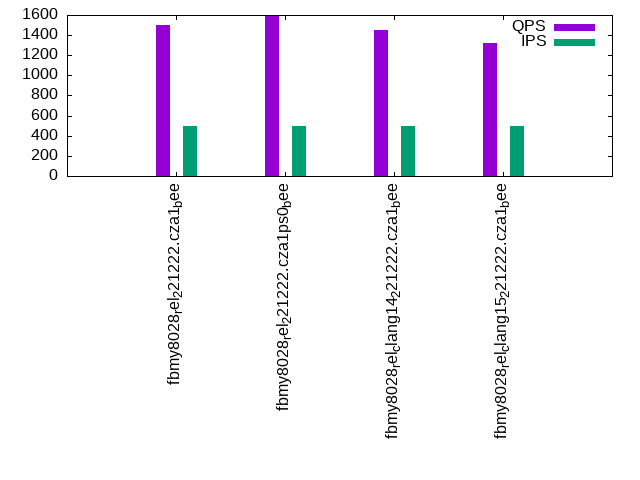
qr500.L3
qr500.L3: range queries with 500 insert/s per client. Graphs for performance per 1-second interval are here.
Average throughput:
Query response time histogram: each cell has the percentage of responses that take <= the time in the header and max is the max response time in seconds. For max values in the top 25% of the range have a red background and in the bottom 25% of the range have a green background. The red background is not used when the min value is within 80% of the max value.
| dbms | 256us | 1ms | 4ms | 16ms | 64ms | 256ms | 1s | 4s | 16s | gt | max |
|---|---|---|---|---|---|---|---|---|---|---|---|
| fbmy8028_rel_221222.cza1_bee | 6.189 | 69.258 | 24.553 | nonzero | nonzero | 0.031 | |||||
| fbmy8028_rel_221222.cza1ps0_bee | 8.597 | 73.875 | 17.528 | nonzero | nonzero | 0.029 | |||||
| fbmy8028_rel_clang14_221222.cza1_bee | 5.857 | 74.522 | 19.621 | nonzero | nonzero | 0.031 | |||||
| fbmy8028_rel_clang15_221222.cza1_bee | 6.343 | 71.199 | 22.459 | nonzero | nonzero | 0.031 |
Insert response time histogram: each cell has the percentage of responses that take <= the time in the header and max is the max response time in seconds. For max values in the top 25% of the range have a red background and in the bottom 25% of the range have a green background. The red background is not used when the min value is within 80% of the max value.
| dbms | 256us | 1ms | 4ms | 16ms | 64ms | 256ms | 1s | 4s | 16s | gt | max |
|---|---|---|---|---|---|---|---|---|---|---|---|
| fbmy8028_rel_221222.cza1_bee | 99.422 | 0.517 | 0.061 | 0.018 | |||||||
| fbmy8028_rel_221222.cza1ps0_bee | 99.417 | 0.511 | 0.072 | 0.022 | |||||||
| fbmy8028_rel_clang14_221222.cza1_bee | 99.689 | 0.233 | 0.078 | 0.018 | |||||||
| fbmy8028_rel_clang15_221222.cza1_bee | 99.539 | 0.372 | 0.089 | 0.019 |
Delete response time histogram: each cell has the percentage of responses that take <= the time in the header and max is the max response time in seconds. For max values in the top 25% of the range have a red background and in the bottom 25% of the range have a green background. The red background is not used when the min value is within 80% of the max value.
| dbms | 256us | 1ms | 4ms | 16ms | 64ms | 256ms | 1s | 4s | 16s | gt | max |
|---|---|---|---|---|---|---|---|---|---|---|---|
| fbmy8028_rel_221222.cza1_bee | 99.461 | 0.483 | 0.056 | 0.018 | |||||||
| fbmy8028_rel_221222.cza1ps0_bee | 99.472 | 0.461 | 0.067 | 0.022 | |||||||
| fbmy8028_rel_clang14_221222.cza1_bee | 99.717 | 0.222 | 0.061 | 0.018 | |||||||
| fbmy8028_rel_clang15_221222.cza1_bee | 99.583 | 0.322 | 0.094 | 0.037 |
Performance metrics for the DBMS listed above. Some are normalized by throughput, others are not. Legend for results is here.
ips	qps	rps	rmbps	wps	wmbps	rpq	rkbpq	wpi	wkbpi	csps	cpups	cspq	cpupq	dbgb1	dbgb2	rss	maxop	p50	p99	tag
499	1498	0	0.0	9.0	2.4	0.000	0.000	0.018	4.968	6164	13.5	4.116	721	1.5	1.9	8.7	0.031	1486	1215	fbmy8028_rel_221222.cza1_bee
499	1594	0	0.0	8.7	2.3	0.000	0.000	0.018	4.724	6524	13.5	4.093	678	1.5	1.9	8.6	0.029	1567	1279	fbmy8028_rel_221222.cza1ps0_bee
499	1447	0	0.0	8.6	2.2	0.000	0.000	0.017	4.550	5963	13.4	4.120	741	1.5	2.0	8.7	0.031	1438	1183	fbmy8028_rel_clang14_221222.cza1_bee
499	1325	0	0.0	8.5	2.2	0.000	0.000	0.017	4.612	5500	13.5	4.151	815	1.5	2.0	8.8	0.031	1167	959	fbmy8028_rel_clang15_221222.cza1_bee
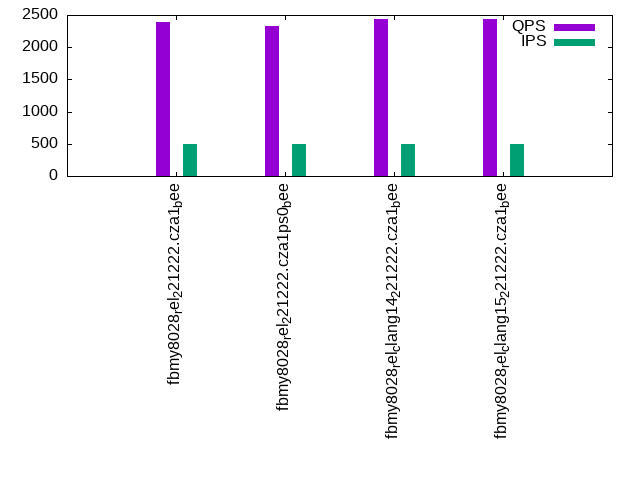
qp500.L4
qp500.L4: point queries with 500 insert/s per client. Graphs for performance per 1-second interval are here.
Average throughput:
Query response time histogram: each cell has the percentage of responses that take <= the time in the header and max is the max response time in seconds. For max values in the top 25% of the range have a red background and in the bottom 25% of the range have a green background. The red background is not used when the min value is within 80% of the max value.
| dbms | 256us | 1ms | 4ms | 16ms | 64ms | 256ms | 1s | 4s | 16s | gt | max |
|---|---|---|---|---|---|---|---|---|---|---|---|
| fbmy8028_rel_221222.cza1_bee | 99.994 | 0.006 | nonzero | 0.005 | |||||||
| fbmy8028_rel_221222.cza1ps0_bee | 0.015 | 99.979 | 0.006 | nonzero | 0.005 | ||||||
| fbmy8028_rel_clang14_221222.cza1_bee | 0.001 | 99.994 | 0.005 | nonzero | 0.005 | ||||||
| fbmy8028_rel_clang15_221222.cza1_bee | 99.994 | 0.006 | nonzero | 0.006 |
Insert response time histogram: each cell has the percentage of responses that take <= the time in the header and max is the max response time in seconds. For max values in the top 25% of the range have a red background and in the bottom 25% of the range have a green background. The red background is not used when the min value is within 80% of the max value.
| dbms | 256us | 1ms | 4ms | 16ms | 64ms | 256ms | 1s | 4s | 16s | gt | max |
|---|---|---|---|---|---|---|---|---|---|---|---|
| fbmy8028_rel_221222.cza1_bee | 99.528 | 0.383 | 0.089 | 0.018 | |||||||
| fbmy8028_rel_221222.cza1ps0_bee | 99.550 | 0.367 | 0.083 | 0.018 | |||||||
| fbmy8028_rel_clang14_221222.cza1_bee | 99.311 | 0.622 | 0.067 | 0.018 | |||||||
| fbmy8028_rel_clang15_221222.cza1_bee | 99.539 | 0.378 | 0.083 | 0.018 |
Delete response time histogram: each cell has the percentage of responses that take <= the time in the header and max is the max response time in seconds. For max values in the top 25% of the range have a red background and in the bottom 25% of the range have a green background. The red background is not used when the min value is within 80% of the max value.
| dbms | 256us | 1ms | 4ms | 16ms | 64ms | 256ms | 1s | 4s | 16s | gt | max |
|---|---|---|---|---|---|---|---|---|---|---|---|
| fbmy8028_rel_221222.cza1_bee | 99.594 | 0.333 | 0.072 | 0.018 | |||||||
| fbmy8028_rel_221222.cza1ps0_bee | 99.628 | 0.306 | 0.067 | 0.018 | |||||||
| fbmy8028_rel_clang14_221222.cza1_bee | 99.378 | 0.556 | 0.067 | 0.018 | |||||||
| fbmy8028_rel_clang15_221222.cza1_bee | 99.556 | 0.372 | 0.072 | 0.018 |
Performance metrics for the DBMS listed above. Some are normalized by throughput, others are not. Legend for results is here.
ips	qps	rps	rmbps	wps	wmbps	rpq	rkbpq	wpi	wkbpi	csps	cpups	cspq	cpupq	dbgb1	dbgb2	rss	maxop	p50	p99	tag
499	2393	0	0.0	8.1	2.1	0.000	0.000	0.016	4.379	10059	14.7	4.203	491	1.5	2.2	9.0	0.005	2366	2014	fbmy8028_rel_221222.cza1_bee
499	2336	0	0.0	8.0	2.2	0.000	0.000	0.016	4.427	9822	14.4	4.204	493	1.5	2.2	8.7	0.005	2253	2077	fbmy8028_rel_221222.cza1ps0_bee
499	2442	0	0.0	8.3	2.3	0.000	0.000	0.017	4.657	10277	14.7	4.208	481	1.5	2.1	9.0	0.005	2414	2014	fbmy8028_rel_clang14_221222.cza1_bee
499	2438	0	0.0	8.2	2.2	0.000	0.000	0.016	4.601	10236	15.0	4.198	492	1.5	2.1	9.0	0.006	2413	1997	fbmy8028_rel_clang15_221222.cza1_bee
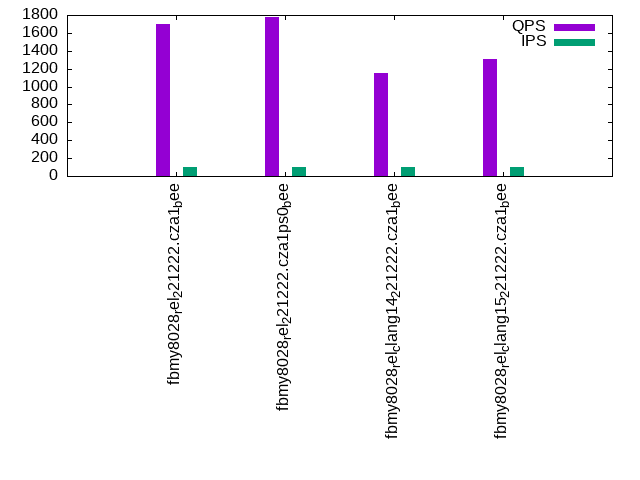
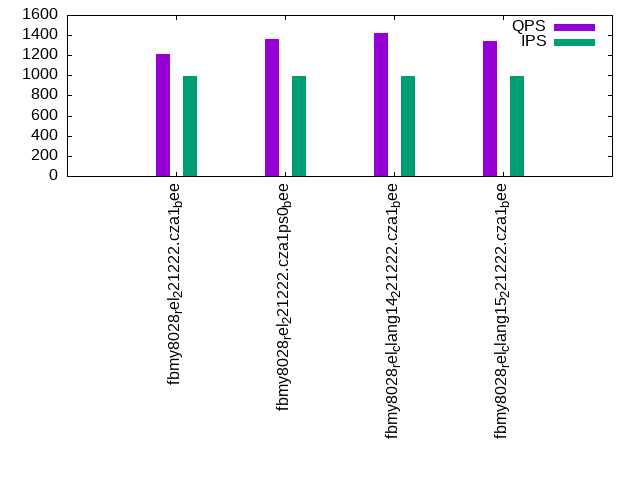
qr1000.L5
qr1000.L5: range queries with 1000 insert/s per client. Graphs for performance per 1-second interval are here.
Average throughput:
Query response time histogram: each cell has the percentage of responses that take <= the time in the header and max is the max response time in seconds. For max values in the top 25% of the range have a red background and in the bottom 25% of the range have a green background. The red background is not used when the min value is within 80% of the max value.
| dbms | 256us | 1ms | 4ms | 16ms | 64ms | 256ms | 1s | 4s | 16s | gt | max |
|---|---|---|---|---|---|---|---|---|---|---|---|
| fbmy8028_rel_221222.cza1_bee | 4.717 | 69.575 | 25.696 | 0.011 | 0.001 | 0.042 | |||||
| fbmy8028_rel_221222.cza1ps0_bee | 8.159 | 71.674 | 20.160 | 0.006 | nonzero | 0.032 | |||||
| fbmy8028_rel_clang14_221222.cza1_bee | 5.139 | 73.726 | 21.134 | nonzero | nonzero | 0.031 | |||||
| fbmy8028_rel_clang15_221222.cza1_bee | 5.378 | 69.185 | 25.436 | nonzero | 0.001 | 0.030 |
Insert response time histogram: each cell has the percentage of responses that take <= the time in the header and max is the max response time in seconds. For max values in the top 25% of the range have a red background and in the bottom 25% of the range have a green background. The red background is not used when the min value is within 80% of the max value.
| dbms | 256us | 1ms | 4ms | 16ms | 64ms | 256ms | 1s | 4s | 16s | gt | max |
|---|---|---|---|---|---|---|---|---|---|---|---|
| fbmy8028_rel_221222.cza1_bee | 99.689 | 0.231 | 0.081 | 0.062 | |||||||
| fbmy8028_rel_221222.cza1ps0_bee | 99.753 | 0.164 | 0.083 | 0.048 | |||||||
| fbmy8028_rel_clang14_221222.cza1_bee | 99.578 | 0.339 | 0.083 | 0.049 | |||||||
| fbmy8028_rel_clang15_221222.cza1_bee | 99.572 | 0.347 | 0.081 | 0.049 |
Delete response time histogram: each cell has the percentage of responses that take <= the time in the header and max is the max response time in seconds. For max values in the top 25% of the range have a red background and in the bottom 25% of the range have a green background. The red background is not used when the min value is within 80% of the max value.
| dbms | 256us | 1ms | 4ms | 16ms | 64ms | 256ms | 1s | 4s | 16s | gt | max |
|---|---|---|---|---|---|---|---|---|---|---|---|
| fbmy8028_rel_221222.cza1_bee | 99.717 | 0.203 | 0.081 | 0.049 | |||||||
| fbmy8028_rel_221222.cza1ps0_bee | 99.783 | 0.139 | 0.078 | 0.063 | |||||||
| fbmy8028_rel_clang14_221222.cza1_bee | 99.600 | 0.317 | 0.083 | 0.064 | |||||||
| fbmy8028_rel_clang15_221222.cza1_bee | 99.603 | 0.322 | 0.075 | 0.063 |
Performance metrics for the DBMS listed above. Some are normalized by throughput, others are not. Legend for results is here.
ips	qps	rps	rmbps	wps	wmbps	rpq	rkbpq	wpi	wkbpi	csps	cpups	cspq	cpupq	dbgb1	dbgb2	rss	maxop	p50	p99	tag
998	1212	29	0.2	14.2	4.6	0.024	0.154	0.014	4.725	5345	15.3	4.411	1010	1.5	2.6	9.1	0.042	1199	895	fbmy8028_rel_221222.cza1_bee
998	1366	3	0.0	13.6	4.6	0.002	0.012	0.014	4.712	5876	15.3	4.302	896	1.5	2.6	8.8	0.032	1374	879	fbmy8028_rel_221222.cza1ps0_bee
998	1423	6	0.0	13.7	4.5	0.004	0.025	0.014	4.669	6115	15.4	4.299	866	1.5	2.6	9.0	0.031	1374	1039	fbmy8028_rel_clang14_221222.cza1_bee
998	1337	4	0.0	13.8	4.6	0.003	0.020	0.014	4.733	5786	15.3	4.327	915	1.5	2.6	9.0	0.030	1341	1007	fbmy8028_rel_clang15_221222.cza1_bee
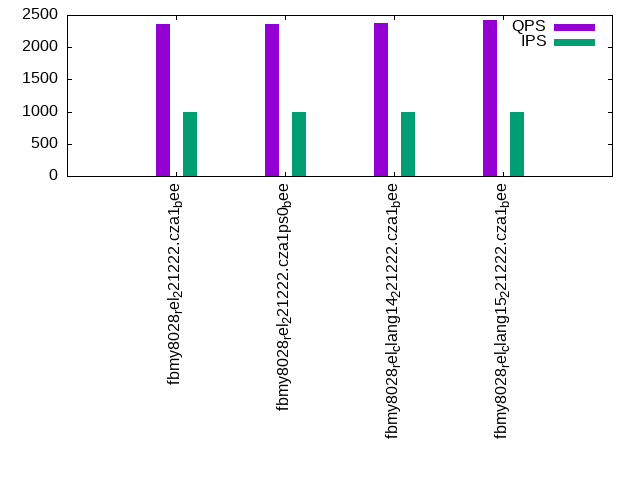
qp1000.L6
qp1000.L6: point queries with 1000 insert/s per client. Graphs for performance per 1-second interval are here.
Average throughput:
Query response time histogram: each cell has the percentage of responses that take <= the time in the header and max is the max response time in seconds. For max values in the top 25% of the range have a red background and in the bottom 25% of the range have a green background. The red background is not used when the min value is within 80% of the max value.
| dbms | 256us | 1ms | 4ms | 16ms | 64ms | 256ms | 1s | 4s | 16s | gt | max |
|---|---|---|---|---|---|---|---|---|---|---|---|
| fbmy8028_rel_221222.cza1_bee | 0.001 | 99.989 | 0.009 | nonzero | 0.005 | ||||||
| fbmy8028_rel_221222.cza1ps0_bee | 0.029 | 99.964 | 0.007 | 0.003 | |||||||
| fbmy8028_rel_clang14_221222.cza1_bee | 99.993 | 0.007 | nonzero | 0.005 | |||||||
| fbmy8028_rel_clang15_221222.cza1_bee | 99.991 | 0.009 | 0.004 |
Insert response time histogram: each cell has the percentage of responses that take <= the time in the header and max is the max response time in seconds. For max values in the top 25% of the range have a red background and in the bottom 25% of the range have a green background. The red background is not used when the min value is within 80% of the max value.
| dbms | 256us | 1ms | 4ms | 16ms | 64ms | 256ms | 1s | 4s | 16s | gt | max |
|---|---|---|---|---|---|---|---|---|---|---|---|
| fbmy8028_rel_221222.cza1_bee | 99.547 | 0.375 | 0.078 | 0.063 | |||||||
| fbmy8028_rel_221222.cza1ps0_bee | 99.572 | 0.344 | 0.083 | 0.049 | |||||||
| fbmy8028_rel_clang14_221222.cza1_bee | 99.586 | 0.331 | 0.083 | 0.049 | |||||||
| fbmy8028_rel_clang15_221222.cza1_bee | 99.422 | 0.503 | 0.075 | 0.049 |
Delete response time histogram: each cell has the percentage of responses that take <= the time in the header and max is the max response time in seconds. For max values in the top 25% of the range have a red background and in the bottom 25% of the range have a green background. The red background is not used when the min value is within 80% of the max value.
| dbms | 256us | 1ms | 4ms | 16ms | 64ms | 256ms | 1s | 4s | 16s | gt | max |
|---|---|---|---|---|---|---|---|---|---|---|---|
| fbmy8028_rel_221222.cza1_bee | 99.578 | 0.342 | 0.081 | 0.049 | |||||||
| fbmy8028_rel_221222.cza1ps0_bee | 99.617 | 0.306 | 0.075 | 0.003 | 0.067 | ||||||
| fbmy8028_rel_clang14_221222.cza1_bee | 99.603 | 0.314 | 0.083 | 0.063 | |||||||
| fbmy8028_rel_clang15_221222.cza1_bee | 99.481 | 0.450 | 0.069 | 0.063 |
Performance metrics for the DBMS listed above. Some are normalized by throughput, others are not. Legend for results is here.
ips	qps	rps	rmbps	wps	wmbps	rpq	rkbpq	wpi	wkbpi	csps	cpups	cspq	cpupq	dbgb1	dbgb2	rss	maxop	p50	p99	tag
998	2358	28	0.2	13.5	4.4	0.012	0.067	0.013	4.503	10186	16.5	4.319	560	1.5	3.0	9.4	0.005	2348	1981	fbmy8028_rel_221222.cza1_bee
998	2368	24	0.1	13.4	4.4	0.010	0.059	0.013	4.539	10223	16.2	4.317	547	1.5	2.9	9.0	0.003	2269	2078	fbmy8028_rel_221222.cza1ps0_bee
998	2380	23	0.1	13.8	4.5	0.010	0.056	0.014	4.586	10274	16.4	4.317	551	1.5	3.0	9.3	0.005	2365	1966	fbmy8028_rel_clang14_221222.cza1_bee
998	2428	21	0.1	13.3	4.4	0.009	0.049	0.013	4.491	10468	16.4	4.311	540	1.5	3.0	9.3	0.004	2400	1998	fbmy8028_rel_clang15_221222.cza1_bee
l.i0
l.i0: load without secondary indexes
Performance metrics for all DBMS, not just the ones listed above. Some are normalized by throughput, others are not. Legend for results is here.
ips	qps	rps	rmbps	wps	wmbps	rpq	rkbpq	wpi	wkbpi	csps	cpups	cspq	cpupq	dbgb1	dbgb2	rss	maxop	p50	p99	tag
57803	0	0	0.0	34.6	11.1	0.000	0.000	0.001	0.196	5985	22.0	0.104	30	0.7	1.9	0.6	0.077	58042	52741	fbmy8028_rel_221222.cza1_bee
59701	0	0	0.0	35.9	11.4	0.000	0.000	0.001	0.196	6155	22.3	0.103	30	0.7	1.9	0.4	0.076	59934	53443	fbmy8028_rel_221222.cza1ps0_bee
58140	0	0	0.0	34.7	11.0	0.000	0.000	0.001	0.195	6034	22.1	0.104	30	0.7	1.9	0.6	0.081	58435	52742	fbmy8028_rel_clang14_221222.cza1_bee
58824	0	0	0.0	35.1	11.2	0.000	0.000	0.001	0.196	6108	22.5	0.104	31	0.7	1.9	0.6	0.070	59231	53160	fbmy8028_rel_clang15_221222.cza1_bee
l.x
l.x: create secondary indexes
Performance metrics for all DBMS, not just the ones listed above. Some are normalized by throughput, others are not. Legend for results is here.
ips	qps	rps	rmbps	wps	wmbps	rpq	rkbpq	wpi	wkbpi	csps	cpups	cspq	cpupq	dbgb1	dbgb2	rss	maxop	p50	p99	tag
78432	0	0	0.0	30.5	12.1	0.000	0.000	0.000	0.158	351	11.8	0.004	12	1.4	2.6	2.0	0.003	NA	NA	fbmy8028_rel_221222.cza1_bee
79682	0	0	0.0	31.5	12.4	0.000	0.000	0.000	0.159	344	11.8	0.004	12	1.4	2.6	1.8	0.004	NA	NA	fbmy8028_rel_221222.cza1ps0_bee
70672	0	0	0.0	27.8	10.9	0.000	0.000	0.000	0.158	372	11.8	0.005	13	1.4	2.6	2.0	0.003	NA	NA	fbmy8028_rel_clang14_221222.cza1_bee
71429	0	0	0.0	27.8	10.9	0.000	0.000	0.000	0.157	342	11.9	0.005	13	1.4	2.6	2.0	0.003	NA	NA	fbmy8028_rel_clang15_221222.cza1_bee
l.i1
l.i1: continue load after secondary indexes created with 50 inserts per transaction
Performance metrics for all DBMS, not just the ones listed above. Some are normalized by throughput, others are not. Legend for results is here.
ips	qps	rps	rmbps	wps	wmbps	rpq	rkbpq	wpi	wkbpi	csps	cpups	cspq	cpupq	dbgb1	dbgb2	rss	maxop	p50	p99	tag
22896	0	76	0.4	111.8	42.5	0.003	0.019	0.005	1.899	10203	46.1	0.446	161	1.9	4.0	5.5	0.090	22874	20427	fbmy8028_rel_221222.cza1_bee
23460	0	78	0.4	111.2	42.4	0.003	0.019	0.005	1.851	10405	46.0	0.444	157	1.7	3.8	5.1	0.090	23394	20727	fbmy8028_rel_221222.cza1ps0_bee
23585	0	78	0.4	108.9	41.4	0.003	0.019	0.005	1.797	10397	46.2	0.441	157	1.7	3.8	5.2	0.100	23535	20877	fbmy8028_rel_clang14_221222.cza1_bee
23711	0	78	0.4	110.7	42.0	0.003	0.019	0.005	1.815	10484	46.3	0.442	156	1.8	3.9	5.3	0.087	23676	20828	fbmy8028_rel_clang15_221222.cza1_bee
l.i2
l.i2: continue load after secondary indexes created with 5 inserts per transaction
Performance metrics for all DBMS, not just the ones listed above. Some are normalized by throughput, others are not. Legend for results is here.
ips	qps	rps	rmbps	wps	wmbps	rpq	rkbpq	wpi	wkbpi	csps	cpups	cspq	cpupq	dbgb1	dbgb2	rss	maxop	p50	p99	tag
7968	0	0	0.0	99.3	35.9	0.000	0.000	0.012	4.608	33145	43.2	4.160	434	1.5	1.7	7.6	0.081	7929	7042	fbmy8028_rel_221222.cza1_bee
8326	0	0	0.0	102.8	37.8	0.000	0.000	0.012	4.653	34370	43.7	4.128	420	1.5	1.7	7.4	0.072	8266	7322	fbmy8028_rel_221222.cza1ps0_bee
8382	0	0	0.0	101.8	36.7	0.000	0.000	0.012	4.478	34477	43.8	4.113	418	1.5	1.7	7.4	0.073	8373	7201	fbmy8028_rel_clang14_221222.cza1_bee
8389	0	0	0.0	101.7	36.7	0.000	0.000	0.012	4.477	34516	43.9	4.114	419	1.6	1.8	7.4	0.109	8341	7357	fbmy8028_rel_clang15_221222.cza1_bee
qr100.L1
qr100.L1: range queries with 100 insert/s per client
Performance metrics for all DBMS, not just the ones listed above. Some are normalized by throughput, others are not. Legend for results is here.
ips	qps	rps	rmbps	wps	wmbps	rpq	rkbpq	wpi	wkbpi	csps	cpups	cspq	cpupq	dbgb1	dbgb2	rss	maxop	p50	p99	tag
100	1704	0	0.0	4.3	0.4	0.000	0.000	0.043	4.015	6794	12.6	3.987	591	1.5	1.7	7.9	0.018	1885	1167	fbmy8028_rel_221222.cza1_bee
100	1776	0	0.0	4.4	0.4	0.000	0.000	0.044	4.450	7060	12.5	3.974	563	1.5	1.7	7.6	0.027	1870	1214	fbmy8028_rel_221222.cza1ps0_bee
100	1146	0	0.0	4.1	0.3	0.000	0.000	0.041	3.456	4670	12.6	4.074	879	1.5	1.7	7.7	0.030	1151	1055	fbmy8028_rel_clang14_221222.cza1_bee
100	1309	0	0.0	4.1	0.4	0.000	0.000	0.041	3.677	5294	12.5	4.043	764	1.5	1.7	7.7	0.005	1311	1215	fbmy8028_rel_clang15_221222.cza1_bee
qp100.L2
qp100.L2: point queries with 100 insert/s per client
Performance metrics for all DBMS, not just the ones listed above. Some are normalized by throughput, others are not. Legend for results is here.
ips	qps	rps	rmbps	wps	wmbps	rpq	rkbpq	wpi	wkbpi	csps	cpups	cspq	cpupq	dbgb1	dbgb2	rss	maxop	p50	p99	tag
100	2480	23	0.1	4.1	0.3	0.009	0.058	0.041	3.476	10320	13.2	4.161	426	1.5	1.8	8.6	0.010	2446	2045	fbmy8028_rel_221222.cza1_bee
100	2306	6	0.0	4.0	0.3	0.003	0.018	0.040	3.466	9585	12.8	4.157	444	1.5	1.8	8.5	0.010	2237	2045	fbmy8028_rel_221222.cza1ps0_bee
100	2442	0	0.0	4.1	0.4	0.000	0.000	0.041	4.056	10128	13.4	4.147	439	1.5	1.7	8.6	0.003	2413	2013	fbmy8028_rel_clang14_221222.cza1_bee
100	2521	0	0.0	4.2	0.4	0.000	0.000	0.042	4.262	10461	13.8	4.150	438	1.5	1.7	8.6	0.003	2463	2045	fbmy8028_rel_clang15_221222.cza1_bee
qr500.L3
qr500.L3: range queries with 500 insert/s per client
Performance metrics for all DBMS, not just the ones listed above. Some are normalized by throughput, others are not. Legend for results is here.
ips	qps	rps	rmbps	wps	wmbps	rpq	rkbpq	wpi	wkbpi	csps	cpups	cspq	cpupq	dbgb1	dbgb2	rss	maxop	p50	p99	tag
499	1498	0	0.0	9.0	2.4	0.000	0.000	0.018	4.968	6164	13.5	4.116	721	1.5	1.9	8.7	0.031	1486	1215	fbmy8028_rel_221222.cza1_bee
499	1594	0	0.0	8.7	2.3	0.000	0.000	0.018	4.724	6524	13.5	4.093	678	1.5	1.9	8.6	0.029	1567	1279	fbmy8028_rel_221222.cza1ps0_bee
499	1447	0	0.0	8.6	2.2	0.000	0.000	0.017	4.550	5963	13.4	4.120	741	1.5	2.0	8.7	0.031	1438	1183	fbmy8028_rel_clang14_221222.cza1_bee
499	1325	0	0.0	8.5	2.2	0.000	0.000	0.017	4.612	5500	13.5	4.151	815	1.5	2.0	8.8	0.031	1167	959	fbmy8028_rel_clang15_221222.cza1_bee
qp500.L4
qp500.L4: point queries with 500 insert/s per client
Performance metrics for all DBMS, not just the ones listed above. Some are normalized by throughput, others are not. Legend for results is here.
ips	qps	rps	rmbps	wps	wmbps	rpq	rkbpq	wpi	wkbpi	csps	cpups	cspq	cpupq	dbgb1	dbgb2	rss	maxop	p50	p99	tag
499	2393	0	0.0	8.1	2.1	0.000	0.000	0.016	4.379	10059	14.7	4.203	491	1.5	2.2	9.0	0.005	2366	2014	fbmy8028_rel_221222.cza1_bee
499	2336	0	0.0	8.0	2.2	0.000	0.000	0.016	4.427	9822	14.4	4.204	493	1.5	2.2	8.7	0.005	2253	2077	fbmy8028_rel_221222.cza1ps0_bee
499	2442	0	0.0	8.3	2.3	0.000	0.000	0.017	4.657	10277	14.7	4.208	481	1.5	2.1	9.0	0.005	2414	2014	fbmy8028_rel_clang14_221222.cza1_bee
499	2438	0	0.0	8.2	2.2	0.000	0.000	0.016	4.601	10236	15.0	4.198	492	1.5	2.1	9.0	0.006	2413	1997	fbmy8028_rel_clang15_221222.cza1_bee
qr1000.L5
qr1000.L5: range queries with 1000 insert/s per client
Performance metrics for all DBMS, not just the ones listed above. Some are normalized by throughput, others are not. Legend for results is here.
ips	qps	rps	rmbps	wps	wmbps	rpq	rkbpq	wpi	wkbpi	csps	cpups	cspq	cpupq	dbgb1	dbgb2	rss	maxop	p50	p99	tag
998	1212	29	0.2	14.2	4.6	0.024	0.154	0.014	4.725	5345	15.3	4.411	1010	1.5	2.6	9.1	0.042	1199	895	fbmy8028_rel_221222.cza1_bee
998	1366	3	0.0	13.6	4.6	0.002	0.012	0.014	4.712	5876	15.3	4.302	896	1.5	2.6	8.8	0.032	1374	879	fbmy8028_rel_221222.cza1ps0_bee
998	1423	6	0.0	13.7	4.5	0.004	0.025	0.014	4.669	6115	15.4	4.299	866	1.5	2.6	9.0	0.031	1374	1039	fbmy8028_rel_clang14_221222.cza1_bee
998	1337	4	0.0	13.8	4.6	0.003	0.020	0.014	4.733	5786	15.3	4.327	915	1.5	2.6	9.0	0.030	1341	1007	fbmy8028_rel_clang15_221222.cza1_bee
qp1000.L6
qp1000.L6: point queries with 1000 insert/s per client
Performance metrics for all DBMS, not just the ones listed above. Some are normalized by throughput, others are not. Legend for results is here.
ips	qps	rps	rmbps	wps	wmbps	rpq	rkbpq	wpi	wkbpi	csps	cpups	cspq	cpupq	dbgb1	dbgb2	rss	maxop	p50	p99	tag
998	2358	28	0.2	13.5	4.4	0.012	0.067	0.013	4.503	10186	16.5	4.319	560	1.5	3.0	9.4	0.005	2348	1981	fbmy8028_rel_221222.cza1_bee
998	2368	24	0.1	13.4	4.4	0.010	0.059	0.013	4.539	10223	16.2	4.317	547	1.5	2.9	9.0	0.003	2269	2078	fbmy8028_rel_221222.cza1ps0_bee
998	2380	23	0.1	13.8	4.5	0.010	0.056	0.014	4.586	10274	16.4	4.317	551	1.5	3.0	9.3	0.005	2365	1966	fbmy8028_rel_clang14_221222.cza1_bee
998	2428	21	0.1	13.3	4.4	0.009	0.049	0.013	4.491	10468	16.4	4.311	540	1.5	3.0	9.3	0.004	2400	1998	fbmy8028_rel_clang15_221222.cza1_bee
l.i0
- l.i0: load without secondary indexes
- Legend for results is here.
- Each entry lists the percentage of responses that fit in that bucket (slower than max time for previous bucket, faster than min time for next bucket).
Insert response time histogram
256us	1ms	4ms	16ms	64ms	256ms	1s	4s	16s	gt	max	tag
0.000	0.000	99.723	0.200	0.074	0.003	0.000	0.000	0.000	0.000	0.077	fbmy8028_rel_221222.cza1_bee
0.000	0.000	99.729	0.193	0.076	0.003	0.000	0.000	0.000	0.000	0.076	fbmy8028_rel_221222.cza1ps0_bee
0.000	0.000	99.725	0.199	0.073	0.003	0.000	0.000	0.000	0.000	0.081	fbmy8028_rel_clang14_221222.cza1_bee
0.000	0.000	99.728	0.201	0.068	0.002	0.000	0.000	0.000	0.000	0.070	fbmy8028_rel_clang15_221222.cza1_bee
l.x
- l.x: create secondary indexes
- Legend for results is here.
- Each entry lists the percentage of responses that fit in that bucket (slower than max time for previous bucket, faster than min time for next bucket).
TODO - determine whether there is data for create index response time
l.i1
- l.i1: continue load after secondary indexes created with 50 inserts per transaction
- Legend for results is here.
- Each entry lists the percentage of responses that fit in that bucket (slower than max time for previous bucket, faster than min time for next bucket).
Insert response time histogram
256us	1ms	4ms	16ms	64ms	256ms	1s	4s	16s	gt	max	tag
0.000	0.000	99.671	0.254	0.072	0.003	0.000	0.000	0.000	0.000	0.090	fbmy8028_rel_221222.cza1_bee
0.000	0.000	99.675	0.251	0.070	0.003	0.000	0.000	0.000	0.000	0.090	fbmy8028_rel_221222.cza1ps0_bee
0.000	0.000	99.678	0.252	0.067	0.004	0.000	0.000	0.000	0.000	0.100	fbmy8028_rel_clang14_221222.cza1_bee
0.000	0.000	99.679	0.249	0.068	0.003	0.000	0.000	0.000	0.000	0.087	fbmy8028_rel_clang15_221222.cza1_bee
Delete response time histogram
256us	1ms	4ms	16ms	64ms	256ms	1s	4s	16s	gt	max	tag
0.000	0.000	99.662	0.255	0.080	0.003	0.000	0.000	0.000	0.000	0.095	fbmy8028_rel_221222.cza1_bee
0.000	0.000	99.667	0.251	0.079	0.003	0.000	0.000	0.000	0.000	0.088	fbmy8028_rel_221222.cza1ps0_bee
0.000	0.000	99.669	0.254	0.075	0.003	0.000	0.000	0.000	0.000	0.093	fbmy8028_rel_clang14_221222.cza1_bee
0.000	0.000	99.669	0.252	0.077	0.003	0.000	0.000	0.000	0.000	0.094	fbmy8028_rel_clang15_221222.cza1_bee
l.i2
- l.i2: continue load after secondary indexes created with 5 inserts per transaction
- Legend for results is here.
- Each entry lists the percentage of responses that fit in that bucket (slower than max time for previous bucket, faster than min time for next bucket).
Insert response time histogram
256us	1ms	4ms	16ms	64ms	256ms	1s	4s	16s	gt	max	tag
0.000	99.834	0.082	0.080	0.003	nonzero	0.000	0.000	0.000	0.000	0.081	fbmy8028_rel_221222.cza1_bee
0.000	99.860	0.059	0.078	0.003	nonzero	0.000	0.000	0.000	0.000	0.072	fbmy8028_rel_221222.cza1ps0_bee
0.000	99.871	0.048	0.077	0.003	nonzero	0.000	0.000	0.000	0.000	0.073	fbmy8028_rel_clang14_221222.cza1_bee
0.000	99.870	0.050	0.077	0.003	nonzero	0.000	0.000	0.000	0.000	0.109	fbmy8028_rel_clang15_221222.cza1_bee
Delete response time histogram
256us	1ms	4ms	16ms	64ms	256ms	1s	4s	16s	gt	max	tag
0.000	99.796	0.119	0.081	0.003	nonzero	0.000	0.000	0.000	0.000	0.077	fbmy8028_rel_221222.cza1_bee
0.000	99.842	0.076	0.079	0.003	nonzero	0.000	0.000	0.000	0.000	0.081	fbmy8028_rel_221222.cza1ps0_bee
0.000	99.843	0.075	0.078	0.003	nonzero	0.000	0.000	0.000	0.000	0.083	fbmy8028_rel_clang14_221222.cza1_bee
0.000	99.836	0.082	0.078	0.004	nonzero	0.000	0.000	0.000	0.000	0.089	fbmy8028_rel_clang15_221222.cza1_bee
qr100.L1
- qr100.L1: range queries with 100 insert/s per client
- Legend for results is here.
- Each entry lists the percentage of responses that fit in that bucket (slower than max time for previous bucket, faster than min time for next bucket).
Query response time histogram
256us	1ms	4ms	16ms	64ms	256ms	1s	4s	16s	gt	max	tag
9.647	81.277	9.075	0.001	nonzero	0.000	0.000	0.000	0.000	0.000	0.018	fbmy8028_rel_221222.cza1_bee
10.774	73.695	15.531	0.000	nonzero	0.000	0.000	0.000	0.000	0.000	0.027	fbmy8028_rel_221222.cza1ps0_bee
3.472	66.398	30.130	nonzero	nonzero	0.000	0.000	0.000	0.000	0.000	0.030	fbmy8028_rel_clang14_221222.cza1_bee
4.708	62.000	33.292	nonzero	0.000	0.000	0.000	0.000	0.000	0.000	0.005	fbmy8028_rel_clang15_221222.cza1_bee
Insert response time histogram
256us	1ms	4ms	16ms	64ms	256ms	1s	4s	16s	gt	max	tag
0.000	0.000	99.444	0.500	0.056	0.000	0.000	0.000	0.000	0.000	0.018	fbmy8028_rel_221222.cza1_bee
0.000	0.000	99.361	0.583	0.056	0.000	0.000	0.000	0.000	0.000	0.018	fbmy8028_rel_221222.cza1ps0_bee
0.000	0.000	99.889	0.056	0.056	0.000	0.000	0.000	0.000	0.000	0.017	fbmy8028_rel_clang14_221222.cza1_bee
0.000	0.000	99.694	0.250	0.056	0.000	0.000	0.000	0.000	0.000	0.018	fbmy8028_rel_clang15_221222.cza1_bee
Delete response time histogram
256us	1ms	4ms	16ms	64ms	256ms	1s	4s	16s	gt	max	tag
0.000	0.000	99.556	0.389	0.056	0.000	0.000	0.000	0.000	0.000	0.018	fbmy8028_rel_221222.cza1_bee
0.000	0.000	99.528	0.444	0.028	0.000	0.000	0.000	0.000	0.000	0.017	fbmy8028_rel_221222.cza1ps0_bee
0.000	0.000	99.944	0.028	0.028	0.000	0.000	0.000	0.000	0.000	0.017	fbmy8028_rel_clang14_221222.cza1_bee
0.000	0.000	99.750	0.222	0.028	0.000	0.000	0.000	0.000	0.000	0.018	fbmy8028_rel_clang15_221222.cza1_bee
qp100.L2
- qp100.L2: point queries with 100 insert/s per client
- Legend for results is here.
- Each entry lists the percentage of responses that fit in that bucket (slower than max time for previous bucket, faster than min time for next bucket).
Query response time histogram
256us	1ms	4ms	16ms	64ms	256ms	1s	4s	16s	gt	max	tag
nonzero	99.986	0.013	0.001	0.000	0.000	0.000	0.000	0.000	0.000	0.010	fbmy8028_rel_221222.cza1_bee
0.004	99.991	0.004	0.001	0.000	0.000	0.000	0.000	0.000	0.000	0.010	fbmy8028_rel_221222.cza1ps0_bee
0.000	99.996	0.004	0.000	0.000	0.000	0.000	0.000	0.000	0.000	0.003	fbmy8028_rel_clang14_221222.cza1_bee
0.000	99.997	0.003	0.000	0.000	0.000	0.000	0.000	0.000	0.000	0.003	fbmy8028_rel_clang15_221222.cza1_bee
Insert response time histogram
256us	1ms	4ms	16ms	64ms	256ms	1s	4s	16s	gt	max	tag
0.000	0.000	99.611	0.333	0.056	0.000	0.000	0.000	0.000	0.000	0.018	fbmy8028_rel_221222.cza1_bee
0.000	0.000	99.417	0.500	0.083	0.000	0.000	0.000	0.000	0.000	0.018	fbmy8028_rel_221222.cza1ps0_bee
0.000	0.000	99.611	0.333	0.056	0.000	0.000	0.000	0.000	0.000	0.017	fbmy8028_rel_clang14_221222.cza1_bee
0.000	0.000	99.778	0.167	0.056	0.000	0.000	0.000	0.000	0.000	0.018	fbmy8028_rel_clang15_221222.cza1_bee
Delete response time histogram
256us	1ms	4ms	16ms	64ms	256ms	1s	4s	16s	gt	max	tag
0.000	0.000	99.750	0.194	0.056	0.000	0.000	0.000	0.000	0.000	0.018	fbmy8028_rel_221222.cza1_bee
0.000	0.000	99.528	0.389	0.083	0.000	0.000	0.000	0.000	0.000	0.017	fbmy8028_rel_221222.cza1ps0_bee
0.000	0.000	99.583	0.361	0.056	0.000	0.000	0.000	0.000	0.000	0.017	fbmy8028_rel_clang14_221222.cza1_bee
0.000	0.000	99.778	0.167	0.056	0.000	0.000	0.000	0.000	0.000	0.018	fbmy8028_rel_clang15_221222.cza1_bee
qr500.L3
- qr500.L3: range queries with 500 insert/s per client
- Legend for results is here.
- Each entry lists the percentage of responses that fit in that bucket (slower than max time for previous bucket, faster than min time for next bucket).
Query response time histogram
256us	1ms	4ms	16ms	64ms	256ms	1s	4s	16s	gt	max	tag
6.189	69.258	24.553	nonzero	nonzero	0.000	0.000	0.000	0.000	0.000	0.031	fbmy8028_rel_221222.cza1_bee
8.597	73.875	17.528	nonzero	nonzero	0.000	0.000	0.000	0.000	0.000	0.029	fbmy8028_rel_221222.cza1ps0_bee
5.857	74.522	19.621	nonzero	nonzero	0.000	0.000	0.000	0.000	0.000	0.031	fbmy8028_rel_clang14_221222.cza1_bee
6.343	71.199	22.459	nonzero	nonzero	0.000	0.000	0.000	0.000	0.000	0.031	fbmy8028_rel_clang15_221222.cza1_bee
Insert response time histogram
256us	1ms	4ms	16ms	64ms	256ms	1s	4s	16s	gt	max	tag
0.000	0.000	99.422	0.517	0.061	0.000	0.000	0.000	0.000	0.000	0.018	fbmy8028_rel_221222.cza1_bee
0.000	0.000	99.417	0.511	0.072	0.000	0.000	0.000	0.000	0.000	0.022	fbmy8028_rel_221222.cza1ps0_bee
0.000	0.000	99.689	0.233	0.078	0.000	0.000	0.000	0.000	0.000	0.018	fbmy8028_rel_clang14_221222.cza1_bee
0.000	0.000	99.539	0.372	0.089	0.000	0.000	0.000	0.000	0.000	0.019	fbmy8028_rel_clang15_221222.cza1_bee
Delete response time histogram
256us	1ms	4ms	16ms	64ms	256ms	1s	4s	16s	gt	max	tag
0.000	0.000	99.461	0.483	0.056	0.000	0.000	0.000	0.000	0.000	0.018	fbmy8028_rel_221222.cza1_bee
0.000	0.000	99.472	0.461	0.067	0.000	0.000	0.000	0.000	0.000	0.022	fbmy8028_rel_221222.cza1ps0_bee
0.000	0.000	99.717	0.222	0.061	0.000	0.000	0.000	0.000	0.000	0.018	fbmy8028_rel_clang14_221222.cza1_bee
0.000	0.000	99.583	0.322	0.094	0.000	0.000	0.000	0.000	0.000	0.037	fbmy8028_rel_clang15_221222.cza1_bee
qp500.L4
- qp500.L4: point queries with 500 insert/s per client
- Legend for results is here.
- Each entry lists the percentage of responses that fit in that bucket (slower than max time for previous bucket, faster than min time for next bucket).
Query response time histogram
256us	1ms	4ms	16ms	64ms	256ms	1s	4s	16s	gt	max	tag
0.000	99.994	0.006	nonzero	0.000	0.000	0.000	0.000	0.000	0.000	0.005	fbmy8028_rel_221222.cza1_bee
0.015	99.979	0.006	nonzero	0.000	0.000	0.000	0.000	0.000	0.000	0.005	fbmy8028_rel_221222.cza1ps0_bee
0.001	99.994	0.005	nonzero	0.000	0.000	0.000	0.000	0.000	0.000	0.005	fbmy8028_rel_clang14_221222.cza1_bee
0.000	99.994	0.006	nonzero	0.000	0.000	0.000	0.000	0.000	0.000	0.006	fbmy8028_rel_clang15_221222.cza1_bee
Insert response time histogram
256us	1ms	4ms	16ms	64ms	256ms	1s	4s	16s	gt	max	tag
0.000	0.000	99.528	0.383	0.089	0.000	0.000	0.000	0.000	0.000	0.018	fbmy8028_rel_221222.cza1_bee
0.000	0.000	99.550	0.367	0.083	0.000	0.000	0.000	0.000	0.000	0.018	fbmy8028_rel_221222.cza1ps0_bee
0.000	0.000	99.311	0.622	0.067	0.000	0.000	0.000	0.000	0.000	0.018	fbmy8028_rel_clang14_221222.cza1_bee
0.000	0.000	99.539	0.378	0.083	0.000	0.000	0.000	0.000	0.000	0.018	fbmy8028_rel_clang15_221222.cza1_bee
Delete response time histogram
256us	1ms	4ms	16ms	64ms	256ms	1s	4s	16s	gt	max	tag
0.000	0.000	99.594	0.333	0.072	0.000	0.000	0.000	0.000	0.000	0.018	fbmy8028_rel_221222.cza1_bee
0.000	0.000	99.628	0.306	0.067	0.000	0.000	0.000	0.000	0.000	0.018	fbmy8028_rel_221222.cza1ps0_bee
0.000	0.000	99.378	0.556	0.067	0.000	0.000	0.000	0.000	0.000	0.018	fbmy8028_rel_clang14_221222.cza1_bee
0.000	0.000	99.556	0.372	0.072	0.000	0.000	0.000	0.000	0.000	0.018	fbmy8028_rel_clang15_221222.cza1_bee
qr1000.L5
- qr1000.L5: range queries with 1000 insert/s per client
- Legend for results is here.
- Each entry lists the percentage of responses that fit in that bucket (slower than max time for previous bucket, faster than min time for next bucket).
Query response time histogram
256us	1ms	4ms	16ms	64ms	256ms	1s	4s	16s	gt	max	tag
4.717	69.575	25.696	0.011	0.001	0.000	0.000	0.000	0.000	0.000	0.042	fbmy8028_rel_221222.cza1_bee
8.159	71.674	20.160	0.006	nonzero	0.000	0.000	0.000	0.000	0.000	0.032	fbmy8028_rel_221222.cza1ps0_bee
5.139	73.726	21.134	nonzero	nonzero	0.000	0.000	0.000	0.000	0.000	0.031	fbmy8028_rel_clang14_221222.cza1_bee
5.378	69.185	25.436	nonzero	0.001	0.000	0.000	0.000	0.000	0.000	0.030	fbmy8028_rel_clang15_221222.cza1_bee
Insert response time histogram
256us	1ms	4ms	16ms	64ms	256ms	1s	4s	16s	gt	max	tag
0.000	0.000	99.689	0.231	0.081	0.000	0.000	0.000	0.000	0.000	0.062	fbmy8028_rel_221222.cza1_bee
0.000	0.000	99.753	0.164	0.083	0.000	0.000	0.000	0.000	0.000	0.048	fbmy8028_rel_221222.cza1ps0_bee
0.000	0.000	99.578	0.339	0.083	0.000	0.000	0.000	0.000	0.000	0.049	fbmy8028_rel_clang14_221222.cza1_bee
0.000	0.000	99.572	0.347	0.081	0.000	0.000	0.000	0.000	0.000	0.049	fbmy8028_rel_clang15_221222.cza1_bee
Delete response time histogram
256us	1ms	4ms	16ms	64ms	256ms	1s	4s	16s	gt	max	tag
0.000	0.000	99.717	0.203	0.081	0.000	0.000	0.000	0.000	0.000	0.049	fbmy8028_rel_221222.cza1_bee
0.000	0.000	99.783	0.139	0.078	0.000	0.000	0.000	0.000	0.000	0.063	fbmy8028_rel_221222.cza1ps0_bee
0.000	0.000	99.600	0.317	0.083	0.000	0.000	0.000	0.000	0.000	0.064	fbmy8028_rel_clang14_221222.cza1_bee
0.000	0.000	99.603	0.322	0.075	0.000	0.000	0.000	0.000	0.000	0.063	fbmy8028_rel_clang15_221222.cza1_bee
qp1000.L6
- qp1000.L6: point queries with 1000 insert/s per client
- Legend for results is here.
- Each entry lists the percentage of responses that fit in that bucket (slower than max time for previous bucket, faster than min time for next bucket).
Query response time histogram
256us	1ms	4ms	16ms	64ms	256ms	1s	4s	16s	gt	max	tag
0.001	99.989	0.009	nonzero	0.000	0.000	0.000	0.000	0.000	0.000	0.005	fbmy8028_rel_221222.cza1_bee
0.029	99.964	0.007	0.000	0.000	0.000	0.000	0.000	0.000	0.000	0.003	fbmy8028_rel_221222.cza1ps0_bee
0.000	99.993	0.007	nonzero	0.000	0.000	0.000	0.000	0.000	0.000	0.005	fbmy8028_rel_clang14_221222.cza1_bee
0.000	99.991	0.009	0.000	0.000	0.000	0.000	0.000	0.000	0.000	0.004	fbmy8028_rel_clang15_221222.cza1_bee
Insert response time histogram
256us	1ms	4ms	16ms	64ms	256ms	1s	4s	16s	gt	max	tag
0.000	0.000	99.547	0.375	0.078	0.000	0.000	0.000	0.000	0.000	0.063	fbmy8028_rel_221222.cza1_bee
0.000	0.000	99.572	0.344	0.083	0.000	0.000	0.000	0.000	0.000	0.049	fbmy8028_rel_221222.cza1ps0_bee
0.000	0.000	99.586	0.331	0.083	0.000	0.000	0.000	0.000	0.000	0.049	fbmy8028_rel_clang14_221222.cza1_bee
0.000	0.000	99.422	0.503	0.075	0.000	0.000	0.000	0.000	0.000	0.049	fbmy8028_rel_clang15_221222.cza1_bee
Delete response time histogram
256us	1ms	4ms	16ms	64ms	256ms	1s	4s	16s	gt	max	tag
0.000	0.000	99.578	0.342	0.081	0.000	0.000	0.000	0.000	0.000	0.049	fbmy8028_rel_221222.cza1_bee
0.000	0.000	99.617	0.306	0.075	0.003	0.000	0.000	0.000	0.000	0.067	fbmy8028_rel_221222.cza1ps0_bee
0.000	0.000	99.603	0.314	0.083	0.000	0.000	0.000	0.000	0.000	0.063	fbmy8028_rel_clang14_221222.cza1_bee
0.000	0.000	99.481	0.450	0.069	0.000	0.000	0.000	0.000	0.000	0.063	fbmy8028_rel_clang15_221222.cza1_bee