Introduction
This is a report for the insert benchmark with 480M docs and 24 client(s). It is generated by scripts (bash, awk, sed) and Tufte might not be impressed. An overview of the insert benchmark is here and a short update is here. Below, by DBMS, I mean DBMS+version.config. An example is my8020.c10b40 where my means MySQL, 8020 is version 8.0.20 and c10b40 is the name for the configuration file.
The test server has 40 cores, 80 HW threads (hyperthreads enabled), 256G RAM and many TB of fast NVMe SSD with XFS and SW RAID 0. The benchmark was run with 24 clients and there were 1 or 3 connections per client (1 for queries or inserts without rate limits, 1+1 for rate limited inserts+deletes). It uses 1 table per client. It loads 20M rows per table without secondary indexes, creates 3 secondary indexes per table, then inserts 50m+50m rows per table with a delete per insert to avoid growing the table. It then does 6 read+write tests for 3600s each that do queries as fast as possible with 100,100,500,500,1000,1000 inserts/s and the same for deletes/s per client concurrent with the queries. The database is cached in memory. Clients and the DBMS share one server. The per-database configs are in the per-database subdirectories here.
The tested DBMS are:
- my5651_rel_native_lto.cz10a_u - MySQL 5.6.51 with InnoDB, Release build with -march=native -mtune=native, cz10a_u config
- my5740_rel_native_lto.cz10a_u - MySQL 5.7.40 with InnoDB, Release build with -march=native -mtune=native, cz10a_u config
- my8033_rel_native_lto.cz10a_u - MySQL 8.0.33 with InnoDB, Release build with -march=native -mtune=native -DWITH_LTO, cz10a_u config
Contents
- Summary
- l.i0: load without secondary indexes
- l.x: create secondary indexes
- l.i1: continue load after secondary indexes created with 50 inserts per transaction
- l.i2: continue load after secondary indexes created with 5 inserts per transaction
- qr100.L1: range queries with 100 insert/s per client
- qp100.L2: point queries with 100 insert/s per client
- qr500.L3: range queries with 500 insert/s per client
- qp500.L4: point queries with 500 insert/s per client
- qr1000.L5: range queries with 1000 insert/s per client
- qp1000.L6: point queries with 1000 insert/s per client
Summary
The numbers are inserts/s for l.i0, l.i1 and l.i2, indexed docs (or rows) /s for l.x and queries/s for qr100, qp100 thru qr1000, qp1000" The values are the average rate over the entire test for inserts (IPS) and queries (QPS). The range of values for IPS and QPS is split into 3 parts: bottom 25%, middle 50%, top 25%. Values in the bottom 25% have a red background, values in the top 25% have a green background and values in the middle have no color. A gray background is used for values that can be ignored because the DBMS did not sustain the target insert rate. Red backgrounds are not used when the minimum value is within 80% of the max value.
| dbms | l.i0 | l.x | l.i1 | l.i2 | qr100 | qp100 | qr500 | qp500 | qr1000 | qp1000 |
|---|---|---|---|---|---|---|---|---|---|---|
| my5651_rel_native_lto.cz10a_u | 480000 | 355819 | 60162 | 38948 | 23777 | 97620 | 130060 | 99533 | 112487 | 88968 |
| my5740_rel_native_lto.cz10a_u | 570071 | 1696113 | 108011 | 77469 | 20429 | 90430 | 94372 | 94637 | 113173 | 88988 |
| my8033_rel_native_lto.cz10a_u | 890538 | 1311476 | 193353 | 118168 | 14418 | 74830 | 76125 | 79191 | 97957 | 76468 |
This table has relative throughput, throughput for the DBMS relative to the DBMS in the first line, using the absolute throughput from the previous table. Values less than 0.95 have a yellow background. Values greater than 1.05 have a blue background.
| dbms | l.i0 | l.x | l.i1 | l.i2 | qr100 | qp100 | qr500 | qp500 | qr1000 | qp1000 |
|---|---|---|---|---|---|---|---|---|---|---|
| my5651_rel_native_lto.cz10a_u | 1.00 | 1.00 | 1.00 | 1.00 | 1.00 | 1.00 | 1.00 | 1.00 | 1.00 | 1.00 |
| my5740_rel_native_lto.cz10a_u | 1.19 | 4.77 | 1.80 | 1.99 | 0.86 | 0.93 | 0.73 | 0.95 | 1.01 | 1.00 |
| my8033_rel_native_lto.cz10a_u | 1.86 | 3.69 | 3.21 | 3.03 | 0.61 | 0.77 | 0.59 | 0.80 | 0.87 | 0.86 |
This lists the average rate of inserts/s for the tests that do inserts concurrent with queries. For such tests the query rate is listed in the table above. The read+write tests are setup so that the insert rate should match the target rate every second. Cells that are not at least 95% of the target have a red background to indicate a failure to satisfy the target.
| dbms | qr100.L1 | qp100.L2 | qr500.L3 | qp500.L4 | qr1000.L5 | qp1000.L6 |
|---|---|---|---|---|---|---|
| my5651_rel_native_lto.cz10a_u | 2379 | 2380 | 11907 | 11911 | 23828 | 23828 |
| my5740_rel_native_lto.cz10a_u | 2378 | 2380 | 11904 | 11907 | 23828 | 23828 |
| my8033_rel_native_lto.cz10a_u | 2378 | 2380 | 11904 | 11907 | 23821 | 23828 |
| target | 2400 | 2400 | 12000 | 12000 | 24000 | 24000 |
l.i0
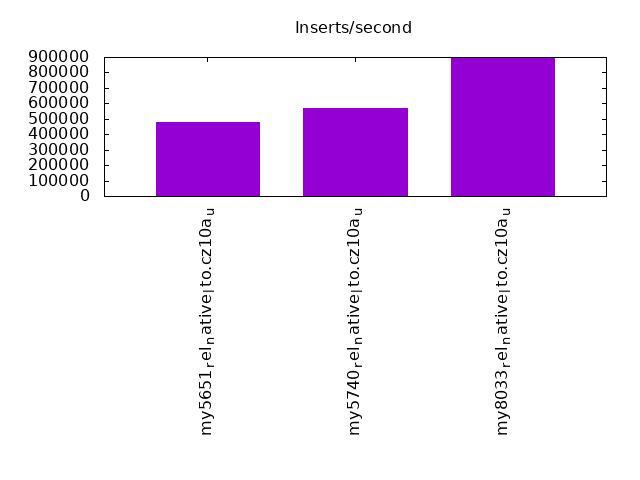
l.i0: load without secondary indexes. Graphs for performance per 1-second interval are here.
Average throughput:
Insert response time histogram: each cell has the percentage of responses that take <= the time in the header and max is the max response time in seconds. For the max column values in the top 25% of the range have a red background and in the bottom 25% of the range have a green background. The red background is not used when the min value is within 80% of the max value.
| dbms | 256us | 1ms | 4ms | 16ms | 64ms | 256ms | 1s | 4s | 16s | gt | max |
|---|---|---|---|---|---|---|---|---|---|---|---|
| my5651_rel_native_lto.cz10a_u | 0.279 | 10.759 | 88.707 | 0.212 | 0.043 | 0.089 | |||||
| my5740_rel_native_lto.cz10a_u | 0.196 | 50.067 | 49.692 | 0.002 | 0.043 | 0.090 | |||||
| my8033_rel_native_lto.cz10a_u | 99.924 | 0.028 | 0.005 | 0.042 | 0.111 |
Performance metrics for the DBMS listed above. Some are normalized by throughput, others are not. Legend for results is here.
ips	qps	rps	rmbps	wps	wmbps	rpq	rkbpq	wpi	wkbpi	csps	cpups	cspq	cpupq	dbgb1	dbgb2	rss	maxop	p50	p99	tag
480000	0	0	0.0	2333.8	112.9	0.000	0.000	0.005	0.241	69168	38.5	0.144	64	31.8	160.3	46.2	0.089	20280	17882	my5651_rel_native_lto.cz10a_u
570071	0	0	0.0	2833.0	135.0	0.000	0.000	0.005	0.242	80694	40.7	0.142	57	31.8	160.3	47.3	0.090	24276	21878	my5740_rel_native_lto.cz10a_u
890538	0	0	0.0	4257.2	209.4	0.000	0.000	0.005	0.241	193913	50.3	0.218	45	31.7	160.3	47.3	0.111	39261	31668	my8033_rel_native_lto.cz10a_u
l.x
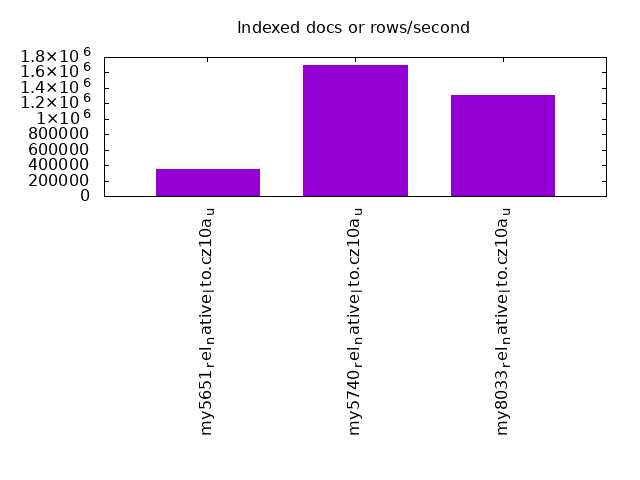
l.x: create secondary indexes.
Average throughput:
Performance metrics for the DBMS listed above. Some are normalized by throughput, others are not. Legend for results is here.
ips	qps	rps	rmbps	wps	wmbps	rpq	rkbpq	wpi	wkbpi	csps	cpups	cspq	cpupq	dbgb1	dbgb2	rss	maxop	p50	p99	tag
355819	0	0	0.0	19872.6	686.7	0.000	0.000	0.056	1.976	68052	30.7	0.191	69	66.9	195.4	81.7	0.001	NA	NA	my5651_rel_native_lto.cz10a_u
1696113	0	0	0.0	28483.2	1520.7	0.000	0.000	0.017	0.918	148293	30.4	0.087	14	72.8	201.4	83.2	0.002	NA	NA	my5740_rel_native_lto.cz10a_u
1311476	0	7257	344.8	28871.4	1068.7	0.006	0.269	0.022	0.834	217748	73.1	0.166	45	72.7	201.2	75.5	0.005	NA	NA	my8033_rel_native_lto.cz10a_u
l.i1
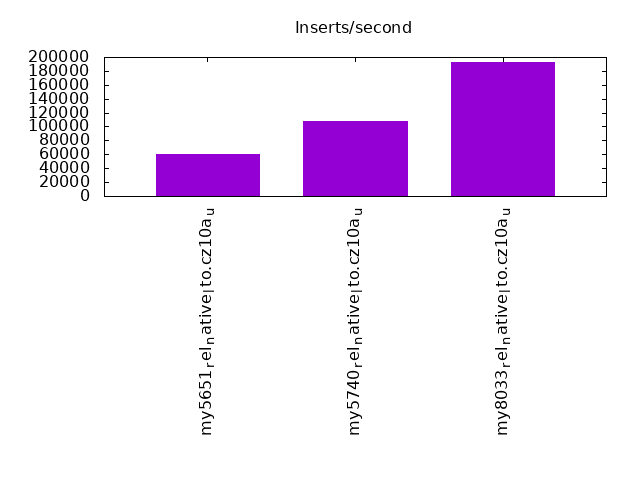
l.i1: continue load after secondary indexes created with 50 inserts per transaction. Graphs for performance per 1-second interval are here.
Average throughput:
Insert response time histogram: each cell has the percentage of responses that take <= the time in the header and max is the max response time in seconds. For the max column values in the top 25% of the range have a red background and in the bottom 25% of the range have a green background. The red background is not used when the min value is within 80% of the max value.
| dbms | 256us | 1ms | 4ms | 16ms | 64ms | 256ms | 1s | 4s | 16s | gt | max |
|---|---|---|---|---|---|---|---|---|---|---|---|
| my5651_rel_native_lto.cz10a_u | 0.010 | 14.511 | 85.469 | 0.010 | nonzero | 5.733 | |||||
| my5740_rel_native_lto.cz10a_u | 0.022 | 99.742 | 0.198 | 0.037 | nonzero | 0.821 | |||||
| my8033_rel_native_lto.cz10a_u | 22.988 | 76.501 | 0.351 | 0.141 | 0.019 | 0.546 |
Delete response time histogram: each cell has the percentage of responses that take <= the time in the header and max is the max response time in seconds. For the max column values in the top 25% of the range have a red background and in the bottom 25% of the range have a green background. The red background is not used when the min value is within 80% of the max value.
| dbms | 256us | 1ms | 4ms | 16ms | 64ms | 256ms | 1s | 4s | 16s | gt | max |
|---|---|---|---|---|---|---|---|---|---|---|---|
| my5651_rel_native_lto.cz10a_u | 0.017 | 19.142 | 80.834 | 0.007 | nonzero | 5.731 | |||||
| my5740_rel_native_lto.cz10a_u | 0.048 | 99.762 | 0.154 | 0.036 | nonzero | 0.655 | |||||
| my8033_rel_native_lto.cz10a_u | 49.806 | 48.912 | 0.572 | 0.573 | 0.136 | 0.555 |
Performance metrics for the DBMS listed above. Some are normalized by throughput, others are not. Legend for results is here.
ips	qps	rps	rmbps	wps	wmbps	rpq	rkbpq	wpi	wkbpi	csps	cpups	cspq	cpupq	dbgb1	dbgb2	rss	maxop	p50	p99	tag
60162	0	1389	6.0	5847.2	185.1	0.023	0.102	0.097	3.151	133813	65.7	2.224	874	227.3	403.7	215.8	5.733	2497	1998	my5651_rel_native_lto.cz10a_u
108011	0	130	2.0	9574.4	306.5	0.001	0.019	0.089	2.906	121267	69.5	1.123	515	236.0	415.5	216.8	0.821	4496	4047	my5740_rel_native_lto.cz10a_u
193353	0	1213	19.0	16782.4	553.7	0.006	0.101	0.087	2.932	820467	59.2	4.243	245	246.4	438.6	216.2	0.546	8791	3247	my8033_rel_native_lto.cz10a_u
l.i2
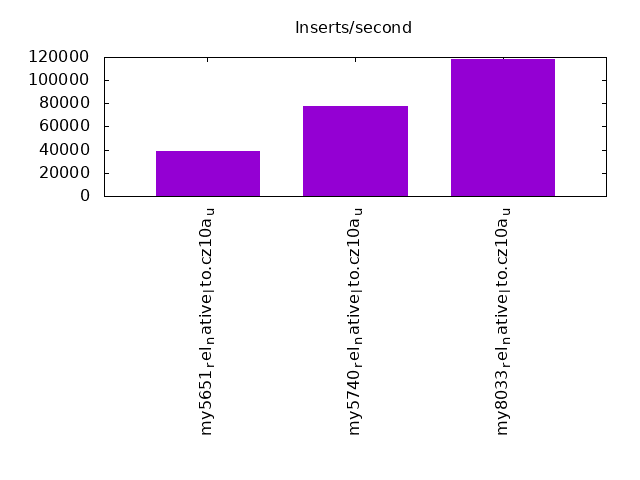
l.i2: continue load after secondary indexes created with 5 inserts per transaction. Graphs for performance per 1-second interval are here.
Average throughput:
Insert response time histogram: each cell has the percentage of responses that take <= the time in the header and max is the max response time in seconds. For the max column values in the top 25% of the range have a red background and in the bottom 25% of the range have a green background. The red background is not used when the min value is within 80% of the max value.
| dbms | 256us | 1ms | 4ms | 16ms | 64ms | 256ms | 1s | 4s | 16s | gt | max |
|---|---|---|---|---|---|---|---|---|---|---|---|
| my5651_rel_native_lto.cz10a_u | nonzero | 0.450 | 83.458 | 16.085 | 0.006 | nonzero | 0.134 | ||||
| my5740_rel_native_lto.cz10a_u | nonzero | 6.335 | 93.588 | 0.064 | 0.006 | 0.007 | 0.220 | ||||
| my8033_rel_native_lto.cz10a_u | 70.490 | 29.373 | 0.128 | 0.002 | 0.007 | 0.113 |
Delete response time histogram: each cell has the percentage of responses that take <= the time in the header and max is the max response time in seconds. For the max column values in the top 25% of the range have a red background and in the bottom 25% of the range have a green background. The red background is not used when the min value is within 80% of the max value.
| dbms | 256us | 1ms | 4ms | 16ms | 64ms | 256ms | 1s | 4s | 16s | gt | max |
|---|---|---|---|---|---|---|---|---|---|---|---|
| my5651_rel_native_lto.cz10a_u | nonzero | 0.546 | 84.373 | 15.073 | 0.008 | nonzero | 0.134 | ||||
| my5740_rel_native_lto.cz10a_u | nonzero | 5.919 | 94.002 | 0.064 | 0.007 | 0.007 | 0.220 | ||||
| my8033_rel_native_lto.cz10a_u | 76.513 | 23.331 | 0.146 | 0.002 | 0.007 | 0.124 |
Performance metrics for the DBMS listed above. Some are normalized by throughput, others are not. Legend for results is here.
ips	qps	rps	rmbps	wps	wmbps	rpq	rkbpq	wpi	wkbpi	csps	cpups	cspq	cpupq	dbgb1	dbgb2	rss	maxop	p50	p99	tag
38948	0	5580	30.8	6239.4	187.5	0.143	0.809	0.160	4.930	342258	54.2	8.787	1113	237.9	434.0	215.9	0.134	1623	1503	my5651_rel_native_lto.cz10a_u
77469	0	1520	23.7	10472.4	317.9	0.020	0.314	0.135	4.201	555318	57.5	7.168	594	248.7	448.6	216.9	0.220	3257	2962	my5740_rel_native_lto.cz10a_u
118168	0	2746	42.9	15041.3	469.4	0.023	0.372	0.127	4.068	1233675	63.2	10.440	428	259.3	488.6	216.2	0.113	4880	4351	my8033_rel_native_lto.cz10a_u
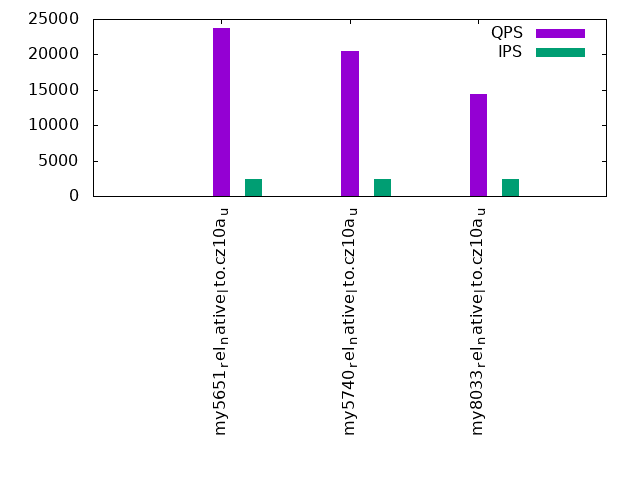
qr100.L1
qr100.L1: range queries with 100 insert/s per client. Graphs for performance per 1-second interval are here.
Average throughput:
Query response time histogram: each cell has the percentage of responses that take <= the time in the header and max is the max response time in seconds. For max values in the top 25% of the range have a red background and in the bottom 25% of the range have a green background. The red background is not used when the min value is within 80% of the max value.
| dbms | 256us | 1ms | 4ms | 16ms | 64ms | 256ms | 1s | 4s | 16s | gt | max |
|---|---|---|---|---|---|---|---|---|---|---|---|
| my5651_rel_native_lto.cz10a_u | 66.050 | 0.514 | 31.694 | 1.690 | 0.051 | nonzero | 0.067 | ||||
| my5740_rel_native_lto.cz10a_u | 65.598 | 1.064 | 30.475 | 2.846 | 0.018 | nonzero | 0.087 | ||||
| my8033_rel_native_lto.cz10a_u | 57.623 | 9.030 | 12.911 | 20.411 | 0.025 | nonzero | 0.087 |
Insert response time histogram: each cell has the percentage of responses that take <= the time in the header and max is the max response time in seconds. For max values in the top 25% of the range have a red background and in the bottom 25% of the range have a green background. The red background is not used when the min value is within 80% of the max value.
| dbms | 256us | 1ms | 4ms | 16ms | 64ms | 256ms | 1s | 4s | 16s | gt | max |
|---|---|---|---|---|---|---|---|---|---|---|---|
| my5651_rel_native_lto.cz10a_u | 34.170 | 65.152 | 0.678 | 0.055 | |||||||
| my5740_rel_native_lto.cz10a_u | 42.341 | 57.659 | 0.016 | ||||||||
| my8033_rel_native_lto.cz10a_u | 65.993 | 34.006 | 0.001 | 0.024 |
Delete response time histogram: each cell has the percentage of responses that take <= the time in the header and max is the max response time in seconds. For max values in the top 25% of the range have a red background and in the bottom 25% of the range have a green background. The red background is not used when the min value is within 80% of the max value.
| dbms | 256us | 1ms | 4ms | 16ms | 64ms | 256ms | 1s | 4s | 16s | gt | max |
|---|---|---|---|---|---|---|---|---|---|---|---|
| my5651_rel_native_lto.cz10a_u | 67.961 | 31.752 | 0.287 | 0.032 | |||||||
| my5740_rel_native_lto.cz10a_u | 81.488 | 18.512 | 0.015 | ||||||||
| my8033_rel_native_lto.cz10a_u | 99.870 | 0.130 | 0.001 | 0.028 |
Performance metrics for the DBMS listed above. Some are normalized by throughput, others are not. Legend for results is here.
ips	qps	rps	rmbps	wps	wmbps	rpq	rkbpq	wpi	wkbpi	csps	cpups	cspq	cpupq	dbgb1	dbgb2	rss	maxop	p50	p99	tag
2379	23777	1624	24.4	6045.5	175.8	0.068	1.050	2.541	75.681	129668	37.6	5.454	1265	237.9	434.0	215.9	0.067	959	687	my5651_rel_native_lto.cz10a_u
2378	20429	1725	27.0	6477.6	186.9	0.084	1.351	2.725	80.484	115537	39.4	5.655	1543	248.7	448.6	216.9	0.087	863	623	my5740_rel_native_lto.cz10a_u
2378	14418	2202	34.4	7164.5	207.6	0.153	2.444	3.013	89.396	137771	38.4	9.555	2131	259.3	455.8	216.2	0.087	591	416	my8033_rel_native_lto.cz10a_u
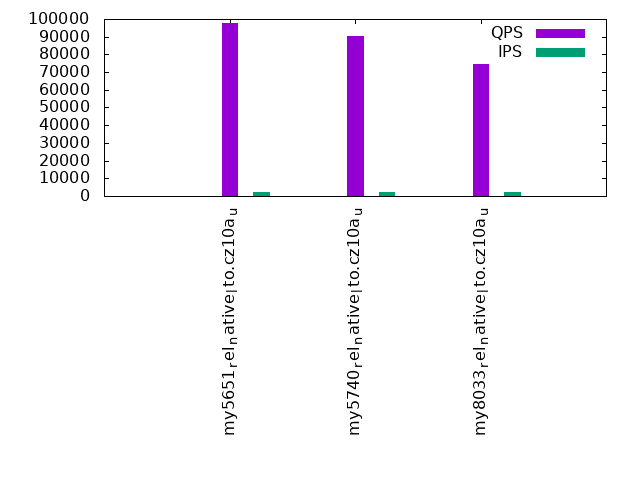
qp100.L2
qp100.L2: point queries with 100 insert/s per client. Graphs for performance per 1-second interval are here.
Average throughput:
Query response time histogram: each cell has the percentage of responses that take <= the time in the header and max is the max response time in seconds. For max values in the top 25% of the range have a red background and in the bottom 25% of the range have a green background. The red background is not used when the min value is within 80% of the max value.
| dbms | 256us | 1ms | 4ms | 16ms | 64ms | 256ms | 1s | 4s | 16s | gt | max |
|---|---|---|---|---|---|---|---|---|---|---|---|
| my5651_rel_native_lto.cz10a_u | 85.887 | 13.908 | 0.153 | 0.051 | 0.001 | 0.024 | |||||
| my5740_rel_native_lto.cz10a_u | 62.622 | 37.330 | 0.048 | nonzero | nonzero | 0.021 | |||||
| my8033_rel_native_lto.cz10a_u | 21.079 | 78.861 | 0.060 | 0.001 | nonzero | 0.025 |
Insert response time histogram: each cell has the percentage of responses that take <= the time in the header and max is the max response time in seconds. For max values in the top 25% of the range have a red background and in the bottom 25% of the range have a green background. The red background is not used when the min value is within 80% of the max value.
| dbms | 256us | 1ms | 4ms | 16ms | 64ms | 256ms | 1s | 4s | 16s | gt | max |
|---|---|---|---|---|---|---|---|---|---|---|---|
| my5651_rel_native_lto.cz10a_u | 60.241 | 39.610 | 0.149 | 0.027 | |||||||
| my5740_rel_native_lto.cz10a_u | 66.678 | 33.321 | 0.001 | 0.038 | |||||||
| my8033_rel_native_lto.cz10a_u | 73.248 | 26.752 | 0.001 | 0.018 |
Delete response time histogram: each cell has the percentage of responses that take <= the time in the header and max is the max response time in seconds. For max values in the top 25% of the range have a red background and in the bottom 25% of the range have a green background. The red background is not used when the min value is within 80% of the max value.
| dbms | 256us | 1ms | 4ms | 16ms | 64ms | 256ms | 1s | 4s | 16s | gt | max |
|---|---|---|---|---|---|---|---|---|---|---|---|
| my5651_rel_native_lto.cz10a_u | 81.377 | 18.523 | 0.100 | 0.026 | |||||||
| my5740_rel_native_lto.cz10a_u | 88.749 | 11.251 | 0.001 | 0.016 | |||||||
| my8033_rel_native_lto.cz10a_u | 99.895 | 0.104 | 0.001 | 0.019 |
Performance metrics for the DBMS listed above. Some are normalized by throughput, others are not. Legend for results is here.
ips	qps	rps	rmbps	wps	wmbps	rpq	rkbpq	wpi	wkbpi	csps	cpups	cspq	cpupq	dbgb1	dbgb2	rss	maxop	p50	p99	tag
2380	97620	1566	23.5	3786.7	109.8	0.016	0.246	1.591	47.246	426036	37.5	4.364	307	237.9	434.0	215.9	0.024	4075	3804	my5651_rel_native_lto.cz10a_u
2380	90430	1510	23.6	4115.0	118.9	0.017	0.267	1.729	51.163	395434	39.5	4.373	349	248.7	448.6	216.9	0.021	3806	3612	my5740_rel_native_lto.cz10a_u
2380	74830	1667	26.1	4687.0	136.1	0.022	0.357	1.970	58.587	429678	38.4	5.742	411	259.3	456.5	216.2	0.025	3133	2941	my8033_rel_native_lto.cz10a_u
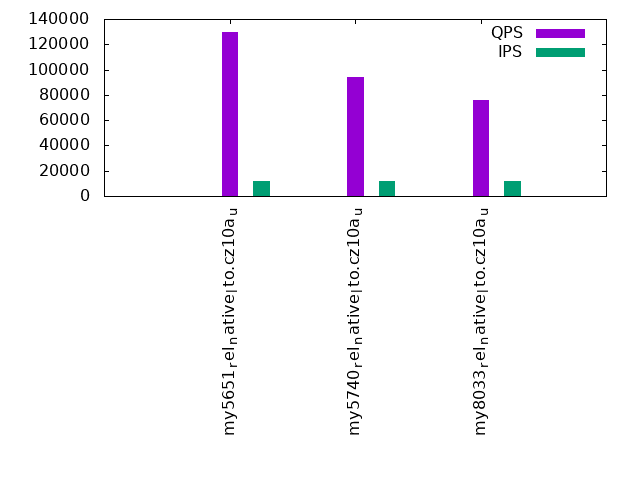
qr500.L3
qr500.L3: range queries with 500 insert/s per client. Graphs for performance per 1-second interval are here.
Average throughput:
Query response time histogram: each cell has the percentage of responses that take <= the time in the header and max is the max response time in seconds. For max values in the top 25% of the range have a red background and in the bottom 25% of the range have a green background. The red background is not used when the min value is within 80% of the max value.
| dbms | 256us | 1ms | 4ms | 16ms | 64ms | 256ms | 1s | 4s | 16s | gt | max |
|---|---|---|---|---|---|---|---|---|---|---|---|
| my5651_rel_native_lto.cz10a_u | 95.335 | 4.572 | 0.069 | 0.024 | nonzero | 0.042 | |||||
| my5740_rel_native_lto.cz10a_u | 82.547 | 16.773 | 0.676 | 0.004 | nonzero | 0.026 | |||||
| my8033_rel_native_lto.cz10a_u | 70.795 | 25.796 | 3.405 | 0.003 | nonzero | 0.023 |
Insert response time histogram: each cell has the percentage of responses that take <= the time in the header and max is the max response time in seconds. For max values in the top 25% of the range have a red background and in the bottom 25% of the range have a green background. The red background is not used when the min value is within 80% of the max value.
| dbms | 256us | 1ms | 4ms | 16ms | 64ms | 256ms | 1s | 4s | 16s | gt | max |
|---|---|---|---|---|---|---|---|---|---|---|---|
| my5651_rel_native_lto.cz10a_u | 2.101 | 39.850 | 58.046 | 0.003 | 0.088 | ||||||
| my5740_rel_native_lto.cz10a_u | 41.927 | 58.069 | 0.005 | 0.025 | |||||||
| my8033_rel_native_lto.cz10a_u | 91.798 | 8.202 | nonzero | 0.023 |
Delete response time histogram: each cell has the percentage of responses that take <= the time in the header and max is the max response time in seconds. For max values in the top 25% of the range have a red background and in the bottom 25% of the range have a green background. The red background is not used when the min value is within 80% of the max value.
| dbms | 256us | 1ms | 4ms | 16ms | 64ms | 256ms | 1s | 4s | 16s | gt | max |
|---|---|---|---|---|---|---|---|---|---|---|---|
| my5651_rel_native_lto.cz10a_u | 3.354 | 44.295 | 52.348 | 0.003 | 0.084 | ||||||
| my5740_rel_native_lto.cz10a_u | 55.288 | 44.708 | 0.004 | 0.023 | |||||||
| my8033_rel_native_lto.cz10a_u | 99.951 | 0.048 | 0.001 | 0.021 |
Performance metrics for the DBMS listed above. Some are normalized by throughput, others are not. Legend for results is here.
ips	qps	rps	rmbps	wps	wmbps	rpq	rkbpq	wpi	wkbpi	csps	cpups	cspq	cpupq	dbgb1	dbgb2	rss	maxop	p50	p99	tag
11907	130060	375	2.1	2259.0	65.8	0.003	0.017	0.190	5.662	526154	42.3	4.045	260	237.9	434.0	215.9	0.042	5419	4955	my5651_rel_native_lto.cz10a_u
11904	94372	450	7.0	3778.5	110.0	0.005	0.076	0.317	9.461	392717	39.4	4.161	334	248.7	448.6	216.9	0.026	3916	2237	my5740_rel_native_lto.cz10a_u
11904	76125	545	8.5	4097.2	120.8	0.007	0.115	0.344	10.390	386563	37.4	5.078	393	259.3	388.2	216.2	0.023	3149	1614	my8033_rel_native_lto.cz10a_u
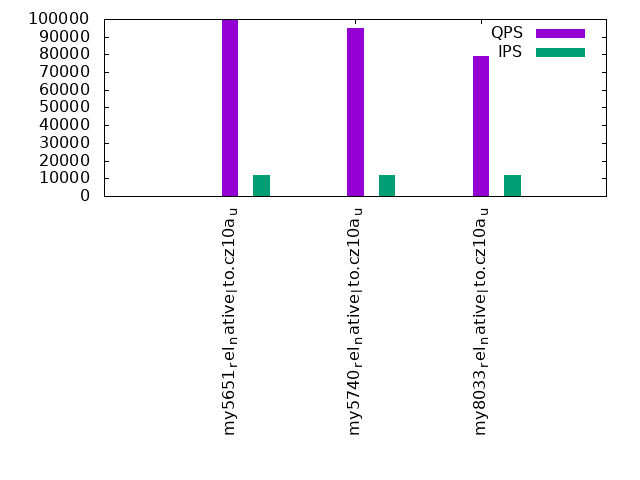
qp500.L4
qp500.L4: point queries with 500 insert/s per client. Graphs for performance per 1-second interval are here.
Average throughput:
Query response time histogram: each cell has the percentage of responses that take <= the time in the header and max is the max response time in seconds. For max values in the top 25% of the range have a red background and in the bottom 25% of the range have a green background. The red background is not used when the min value is within 80% of the max value.
| dbms | 256us | 1ms | 4ms | 16ms | 64ms | 256ms | 1s | 4s | 16s | gt | max |
|---|---|---|---|---|---|---|---|---|---|---|---|
| my5651_rel_native_lto.cz10a_u | 82.804 | 17.090 | 0.077 | 0.028 | nonzero | nonzero | 0.078 | ||||
| my5740_rel_native_lto.cz10a_u | 71.065 | 28.923 | 0.009 | 0.002 | nonzero | 0.027 | |||||
| my8033_rel_native_lto.cz10a_u | 34.524 | 65.465 | 0.011 | nonzero | nonzero | 0.018 |
Insert response time histogram: each cell has the percentage of responses that take <= the time in the header and max is the max response time in seconds. For max values in the top 25% of the range have a red background and in the bottom 25% of the range have a green background. The red background is not used when the min value is within 80% of the max value.
| dbms | 256us | 1ms | 4ms | 16ms | 64ms | 256ms | 1s | 4s | 16s | gt | max |
|---|---|---|---|---|---|---|---|---|---|---|---|
| my5651_rel_native_lto.cz10a_u | 2.234 | 49.030 | 48.733 | 0.003 | 0.108 | ||||||
| my5740_rel_native_lto.cz10a_u | 9.903 | 89.808 | 0.289 | 0.041 | |||||||
| my8033_rel_native_lto.cz10a_u | 39.626 | 60.368 | 0.006 | 0.023 |
Delete response time histogram: each cell has the percentage of responses that take <= the time in the header and max is the max response time in seconds. For max values in the top 25% of the range have a red background and in the bottom 25% of the range have a green background. The red background is not used when the min value is within 80% of the max value.
| dbms | 256us | 1ms | 4ms | 16ms | 64ms | 256ms | 1s | 4s | 16s | gt | max |
|---|---|---|---|---|---|---|---|---|---|---|---|
| my5651_rel_native_lto.cz10a_u | 3.508 | 54.798 | 41.692 | 0.003 | 0.113 | ||||||
| my5740_rel_native_lto.cz10a_u | 14.295 | 85.492 | 0.213 | 0.040 | |||||||
| my8033_rel_native_lto.cz10a_u | 93.311 | 6.686 | 0.002 | 0.023 |
Performance metrics for the DBMS listed above. Some are normalized by throughput, others are not. Legend for results is here.
ips	qps	rps	rmbps	wps	wmbps	rpq	rkbpq	wpi	wkbpi	csps	cpups	cspq	cpupq	dbgb1	dbgb2	rss	maxop	p50	p99	tag
11911	99533	314	1.3	1810.3	53.3	0.003	0.013	0.152	4.579	430691	41.1	4.327	330	237.9	434.0	215.9	0.078	4172	3964	my5651_rel_native_lto.cz10a_u
11907	94637	5	0.1	1592.7	47.2	0.000	0.001	0.134	4.061	404985	36.9	4.279	312	248.7	448.6	216.9	0.027	3964	3772	my5740_rel_native_lto.cz10a_u
11907	79191	7	0.1	1783.4	53.2	0.000	0.001	0.150	4.579	408499	34.8	5.158	352	259.3	388.2	216.2	0.018	3308	3133	my8033_rel_native_lto.cz10a_u
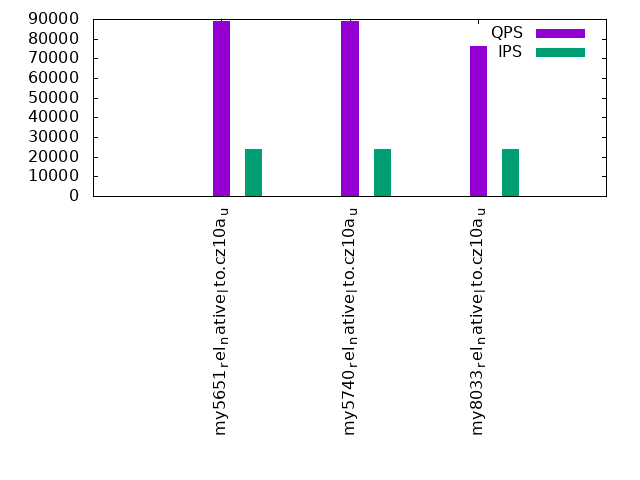
qr1000.L5
qr1000.L5: range queries with 1000 insert/s per client. Graphs for performance per 1-second interval are here.
Average throughput:
Query response time histogram: each cell has the percentage of responses that take <= the time in the header and max is the max response time in seconds. For max values in the top 25% of the range have a red background and in the bottom 25% of the range have a green background. The red background is not used when the min value is within 80% of the max value.
| dbms | 256us | 1ms | 4ms | 16ms | 64ms | 256ms | 1s | 4s | 16s | gt | max |
|---|---|---|---|---|---|---|---|---|---|---|---|
| my5651_rel_native_lto.cz10a_u | 87.377 | 12.271 | 0.309 | 0.041 | 0.002 | 0.032 | |||||
| my5740_rel_native_lto.cz10a_u | 88.155 | 11.770 | 0.056 | 0.018 | nonzero | 0.046 | |||||
| my8033_rel_native_lto.cz10a_u | 76.713 | 23.227 | 0.059 | 0.001 | nonzero | 0.020 |
Insert response time histogram: each cell has the percentage of responses that take <= the time in the header and max is the max response time in seconds. For max values in the top 25% of the range have a red background and in the bottom 25% of the range have a green background. The red background is not used when the min value is within 80% of the max value.
| dbms | 256us | 1ms | 4ms | 16ms | 64ms | 256ms | 1s | 4s | 16s | gt | max |
|---|---|---|---|---|---|---|---|---|---|---|---|
| my5651_rel_native_lto.cz10a_u | 0.406 | 14.269 | 85.325 | nonzero | 0.080 | ||||||
| my5740_rel_native_lto.cz10a_u | 1.892 | 94.396 | 3.712 | 0.049 | |||||||
| my8033_rel_native_lto.cz10a_u | 14.831 | 85.116 | 0.053 | 0.032 |
Delete response time histogram: each cell has the percentage of responses that take <= the time in the header and max is the max response time in seconds. For max values in the top 25% of the range have a red background and in the bottom 25% of the range have a green background. The red background is not used when the min value is within 80% of the max value.
| dbms | 256us | 1ms | 4ms | 16ms | 64ms | 256ms | 1s | 4s | 16s | gt | max |
|---|---|---|---|---|---|---|---|---|---|---|---|
| my5651_rel_native_lto.cz10a_u | 0.262 | 15.495 | 84.243 | nonzero | 0.066 | ||||||
| my5740_rel_native_lto.cz10a_u | 1.491 | 95.832 | 2.677 | 0.051 | |||||||
| my8033_rel_native_lto.cz10a_u | 51.852 | 48.117 | 0.031 | 0.033 |
Performance metrics for the DBMS listed above. Some are normalized by throughput, others are not. Legend for results is here.
ips	qps	rps	rmbps	wps	wmbps	rpq	rkbpq	wpi	wkbpi	csps	cpups	cspq	cpupq	dbgb1	dbgb2	rss	maxop	p50	p99	tag
23828	112487	649	3.5	2820.5	84.7	0.006	0.032	0.118	3.639	465263	54.7	4.136	389	237.9	434.0	215.9	0.032	4699	4348	my5651_rel_native_lto.cz10a_u
23828	113173	93	1.4	2872.0	86.0	0.001	0.013	0.121	3.694	451036	46.3	3.985	327	248.7	448.6	216.9	0.046	4731	4316	my5740_rel_native_lto.cz10a_u
23821	97957	97	1.5	3333.4	100.4	0.001	0.016	0.140	4.315	517074	39.3	5.279	321	259.3	388.2	216.2	0.020	4091	3756	my8033_rel_native_lto.cz10a_u
qp1000.L6
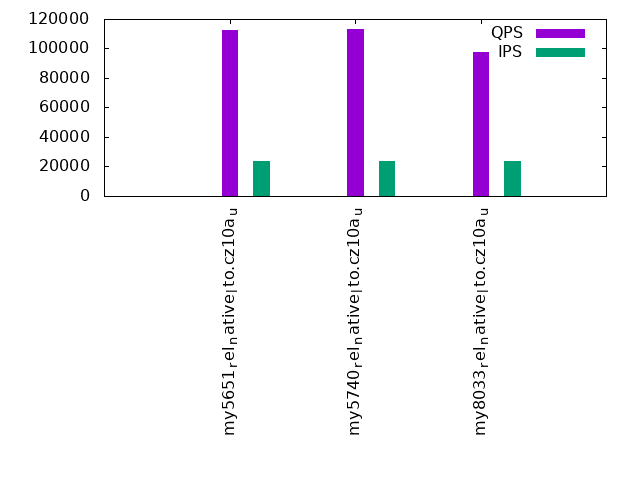
qp1000.L6: point queries with 1000 insert/s per client. Graphs for performance per 1-second interval are here.
Average throughput:
Query response time histogram: each cell has the percentage of responses that take <= the time in the header and max is the max response time in seconds. For max values in the top 25% of the range have a red background and in the bottom 25% of the range have a green background. The red background is not used when the min value is within 80% of the max value.
| dbms | 256us | 1ms | 4ms | 16ms | 64ms | 256ms | 1s | 4s | 16s | gt | max |
|---|---|---|---|---|---|---|---|---|---|---|---|
| my5651_rel_native_lto.cz10a_u | 67.905 | 31.747 | 0.304 | 0.041 | 0.002 | 0.039 | |||||
| my5740_rel_native_lto.cz10a_u | 62.336 | 37.584 | 0.061 | 0.019 | nonzero | 0.026 | |||||
| my8033_rel_native_lto.cz10a_u | 31.272 | 68.652 | 0.075 | 0.002 | nonzero | 0.022 |
Insert response time histogram: each cell has the percentage of responses that take <= the time in the header and max is the max response time in seconds. For max values in the top 25% of the range have a red background and in the bottom 25% of the range have a green background. The red background is not used when the min value is within 80% of the max value.
| dbms | 256us | 1ms | 4ms | 16ms | 64ms | 256ms | 1s | 4s | 16s | gt | max |
|---|---|---|---|---|---|---|---|---|---|---|---|
| my5651_rel_native_lto.cz10a_u | 0.549 | 23.969 | 75.480 | 0.002 | 0.105 | ||||||
| my5740_rel_native_lto.cz10a_u | 2.719 | 94.300 | 2.980 | 0.001 | 0.081 | ||||||
| my8033_rel_native_lto.cz10a_u | 14.859 | 85.089 | 0.052 | 0.034 |
Delete response time histogram: each cell has the percentage of responses that take <= the time in the header and max is the max response time in seconds. For max values in the top 25% of the range have a red background and in the bottom 25% of the range have a green background. The red background is not used when the min value is within 80% of the max value.
| dbms | 256us | 1ms | 4ms | 16ms | 64ms | 256ms | 1s | 4s | 16s | gt | max |
|---|---|---|---|---|---|---|---|---|---|---|---|
| my5651_rel_native_lto.cz10a_u | 0.380 | 28.677 | 70.941 | 0.002 | 0.107 | ||||||
| my5740_rel_native_lto.cz10a_u | 2.390 | 95.498 | 2.111 | 0.001 | 0.078 | ||||||
| my8033_rel_native_lto.cz10a_u | 55.892 | 44.078 | 0.030 | 0.035 |
Performance metrics for the DBMS listed above. Some are normalized by throughput, others are not. Legend for results is here.
ips	qps	rps	rmbps	wps	wmbps	rpq	rkbpq	wpi	wkbpi	csps	cpups	cspq	cpupq	dbgb1	dbgb2	rss	maxop	p50	p99	tag
23828	88968	551	2.5	2891.5	86.6	0.006	0.029	0.121	3.721	402140	52.0	4.520	468	237.9	434.0	215.9	0.039	3724	3516	my5651_rel_native_lto.cz10a_u
23828	88988	35	0.5	2890.4	86.5	0.000	0.006	0.121	3.719	380535	45.3	4.276	407	248.7	448.6	216.9	0.026	3724	3516	my5740_rel_native_lto.cz10a_u
23828	76468	40	0.6	3355.4	100.9	0.001	0.008	0.141	4.335	459986	39.1	6.015	409	259.3	388.2	216.2	0.022	3213	3053	my8033_rel_native_lto.cz10a_u
l.i0
l.i0: load without secondary indexes
Performance metrics for all DBMS, not just the ones listed above. Some are normalized by throughput, others are not. Legend for results is here.
ips	qps	rps	rmbps	wps	wmbps	rpq	rkbpq	wpi	wkbpi	csps	cpups	cspq	cpupq	dbgb1	dbgb2	rss	maxop	p50	p99	tag
480000	0	0	0.0	2333.8	112.9	0.000	0.000	0.005	0.241	69168	38.5	0.144	64	31.8	160.3	46.2	0.089	20280	17882	my5651_rel_native_lto.cz10a_u
570071	0	0	0.0	2833.0	135.0	0.000	0.000	0.005	0.242	80694	40.7	0.142	57	31.8	160.3	47.3	0.090	24276	21878	my5740_rel_native_lto.cz10a_u
890538	0	0	0.0	4257.2	209.4	0.000	0.000	0.005	0.241	193913	50.3	0.218	45	31.7	160.3	47.3	0.111	39261	31668	my8033_rel_native_lto.cz10a_u
l.x
l.x: create secondary indexes
Performance metrics for all DBMS, not just the ones listed above. Some are normalized by throughput, others are not. Legend for results is here.
ips	qps	rps	rmbps	wps	wmbps	rpq	rkbpq	wpi	wkbpi	csps	cpups	cspq	cpupq	dbgb1	dbgb2	rss	maxop	p50	p99	tag
355819	0	0	0.0	19872.6	686.7	0.000	0.000	0.056	1.976	68052	30.7	0.191	69	66.9	195.4	81.7	0.001	NA	NA	my5651_rel_native_lto.cz10a_u
1696113	0	0	0.0	28483.2	1520.7	0.000	0.000	0.017	0.918	148293	30.4	0.087	14	72.8	201.4	83.2	0.002	NA	NA	my5740_rel_native_lto.cz10a_u
1311476	0	7257	344.8	28871.4	1068.7	0.006	0.269	0.022	0.834	217748	73.1	0.166	45	72.7	201.2	75.5	0.005	NA	NA	my8033_rel_native_lto.cz10a_u
l.i1
l.i1: continue load after secondary indexes created with 50 inserts per transaction
Performance metrics for all DBMS, not just the ones listed above. Some are normalized by throughput, others are not. Legend for results is here.
ips	qps	rps	rmbps	wps	wmbps	rpq	rkbpq	wpi	wkbpi	csps	cpups	cspq	cpupq	dbgb1	dbgb2	rss	maxop	p50	p99	tag
60162	0	1389	6.0	5847.2	185.1	0.023	0.102	0.097	3.151	133813	65.7	2.224	874	227.3	403.7	215.8	5.733	2497	1998	my5651_rel_native_lto.cz10a_u
108011	0	130	2.0	9574.4	306.5	0.001	0.019	0.089	2.906	121267	69.5	1.123	515	236.0	415.5	216.8	0.821	4496	4047	my5740_rel_native_lto.cz10a_u
193353	0	1213	19.0	16782.4	553.7	0.006	0.101	0.087	2.932	820467	59.2	4.243	245	246.4	438.6	216.2	0.546	8791	3247	my8033_rel_native_lto.cz10a_u
l.i2
l.i2: continue load after secondary indexes created with 5 inserts per transaction
Performance metrics for all DBMS, not just the ones listed above. Some are normalized by throughput, others are not. Legend for results is here.
ips	qps	rps	rmbps	wps	wmbps	rpq	rkbpq	wpi	wkbpi	csps	cpups	cspq	cpupq	dbgb1	dbgb2	rss	maxop	p50	p99	tag
38948	0	5580	30.8	6239.4	187.5	0.143	0.809	0.160	4.930	342258	54.2	8.787	1113	237.9	434.0	215.9	0.134	1623	1503	my5651_rel_native_lto.cz10a_u
77469	0	1520	23.7	10472.4	317.9	0.020	0.314	0.135	4.201	555318	57.5	7.168	594	248.7	448.6	216.9	0.220	3257	2962	my5740_rel_native_lto.cz10a_u
118168	0	2746	42.9	15041.3	469.4	0.023	0.372	0.127	4.068	1233675	63.2	10.440	428	259.3	488.6	216.2	0.113	4880	4351	my8033_rel_native_lto.cz10a_u
qr100.L1
qr100.L1: range queries with 100 insert/s per client
Performance metrics for all DBMS, not just the ones listed above. Some are normalized by throughput, others are not. Legend for results is here.
ips	qps	rps	rmbps	wps	wmbps	rpq	rkbpq	wpi	wkbpi	csps	cpups	cspq	cpupq	dbgb1	dbgb2	rss	maxop	p50	p99	tag
2379	23777	1624	24.4	6045.5	175.8	0.068	1.050	2.541	75.681	129668	37.6	5.454	1265	237.9	434.0	215.9	0.067	959	687	my5651_rel_native_lto.cz10a_u
2378	20429	1725	27.0	6477.6	186.9	0.084	1.351	2.725	80.484	115537	39.4	5.655	1543	248.7	448.6	216.9	0.087	863	623	my5740_rel_native_lto.cz10a_u
2378	14418	2202	34.4	7164.5	207.6	0.153	2.444	3.013	89.396	137771	38.4	9.555	2131	259.3	455.8	216.2	0.087	591	416	my8033_rel_native_lto.cz10a_u
qp100.L2
qp100.L2: point queries with 100 insert/s per client
Performance metrics for all DBMS, not just the ones listed above. Some are normalized by throughput, others are not. Legend for results is here.
ips	qps	rps	rmbps	wps	wmbps	rpq	rkbpq	wpi	wkbpi	csps	cpups	cspq	cpupq	dbgb1	dbgb2	rss	maxop	p50	p99	tag
2380	97620	1566	23.5	3786.7	109.8	0.016	0.246	1.591	47.246	426036	37.5	4.364	307	237.9	434.0	215.9	0.024	4075	3804	my5651_rel_native_lto.cz10a_u
2380	90430	1510	23.6	4115.0	118.9	0.017	0.267	1.729	51.163	395434	39.5	4.373	349	248.7	448.6	216.9	0.021	3806	3612	my5740_rel_native_lto.cz10a_u
2380	74830	1667	26.1	4687.0	136.1	0.022	0.357	1.970	58.587	429678	38.4	5.742	411	259.3	456.5	216.2	0.025	3133	2941	my8033_rel_native_lto.cz10a_u
qr500.L3
qr500.L3: range queries with 500 insert/s per client
Performance metrics for all DBMS, not just the ones listed above. Some are normalized by throughput, others are not. Legend for results is here.
ips	qps	rps	rmbps	wps	wmbps	rpq	rkbpq	wpi	wkbpi	csps	cpups	cspq	cpupq	dbgb1	dbgb2	rss	maxop	p50	p99	tag
11907	130060	375	2.1	2259.0	65.8	0.003	0.017	0.190	5.662	526154	42.3	4.045	260	237.9	434.0	215.9	0.042	5419	4955	my5651_rel_native_lto.cz10a_u
11904	94372	450	7.0	3778.5	110.0	0.005	0.076	0.317	9.461	392717	39.4	4.161	334	248.7	448.6	216.9	0.026	3916	2237	my5740_rel_native_lto.cz10a_u
11904	76125	545	8.5	4097.2	120.8	0.007	0.115	0.344	10.390	386563	37.4	5.078	393	259.3	388.2	216.2	0.023	3149	1614	my8033_rel_native_lto.cz10a_u
qp500.L4
qp500.L4: point queries with 500 insert/s per client
Performance metrics for all DBMS, not just the ones listed above. Some are normalized by throughput, others are not. Legend for results is here.
ips	qps	rps	rmbps	wps	wmbps	rpq	rkbpq	wpi	wkbpi	csps	cpups	cspq	cpupq	dbgb1	dbgb2	rss	maxop	p50	p99	tag
11911	99533	314	1.3	1810.3	53.3	0.003	0.013	0.152	4.579	430691	41.1	4.327	330	237.9	434.0	215.9	0.078	4172	3964	my5651_rel_native_lto.cz10a_u
11907	94637	5	0.1	1592.7	47.2	0.000	0.001	0.134	4.061	404985	36.9	4.279	312	248.7	448.6	216.9	0.027	3964	3772	my5740_rel_native_lto.cz10a_u
11907	79191	7	0.1	1783.4	53.2	0.000	0.001	0.150	4.579	408499	34.8	5.158	352	259.3	388.2	216.2	0.018	3308	3133	my8033_rel_native_lto.cz10a_u
qr1000.L5
qr1000.L5: range queries with 1000 insert/s per client
Performance metrics for all DBMS, not just the ones listed above. Some are normalized by throughput, others are not. Legend for results is here.
ips	qps	rps	rmbps	wps	wmbps	rpq	rkbpq	wpi	wkbpi	csps	cpups	cspq	cpupq	dbgb1	dbgb2	rss	maxop	p50	p99	tag
23828	112487	649	3.5	2820.5	84.7	0.006	0.032	0.118	3.639	465263	54.7	4.136	389	237.9	434.0	215.9	0.032	4699	4348	my5651_rel_native_lto.cz10a_u
23828	113173	93	1.4	2872.0	86.0	0.001	0.013	0.121	3.694	451036	46.3	3.985	327	248.7	448.6	216.9	0.046	4731	4316	my5740_rel_native_lto.cz10a_u
23821	97957	97	1.5	3333.4	100.4	0.001	0.016	0.140	4.315	517074	39.3	5.279	321	259.3	388.2	216.2	0.020	4091	3756	my8033_rel_native_lto.cz10a_u
qp1000.L6
qp1000.L6: point queries with 1000 insert/s per client
Performance metrics for all DBMS, not just the ones listed above. Some are normalized by throughput, others are not. Legend for results is here.
ips	qps	rps	rmbps	wps	wmbps	rpq	rkbpq	wpi	wkbpi	csps	cpups	cspq	cpupq	dbgb1	dbgb2	rss	maxop	p50	p99	tag
23828	88968	551	2.5	2891.5	86.6	0.006	0.029	0.121	3.721	402140	52.0	4.520	468	237.9	434.0	215.9	0.039	3724	3516	my5651_rel_native_lto.cz10a_u
23828	88988	35	0.5	2890.4	86.5	0.000	0.006	0.121	3.719	380535	45.3	4.276	407	248.7	448.6	216.9	0.026	3724	3516	my5740_rel_native_lto.cz10a_u
23828	76468	40	0.6	3355.4	100.9	0.001	0.008	0.141	4.335	459986	39.1	6.015	409	259.3	388.2	216.2	0.022	3213	3053	my8033_rel_native_lto.cz10a_u
l.i0
- l.i0: load without secondary indexes
- Legend for results is here.
- Each entry lists the percentage of responses that fit in that bucket (slower than max time for previous bucket, faster than min time for next bucket).
Insert response time histogram
256us	1ms	4ms	16ms	64ms	256ms	1s	4s	16s	gt	max	tag
0.000	0.279	10.759	88.707	0.212	0.043	0.000	0.000	0.000	0.000	0.089	my5651_rel_native_lto.cz10a_u
0.000	0.196	50.067	49.692	0.002	0.043	0.000	0.000	0.000	0.000	0.090	my5740_rel_native_lto.cz10a_u
0.000	0.000	99.924	0.028	0.005	0.042	0.000	0.000	0.000	0.000	0.111	my8033_rel_native_lto.cz10a_u
l.x
- l.x: create secondary indexes
- Legend for results is here.
- Each entry lists the percentage of responses that fit in that bucket (slower than max time for previous bucket, faster than min time for next bucket).
TODO - determine whether there is data for create index response time
l.i1
- l.i1: continue load after secondary indexes created with 50 inserts per transaction
- Legend for results is here.
- Each entry lists the percentage of responses that fit in that bucket (slower than max time for previous bucket, faster than min time for next bucket).
Insert response time histogram
256us	1ms	4ms	16ms	64ms	256ms	1s	4s	16s	gt	max	tag
0.000	0.000	0.010	14.511	85.469	0.010	0.000	0.000	nonzero	0.000	5.733	my5651_rel_native_lto.cz10a_u
0.000	0.000	0.022	99.742	0.198	0.037	nonzero	0.000	0.000	0.000	0.821	my5740_rel_native_lto.cz10a_u
0.000	0.000	22.988	76.501	0.351	0.141	0.019	0.000	0.000	0.000	0.546	my8033_rel_native_lto.cz10a_u
Delete response time histogram
256us	1ms	4ms	16ms	64ms	256ms	1s	4s	16s	gt	max	tag
0.000	0.000	0.017	19.142	80.834	0.007	0.000	0.000	nonzero	0.000	5.731	my5651_rel_native_lto.cz10a_u
0.000	0.000	0.048	99.762	0.154	0.036	nonzero	0.000	0.000	0.000	0.655	my5740_rel_native_lto.cz10a_u
0.000	0.000	49.806	48.912	0.572	0.573	0.136	0.000	0.000	0.000	0.555	my8033_rel_native_lto.cz10a_u
l.i2
- l.i2: continue load after secondary indexes created with 5 inserts per transaction
- Legend for results is here.
- Each entry lists the percentage of responses that fit in that bucket (slower than max time for previous bucket, faster than min time for next bucket).
Insert response time histogram
256us	1ms	4ms	16ms	64ms	256ms	1s	4s	16s	gt	max	tag
nonzero	0.450	83.458	16.085	0.006	nonzero	0.000	0.000	0.000	0.000	0.134	my5651_rel_native_lto.cz10a_u
nonzero	6.335	93.588	0.064	0.006	0.007	0.000	0.000	0.000	0.000	0.220	my5740_rel_native_lto.cz10a_u
0.000	70.490	29.373	0.128	0.002	0.007	0.000	0.000	0.000	0.000	0.113	my8033_rel_native_lto.cz10a_u
Delete response time histogram
256us	1ms	4ms	16ms	64ms	256ms	1s	4s	16s	gt	max	tag
nonzero	0.546	84.373	15.073	0.008	nonzero	0.000	0.000	0.000	0.000	0.134	my5651_rel_native_lto.cz10a_u
nonzero	5.919	94.002	0.064	0.007	0.007	0.000	0.000	0.000	0.000	0.220	my5740_rel_native_lto.cz10a_u
0.000	76.513	23.331	0.146	0.002	0.007	0.000	0.000	0.000	0.000	0.124	my8033_rel_native_lto.cz10a_u
qr100.L1
- qr100.L1: range queries with 100 insert/s per client
- Legend for results is here.
- Each entry lists the percentage of responses that fit in that bucket (slower than max time for previous bucket, faster than min time for next bucket).
Query response time histogram
256us	1ms	4ms	16ms	64ms	256ms	1s	4s	16s	gt	max	tag
66.050	0.514	31.694	1.690	0.051	nonzero	0.000	0.000	0.000	0.000	0.067	my5651_rel_native_lto.cz10a_u
65.598	1.064	30.475	2.846	0.018	nonzero	0.000	0.000	0.000	0.000	0.087	my5740_rel_native_lto.cz10a_u
57.623	9.030	12.911	20.411	0.025	nonzero	0.000	0.000	0.000	0.000	0.087	my8033_rel_native_lto.cz10a_u
Insert response time histogram
256us	1ms	4ms	16ms	64ms	256ms	1s	4s	16s	gt	max	tag
0.000	0.000	34.170	65.152	0.678	0.000	0.000	0.000	0.000	0.000	0.055	my5651_rel_native_lto.cz10a_u
0.000	0.000	42.341	57.659	0.000	0.000	0.000	0.000	0.000	0.000	0.016	my5740_rel_native_lto.cz10a_u
0.000	0.000	65.993	34.006	0.001	0.000	0.000	0.000	0.000	0.000	0.024	my8033_rel_native_lto.cz10a_u
Delete response time histogram
256us	1ms	4ms	16ms	64ms	256ms	1s	4s	16s	gt	max	tag
0.000	0.000	67.961	31.752	0.287	0.000	0.000	0.000	0.000	0.000	0.032	my5651_rel_native_lto.cz10a_u
0.000	0.000	81.488	18.512	0.000	0.000	0.000	0.000	0.000	0.000	0.015	my5740_rel_native_lto.cz10a_u
0.000	0.000	99.870	0.130	0.001	0.000	0.000	0.000	0.000	0.000	0.028	my8033_rel_native_lto.cz10a_u
qp100.L2
- qp100.L2: point queries with 100 insert/s per client
- Legend for results is here.
- Each entry lists the percentage of responses that fit in that bucket (slower than max time for previous bucket, faster than min time for next bucket).
Query response time histogram
256us	1ms	4ms	16ms	64ms	256ms	1s	4s	16s	gt	max	tag
85.887	13.908	0.153	0.051	0.001	0.000	0.000	0.000	0.000	0.000	0.024	my5651_rel_native_lto.cz10a_u
62.622	37.330	0.048	nonzero	nonzero	0.000	0.000	0.000	0.000	0.000	0.021	my5740_rel_native_lto.cz10a_u
21.079	78.861	0.060	0.001	nonzero	0.000	0.000	0.000	0.000	0.000	0.025	my8033_rel_native_lto.cz10a_u
Insert response time histogram
256us	1ms	4ms	16ms	64ms	256ms	1s	4s	16s	gt	max	tag
0.000	0.000	60.241	39.610	0.149	0.000	0.000	0.000	0.000	0.000	0.027	my5651_rel_native_lto.cz10a_u
0.000	0.000	66.678	33.321	0.001	0.000	0.000	0.000	0.000	0.000	0.038	my5740_rel_native_lto.cz10a_u
0.000	0.000	73.248	26.752	0.001	0.000	0.000	0.000	0.000	0.000	0.018	my8033_rel_native_lto.cz10a_u
Delete response time histogram
256us	1ms	4ms	16ms	64ms	256ms	1s	4s	16s	gt	max	tag
0.000	0.000	81.377	18.523	0.100	0.000	0.000	0.000	0.000	0.000	0.026	my5651_rel_native_lto.cz10a_u
0.000	0.000	88.749	11.251	0.001	0.000	0.000	0.000	0.000	0.000	0.016	my5740_rel_native_lto.cz10a_u
0.000	0.000	99.895	0.104	0.001	0.000	0.000	0.000	0.000	0.000	0.019	my8033_rel_native_lto.cz10a_u
qr500.L3
- qr500.L3: range queries with 500 insert/s per client
- Legend for results is here.
- Each entry lists the percentage of responses that fit in that bucket (slower than max time for previous bucket, faster than min time for next bucket).
Query response time histogram
256us	1ms	4ms	16ms	64ms	256ms	1s	4s	16s	gt	max	tag
95.335	4.572	0.069	0.024	nonzero	0.000	0.000	0.000	0.000	0.000	0.042	my5651_rel_native_lto.cz10a_u
82.547	16.773	0.676	0.004	nonzero	0.000	0.000	0.000	0.000	0.000	0.026	my5740_rel_native_lto.cz10a_u
70.795	25.796	3.405	0.003	nonzero	0.000	0.000	0.000	0.000	0.000	0.023	my8033_rel_native_lto.cz10a_u
Insert response time histogram
256us	1ms	4ms	16ms	64ms	256ms	1s	4s	16s	gt	max	tag
0.000	0.000	2.101	39.850	58.046	0.003	0.000	0.000	0.000	0.000	0.088	my5651_rel_native_lto.cz10a_u
0.000	0.000	41.927	58.069	0.005	0.000	0.000	0.000	0.000	0.000	0.025	my5740_rel_native_lto.cz10a_u
0.000	0.000	91.798	8.202	nonzero	0.000	0.000	0.000	0.000	0.000	0.023	my8033_rel_native_lto.cz10a_u
Delete response time histogram
256us	1ms	4ms	16ms	64ms	256ms	1s	4s	16s	gt	max	tag
0.000	0.000	3.354	44.295	52.348	0.003	0.000	0.000	0.000	0.000	0.084	my5651_rel_native_lto.cz10a_u
0.000	0.000	55.288	44.708	0.004	0.000	0.000	0.000	0.000	0.000	0.023	my5740_rel_native_lto.cz10a_u
0.000	0.000	99.951	0.048	0.001	0.000	0.000	0.000	0.000	0.000	0.021	my8033_rel_native_lto.cz10a_u
qp500.L4
- qp500.L4: point queries with 500 insert/s per client
- Legend for results is here.
- Each entry lists the percentage of responses that fit in that bucket (slower than max time for previous bucket, faster than min time for next bucket).
Query response time histogram
256us	1ms	4ms	16ms	64ms	256ms	1s	4s	16s	gt	max	tag
82.804	17.090	0.077	0.028	nonzero	nonzero	0.000	0.000	0.000	0.000	0.078	my5651_rel_native_lto.cz10a_u
71.065	28.923	0.009	0.002	nonzero	0.000	0.000	0.000	0.000	0.000	0.027	my5740_rel_native_lto.cz10a_u
34.524	65.465	0.011	nonzero	nonzero	0.000	0.000	0.000	0.000	0.000	0.018	my8033_rel_native_lto.cz10a_u
Insert response time histogram
256us	1ms	4ms	16ms	64ms	256ms	1s	4s	16s	gt	max	tag
0.000	0.000	2.234	49.030	48.733	0.003	0.000	0.000	0.000	0.000	0.108	my5651_rel_native_lto.cz10a_u
0.000	0.000	9.903	89.808	0.289	0.000	0.000	0.000	0.000	0.000	0.041	my5740_rel_native_lto.cz10a_u
0.000	0.000	39.626	60.368	0.006	0.000	0.000	0.000	0.000	0.000	0.023	my8033_rel_native_lto.cz10a_u
Delete response time histogram
256us	1ms	4ms	16ms	64ms	256ms	1s	4s	16s	gt	max	tag
0.000	0.000	3.508	54.798	41.692	0.003	0.000	0.000	0.000	0.000	0.113	my5651_rel_native_lto.cz10a_u
0.000	0.000	14.295	85.492	0.213	0.000	0.000	0.000	0.000	0.000	0.040	my5740_rel_native_lto.cz10a_u
0.000	0.000	93.311	6.686	0.002	0.000	0.000	0.000	0.000	0.000	0.023	my8033_rel_native_lto.cz10a_u
qr1000.L5
- qr1000.L5: range queries with 1000 insert/s per client
- Legend for results is here.
- Each entry lists the percentage of responses that fit in that bucket (slower than max time for previous bucket, faster than min time for next bucket).
Query response time histogram
256us	1ms	4ms	16ms	64ms	256ms	1s	4s	16s	gt	max	tag
87.377	12.271	0.309	0.041	0.002	0.000	0.000	0.000	0.000	0.000	0.032	my5651_rel_native_lto.cz10a_u
88.155	11.770	0.056	0.018	nonzero	0.000	0.000	0.000	0.000	0.000	0.046	my5740_rel_native_lto.cz10a_u
76.713	23.227	0.059	0.001	nonzero	0.000	0.000	0.000	0.000	0.000	0.020	my8033_rel_native_lto.cz10a_u
Insert response time histogram
256us	1ms	4ms	16ms	64ms	256ms	1s	4s	16s	gt	max	tag
0.000	0.000	0.406	14.269	85.325	nonzero	0.000	0.000	0.000	0.000	0.080	my5651_rel_native_lto.cz10a_u
0.000	0.000	1.892	94.396	3.712	0.000	0.000	0.000	0.000	0.000	0.049	my5740_rel_native_lto.cz10a_u
0.000	0.000	14.831	85.116	0.053	0.000	0.000	0.000	0.000	0.000	0.032	my8033_rel_native_lto.cz10a_u
Delete response time histogram
256us	1ms	4ms	16ms	64ms	256ms	1s	4s	16s	gt	max	tag
0.000	0.000	0.262	15.495	84.243	nonzero	0.000	0.000	0.000	0.000	0.066	my5651_rel_native_lto.cz10a_u
0.000	0.000	1.491	95.832	2.677	0.000	0.000	0.000	0.000	0.000	0.051	my5740_rel_native_lto.cz10a_u
0.000	0.000	51.852	48.117	0.031	0.000	0.000	0.000	0.000	0.000	0.033	my8033_rel_native_lto.cz10a_u
qp1000.L6
- qp1000.L6: point queries with 1000 insert/s per client
- Legend for results is here.
- Each entry lists the percentage of responses that fit in that bucket (slower than max time for previous bucket, faster than min time for next bucket).
Query response time histogram
256us	1ms	4ms	16ms	64ms	256ms	1s	4s	16s	gt	max	tag
67.905	31.747	0.304	0.041	0.002	0.000	0.000	0.000	0.000	0.000	0.039	my5651_rel_native_lto.cz10a_u
62.336	37.584	0.061	0.019	nonzero	0.000	0.000	0.000	0.000	0.000	0.026	my5740_rel_native_lto.cz10a_u
31.272	68.652	0.075	0.002	nonzero	0.000	0.000	0.000	0.000	0.000	0.022	my8033_rel_native_lto.cz10a_u
Insert response time histogram
256us	1ms	4ms	16ms	64ms	256ms	1s	4s	16s	gt	max	tag
0.000	0.000	0.549	23.969	75.480	0.002	0.000	0.000	0.000	0.000	0.105	my5651_rel_native_lto.cz10a_u
0.000	0.000	2.719	94.300	2.980	0.001	0.000	0.000	0.000	0.000	0.081	my5740_rel_native_lto.cz10a_u
0.000	0.000	14.859	85.089	0.052	0.000	0.000	0.000	0.000	0.000	0.034	my8033_rel_native_lto.cz10a_u
Delete response time histogram
256us	1ms	4ms	16ms	64ms	256ms	1s	4s	16s	gt	max	tag
0.000	0.000	0.380	28.677	70.941	0.002	0.000	0.000	0.000	0.000	0.107	my5651_rel_native_lto.cz10a_u
0.000	0.000	2.390	95.498	2.111	0.001	0.000	0.000	0.000	0.000	0.078	my5740_rel_native_lto.cz10a_u
0.000	0.000	55.892	44.078	0.030	0.000	0.000	0.000	0.000	0.000	0.035	my8033_rel_native_lto.cz10a_u