Introduction
This is a report for the insert benchmark with 20M docs and 1 client(s). It is generated by scripts (bash, awk, sed) and Tufte might not be impressed. An overview of the insert benchmark is here and a short update is here. Below, by DBMS, I mean DBMS+version.config. An example is my8020.c10b40 where my means MySQL, 8020 is version 8.0.20 and c10b40 is the name for the configuration file.
The test server has 8 AMD cores, 16G RAM and an NVMe SSD. It is described here as the Beelink. The benchmark was run with 1 client and there were 1 or 3 connections per client (1 for queries or inserts without rate limits, 1+1 for rate limited inserts+deletes). It uses 1 table. It loads 20M rows per table without secondary indexes, creates secondary indexes, then inserts 50M rows per table with a delete per insert to avoid growing the table. It then does 3 read+write tests for 1800s each that do queries as fast as possible with 100, 500 and then 1000 inserts/second/client concurrent with the queries and 1000 deletes/second to avoid growing the table. The database is cached by InnoDB. Clients and the DBMS share one server. The per-database configs are in the per-database subdirectories here.
The tested DBMS are:
- my5621_rel.cz10a_bee - MySQL 5.6.21 with InnoDB, rel build, cz10a_bee config
- my5651_rel.cz10a_bee - MySQL 5.6.51 with InnoDB, rel build, cz10a_bee config
Contents
- Summary
- l.i0: load without secondary indexes
- l.x: create secondary indexes
- l.i1: continue load after secondary indexes created
- q100.1: range queries with 100 insert/s per client
- q500.1: range queries with 500 insert/s per client
- q1000.1: range queries with 1000 insert/s per client
Summary
The numbers are inserts/s for l.i0 and l.i1, indexed docs (or rows) /s for l.x and queries/s for q*.2. The values are the average rate over the entire test for inserts (IPS) and queries (QPS). The range of values for IPS and QPS is split into 3 parts: bottom 25%, middle 50%, top 25%. Values in the bottom 25% have a red background, values in the top 25% have a green background and values in the middle have no color. A gray background is used for values that can be ignored because the DBMS did not sustain the target insert rate. Red backgrounds are not used when the minimum value is within 80% of the max value.
| dbms | l.i0 | l.x | l.i1 | q100.1 | q500.1 | q1000.1 |
|---|---|---|---|---|---|---|
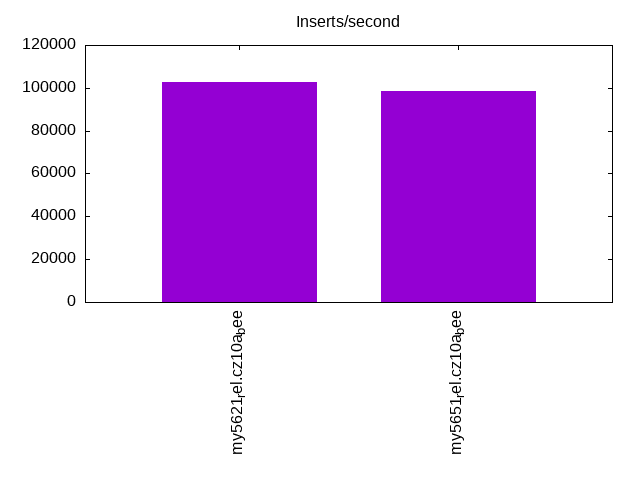
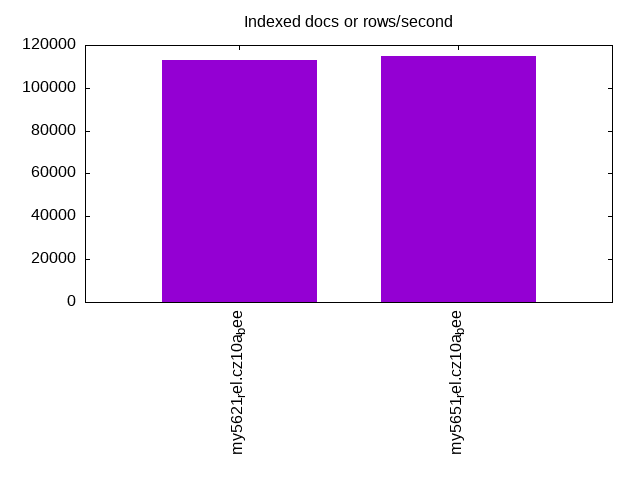
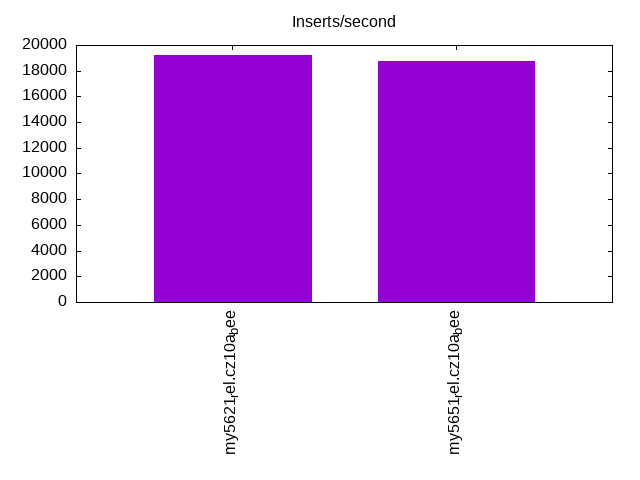
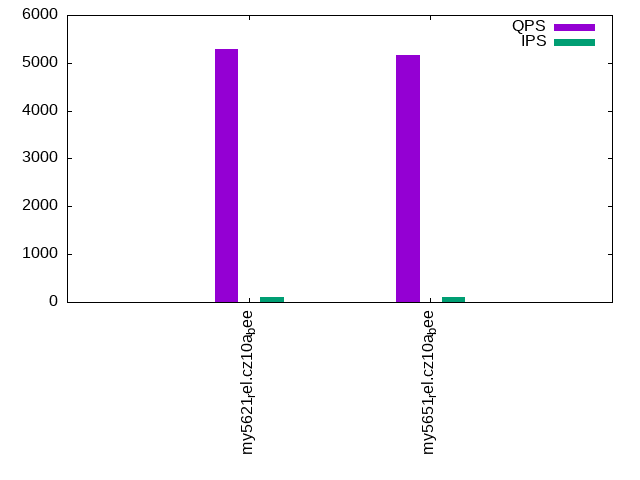
| my5621_rel.cz10a_bee | 102564 | 112921 | 19231 | 5292 | 5306 | 5271 |
| my5651_rel.cz10a_bee | 98522 | 114857 | 18720 | 5168 | 5146 | 5186 |
This table has relative throughput, throughput for the DBMS relative to the DBMS in the first line, using the absolute throughput from the previous table. Values less than 0.95 have a yellow background. Values greater than 1.05 have a blue background.
| dbms | l.i0 | l.x | l.i1 | q100.1 | q500.1 | q1000.1 |
|---|---|---|---|---|---|---|
| my5621_rel.cz10a_bee | 1.00 | 1.00 | 1.00 | 1.00 | 1.00 | 1.00 |
| my5651_rel.cz10a_bee | 0.96 | 1.02 | 0.97 | 0.98 | 0.97 | 0.98 |
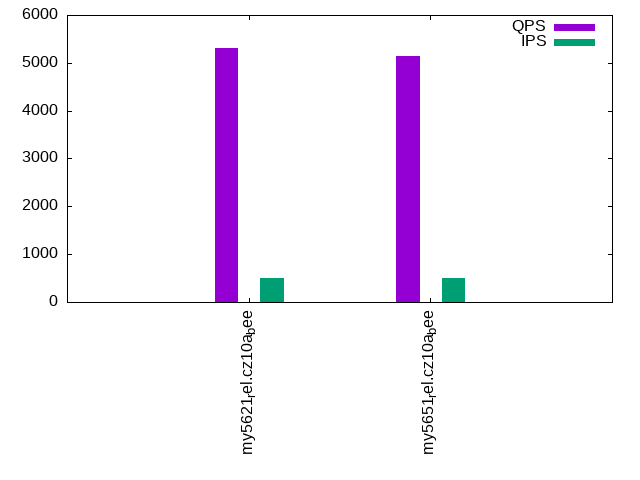
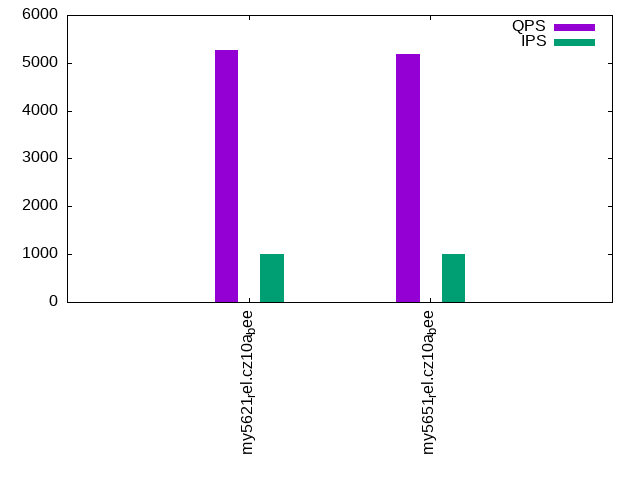
This lists the average rate of inserts/s for the tests that do inserts concurrent with queries. For such tests the query rate is listed in the table above. The read+write tests are setup so that the insert rate should match the target rate every second. Cells that are not at least 95% of the target have a red background to indicate a failure to satisfy the target.
| dbms | q100.1 | q500.1 | q1000.1 |
|---|---|---|---|
| my5621_rel.cz10a_bee | 100 | 498 | 997 |
| my5651_rel.cz10a_bee | 100 | 498 | 996 |
| target | 100 | 500 | 1000 |
l.i0
l.i0: load without secondary indexes. Graphs for performance per 1-second interval are here.
Average throughput:
Insert response time histogram: each cell has the percentage of responses that take <= the time in the header and max is the max response time in seconds. For the max column values in the top 25% of the range have a red background and in the bottom 25% of the range have a green background. The red background is not used when the min value is within 80% of the max value.
| dbms | 256us | 1ms | 4ms | 16ms | 64ms | 256ms | 1s | 4s | 16s | gt | max |
|---|---|---|---|---|---|---|---|---|---|---|---|
| my5621_rel.cz10a_bee | 94.466 | 5.423 | 0.107 | 0.001 | 0.003 | 0.097 | |||||
| my5651_rel.cz10a_bee | 89.182 | 10.700 | 0.112 | 0.003 | 0.003 | 0.098 |
Performance metrics for the DBMS listed above. Some are normalized by throughput, others are not. Legend for results is here.
ips	qps	rps	rmbps	wps	wmbps	rpq	rkbpq	wpi	wkbpi	csps	cpups	cspq	cpupq	dbgb1	dbgb2	rss	maxop	p50	p99	tag
102564	0	901	3.5	210.6	28.2	0.009	0.035	0.002	0.282	12208	22.0	0.119	17	1.3	17.8	1.9	0.097	103293	86261	20m.my5621_rel.cz10a_bee
98522	0	865	3.4	251.0	28.5	0.009	0.035	0.003	0.296	11638	21.7	0.118	18	1.3	17.8	1.9	0.098	99142	87407	20m.my5651_rel.cz10a_bee
l.x
l.x: create secondary indexes.
Average throughput:
Performance metrics for the DBMS listed above. Some are normalized by throughput, others are not. Legend for results is here.
ips	qps	rps	rmbps	wps	wmbps	rpq	rkbpq	wpi	wkbpi	csps	cpups	cspq	cpupq	dbgb1	dbgb2	rss	maxop	p50	p99	tag
112921	0	16	0.1	922.3	106.7	0.000	0.001	0.008	0.968	2272	11.6	0.020	8	2.7	19.2	3.0	0.009	NA	NA	20m.my5621_rel.cz10a_bee
114857	0	18	0.1	903.1	106.3	0.000	0.001	0.008	0.947	2274	11.4	0.020	8	2.7	19.2	3.2	0.009	NA	NA	20m.my5651_rel.cz10a_bee
l.i1
l.i1: continue load after secondary indexes created. Graphs for performance per 1-second interval are here.
Average throughput:
Insert response time histogram: each cell has the percentage of responses that take <= the time in the header and max is the max response time in seconds. For the max column values in the top 25% of the range have a red background and in the bottom 25% of the range have a green background. The red background is not used when the min value is within 80% of the max value.
| dbms | 256us | 1ms | 4ms | 16ms | 64ms | 256ms | 1s | 4s | 16s | gt | max |
|---|---|---|---|---|---|---|---|---|---|---|---|
| my5621_rel.cz10a_bee | 95.231 | 4.579 | 0.188 | 0.002 | 0.109 | ||||||
| my5651_rel.cz10a_bee | 94.966 | 4.834 | 0.199 | 0.001 | 0.099 |
Delete response time histogram: each cell has the percentage of responses that take <= the time in the header and max is the max response time in seconds. For the max column values in the top 25% of the range have a red background and in the bottom 25% of the range have a green background. The red background is not used when the min value is within 80% of the max value.
| dbms | 256us | 1ms | 4ms | 16ms | 64ms | 256ms | 1s | 4s | 16s | gt | max |
|---|---|---|---|---|---|---|---|---|---|---|---|
| my5621_rel.cz10a_bee | 96.314 | 3.542 | 0.143 | 0.001 | 0.083 | ||||||
| my5651_rel.cz10a_bee | 96.214 | 3.639 | 0.147 | 0.001 | 0.076 |
Performance metrics for the DBMS listed above. Some are normalized by throughput, others are not. Legend for results is here.
ips	qps	rps	rmbps	wps	wmbps	rpq	rkbpq	wpi	wkbpi	csps	cpups	cspq	cpupq	dbgb1	dbgb2	rss	maxop	p50	p99	tag
19231	0	645	2.5	1693.5	75.3	0.034	0.134	0.088	4.008	15342	34.2	0.798	142	3.8	20.3	4.5	0.109	20527	4997	20m.my5621_rel.cz10a_bee
18720	0	624	2.4	1662.9	73.8	0.033	0.133	0.089	4.036	14861	33.9	0.794	145	3.8	20.3	4.5	0.099	19977	4795	20m.my5651_rel.cz10a_bee
q100.1
q100.1: range queries with 100 insert/s per client. Graphs for performance per 1-second interval are here.
Average throughput:
Query response time histogram: each cell has the percentage of responses that take <= the time in the header and max is the max response time in seconds. For max values in the top 25% of the range have a red background and in the bottom 25% of the range have a green background. The red background is not used when the min value is within 80% of the max value.
| dbms | 256us | 1ms | 4ms | 16ms | 64ms | 256ms | 1s | 4s | 16s | gt | max |
|---|---|---|---|---|---|---|---|---|---|---|---|
| my5621_rel.cz10a_bee | 94.681 | 5.313 | 0.003 | 0.003 | nonzero | 0.017 | |||||
| my5651_rel.cz10a_bee | 93.406 | 6.589 | 0.002 | 0.003 | nonzero | 0.018 |
Insert response time histogram: each cell has the percentage of responses that take <= the time in the header and max is the max response time in seconds. For max values in the top 25% of the range have a red background and in the bottom 25% of the range have a green background. The red background is not used when the min value is within 80% of the max value.
| dbms | 256us | 1ms | 4ms | 16ms | 64ms | 256ms | 1s | 4s | 16s | gt | max |
|---|---|---|---|---|---|---|---|---|---|---|---|
| my5621_rel.cz10a_bee | 50.611 | 48.278 | 1.111 | 0.033 | |||||||
| my5651_rel.cz10a_bee | 54.083 | 44.778 | 1.139 | 0.028 |
Delete response time histogram: each cell has the percentage of responses that take <= the time in the header and max is the max response time in seconds. For max values in the top 25% of the range have a red background and in the bottom 25% of the range have a green background. The red background is not used when the min value is within 80% of the max value.
| dbms | 256us | 1ms | 4ms | 16ms | 64ms | 256ms | 1s | 4s | 16s | gt | max |
|---|---|---|---|---|---|---|---|---|---|---|---|
| my5621_rel.cz10a_bee | 52.167 | 47.194 | 0.639 | 0.031 | |||||||
| my5651_rel.cz10a_bee | 55.889 | 43.667 | 0.444 | 0.025 |
Performance metrics for the DBMS listed above. Some are normalized by throughput, others are not. Legend for results is here.
ips	qps	rps	rmbps	wps	wmbps	rpq	rkbpq	wpi	wkbpi	csps	cpups	cspq	cpupq	dbgb1	dbgb2	rss	maxop	p50	p99	tag
100	5292	4	0.0	659.3	19.8	0.001	0.003	6.613	203.099	22405	13.2	4.234	200	3.8	20.3	4.5	0.017	5322	4842	20m.my5621_rel.cz10a_bee
100	5168	4	0.0	679.5	20.4	0.001	0.003	6.808	209.216	21877	13.1	4.233	203	3.8	20.3	4.5	0.018	5195	4684	20m.my5651_rel.cz10a_bee
q500.1
q500.1: range queries with 500 insert/s per client. Graphs for performance per 1-second interval are here.
Average throughput:
Query response time histogram: each cell has the percentage of responses that take <= the time in the header and max is the max response time in seconds. For max values in the top 25% of the range have a red background and in the bottom 25% of the range have a green background. The red background is not used when the min value is within 80% of the max value.
| dbms | 256us | 1ms | 4ms | 16ms | 64ms | 256ms | 1s | 4s | 16s | gt | max |
|---|---|---|---|---|---|---|---|---|---|---|---|
| my5621_rel.cz10a_bee | 94.655 | 5.340 | 0.002 | 0.003 | 0.011 | ||||||
| my5651_rel.cz10a_bee | 92.901 | 7.094 | 0.002 | 0.003 | 0.012 |
Insert response time histogram: each cell has the percentage of responses that take <= the time in the header and max is the max response time in seconds. For max values in the top 25% of the range have a red background and in the bottom 25% of the range have a green background. The red background is not used when the min value is within 80% of the max value.
| dbms | 256us | 1ms | 4ms | 16ms | 64ms | 256ms | 1s | 4s | 16s | gt | max |
|---|---|---|---|---|---|---|---|---|---|---|---|
| my5621_rel.cz10a_bee | 90.000 | 9.922 | 0.078 | 0.023 | |||||||
| my5651_rel.cz10a_bee | 89.994 | 9.906 | 0.100 | 0.018 |
Delete response time histogram: each cell has the percentage of responses that take <= the time in the header and max is the max response time in seconds. For max values in the top 25% of the range have a red background and in the bottom 25% of the range have a green background. The red background is not used when the min value is within 80% of the max value.
| dbms | 256us | 1ms | 4ms | 16ms | 64ms | 256ms | 1s | 4s | 16s | gt | max |
|---|---|---|---|---|---|---|---|---|---|---|---|
| my5621_rel.cz10a_bee | 90.389 | 9.567 | 0.044 | 0.022 | |||||||
| my5651_rel.cz10a_bee | 90.161 | 9.806 | 0.033 | 0.018 |
Performance metrics for the DBMS listed above. Some are normalized by throughput, others are not. Legend for results is here.
ips	qps	rps	rmbps	wps	wmbps	rpq	rkbpq	wpi	wkbpi	csps	cpups	cspq	cpupq	dbgb1	dbgb2	rss	maxop	p50	p99	tag
498	5306	17	0.1	158.6	5.2	0.003	0.013	0.318	10.771	21265	13.5	4.008	204	3.8	20.3	4.5	0.011	5337	4842	20m.my5621_rel.cz10a_bee
498	5146	16	0.1	61.3	2.3	0.003	0.013	0.123	4.756	20394	13.5	3.963	210	3.8	20.3	4.5	0.012	5179	4649	20m.my5651_rel.cz10a_bee
q1000.1
q1000.1: range queries with 1000 insert/s per client. Graphs for performance per 1-second interval are here.
Average throughput:
Query response time histogram: each cell has the percentage of responses that take <= the time in the header and max is the max response time in seconds. For max values in the top 25% of the range have a red background and in the bottom 25% of the range have a green background. The red background is not used when the min value is within 80% of the max value.
| dbms | 256us | 1ms | 4ms | 16ms | 64ms | 256ms | 1s | 4s | 16s | gt | max |
|---|---|---|---|---|---|---|---|---|---|---|---|
| my5621_rel.cz10a_bee | 94.222 | 5.771 | 0.005 | 0.003 | 0.015 | ||||||
| my5651_rel.cz10a_bee | 93.153 | 6.840 | 0.004 | 0.003 | nonzero | 0.016 |
Insert response time histogram: each cell has the percentage of responses that take <= the time in the header and max is the max response time in seconds. For max values in the top 25% of the range have a red background and in the bottom 25% of the range have a green background. The red background is not used when the min value is within 80% of the max value.
| dbms | 256us | 1ms | 4ms | 16ms | 64ms | 256ms | 1s | 4s | 16s | gt | max |
|---|---|---|---|---|---|---|---|---|---|---|---|
| my5621_rel.cz10a_bee | 92.283 | 7.642 | 0.075 | 0.040 | |||||||
| my5651_rel.cz10a_bee | 92.847 | 7.064 | 0.089 | 0.040 |
Delete response time histogram: each cell has the percentage of responses that take <= the time in the header and max is the max response time in seconds. For max values in the top 25% of the range have a red background and in the bottom 25% of the range have a green background. The red background is not used when the min value is within 80% of the max value.
| dbms | 256us | 1ms | 4ms | 16ms | 64ms | 256ms | 1s | 4s | 16s | gt | max |
|---|---|---|---|---|---|---|---|---|---|---|---|
| my5621_rel.cz10a_bee | 92.889 | 7.083 | 0.028 | 0.019 | |||||||
| my5651_rel.cz10a_bee | 93.497 | 6.464 | 0.039 | 0.026 |
Performance metrics for the DBMS listed above. Some are normalized by throughput, others are not. Legend for results is here.
ips	qps	rps	rmbps	wps	wmbps	rpq	rkbpq	wpi	wkbpi	csps	cpups	cspq	cpupq	dbgb1	dbgb2	rss	maxop	p50	p99	tag
997	5271	33	0.1	429.4	13.9	0.006	0.025	0.431	14.240	22082	14.7	4.189	223	3.8	20.3	4.5	0.015	5290	4794	20m.my5621_rel.cz10a_bee
996	5186	33	0.1	516.2	16.5	0.006	0.025	0.518	16.950	21942	14.7	4.231	227	3.8	20.3	4.5	0.016	5212	4683	20m.my5651_rel.cz10a_bee
l.i0
l.i0: load without secondary indexes
Performance metrics for all DBMS, not just the ones listed above. Some are normalized by throughput, others are not. Legend for results is here.
ips	qps	rps	rmbps	wps	wmbps	rpq	rkbpq	wpi	wkbpi	csps	cpups	cspq	cpupq	dbgb1	dbgb2	rss	maxop	p50	p99	tag
102564	0	901	3.5	210.6	28.2	0.009	0.035	0.002	0.282	12208	22.0	0.119	17	1.3	17.8	1.9	0.097	103293	86261	20m.my5621_rel.cz10a_bee
98522	0	865	3.4	251.0	28.5	0.009	0.035	0.003	0.296	11638	21.7	0.118	18	1.3	17.8	1.9	0.098	99142	87407	20m.my5651_rel.cz10a_bee
l.x
l.x: create secondary indexes
Performance metrics for all DBMS, not just the ones listed above. Some are normalized by throughput, others are not. Legend for results is here.
ips	qps	rps	rmbps	wps	wmbps	rpq	rkbpq	wpi	wkbpi	csps	cpups	cspq	cpupq	dbgb1	dbgb2	rss	maxop	p50	p99	tag
112921	0	16	0.1	922.3	106.7	0.000	0.001	0.008	0.968	2272	11.6	0.020	8	2.7	19.2	3.0	0.009	NA	NA	20m.my5621_rel.cz10a_bee
114857	0	18	0.1	903.1	106.3	0.000	0.001	0.008	0.947	2274	11.4	0.020	8	2.7	19.2	3.2	0.009	NA	NA	20m.my5651_rel.cz10a_bee
l.i1
l.i1: continue load after secondary indexes created
Performance metrics for all DBMS, not just the ones listed above. Some are normalized by throughput, others are not. Legend for results is here.
ips	qps	rps	rmbps	wps	wmbps	rpq	rkbpq	wpi	wkbpi	csps	cpups	cspq	cpupq	dbgb1	dbgb2	rss	maxop	p50	p99	tag
19231	0	645	2.5	1693.5	75.3	0.034	0.134	0.088	4.008	15342	34.2	0.798	142	3.8	20.3	4.5	0.109	20527	4997	20m.my5621_rel.cz10a_bee
18720	0	624	2.4	1662.9	73.8	0.033	0.133	0.089	4.036	14861	33.9	0.794	145	3.8	20.3	4.5	0.099	19977	4795	20m.my5651_rel.cz10a_bee
q100.1
q100.1: range queries with 100 insert/s per client
Performance metrics for all DBMS, not just the ones listed above. Some are normalized by throughput, others are not. Legend for results is here.
ips	qps	rps	rmbps	wps	wmbps	rpq	rkbpq	wpi	wkbpi	csps	cpups	cspq	cpupq	dbgb1	dbgb2	rss	maxop	p50	p99	tag
100	5292	4	0.0	659.3	19.8	0.001	0.003	6.613	203.099	22405	13.2	4.234	200	3.8	20.3	4.5	0.017	5322	4842	20m.my5621_rel.cz10a_bee
100	5168	4	0.0	679.5	20.4	0.001	0.003	6.808	209.216	21877	13.1	4.233	203	3.8	20.3	4.5	0.018	5195	4684	20m.my5651_rel.cz10a_bee
q500.1
q500.1: range queries with 500 insert/s per client
Performance metrics for all DBMS, not just the ones listed above. Some are normalized by throughput, others are not. Legend for results is here.
ips	qps	rps	rmbps	wps	wmbps	rpq	rkbpq	wpi	wkbpi	csps	cpups	cspq	cpupq	dbgb1	dbgb2	rss	maxop	p50	p99	tag
498	5306	17	0.1	158.6	5.2	0.003	0.013	0.318	10.771	21265	13.5	4.008	204	3.8	20.3	4.5	0.011	5337	4842	20m.my5621_rel.cz10a_bee
498	5146	16	0.1	61.3	2.3	0.003	0.013	0.123	4.756	20394	13.5	3.963	210	3.8	20.3	4.5	0.012	5179	4649	20m.my5651_rel.cz10a_bee
q1000.1
q1000.1: range queries with 1000 insert/s per client
Performance metrics for all DBMS, not just the ones listed above. Some are normalized by throughput, others are not. Legend for results is here.
ips	qps	rps	rmbps	wps	wmbps	rpq	rkbpq	wpi	wkbpi	csps	cpups	cspq	cpupq	dbgb1	dbgb2	rss	maxop	p50	p99	tag
997	5271	33	0.1	429.4	13.9	0.006	0.025	0.431	14.240	22082	14.7	4.189	223	3.8	20.3	4.5	0.015	5290	4794	20m.my5621_rel.cz10a_bee
996	5186	33	0.1	516.2	16.5	0.006	0.025	0.518	16.950	21942	14.7	4.231	227	3.8	20.3	4.5	0.016	5212	4683	20m.my5651_rel.cz10a_bee
l.i0
- l.i0: load without secondary indexes
- Legend for results is here.
- Each entry lists the percentage of responses that fit in that bucket (slower than max time for previous bucket, faster than min time for next bucket).
Insert response time histogram
256us	1ms	4ms	16ms	64ms	256ms	1s	4s	16s	gt	max	tag
0.000	94.466	5.423	0.107	0.001	0.003	0.000	0.000	0.000	0.000	0.097	my5621_rel.cz10a_bee
0.000	89.182	10.700	0.112	0.003	0.003	0.000	0.000	0.000	0.000	0.098	my5651_rel.cz10a_bee
l.x
- l.x: create secondary indexes
- Legend for results is here.
- Each entry lists the percentage of responses that fit in that bucket (slower than max time for previous bucket, faster than min time for next bucket).
TODO - determine whether there is data for create index response time
l.i1
- l.i1: continue load after secondary indexes created
- Legend for results is here.
- Each entry lists the percentage of responses that fit in that bucket (slower than max time for previous bucket, faster than min time for next bucket).
Insert response time histogram
256us	1ms	4ms	16ms	64ms	256ms	1s	4s	16s	gt	max	tag
0.000	0.000	95.231	4.579	0.188	0.002	0.000	0.000	0.000	0.000	0.109	my5621_rel.cz10a_bee
0.000	0.000	94.966	4.834	0.199	0.001	0.000	0.000	0.000	0.000	0.099	my5651_rel.cz10a_bee
Delete response time histogram
256us	1ms	4ms	16ms	64ms	256ms	1s	4s	16s	gt	max	tag
0.000	0.000	96.314	3.542	0.143	0.001	0.000	0.000	0.000	0.000	0.083	my5621_rel.cz10a_bee
0.000	0.000	96.214	3.639	0.147	0.001	0.000	0.000	0.000	0.000	0.076	my5651_rel.cz10a_bee
q100.1
- q100.1: range queries with 100 insert/s per client
- Legend for results is here.
- Each entry lists the percentage of responses that fit in that bucket (slower than max time for previous bucket, faster than min time for next bucket).
Query response time histogram
256us	1ms	4ms	16ms	64ms	256ms	1s	4s	16s	gt	max	tag
94.681	5.313	0.003	0.003	nonzero	0.000	0.000	0.000	0.000	0.000	0.017	my5621_rel.cz10a_bee
93.406	6.589	0.002	0.003	nonzero	0.000	0.000	0.000	0.000	0.000	0.018	my5651_rel.cz10a_bee
Insert response time histogram
256us	1ms	4ms	16ms	64ms	256ms	1s	4s	16s	gt	max	tag
0.000	0.000	50.611	48.278	1.111	0.000	0.000	0.000	0.000	0.000	0.033	my5621_rel.cz10a_bee
0.000	0.000	54.083	44.778	1.139	0.000	0.000	0.000	0.000	0.000	0.028	my5651_rel.cz10a_bee
Delete response time histogram
256us	1ms	4ms	16ms	64ms	256ms	1s	4s	16s	gt	max	tag
0.000	0.000	52.167	47.194	0.639	0.000	0.000	0.000	0.000	0.000	0.031	my5621_rel.cz10a_bee
0.000	0.000	55.889	43.667	0.444	0.000	0.000	0.000	0.000	0.000	0.025	my5651_rel.cz10a_bee
q500.1
- q500.1: range queries with 500 insert/s per client
- Legend for results is here.
- Each entry lists the percentage of responses that fit in that bucket (slower than max time for previous bucket, faster than min time for next bucket).
Query response time histogram
256us	1ms	4ms	16ms	64ms	256ms	1s	4s	16s	gt	max	tag
94.655	5.340	0.002	0.003	0.000	0.000	0.000	0.000	0.000	0.000	0.011	my5621_rel.cz10a_bee
92.901	7.094	0.002	0.003	0.000	0.000	0.000	0.000	0.000	0.000	0.012	my5651_rel.cz10a_bee
Insert response time histogram
256us	1ms	4ms	16ms	64ms	256ms	1s	4s	16s	gt	max	tag
0.000	0.000	90.000	9.922	0.078	0.000	0.000	0.000	0.000	0.000	0.023	my5621_rel.cz10a_bee
0.000	0.000	89.994	9.906	0.100	0.000	0.000	0.000	0.000	0.000	0.018	my5651_rel.cz10a_bee
Delete response time histogram
256us	1ms	4ms	16ms	64ms	256ms	1s	4s	16s	gt	max	tag
0.000	0.000	90.389	9.567	0.044	0.000	0.000	0.000	0.000	0.000	0.022	my5621_rel.cz10a_bee
0.000	0.000	90.161	9.806	0.033	0.000	0.000	0.000	0.000	0.000	0.018	my5651_rel.cz10a_bee
q1000.1
- q1000.1: range queries with 1000 insert/s per client
- Legend for results is here.
- Each entry lists the percentage of responses that fit in that bucket (slower than max time for previous bucket, faster than min time for next bucket).
Query response time histogram
256us	1ms	4ms	16ms	64ms	256ms	1s	4s	16s	gt	max	tag
94.222	5.771	0.005	0.003	0.000	0.000	0.000	0.000	0.000	0.000	0.015	my5621_rel.cz10a_bee
93.153	6.840	0.004	0.003	nonzero	0.000	0.000	0.000	0.000	0.000	0.016	my5651_rel.cz10a_bee
Insert response time histogram
256us	1ms	4ms	16ms	64ms	256ms	1s	4s	16s	gt	max	tag
0.000	0.000	92.283	7.642	0.075	0.000	0.000	0.000	0.000	0.000	0.040	my5621_rel.cz10a_bee
0.000	0.000	92.847	7.064	0.089	0.000	0.000	0.000	0.000	0.000	0.040	my5651_rel.cz10a_bee
Delete response time histogram
256us	1ms	4ms	16ms	64ms	256ms	1s	4s	16s	gt	max	tag
0.000	0.000	92.889	7.083	0.028	0.000	0.000	0.000	0.000	0.000	0.019	my5621_rel.cz10a_bee
0.000	0.000	93.497	6.464	0.039	0.000	0.000	0.000	0.000	0.000	0.026	my5651_rel.cz10a_bee