Introduction
This is a report for the insert benchmark with 1600M docs and 8 client(s). It is generated by scripts (bash, awk, sed) and Tufte might not be impressed. An overview of the insert benchmark is here and a short update is here. Below, by DBMS, I mean DBMS+version.config. An example is my8020.c10b40 where my means MySQL, 8020 is version 8.0.20 and c10b40 is the name for the configuration file.
The test server is a c2-standard-30 with 15 cores, hyperthreads disabled, 120G RAM and XFS with SW RAID 0 across 4 NVMe SSD. The benchmark was run with 8 clients and there were 1 or 3 connections per client (1 for queries or inserts without rate limits, 1+1 for rate limited inserts+deletes). It uses 8 tables, 1 per client. It loads 500M rows per table without secondary indexes, creates secondary indexes, then inserts 60M rows per table with a delete per insert to avoid growing the table. It then does 3 read+write tests for 7200s each that do queries as fast as possible with 100, 500 and then 1000 inserts/second/client concurrent with the queries. There are also deletes to match the inserts and avoid growing the table. The database is larger than memory. Clients and the DBMS share one server. The per-database configs are in the per-database subdirectories here.
The tested DBMS are:
- pg160_o2_nofp.cx7a28_gcp_c2s30 - Postgres 16.0, o2_nofp build, cx7a28_gcp_c2s30 config
- pg16oriole_o2_nofp_patches16_18.cx7a28_gcp_c2s30 - OrioleDB with Postgres 16.0 at patches16_18, o2_nofp build, cx7a28_gcp_c2s30 config
Contents
- Summary
- l.i0: load without secondary indexes
- l.x: create secondary indexes
- l.i1: continue load after secondary indexes created
- q100.1: range queries with 100 insert/s per client
- q500.1: range queries with 500 insert/s per client
- q1000.1: range queries with 1000 insert/s per client
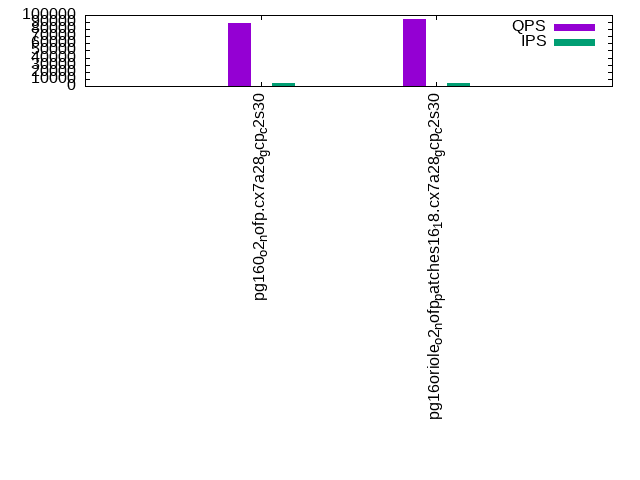
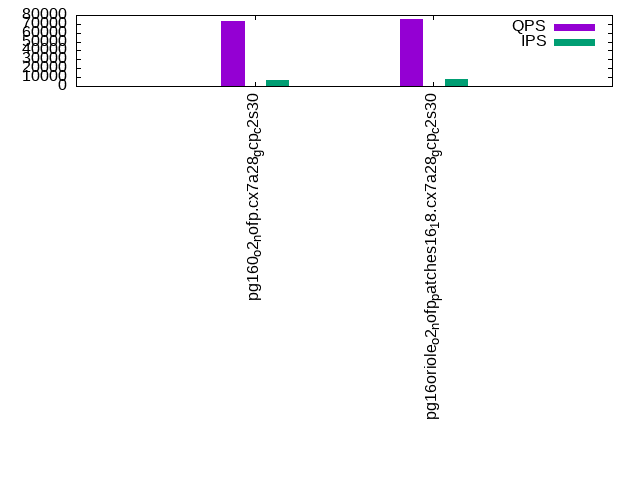
Summary
The numbers are inserts/s for l.i0 and l.i1, indexed docs (or rows) /s for l.x and queries/s for q*.2. The values are the average rate over the entire test for inserts (IPS) and queries (QPS). The range of values for IPS and QPS is split into 3 parts: bottom 25%, middle 50%, top 25%. Values in the bottom 25% have a red background, values in the top 25% have a green background and values in the middle have no color. A gray background is used for values that can be ignored because the DBMS did not sustain the target insert rate. Red backgrounds are not used when the minimum value is within 80% of the max value.
| dbms | l.i0 | l.x | l.i1 | q100.1 | q500.1 | q1000.1 |
|---|---|---|---|---|---|---|
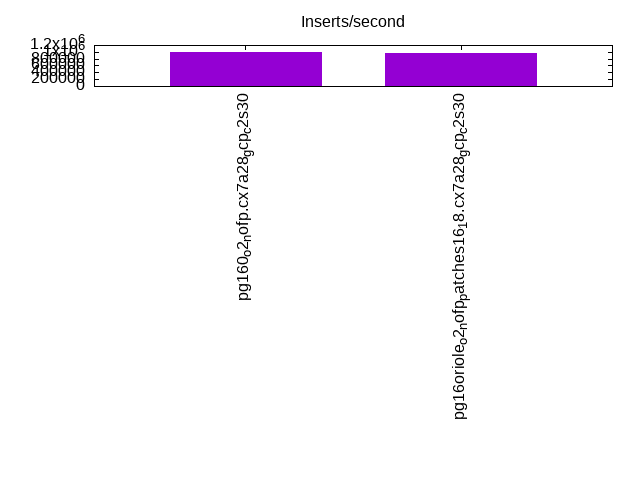
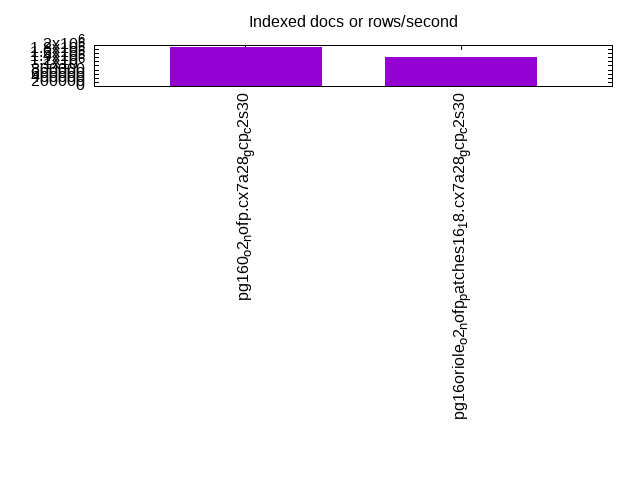
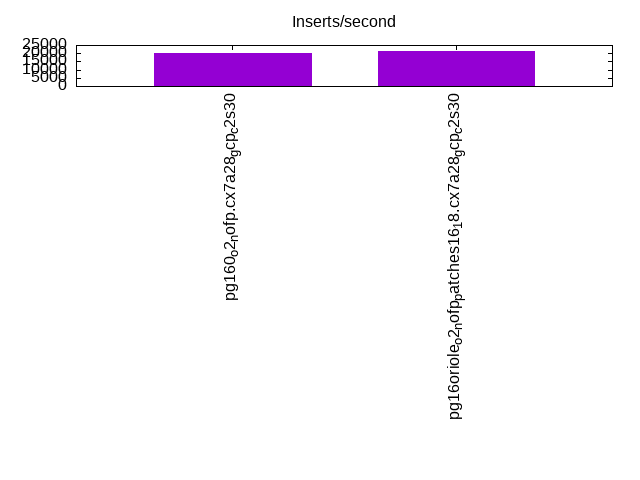
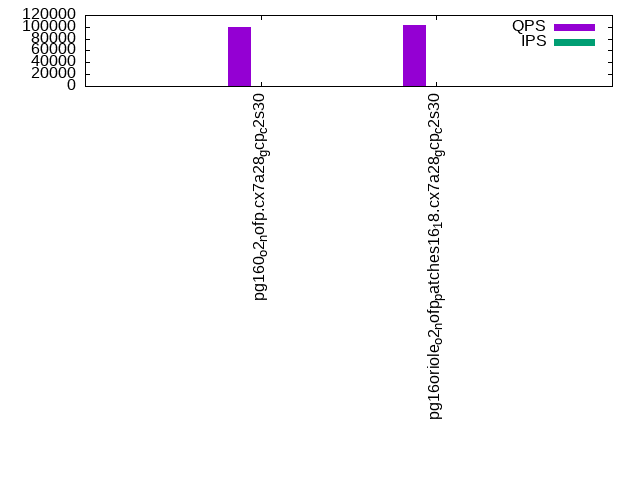
| pg160_o2_nofp.cx7a28_gcp_c2s30 | 1005657 | 1900356 | 20193 | 99854 | 88431 | 73651 |
| pg16oriole_o2_nofp_patches16_18.cx7a28_gcp_c2s30 | 977398 | 1395030 | 21069 | 102862 | 94107 | 75419 |
This table has relative throughput, throughput for the DBMS relative to the DBMS in the first line, using the absolute throughput from the previous table. Values less than 0.95 have a yellow background. Values greater than 1.05 have a blue background.
| dbms | l.i0 | l.x | l.i1 | q100.1 | q500.1 | q1000.1 |
|---|---|---|---|---|---|---|
| pg160_o2_nofp.cx7a28_gcp_c2s30 | 1.00 | 1.00 | 1.00 | 1.00 | 1.00 | 1.00 |
| pg16oriole_o2_nofp_patches16_18.cx7a28_gcp_c2s30 | 0.97 | 0.73 | 1.04 | 1.03 | 1.06 | 1.02 |
This lists the average rate of inserts/s for the tests that do inserts concurrent with queries. For such tests the query rate is listed in the table above. The read+write tests are setup so that the insert rate should match the target rate every second. Cells that are not at least 95% of the target have a red background to indicate a failure to satisfy the target.
| dbms | q100.1 | q500.1 | q1000.1 |
|---|---|---|---|
| pg160_o2_nofp.cx7a28_gcp_c2s30 | 798 | 3976 | 6646 |
| pg16oriole_o2_nofp_patches16_18.cx7a28_gcp_c2s30 | 798 | 3992 | 7981 |
| target | 800 | 4000 | 8000 |
l.i0
l.i0: load without secondary indexes. Graphs for performance per 1-second interval are here.
Average throughput:
Insert response time histogram: each cell has the percentage of responses that take <= the time in the header and max is the max response time in seconds. For the max column values in the top 25% of the range have a red background and in the bottom 25% of the range have a green background. The red background is not used when the min value is within 80% of the max value.
| dbms | 256us | 1ms | 4ms | 16ms | 64ms | 256ms | 1s | 4s | 16s | gt | max |
|---|---|---|---|---|---|---|---|---|---|---|---|
| pg160_o2_nofp.cx7a28_gcp_c2s30 | 97.784 | 2.189 | 0.018 | 0.004 | 0.005 | 0.001 | 0.567 | ||||
| pg16oriole_o2_nofp_patches16_18.cx7a28_gcp_c2s30 | 98.954 | 1.014 | 0.007 | nonzero | 0.024 | nonzero | nonzero | 1.569 |
Performance metrics for the DBMS listed above. Some are normalized by throughput, others are not. Legend for results is here.
ips	qps	rps	rmbps	wps	wmbps	rpq	rkbpq	wpi	wkbpi	csps	cpups	cspq	cpupq	dbgb1	dbgb2	rss	maxop	p50	p99	tag
1005657	0	327	2.6	1167.8	236.0	0.000	0.003	0.001	0.240	91308	81.3	0.091	12	153.1	185.1	4.8	0.567	128703	83109	1600m.pg160_o2_nofp.cx7a28_gcp_c2s30
977398	0	0	0.0	465.9	155.4	0.000	0.000	0.000	0.163	93049	79.6	0.095	12	0.0	183.5	34.0	1.569	126105	96095	1600m.pg16oriole_o2_nofp_patches16_18.cx7a28_gcp_c2s30
l.x
l.x: create secondary indexes.
Average throughput:
Performance metrics for the DBMS listed above. Some are normalized by throughput, others are not. Legend for results is here.
ips	qps	rps	rmbps	wps	wmbps	rpq	rkbpq	wpi	wkbpi	csps	cpups	cspq	cpupq	dbgb1	dbgb2	rss	maxop	p50	p99	tag
1900356	0	1533	484.4	1294.1	271.4	0.001	0.261	0.001	0.146	31489	39.8	0.017	3	294.1	326.1	40.9	0.002	NA	NA	1600m.pg160_o2_nofp.cx7a28_gcp_c2s30
1395030	0	6815	321.8	1749.0	448.4	0.005	0.236	0.001	0.329	19416	37.7	0.014	4	0.0	388.5	31.7	0.002	NA	NA	1600m.pg16oriole_o2_nofp_patches16_18.cx7a28_gcp_c2s30
l.i1
l.i1: continue load after secondary indexes created. Graphs for performance per 1-second interval are here.
Average throughput:
Insert response time histogram: each cell has the percentage of responses that take <= the time in the header and max is the max response time in seconds. For the max column values in the top 25% of the range have a red background and in the bottom 25% of the range have a green background. The red background is not used when the min value is within 80% of the max value.
| dbms | 256us | 1ms | 4ms | 16ms | 64ms | 256ms | 1s | 4s | 16s | gt | max |
|---|---|---|---|---|---|---|---|---|---|---|---|
| pg160_o2_nofp.cx7a28_gcp_c2s30 | 79.059 | 17.628 | 3.181 | 0.129 | 0.002 | nonzero | nonzero | 18.071 | |||
| pg16oriole_o2_nofp_patches16_18.cx7a28_gcp_c2s30 | 63.141 | 36.414 | 0.437 | 0.008 | nonzero | 2.781 |
Delete response time histogram: each cell has the percentage of responses that take <= the time in the header and max is the max response time in seconds. For the max column values in the top 25% of the range have a red background and in the bottom 25% of the range have a green background. The red background is not used when the min value is within 80% of the max value.
| dbms | 256us | 1ms | 4ms | 16ms | 64ms | 256ms | 1s | 4s | 16s | gt | max |
|---|---|---|---|---|---|---|---|---|---|---|---|
| pg160_o2_nofp.cx7a28_gcp_c2s30 | 76.510 | 1.732 | 2.118 | 4.350 | 4.387 | 10.901 | 0.003 | nonzero | nonzero | 36.810 | |
| pg16oriole_o2_nofp_patches16_18.cx7a28_gcp_c2s30 | 67.372 | 32.211 | 0.408 | 0.008 | nonzero | 1.862 |
Performance metrics for the DBMS listed above. Some are normalized by throughput, others are not. Legend for results is here.
ips	qps	rps	rmbps	wps	wmbps	rpq	rkbpq	wpi	wkbpi	csps	cpups	cspq	cpupq	dbgb1	dbgb2	rss	maxop	p50	p99	tag
20193	0	4334	66.1	14101.6	322.0	0.215	3.354	0.698	16.329	19314	42.4	0.956	315	333.4	365.4	57.0	18.071	549	350	1600m.pg160_o2_nofp.cx7a28_gcp_c2s30
21069	0	60200	495.0	56006.2	543.7	2.857	24.060	2.658	26.423	129711	28.5	6.156	203	0.0	864.7	71.2	2.781	2697	1249	1600m.pg16oriole_o2_nofp_patches16_18.cx7a28_gcp_c2s30
q100.1
q100.1: range queries with 100 insert/s per client. Graphs for performance per 1-second interval are here.
Average throughput:
Query response time histogram: each cell has the percentage of responses that take <= the time in the header and max is the max response time in seconds. For max values in the top 25% of the range have a red background and in the bottom 25% of the range have a green background. The red background is not used when the min value is within 80% of the max value.
| dbms | 256us | 1ms | 4ms | 16ms | 64ms | 256ms | 1s | 4s | 16s | gt | max |
|---|---|---|---|---|---|---|---|---|---|---|---|
| pg160_o2_nofp.cx7a28_gcp_c2s30 | 99.923 | 0.076 | nonzero | nonzero | nonzero | nonzero | 0.139 | ||||
| pg16oriole_o2_nofp_patches16_18.cx7a28_gcp_c2s30 | 99.899 | 0.095 | 0.006 | nonzero | nonzero | nonzero | nonzero | 0.603 |
Insert response time histogram: each cell has the percentage of responses that take <= the time in the header and max is the max response time in seconds. For max values in the top 25% of the range have a red background and in the bottom 25% of the range have a green background. The red background is not used when the min value is within 80% of the max value.
| dbms | 256us | 1ms | 4ms | 16ms | 64ms | 256ms | 1s | 4s | 16s | gt | max |
|---|---|---|---|---|---|---|---|---|---|---|---|
| pg160_o2_nofp.cx7a28_gcp_c2s30 | 6.847 | 73.957 | 19.193 | 0.003 | 0.173 | ||||||
| pg16oriole_o2_nofp_patches16_18.cx7a28_gcp_c2s30 | 64.571 | 35.009 | 0.393 | 0.027 | 0.615 |
Delete response time histogram: each cell has the percentage of responses that take <= the time in the header and max is the max response time in seconds. For max values in the top 25% of the range have a red background and in the bottom 25% of the range have a green background. The red background is not used when the min value is within 80% of the max value.
| dbms | 256us | 1ms | 4ms | 16ms | 64ms | 256ms | 1s | 4s | 16s | gt | max |
|---|---|---|---|---|---|---|---|---|---|---|---|
| pg160_o2_nofp.cx7a28_gcp_c2s30 | 49.765 | 38.961 | 5.327 | 5.944 | 0.003 | 0.038 | |||||
| pg16oriole_o2_nofp_patches16_18.cx7a28_gcp_c2s30 | 75.060 | 24.540 | 0.368 | 0.032 | 0.521 |
Performance metrics for the DBMS listed above. Some are normalized by throughput, others are not. Legend for results is here.
ips	qps	rps	rmbps	wps	wmbps	rpq	rkbpq	wpi	wkbpi	csps	cpups	cspq	cpupq	dbgb1	dbgb2	rss	maxop	p50	p99	tag
798	99854	859	7.7	1631.2	23.8	0.009	0.079	2.043	30.509	383714	53.4	3.843	80	333.6	365.7	70.9	0.139	12423	12195	1600m.pg160_o2_nofp.cx7a28_gcp_c2s30
798	102862	2594	20.7	1099.6	25.3	0.025	0.206	1.377	32.500	397644	54.0	3.866	79	0.0	831.8	71.2	0.603	13042	10357	1600m.pg16oriole_o2_nofp_patches16_18.cx7a28_gcp_c2s30
q500.1
q500.1: range queries with 500 insert/s per client. Graphs for performance per 1-second interval are here.
Average throughput:
Query response time histogram: each cell has the percentage of responses that take <= the time in the header and max is the max response time in seconds. For max values in the top 25% of the range have a red background and in the bottom 25% of the range have a green background. The red background is not used when the min value is within 80% of the max value.
| dbms | 256us | 1ms | 4ms | 16ms | 64ms | 256ms | 1s | 4s | 16s | gt | max |
|---|---|---|---|---|---|---|---|---|---|---|---|
| pg160_o2_nofp.cx7a28_gcp_c2s30 | 99.823 | 0.174 | 0.002 | nonzero | nonzero | 0.028 | |||||
| pg16oriole_o2_nofp_patches16_18.cx7a28_gcp_c2s30 | 99.742 | 0.249 | 0.007 | 0.002 | nonzero | nonzero | 0.236 |
Insert response time histogram: each cell has the percentage of responses that take <= the time in the header and max is the max response time in seconds. For max values in the top 25% of the range have a red background and in the bottom 25% of the range have a green background. The red background is not used when the min value is within 80% of the max value.
| dbms | 256us | 1ms | 4ms | 16ms | 64ms | 256ms | 1s | 4s | 16s | gt | max |
|---|---|---|---|---|---|---|---|---|---|---|---|
| pg160_o2_nofp.cx7a28_gcp_c2s30 | 98.130 | 1.870 | 0.060 | ||||||||
| pg16oriole_o2_nofp_patches16_18.cx7a28_gcp_c2s30 | 48.142 | 51.088 | 0.756 | 0.013 | 0.459 |
Delete response time histogram: each cell has the percentage of responses that take <= the time in the header and max is the max response time in seconds. For max values in the top 25% of the range have a red background and in the bottom 25% of the range have a green background. The red background is not used when the min value is within 80% of the max value.
| dbms | 256us | 1ms | 4ms | 16ms | 64ms | 256ms | 1s | 4s | 16s | gt | max |
|---|---|---|---|---|---|---|---|---|---|---|---|
| pg160_o2_nofp.cx7a28_gcp_c2s30 | 70.374 | 8.829 | 0.145 | 2.848 | 17.803 | 0.001 | nonzero | 33.199 | |||
| pg16oriole_o2_nofp_patches16_18.cx7a28_gcp_c2s30 | 60.317 | 38.943 | 0.729 | 0.012 | 0.587 |
Performance metrics for the DBMS listed above. Some are normalized by throughput, others are not. Legend for results is here.
ips	qps	rps	rmbps	wps	wmbps	rpq	rkbpq	wpi	wkbpi	csps	cpups	cspq	cpupq	dbgb1	dbgb2	rss	maxop	p50	p99	tag
3976	88431	3164	29.1	9017.1	123.3	0.036	0.337	2.268	31.752	337054	58.6	3.811	99	335.6	367.6	70.9	0.028	11113	9749	1600m.pg160_o2_nofp.cx7a28_gcp_c2s30
3992	94107	11618	92.7	9577.7	112.5	0.123	1.009	2.399	28.856	373803	58.0	3.972	92	0.0	847.1	71.2	0.236	11815	9877	1600m.pg16oriole_o2_nofp_patches16_18.cx7a28_gcp_c2s30
q1000.1
q1000.1: range queries with 1000 insert/s per client. Graphs for performance per 1-second interval are here.
Average throughput:
Query response time histogram: each cell has the percentage of responses that take <= the time in the header and max is the max response time in seconds. For max values in the top 25% of the range have a red background and in the bottom 25% of the range have a green background. The red background is not used when the min value is within 80% of the max value.
| dbms | 256us | 1ms | 4ms | 16ms | 64ms | 256ms | 1s | 4s | 16s | gt | max |
|---|---|---|---|---|---|---|---|---|---|---|---|
| pg160_o2_nofp.cx7a28_gcp_c2s30 | 99.642 | 0.351 | 0.006 | 0.001 | nonzero | nonzero | nonzero | nonzero | 1.415 | ||
| pg16oriole_o2_nofp_patches16_18.cx7a28_gcp_c2s30 | 98.566 | 1.382 | 0.039 | 0.013 | 0.001 | nonzero | nonzero | nonzero | 1.604 |
Insert response time histogram: each cell has the percentage of responses that take <= the time in the header and max is the max response time in seconds. For max values in the top 25% of the range have a red background and in the bottom 25% of the range have a green background. The red background is not used when the min value is within 80% of the max value.
| dbms | 256us | 1ms | 4ms | 16ms | 64ms | 256ms | 1s | 4s | 16s | gt | max |
|---|---|---|---|---|---|---|---|---|---|---|---|
| pg160_o2_nofp.cx7a28_gcp_c2s30 | 0.902 | 94.473 | 4.572 | 0.042 | 0.006 | 0.004 | 1.430 | ||||
| pg16oriole_o2_nofp_patches16_18.cx7a28_gcp_c2s30 | 55.475 | 43.638 | 0.878 | 0.009 | 0.001 | 1.653 |
Delete response time histogram: each cell has the percentage of responses that take <= the time in the header and max is the max response time in seconds. For max values in the top 25% of the range have a red background and in the bottom 25% of the range have a green background. The red background is not used when the min value is within 80% of the max value.
| dbms | 256us | 1ms | 4ms | 16ms | 64ms | 256ms | 1s | 4s | 16s | gt | max |
|---|---|---|---|---|---|---|---|---|---|---|---|
| pg160_o2_nofp.cx7a28_gcp_c2s30 | 68.543 | 12.008 | 0.761 | 1.774 | 5.667 | 11.245 | 0.001 | 0.001 | 1.472 | ||
| pg16oriole_o2_nofp_patches16_18.cx7a28_gcp_c2s30 | 67.307 | 31.826 | 0.858 | 0.008 | 0.001 | 1.647 |
Performance metrics for the DBMS listed above. Some are normalized by throughput, others are not. Legend for results is here.
ips	qps	rps	rmbps	wps	wmbps	rpq	rkbpq	wpi	wkbpi	csps	cpups	cspq	cpupq	dbgb1	dbgb2	rss	maxop	p50	p99	tag
6646	73651	5628	66.7	15836.0	222.2	0.076	0.927	2.383	34.237	253987	61.9	3.449	126	341.7	373.8	46.0	1.415	9925	8551	1600m.pg160_o2_nofp.cx7a28_gcp_c2s30
7981	75419	24001	192.3	24381.4	242.3	0.318	2.610	3.055	31.084	319685	62.9	4.239	125	0.0	905.4	72.1	1.604	9398	7751	1600m.pg16oriole_o2_nofp_patches16_18.cx7a28_gcp_c2s30
l.i0
l.i0: load without secondary indexes
Performance metrics for all DBMS, not just the ones listed above. Some are normalized by throughput, others are not. Legend for results is here.
ips	qps	rps	rmbps	wps	wmbps	rpq	rkbpq	wpi	wkbpi	csps	cpups	cspq	cpupq	dbgb1	dbgb2	rss	maxop	p50	p99	tag
1005657	0	327	2.6	1167.8	236.0	0.000	0.003	0.001	0.240	91308	81.3	0.091	12	153.1	185.1	4.8	0.567	128703	83109	1600m.pg160_o2_nofp.cx7a28_gcp_c2s30
977398	0	0	0.0	465.9	155.4	0.000	0.000	0.000	0.163	93049	79.6	0.095	12	0.0	183.5	34.0	1.569	126105	96095	1600m.pg16oriole_o2_nofp_patches16_18.cx7a28_gcp_c2s30
l.x
l.x: create secondary indexes
Performance metrics for all DBMS, not just the ones listed above. Some are normalized by throughput, others are not. Legend for results is here.
ips	qps	rps	rmbps	wps	wmbps	rpq	rkbpq	wpi	wkbpi	csps	cpups	cspq	cpupq	dbgb1	dbgb2	rss	maxop	p50	p99	tag
1900356	0	1533	484.4	1294.1	271.4	0.001	0.261	0.001	0.146	31489	39.8	0.017	3	294.1	326.1	40.9	0.002	NA	NA	1600m.pg160_o2_nofp.cx7a28_gcp_c2s30
1395030	0	6815	321.8	1749.0	448.4	0.005	0.236	0.001	0.329	19416	37.7	0.014	4	0.0	388.5	31.7	0.002	NA	NA	1600m.pg16oriole_o2_nofp_patches16_18.cx7a28_gcp_c2s30
l.i1
l.i1: continue load after secondary indexes created
Performance metrics for all DBMS, not just the ones listed above. Some are normalized by throughput, others are not. Legend for results is here.
ips	qps	rps	rmbps	wps	wmbps	rpq	rkbpq	wpi	wkbpi	csps	cpups	cspq	cpupq	dbgb1	dbgb2	rss	maxop	p50	p99	tag
20193	0	4334	66.1	14101.6	322.0	0.215	3.354	0.698	16.329	19314	42.4	0.956	315	333.4	365.4	57.0	18.071	549	350	1600m.pg160_o2_nofp.cx7a28_gcp_c2s30
21069	0	60200	495.0	56006.2	543.7	2.857	24.060	2.658	26.423	129711	28.5	6.156	203	0.0	864.7	71.2	2.781	2697	1249	1600m.pg16oriole_o2_nofp_patches16_18.cx7a28_gcp_c2s30
q100.1
q100.1: range queries with 100 insert/s per client
Performance metrics for all DBMS, not just the ones listed above. Some are normalized by throughput, others are not. Legend for results is here.
ips	qps	rps	rmbps	wps	wmbps	rpq	rkbpq	wpi	wkbpi	csps	cpups	cspq	cpupq	dbgb1	dbgb2	rss	maxop	p50	p99	tag
798	99854	859	7.7	1631.2	23.8	0.009	0.079	2.043	30.509	383714	53.4	3.843	80	333.6	365.7	70.9	0.139	12423	12195	1600m.pg160_o2_nofp.cx7a28_gcp_c2s30
798	102862	2594	20.7	1099.6	25.3	0.025	0.206	1.377	32.500	397644	54.0	3.866	79	0.0	831.8	71.2	0.603	13042	10357	1600m.pg16oriole_o2_nofp_patches16_18.cx7a28_gcp_c2s30
q500.1
q500.1: range queries with 500 insert/s per client
Performance metrics for all DBMS, not just the ones listed above. Some are normalized by throughput, others are not. Legend for results is here.
ips	qps	rps	rmbps	wps	wmbps	rpq	rkbpq	wpi	wkbpi	csps	cpups	cspq	cpupq	dbgb1	dbgb2	rss	maxop	p50	p99	tag
3976	88431	3164	29.1	9017.1	123.3	0.036	0.337	2.268	31.752	337054	58.6	3.811	99	335.6	367.6	70.9	0.028	11113	9749	1600m.pg160_o2_nofp.cx7a28_gcp_c2s30
3992	94107	11618	92.7	9577.7	112.5	0.123	1.009	2.399	28.856	373803	58.0	3.972	92	0.0	847.1	71.2	0.236	11815	9877	1600m.pg16oriole_o2_nofp_patches16_18.cx7a28_gcp_c2s30
q1000.1
q1000.1: range queries with 1000 insert/s per client
Performance metrics for all DBMS, not just the ones listed above. Some are normalized by throughput, others are not. Legend for results is here.
ips	qps	rps	rmbps	wps	wmbps	rpq	rkbpq	wpi	wkbpi	csps	cpups	cspq	cpupq	dbgb1	dbgb2	rss	maxop	p50	p99	tag
6646	73651	5628	66.7	15836.0	222.2	0.076	0.927	2.383	34.237	253987	61.9	3.449	126	341.7	373.8	46.0	1.415	9925	8551	1600m.pg160_o2_nofp.cx7a28_gcp_c2s30
7981	75419	24001	192.3	24381.4	242.3	0.318	2.610	3.055	31.084	319685	62.9	4.239	125	0.0	905.4	72.1	1.604	9398	7751	1600m.pg16oriole_o2_nofp_patches16_18.cx7a28_gcp_c2s30
l.i0
- l.i0: load without secondary indexes
- Legend for results is here.
- Each entry lists the percentage of responses that fit in that bucket (slower than max time for previous bucket, faster than min time for next bucket).
Insert response time histogram
256us	1ms	4ms	16ms	64ms	256ms	1s	4s	16s	gt	max	tag
0.000	97.784	2.189	0.018	0.004	0.005	0.001	0.000	0.000	0.000	0.567	pg160_o2_nofp.cx7a28_gcp_c2s30
0.000	98.954	1.014	0.007	nonzero	0.024	nonzero	nonzero	0.000	0.000	1.569	pg16oriole_o2_nofp_patches16_18.cx7a28_gcp_c2s30
l.x
- l.x: create secondary indexes
- Legend for results is here.
- Each entry lists the percentage of responses that fit in that bucket (slower than max time for previous bucket, faster than min time for next bucket).
TODO - determine whether there is data for create index response time
l.i1
- l.i1: continue load after secondary indexes created
- Legend for results is here.
- Each entry lists the percentage of responses that fit in that bucket (slower than max time for previous bucket, faster than min time for next bucket).
Insert response time histogram
256us	1ms	4ms	16ms	64ms	256ms	1s	4s	16s	gt	max	tag
0.000	0.000	79.059	17.628	3.181	0.129	0.002	0.000	nonzero	nonzero	18.071	pg160_o2_nofp.cx7a28_gcp_c2s30
0.000	0.000	0.000	63.141	36.414	0.437	0.008	nonzero	0.000	0.000	2.781	pg16oriole_o2_nofp_patches16_18.cx7a28_gcp_c2s30
Delete response time histogram
256us	1ms	4ms	16ms	64ms	256ms	1s	4s	16s	gt	max	tag
76.510	1.732	2.118	4.350	4.387	10.901	0.003	0.000	nonzero	nonzero	36.810	pg160_o2_nofp.cx7a28_gcp_c2s30
0.000	0.000	0.000	67.372	32.211	0.408	0.008	nonzero	0.000	0.000	1.862	pg16oriole_o2_nofp_patches16_18.cx7a28_gcp_c2s30
q100.1
- q100.1: range queries with 100 insert/s per client
- Legend for results is here.
- Each entry lists the percentage of responses that fit in that bucket (slower than max time for previous bucket, faster than min time for next bucket).
Query response time histogram
256us	1ms	4ms	16ms	64ms	256ms	1s	4s	16s	gt	max	tag
99.923	0.076	nonzero	nonzero	nonzero	nonzero	0.000	0.000	0.000	0.000	0.139	pg160_o2_nofp.cx7a28_gcp_c2s30
99.899	0.095	0.006	nonzero	nonzero	nonzero	nonzero	0.000	0.000	0.000	0.603	pg16oriole_o2_nofp_patches16_18.cx7a28_gcp_c2s30
Insert response time histogram
256us	1ms	4ms	16ms	64ms	256ms	1s	4s	16s	gt	max	tag
0.000	0.000	6.847	73.957	19.193	0.003	0.000	0.000	0.000	0.000	0.173	pg160_o2_nofp.cx7a28_gcp_c2s30
0.000	0.000	0.000	64.571	35.009	0.393	0.027	0.000	0.000	0.000	0.615	pg16oriole_o2_nofp_patches16_18.cx7a28_gcp_c2s30
Delete response time histogram
256us	1ms	4ms	16ms	64ms	256ms	1s	4s	16s	gt	max	tag
49.765	38.961	5.327	5.944	0.003	0.000	0.000	0.000	0.000	0.000	0.038	pg160_o2_nofp.cx7a28_gcp_c2s30
0.000	0.000	0.000	75.060	24.540	0.368	0.032	0.000	0.000	0.000	0.521	pg16oriole_o2_nofp_patches16_18.cx7a28_gcp_c2s30
q500.1
- q500.1: range queries with 500 insert/s per client
- Legend for results is here.
- Each entry lists the percentage of responses that fit in that bucket (slower than max time for previous bucket, faster than min time for next bucket).
Query response time histogram
256us	1ms	4ms	16ms	64ms	256ms	1s	4s	16s	gt	max	tag
99.823	0.174	0.002	nonzero	nonzero	0.000	0.000	0.000	0.000	0.000	0.028	pg160_o2_nofp.cx7a28_gcp_c2s30
99.742	0.249	0.007	0.002	nonzero	nonzero	0.000	0.000	0.000	0.000	0.236	pg16oriole_o2_nofp_patches16_18.cx7a28_gcp_c2s30
Insert response time histogram
256us	1ms	4ms	16ms	64ms	256ms	1s	4s	16s	gt	max	tag
0.000	0.000	0.000	98.130	1.870	0.000	0.000	0.000	0.000	0.000	0.060	pg160_o2_nofp.cx7a28_gcp_c2s30
0.000	0.000	0.000	48.142	51.088	0.756	0.013	0.000	0.000	0.000	0.459	pg16oriole_o2_nofp_patches16_18.cx7a28_gcp_c2s30
Delete response time histogram
256us	1ms	4ms	16ms	64ms	256ms	1s	4s	16s	gt	max	tag
70.374	8.829	0.145	2.848	17.803	0.001	0.000	0.000	0.000	nonzero	33.199	pg160_o2_nofp.cx7a28_gcp_c2s30
0.000	0.000	0.000	60.317	38.943	0.729	0.012	0.000	0.000	0.000	0.587	pg16oriole_o2_nofp_patches16_18.cx7a28_gcp_c2s30
q1000.1
- q1000.1: range queries with 1000 insert/s per client
- Legend for results is here.
- Each entry lists the percentage of responses that fit in that bucket (slower than max time for previous bucket, faster than min time for next bucket).
Query response time histogram
256us	1ms	4ms	16ms	64ms	256ms	1s	4s	16s	gt	max	tag
99.642	0.351	0.006	0.001	nonzero	nonzero	nonzero	nonzero	0.000	0.000	1.415	pg160_o2_nofp.cx7a28_gcp_c2s30
98.566	1.382	0.039	0.013	0.001	nonzero	nonzero	nonzero	0.000	0.000	1.604	pg16oriole_o2_nofp_patches16_18.cx7a28_gcp_c2s30
Insert response time histogram
256us	1ms	4ms	16ms	64ms	256ms	1s	4s	16s	gt	max	tag
0.000	0.000	0.902	94.473	4.572	0.042	0.006	0.004	0.000	0.000	1.430	pg160_o2_nofp.cx7a28_gcp_c2s30
0.000	0.000	0.000	55.475	43.638	0.878	0.009	0.001	0.000	0.000	1.653	pg16oriole_o2_nofp_patches16_18.cx7a28_gcp_c2s30
Delete response time histogram
256us	1ms	4ms	16ms	64ms	256ms	1s	4s	16s	gt	max	tag
68.543	12.008	0.761	1.774	5.667	11.245	0.001	0.001	0.000	0.000	1.472	pg160_o2_nofp.cx7a28_gcp_c2s30
0.000	0.000	0.000	67.307	31.826	0.858	0.008	0.001	0.000	0.000	1.647	pg16oriole_o2_nofp_patches16_18.cx7a28_gcp_c2s30