Introduction
This is a report for the insert benchmark with 800M docs and 1 client(s). It is generated by scripts (bash, awk, sed) and Tufte might not be impressed. An overview of the insert benchmark is here and a short update is here. Below, by DBMS, I mean DBMS+version.config. An example is my8020.c10b40 where my means MySQL, 8020 is version 8.0.20 and c10b40 is the name for the configuration file.
The test server has 8 AMD cores, 16G RAM and an NVMe SSD. It is described here as the Beelink. The benchmark was run with 1 client and there were 1 or 3 connections per client (1 for queries or inserts without rate limits, 1+1 for rate limited inserts+deletes). It uses 1 table. It loads 800M rows per table without secondary indexes, creates secondary indexes, then inserts 30M rows per table with a delete per insert to avoid growing the table. It then does 3 read+write tests for 7200s each that do queries as fast as possible with 100, 500 and then 1000 inserts/second/client concurrent with the queries and 1000 deletes/second to avoid growing the table. The database is larger than memory.
The tested DBMS are:
- pg160_o2_nofp.cx9a2_bee - Postgres 16.0, o2_nofp build that used -O2 -nofp and the a2 config
- pg16oriole_o2_nofp_patches16_18.cx9a2_bee - OrioleDB with Postgres 16 at patches16_18, o2_nofp build that used -O2 -nofp and the a2 config
Contents
- Summary
- l.i0: load without secondary indexes
- l.x: create secondary indexes
- l.i1: continue load after secondary indexes created
- q100.1: range queries with 100 insert/s per client
- q500.1: range queries with 500 insert/s per client
- q1000.1: range queries with 1000 insert/s per client
Summary
The numbers are inserts/s for l.i0 and l.i1, indexed docs (or rows) /s for l.x and queries/s for q*.2. The values are the average rate over the entire test for inserts (IPS) and queries (QPS). The range of values for IPS and QPS is split into 3 parts: bottom 25%, middle 50%, top 25%. Values in the bottom 25% have a red background, values in the top 25% have a green background and values in the middle have no color. A gray background is used for values that can be ignored because the DBMS did not sustain the target insert rate. Red backgrounds are not used when the minimum value is within 80% of the max value.
| dbms | l.i0 | l.x | l.i1 | q100.1 | q500.1 | q1000.1 |
|---|---|---|---|---|---|---|
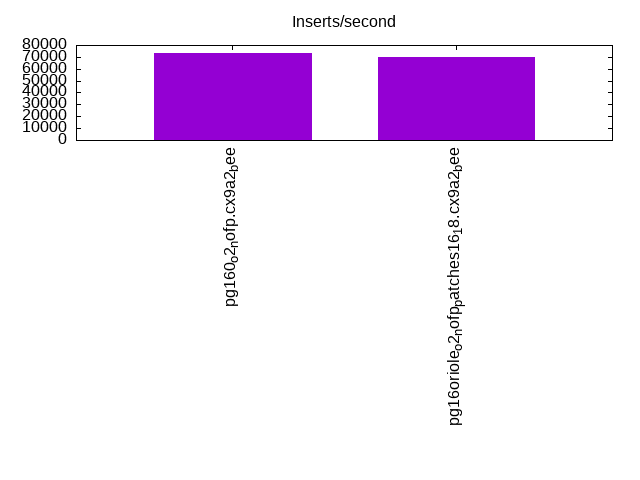
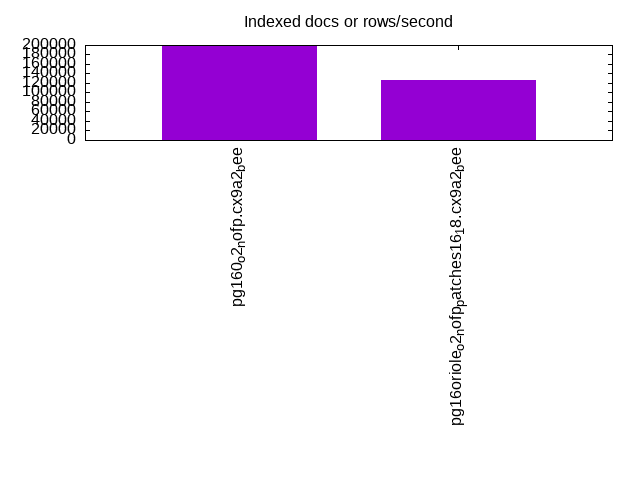
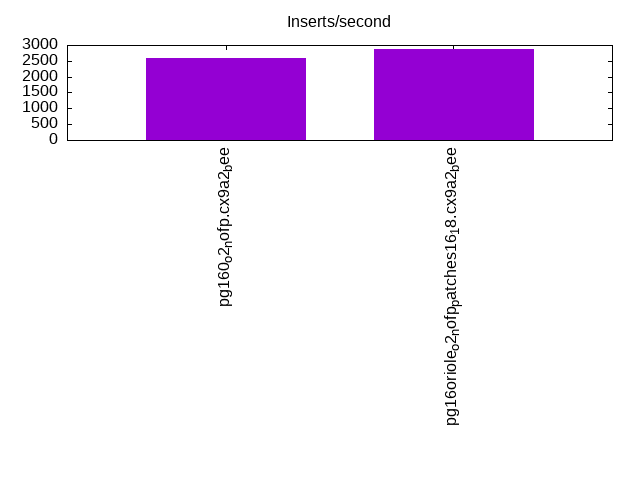
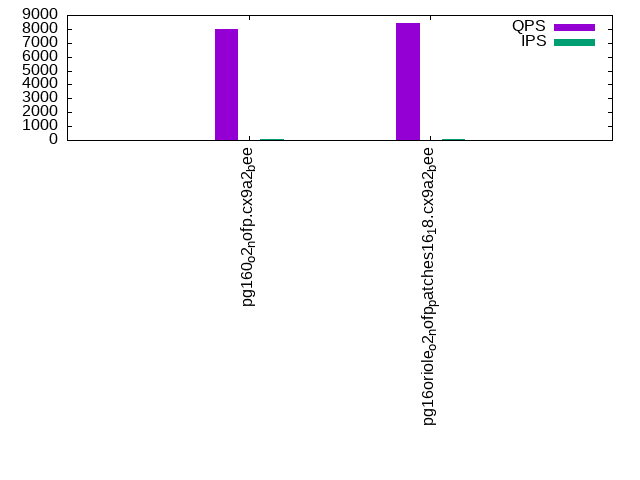
| pg160_o2_nofp.cx9a2_bee | 72946 | 197604 | 2583 | 8000 | 7594 | 7641 |
| pg16oriole_o2_nofp_patches16_18.cx9a2_bee | 69851 | 125309 | 2882 | 8456 | 8385 | 8016 |
This table has relative throughput, throughput for the DBMS relative to the DBMS in the first line, using the absolute throughput from the previous table. Values less than 0.95 have a yellow background. Values greater than 1.05 have a blue background.
| dbms | l.i0 | l.x | l.i1 | q100.1 | q500.1 | q1000.1 |
|---|---|---|---|---|---|---|
| pg160_o2_nofp.cx9a2_bee | 1.00 | 1.00 | 1.00 | 1.00 | 1.00 | 1.00 |
| pg16oriole_o2_nofp_patches16_18.cx9a2_bee | 0.96 | 0.63 | 1.12 | 1.06 | 1.10 | 1.05 |
This lists the average rate of inserts/s for the tests that do inserts concurrent with queries. For such tests the query rate is listed in the table above. The read+write tests are setup so that the insert rate should match the target rate every second. Cells that are not at least 95% of the target have a red background to indicate a failure to satisfy the target.
| dbms | q100.1 | q500.1 | q1000.1 |
|---|---|---|---|
| pg160_o2_nofp.cx9a2_bee | 100 | 499 | 663 |
| pg16oriole_o2_nofp_patches16_18.cx9a2_bee | 100 | 499 | 998 |
| target | 100 | 500 | 1000 |
l.i0
l.i0: load without secondary indexes. Graphs for performance per 1-second interval are here.
Average throughput:
Insert response time histogram: each cell has the percentage of responses that take <= the time in the header and max is the max response time in seconds. For the max column values in the top 25% of the range have a red background and in the bottom 25% of the range have a green background. The red background is not used when the min value is within 80% of the max value.
| dbms | 256us | 1ms | 4ms | 16ms | 64ms | 256ms | 1s | 4s | 16s | gt | max |
|---|---|---|---|---|---|---|---|---|---|---|---|
| pg160_o2_nofp.cx9a2_bee | 99.999 | 0.001 | nonzero | 0.060 | |||||||
| pg16oriole_o2_nofp_patches16_18.cx9a2_bee | 99.985 | nonzero | 0.015 | nonzero | 0.304 |
Performance metrics for the DBMS listed above. Some are normalized by throughput, others are not. Legend for results is here.
ips	qps	rps	rmbps	wps	wmbps	rpq	rkbpq	wpi	wkbpi	csps	cpups	cspq	cpupq	dbgb1	dbgb2	rss	maxop	p50	p99	tag
72946	0	32	0.3	105.6	30.2	0.000	0.004	0.001	0.423	8879	22.4	0.122	25	76.5	116.6	1.8	0.060	73120	71148	800m.pg160_o2_nofp.cx9a2_bee
69851	0	0	0.0	50.9	14.3	0.000	0.000	0.001	0.210	8123	22.6	0.116	26	0.0	82.6	9.5	0.304	70025	67525	800m.pg16oriole_o2_nofp_patches16_18.cx9a2_bee
l.x
l.x: create secondary indexes.
Average throughput:
Performance metrics for the DBMS listed above. Some are normalized by throughput, others are not. Legend for results is here.
ips	qps	rps	rmbps	wps	wmbps	rpq	rkbpq	wpi	wkbpi	csps	cpups	cspq	cpupq	dbgb1	dbgb2	rss	maxop	p50	p99	tag
197604	0	574	71.2	182.2	67.2	0.003	0.369	0.001	0.348	509	12.4	0.003	5	147.0	187.1	10.1	0.013	NA	NA	800m.pg160_o2_nofp.cx9a2_bee
125309	0	1016	89.4	237.1	68.4	0.008	0.730	0.002	0.559	1191	12.1	0.010	8	0.0	169.9	8.8	0.004	NA	NA	800m.pg16oriole_o2_nofp_patches16_18.cx9a2_bee
l.i1
l.i1: continue load after secondary indexes created. Graphs for performance per 1-second interval are here.
Average throughput:
Insert response time histogram: each cell has the percentage of responses that take <= the time in the header and max is the max response time in seconds. For the max column values in the top 25% of the range have a red background and in the bottom 25% of the range have a green background. The red background is not used when the min value is within 80% of the max value.
| dbms | 256us | 1ms | 4ms | 16ms | 64ms | 256ms | 1s | 4s | 16s | gt | max |
|---|---|---|---|---|---|---|---|---|---|---|---|
| pg160_o2_nofp.cx9a2_bee | 86.557 | 13.439 | 0.004 | 0.208 | |||||||
| pg16oriole_o2_nofp_patches16_18.cx9a2_bee | 54.536 | 44.541 | 0.922 | 0.001 | nonzero | 1.346 |
Delete response time histogram: each cell has the percentage of responses that take <= the time in the header and max is the max response time in seconds. For the max column values in the top 25% of the range have a red background and in the bottom 25% of the range have a green background. The red background is not used when the min value is within 80% of the max value.
| dbms | 256us | 1ms | 4ms | 16ms | 64ms | 256ms | 1s | 4s | 16s | gt | max |
|---|---|---|---|---|---|---|---|---|---|---|---|
| pg160_o2_nofp.cx9a2_bee | nonzero | 77.366 | 0.838 | 4.279 | 15.829 | 1.688 | 0.082 | ||||
| pg16oriole_o2_nofp_patches16_18.cx9a2_bee | 93.415 | 5.805 | 0.780 | nonzero | 0.264 |
Performance metrics for the DBMS listed above. Some are normalized by throughput, others are not. Legend for results is here.
ips	qps	rps	rmbps	wps	wmbps	rpq	rkbpq	wpi	wkbpi	csps	cpups	cspq	cpupq	dbgb1	dbgb2	rss	maxop	p50	p99	tag
2583	0	4118	32.9	4765.8	67.1	1.594	13.060	1.845	26.605	9757	10.5	3.777	325	152.2	192.2	1.3	0.208	3398	749	800m.pg160_o2_nofp.cx9a2_bee
2882	0	11412	90.2	9364.7	118.1	3.961	32.046	3.250	41.985	24232	13.7	8.410	380	0.0	352.5	8.6	1.346	2946	2099	800m.pg16oriole_o2_nofp_patches16_18.cx9a2_bee
q100.1
q100.1: range queries with 100 insert/s per client. Graphs for performance per 1-second interval are here.
Average throughput:
Query response time histogram: each cell has the percentage of responses that take <= the time in the header and max is the max response time in seconds. For max values in the top 25% of the range have a red background and in the bottom 25% of the range have a green background. The red background is not used when the min value is within 80% of the max value.
| dbms | 256us | 1ms | 4ms | 16ms | 64ms | 256ms | 1s | 4s | 16s | gt | max |
|---|---|---|---|---|---|---|---|---|---|---|---|
| pg160_o2_nofp.cx9a2_bee | 99.818 | 0.180 | nonzero | 0.002 | 0.016 | ||||||
| pg16oriole_o2_nofp_patches16_18.cx9a2_bee | 99.790 | 0.203 | 0.002 | 0.005 | nonzero | 0.046 |
Insert response time histogram: each cell has the percentage of responses that take <= the time in the header and max is the max response time in seconds. For max values in the top 25% of the range have a red background and in the bottom 25% of the range have a green background. The red background is not used when the min value is within 80% of the max value.
| dbms | 256us | 1ms | 4ms | 16ms | 64ms | 256ms | 1s | 4s | 16s | gt | max |
|---|---|---|---|---|---|---|---|---|---|---|---|
| pg160_o2_nofp.cx9a2_bee | 72.264 | 27.736 | 0.032 | ||||||||
| pg16oriole_o2_nofp_patches16_18.cx9a2_bee | 56.597 | 43.396 | 0.007 | 0.069 |
Delete response time histogram: each cell has the percentage of responses that take <= the time in the header and max is the max response time in seconds. For max values in the top 25% of the range have a red background and in the bottom 25% of the range have a green background. The red background is not used when the min value is within 80% of the max value.
| dbms | 256us | 1ms | 4ms | 16ms | 64ms | 256ms | 1s | 4s | 16s | gt | max |
|---|---|---|---|---|---|---|---|---|---|---|---|
| pg160_o2_nofp.cx9a2_bee | 0.111 | 99.507 | 0.042 | 0.340 | 0.010 | ||||||
| pg16oriole_o2_nofp_patches16_18.cx9a2_bee | 57.806 | 42.188 | 0.007 | 0.083 |
Performance metrics for the DBMS listed above. Some are normalized by throughput, others are not. Legend for results is here.
ips	qps	rps	rmbps	wps	wmbps	rpq	rkbpq	wpi	wkbpi	csps	cpups	cspq	cpupq	dbgb1	dbgb2	rss	maxop	p50	p99	tag
100	8000	174	1.4	202.2	3.4	0.022	0.178	2.026	34.689	31181	12.6	3.898	126	152.2	188.5	10.1	0.016	7527	6952	800m.pg160_o2_nofp.cx9a2_bee
100	8456	395	3.1	345.0	4.5	0.047	0.381	3.457	46.062	33346	12.8	3.944	121	0.0	347.1	9.5	0.046	8036	7130	800m.pg16oriole_o2_nofp_patches16_18.cx9a2_bee
q500.1
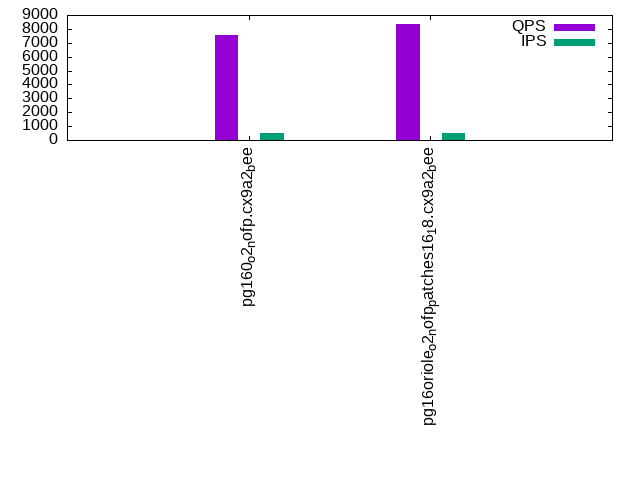
q500.1: range queries with 500 insert/s per client. Graphs for performance per 1-second interval are here.
Average throughput:
Query response time histogram: each cell has the percentage of responses that take <= the time in the header and max is the max response time in seconds. For max values in the top 25% of the range have a red background and in the bottom 25% of the range have a green background. The red background is not used when the min value is within 80% of the max value.
| dbms | 256us | 1ms | 4ms | 16ms | 64ms | 256ms | 1s | 4s | 16s | gt | max |
|---|---|---|---|---|---|---|---|---|---|---|---|
| pg160_o2_nofp.cx9a2_bee | 99.868 | 0.127 | 0.001 | 0.004 | nonzero | 0.016 | |||||
| pg16oriole_o2_nofp_patches16_18.cx9a2_bee | 99.580 | 0.411 | 0.006 | 0.004 | nonzero | 0.050 |
Insert response time histogram: each cell has the percentage of responses that take <= the time in the header and max is the max response time in seconds. For max values in the top 25% of the range have a red background and in the bottom 25% of the range have a green background. The red background is not used when the min value is within 80% of the max value.
| dbms | 256us | 1ms | 4ms | 16ms | 64ms | 256ms | 1s | 4s | 16s | gt | max |
|---|---|---|---|---|---|---|---|---|---|---|---|
| pg160_o2_nofp.cx9a2_bee | 93.549 | 6.451 | 0.030 | ||||||||
| pg16oriole_o2_nofp_patches16_18.cx9a2_bee | 95.465 | 4.438 | 0.097 | 0.166 |
Delete response time histogram: each cell has the percentage of responses that take <= the time in the header and max is the max response time in seconds. For max values in the top 25% of the range have a red background and in the bottom 25% of the range have a green background. The red background is not used when the min value is within 80% of the max value.
| dbms | 256us | 1ms | 4ms | 16ms | 64ms | 256ms | 1s | 4s | 16s | gt | max |
|---|---|---|---|---|---|---|---|---|---|---|---|
| pg160_o2_nofp.cx9a2_bee | 3.872 | 95.885 | 0.062 | 0.181 | 0.010 | ||||||
| pg16oriole_o2_nofp_patches16_18.cx9a2_bee | 95.894 | 4.019 | 0.086 | 0.132 |
Performance metrics for the DBMS listed above. Some are normalized by throughput, others are not. Legend for results is here.
ips	qps	rps	rmbps	wps	wmbps	rpq	rkbpq	wpi	wkbpi	csps	cpups	cspq	cpupq	dbgb1	dbgb2	rss	maxop	p50	p99	tag
499	7594	802	6.4	963.4	14.5	0.106	0.863	1.931	29.784	31080	13.6	4.093	143	152.3	182.8	10.1	0.016	7272	7016	800m.pg160_o2_nofp.cx9a2_bee
499	8385	1900	15.0	1563.3	17.8	0.227	1.826	3.133	36.490	36161	14.7	4.312	140	0.0	347.3	9.5	0.050	7848	7545	800m.pg16oriole_o2_nofp_patches16_18.cx9a2_bee
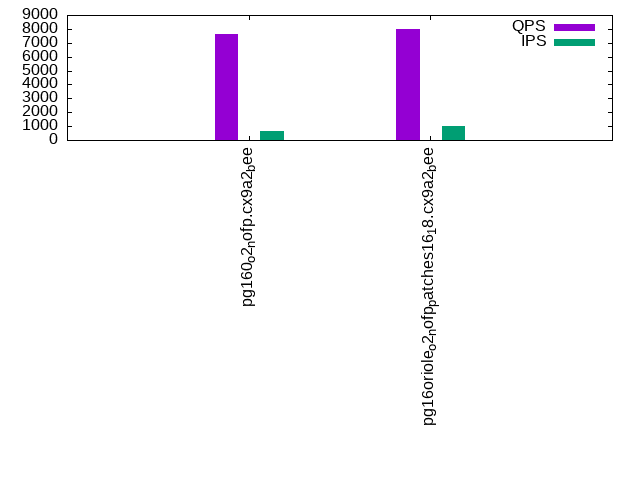
q1000.1
q1000.1: range queries with 1000 insert/s per client. Graphs for performance per 1-second interval are here.
Average throughput:
Query response time histogram: each cell has the percentage of responses that take <= the time in the header and max is the max response time in seconds. For max values in the top 25% of the range have a red background and in the bottom 25% of the range have a green background. The red background is not used when the min value is within 80% of the max value.
| dbms | 256us | 1ms | 4ms | 16ms | 64ms | 256ms | 1s | 4s | 16s | gt | max |
|---|---|---|---|---|---|---|---|---|---|---|---|
| pg160_o2_nofp.cx9a2_bee | 99.892 | 0.107 | 0.001 | 0.001 | nonzero | 0.024 | |||||
| pg16oriole_o2_nofp_patches16_18.cx9a2_bee | 97.620 | 2.337 | 0.037 | 0.005 | nonzero | 0.049 |
Insert response time histogram: each cell has the percentage of responses that take <= the time in the header and max is the max response time in seconds. For max values in the top 25% of the range have a red background and in the bottom 25% of the range have a green background. The red background is not used when the min value is within 80% of the max value.
| dbms | 256us | 1ms | 4ms | 16ms | 64ms | 256ms | 1s | 4s | 16s | gt | max |
|---|---|---|---|---|---|---|---|---|---|---|---|
| pg160_o2_nofp.cx9a2_bee | 94.832 | 5.168 | 0.046 | ||||||||
| pg16oriole_o2_nofp_patches16_18.cx9a2_bee | 93.614 | 5.872 | 0.515 | 0.240 |
Delete response time histogram: each cell has the percentage of responses that take <= the time in the header and max is the max response time in seconds. For max values in the top 25% of the range have a red background and in the bottom 25% of the range have a green background. The red background is not used when the min value is within 80% of the max value.
| dbms | 256us | 1ms | 4ms | 16ms | 64ms | 256ms | 1s | 4s | 16s | gt | max |
|---|---|---|---|---|---|---|---|---|---|---|---|
| pg160_o2_nofp.cx9a2_bee | 0.331 | 15.674 | 0.022 | 0.015 | 19.998 | 63.960 | 0.213 | ||||
| pg16oriole_o2_nofp_patches16_18.cx9a2_bee | 95.651 | 3.919 | 0.430 | 0.213 |
Performance metrics for the DBMS listed above. Some are normalized by throughput, others are not. Legend for results is here.
ips	qps	rps	rmbps	wps	wmbps	rpq	rkbpq	wpi	wkbpi	csps	cpups	cspq	cpupq	dbgb1	dbgb2	rss	maxop	p50	p99	tag
663	7641	1086	8.7	1318.5	19.5	0.142	1.165	1.988	30.133	31955	24.8	4.182	260	152.9	187.8	9.8	0.024	7303	7054	800m.pg160_o2_nofp.cx9a2_bee
998	8016	3989	31.4	3584.9	35.9	0.498	4.006	3.592	36.881	39047	16.3	4.871	163	0.0	366.5	9.4	0.049	7927	6776	800m.pg16oriole_o2_nofp_patches16_18.cx9a2_bee
l.i0
l.i0: load without secondary indexes
Performance metrics for all DBMS, not just the ones listed above. Some are normalized by throughput, others are not. Legend for results is here.
ips	qps	rps	rmbps	wps	wmbps	rpq	rkbpq	wpi	wkbpi	csps	cpups	cspq	cpupq	dbgb1	dbgb2	rss	maxop	p50	p99	tag
72946	0	32	0.3	105.6	30.2	0.000	0.004	0.001	0.423	8879	22.4	0.122	25	76.5	116.6	1.8	0.060	73120	71148	800m.pg160_o2_nofp.cx9a2_bee
69851	0	0	0.0	50.9	14.3	0.000	0.000	0.001	0.210	8123	22.6	0.116	26	0.0	82.6	9.5	0.304	70025	67525	800m.pg16oriole_o2_nofp_patches16_18.cx9a2_bee
l.x
l.x: create secondary indexes
Performance metrics for all DBMS, not just the ones listed above. Some are normalized by throughput, others are not. Legend for results is here.
ips	qps	rps	rmbps	wps	wmbps	rpq	rkbpq	wpi	wkbpi	csps	cpups	cspq	cpupq	dbgb1	dbgb2	rss	maxop	p50	p99	tag
197604	0	574	71.2	182.2	67.2	0.003	0.369	0.001	0.348	509	12.4	0.003	5	147.0	187.1	10.1	0.013	NA	NA	800m.pg160_o2_nofp.cx9a2_bee
125309	0	1016	89.4	237.1	68.4	0.008	0.730	0.002	0.559	1191	12.1	0.010	8	0.0	169.9	8.8	0.004	NA	NA	800m.pg16oriole_o2_nofp_patches16_18.cx9a2_bee
l.i1
l.i1: continue load after secondary indexes created
Performance metrics for all DBMS, not just the ones listed above. Some are normalized by throughput, others are not. Legend for results is here.
ips	qps	rps	rmbps	wps	wmbps	rpq	rkbpq	wpi	wkbpi	csps	cpups	cspq	cpupq	dbgb1	dbgb2	rss	maxop	p50	p99	tag
2583	0	4118	32.9	4765.8	67.1	1.594	13.060	1.845	26.605	9757	10.5	3.777	325	152.2	192.2	1.3	0.208	3398	749	800m.pg160_o2_nofp.cx9a2_bee
2882	0	11412	90.2	9364.7	118.1	3.961	32.046	3.250	41.985	24232	13.7	8.410	380	0.0	352.5	8.6	1.346	2946	2099	800m.pg16oriole_o2_nofp_patches16_18.cx9a2_bee
q100.1
q100.1: range queries with 100 insert/s per client
Performance metrics for all DBMS, not just the ones listed above. Some are normalized by throughput, others are not. Legend for results is here.
ips	qps	rps	rmbps	wps	wmbps	rpq	rkbpq	wpi	wkbpi	csps	cpups	cspq	cpupq	dbgb1	dbgb2	rss	maxop	p50	p99	tag
100	8000	174	1.4	202.2	3.4	0.022	0.178	2.026	34.689	31181	12.6	3.898	126	152.2	188.5	10.1	0.016	7527	6952	800m.pg160_o2_nofp.cx9a2_bee
100	8456	395	3.1	345.0	4.5	0.047	0.381	3.457	46.062	33346	12.8	3.944	121	0.0	347.1	9.5	0.046	8036	7130	800m.pg16oriole_o2_nofp_patches16_18.cx9a2_bee
q500.1
q500.1: range queries with 500 insert/s per client
Performance metrics for all DBMS, not just the ones listed above. Some are normalized by throughput, others are not. Legend for results is here.
ips	qps	rps	rmbps	wps	wmbps	rpq	rkbpq	wpi	wkbpi	csps	cpups	cspq	cpupq	dbgb1	dbgb2	rss	maxop	p50	p99	tag
499	7594	802	6.4	963.4	14.5	0.106	0.863	1.931	29.784	31080	13.6	4.093	143	152.3	182.8	10.1	0.016	7272	7016	800m.pg160_o2_nofp.cx9a2_bee
499	8385	1900	15.0	1563.3	17.8	0.227	1.826	3.133	36.490	36161	14.7	4.312	140	0.0	347.3	9.5	0.050	7848	7545	800m.pg16oriole_o2_nofp_patches16_18.cx9a2_bee
q1000.1
q1000.1: range queries with 1000 insert/s per client
Performance metrics for all DBMS, not just the ones listed above. Some are normalized by throughput, others are not. Legend for results is here.
ips	qps	rps	rmbps	wps	wmbps	rpq	rkbpq	wpi	wkbpi	csps	cpups	cspq	cpupq	dbgb1	dbgb2	rss	maxop	p50	p99	tag
663	7641	1086	8.7	1318.5	19.5	0.142	1.165	1.988	30.133	31955	24.8	4.182	260	152.9	187.8	9.8	0.024	7303	7054	800m.pg160_o2_nofp.cx9a2_bee
998	8016	3989	31.4	3584.9	35.9	0.498	4.006	3.592	36.881	39047	16.3	4.871	163	0.0	366.5	9.4	0.049	7927	6776	800m.pg16oriole_o2_nofp_patches16_18.cx9a2_bee
l.i0
- l.i0: load without secondary indexes
- Legend for results is here.
- Each entry lists the percentage of responses that fit in that bucket (slower than max time for previous bucket, faster than min time for next bucket).
Insert response time histogram
256us	1ms	4ms	16ms	64ms	256ms	1s	4s	16s	gt	max	tag
0.000	0.000	99.999	0.001	nonzero	0.000	0.000	0.000	0.000	0.000	0.060	pg160_o2_nofp.cx9a2_bee
0.000	0.000	99.985	nonzero	0.015	0.000	nonzero	0.000	0.000	0.000	0.304	pg16oriole_o2_nofp_patches16_18.cx9a2_bee
l.x
- l.x: create secondary indexes
- Legend for results is here.
- Each entry lists the percentage of responses that fit in that bucket (slower than max time for previous bucket, faster than min time for next bucket).
TODO - determine whether there is data for create index response time
l.i1
- l.i1: continue load after secondary indexes created
- Legend for results is here.
- Each entry lists the percentage of responses that fit in that bucket (slower than max time for previous bucket, faster than min time for next bucket).
Insert response time histogram
256us	1ms	4ms	16ms	64ms	256ms	1s	4s	16s	gt	max	tag
0.000	0.000	0.000	86.557	13.439	0.004	0.000	0.000	0.000	0.000	0.208	pg160_o2_nofp.cx9a2_bee
0.000	0.000	0.000	54.536	44.541	0.922	0.001	nonzero	0.000	0.000	1.346	pg16oriole_o2_nofp_patches16_18.cx9a2_bee
Delete response time histogram
256us	1ms	4ms	16ms	64ms	256ms	1s	4s	16s	gt	max	tag
nonzero	77.366	0.838	4.279	15.829	1.688	0.000	0.000	0.000	0.000	0.082	pg160_o2_nofp.cx9a2_bee
0.000	0.000	0.000	93.415	5.805	0.780	nonzero	0.000	0.000	0.000	0.264	pg16oriole_o2_nofp_patches16_18.cx9a2_bee
q100.1
- q100.1: range queries with 100 insert/s per client
- Legend for results is here.
- Each entry lists the percentage of responses that fit in that bucket (slower than max time for previous bucket, faster than min time for next bucket).
Query response time histogram
256us	1ms	4ms	16ms	64ms	256ms	1s	4s	16s	gt	max	tag
99.818	0.180	nonzero	0.002	0.000	0.000	0.000	0.000	0.000	0.000	0.016	pg160_o2_nofp.cx9a2_bee
99.790	0.203	0.002	0.005	nonzero	0.000	0.000	0.000	0.000	0.000	0.046	pg16oriole_o2_nofp_patches16_18.cx9a2_bee
Insert response time histogram
256us	1ms	4ms	16ms	64ms	256ms	1s	4s	16s	gt	max	tag
0.000	0.000	0.000	72.264	27.736	0.000	0.000	0.000	0.000	0.000	0.032	pg160_o2_nofp.cx9a2_bee
0.000	0.000	0.000	56.597	43.396	0.007	0.000	0.000	0.000	0.000	0.069	pg16oriole_o2_nofp_patches16_18.cx9a2_bee
Delete response time histogram
256us	1ms	4ms	16ms	64ms	256ms	1s	4s	16s	gt	max	tag
0.111	99.507	0.042	0.340	0.000	0.000	0.000	0.000	0.000	0.000	0.010	pg160_o2_nofp.cx9a2_bee
0.000	0.000	0.000	57.806	42.188	0.007	0.000	0.000	0.000	0.000	0.083	pg16oriole_o2_nofp_patches16_18.cx9a2_bee
q500.1
- q500.1: range queries with 500 insert/s per client
- Legend for results is here.
- Each entry lists the percentage of responses that fit in that bucket (slower than max time for previous bucket, faster than min time for next bucket).
Query response time histogram
256us	1ms	4ms	16ms	64ms	256ms	1s	4s	16s	gt	max	tag
99.868	0.127	0.001	0.004	nonzero	0.000	0.000	0.000	0.000	0.000	0.016	pg160_o2_nofp.cx9a2_bee
99.580	0.411	0.006	0.004	nonzero	0.000	0.000	0.000	0.000	0.000	0.050	pg16oriole_o2_nofp_patches16_18.cx9a2_bee
Insert response time histogram
256us	1ms	4ms	16ms	64ms	256ms	1s	4s	16s	gt	max	tag
0.000	0.000	0.000	93.549	6.451	0.000	0.000	0.000	0.000	0.000	0.030	pg160_o2_nofp.cx9a2_bee
0.000	0.000	0.000	95.465	4.438	0.097	0.000	0.000	0.000	0.000	0.166	pg16oriole_o2_nofp_patches16_18.cx9a2_bee
Delete response time histogram
256us	1ms	4ms	16ms	64ms	256ms	1s	4s	16s	gt	max	tag
3.872	95.885	0.062	0.181	0.000	0.000	0.000	0.000	0.000	0.000	0.010	pg160_o2_nofp.cx9a2_bee
0.000	0.000	0.000	95.894	4.019	0.086	0.000	0.000	0.000	0.000	0.132	pg16oriole_o2_nofp_patches16_18.cx9a2_bee
q1000.1
- q1000.1: range queries with 1000 insert/s per client
- Legend for results is here.
- Each entry lists the percentage of responses that fit in that bucket (slower than max time for previous bucket, faster than min time for next bucket).
Query response time histogram
256us	1ms	4ms	16ms	64ms	256ms	1s	4s	16s	gt	max	tag
99.892	0.107	0.001	0.001	nonzero	0.000	0.000	0.000	0.000	0.000	0.024	pg160_o2_nofp.cx9a2_bee
97.620	2.337	0.037	0.005	nonzero	0.000	0.000	0.000	0.000	0.000	0.049	pg16oriole_o2_nofp_patches16_18.cx9a2_bee
Insert response time histogram
256us	1ms	4ms	16ms	64ms	256ms	1s	4s	16s	gt	max	tag
0.000	0.000	0.000	94.832	5.168	0.000	0.000	0.000	0.000	0.000	0.046	pg160_o2_nofp.cx9a2_bee
0.000	0.000	0.000	93.614	5.872	0.515	0.000	0.000	0.000	0.000	0.240	pg16oriole_o2_nofp_patches16_18.cx9a2_bee
Delete response time histogram
256us	1ms	4ms	16ms	64ms	256ms	1s	4s	16s	gt	max	tag
0.331	15.674	0.022	0.015	19.998	63.960	0.000	0.000	0.000	0.000	0.213	pg160_o2_nofp.cx9a2_bee
0.000	0.000	0.000	95.651	3.919	0.430	0.000	0.000	0.000	0.000	0.213	pg16oriole_o2_nofp_patches16_18.cx9a2_bee