Introduction
This is a report for the insert benchmark with 800M docs and 1 client(s). It is generated by scripts (bash, awk, sed) and Tufte might not be impressed. An overview of the insert benchmark is here and a short update is here. Below, by DBMS, I mean DBMS+version.config. An example is my8020.c10b40 where my means MySQL, 8020 is version 8.0.20 and c10b40 is the name for the configuration file.
The test server has 8 AMD cores, 16G RAM and an NVMe SSD. It is described here as the Beelink. The benchmark was run with 1 client and there were 1 or 3 connections per client (1 for queries or inserts without rate limits, 1+1 for rate limited inserts+deletes). There is 1 table. It loads 800M rows without secondary indexes, creates secondary indexes, then inserts 5M rows with a delete per insert to avoid growing the table. It then does 3 read+write tests for 1200s each that do queries as fast as possible with 100, 500 and then 1000 inserts/second/client concurrent with the queries and 1000 deletes/second to avoid growing the table. The database is larger than memory.
The tested DBMS are:
- my5621_rel.cy10a_bee - InnoDB and MySQL 5.6.21, rel build, cy10a_bee config, compiled with CMAKE_BUILD_TYPE=Release, base config
- my5651_rel.cy10a_bee - InnoDB and MySQL 5.6.51, rel build, cy10a_bee config, compiled with CMAKE_BUILD_TYPE=Release, base config
- my5710_rel.cy10a_bee - InnoDB and MySQL 5.7.10, rel build, cy10a_bee config, compiled with CMAKE_BUILD_TYPE=Release, base config
- my5721_rel.cy10a_bee - InnoDB and MySQL 5.7.21, rel build, cy10a_bee config, compiled with CMAKE_BUILD_TYPE=Release, base config
- my5732_rel.cy10a_bee - InnoDB and MySQL 5.7.32, rel build, cy10a_bee config, compiled with CMAKE_BUILD_TYPE=Release, base config
- my5743_rel.cy10a_bee - InnoDB and MySQL 5.7.43, rel build, cy10a_bee config, compiled with CMAKE_BUILD_TYPE=Release, base config
- my8013_rel.cy10a_bee - InnoDB and MySQL 8.0.13, rel build, cy10a_bee config, compiled with CMAKE_BUILD_TYPE=Release, base config
- my8020_rel.cy10a_bee - InnoDB and MySQL 8.0.20, rel build, cy10a_bee config, compiled with CMAKE_BUILD_TYPE=Release, base config
- my8027_rel.cy10a_bee - InnoDB and MySQL 8.0.27, rel build, cy10a_bee config, compiled with CMAKE_BUILD_TYPE=Release, base config
- my8034_rel.cy10a_bee - InnoDB and MySQL 8.0.34, rel build, cy10a_bee config, compiled with CMAKE_BUILD_TYPE=Release, base config
Contents
- Summary
- l.i0: load without secondary indexes
- l.x: create secondary indexes
- l.i1: continue load after secondary indexes created
- q100.1: range queries with 100 insert/s per client
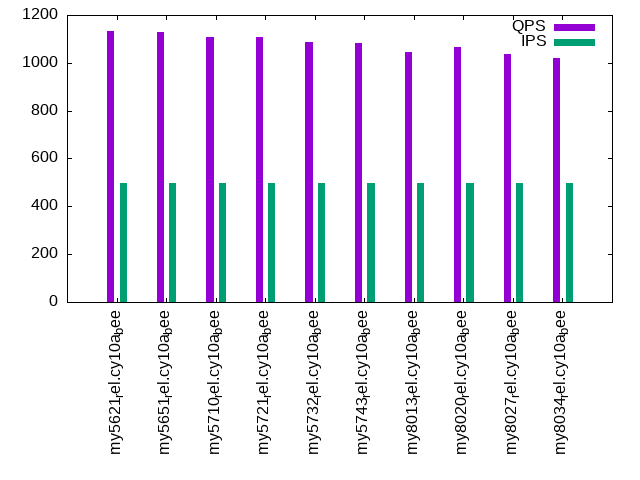
- q500.1: range queries with 500 insert/s per client
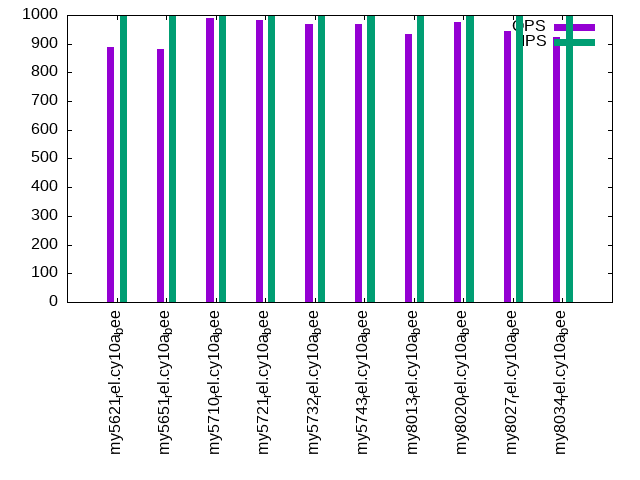
- q1000.1: range queries with 1000 insert/s per client
Summary
The numbers are inserts/s for l.i0 and l.i1, indexed docs (or rows) /s for l.x and queries/s for q100, q500, q1000. The values are the average rate over the entire test for inserts (IPS) and queries (QPS). The range of values for IPS and QPS is split into 3 parts: bottom 25%, middle 50%, top 25%. Values in the bottom 25% have a red background, values in the top 25% have a green background and values in the middle have no color. A gray background is used for values that can be ignored because the DBMS did not sustain the target insert rate. Red backgrounds are not used when the minimum value is within 80% of the max value.
| dbms | l.i0 | l.x | l.i1 | q100.1 | q500.1 | q1000.1 |
|---|---|---|---|---|---|---|
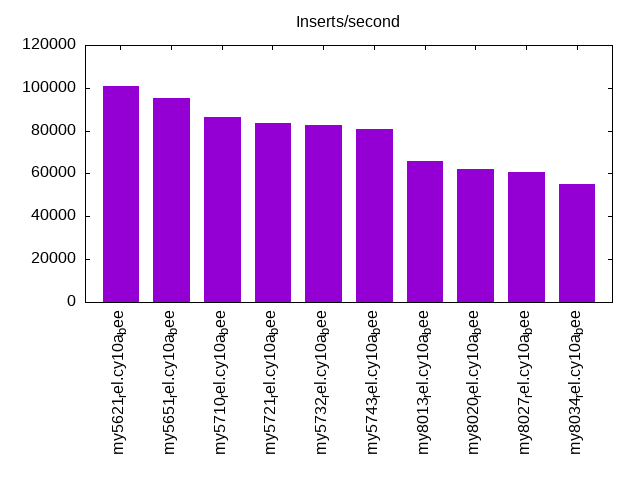
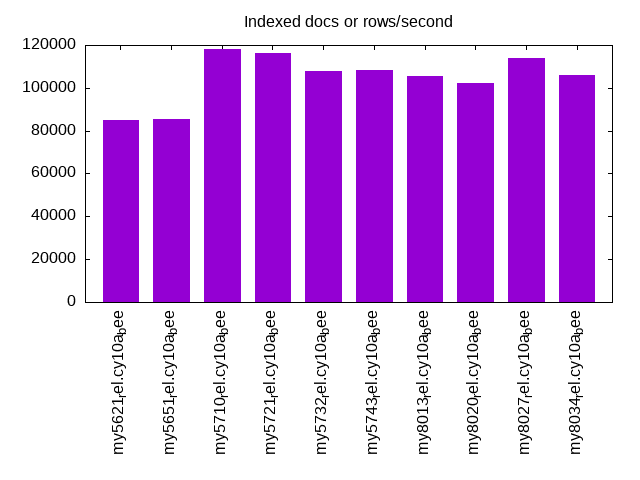
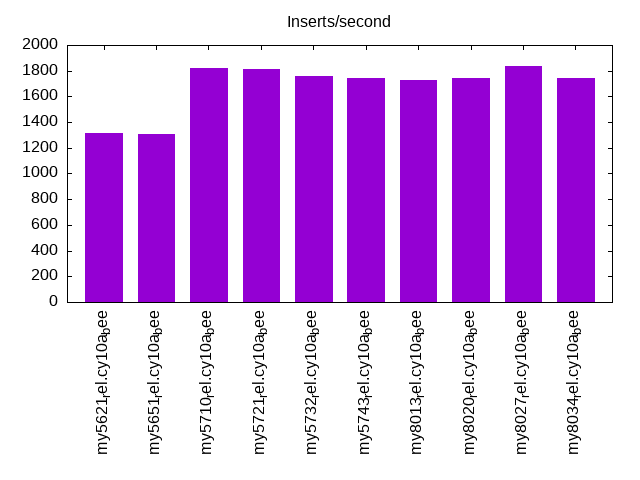
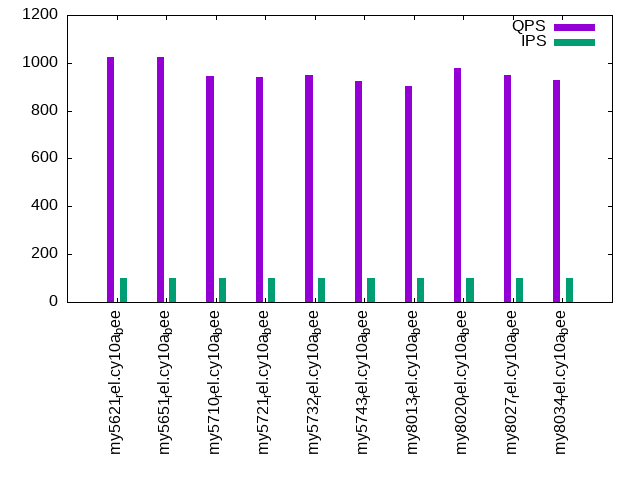
| my5621_rel.cy10a_bee | 101087 | 84918 | 1315 | 1024 | 1132 | 888 |
| my5651_rel.cy10a_bee | 95181 | 85226 | 1304 | 1026 | 1127 | 880 |
| my5710_rel.cy10a_bee | 86207 | 118009 | 1823 | 943 | 1109 | 988 |
| my5721_rel.cy10a_bee | 83446 | 116446 | 1810 | 941 | 1106 | 983 |
| my5732_rel.cy10a_bee | 82833 | 107627 | 1761 | 948 | 1087 | 969 |
| my5743_rel.cy10a_bee | 80922 | 108195 | 1746 | 926 | 1082 | 970 |
| my8013_rel.cy10a_bee | 65816 | 105666 | 1730 | 903 | 1046 | 934 |
| my8020_rel.cy10a_bee | 62083 | 102432 | 1746 | 979 | 1067 | 975 |
| my8027_rel.cy10a_bee | 60864 | 113845 | 1836 | 949 | 1039 | 944 |
| my8034_rel.cy10a_bee | 54866 | 106142 | 1743 | 929 | 1022 | 924 |
This table has relative throughput, throughput for the DBMS relative to the DBMS in the first line, using the absolute throughput from the previous table. Values less than 0.95 have a yellow background. Values greater than 1.05 have a blue background.
| dbms | l.i0 | l.x | l.i1 | q100.1 | q500.1 | q1000.1 |
|---|---|---|---|---|---|---|
| my5621_rel.cy10a_bee | 1.00 | 1.00 | 1.00 | 1.00 | 1.00 | 1.00 |
| my5651_rel.cy10a_bee | 0.94 | 1.00 | 0.99 | 1.00 | 1.00 | 0.99 |
| my5710_rel.cy10a_bee | 0.85 | 1.39 | 1.39 | 0.92 | 0.98 | 1.11 |
| my5721_rel.cy10a_bee | 0.83 | 1.37 | 1.38 | 0.92 | 0.98 | 1.11 |
| my5732_rel.cy10a_bee | 0.82 | 1.27 | 1.34 | 0.93 | 0.96 | 1.09 |
| my5743_rel.cy10a_bee | 0.80 | 1.27 | 1.33 | 0.90 | 0.96 | 1.09 |
| my8013_rel.cy10a_bee | 0.65 | 1.24 | 1.32 | 0.88 | 0.92 | 1.05 |
| my8020_rel.cy10a_bee | 0.61 | 1.21 | 1.33 | 0.96 | 0.94 | 1.10 |
| my8027_rel.cy10a_bee | 0.60 | 1.34 | 1.40 | 0.93 | 0.92 | 1.06 |
| my8034_rel.cy10a_bee | 0.54 | 1.25 | 1.33 | 0.91 | 0.90 | 1.04 |
This lists the average rate of inserts/s for the tests that do inserts concurrent with queries. For such tests the query rate is listed in the table above. The read+write tests are setup so that the insert rate should match the target rate every second. Cells that are not at least 95% of the target have a red background to indicate a failure to satisfy the target.
| dbms | q100.1 | q500.1 | q1000.1 |
|---|---|---|---|
| my5621_rel.cy10a_bee | 100 | 499 | 998 |
| my5651_rel.cy10a_bee | 100 | 499 | 998 |
| my5710_rel.cy10a_bee | 100 | 499 | 998 |
| my5721_rel.cy10a_bee | 100 | 499 | 998 |
| my5732_rel.cy10a_bee | 100 | 499 | 998 |
| my5743_rel.cy10a_bee | 100 | 499 | 998 |
| my8013_rel.cy10a_bee | 100 | 499 | 998 |
| my8020_rel.cy10a_bee | 100 | 499 | 998 |
| my8027_rel.cy10a_bee | 100 | 499 | 998 |
| my8034_rel.cy10a_bee | 100 | 499 | 997 |
| target | 100 | 500 | 1000 |
l.i0
l.i0: load without secondary indexes. Graphs for performance per 1-second interval are here.
Average throughput:
Insert response time histogram: each cell has the percentage of responses that take <= the time in the header and max is the max response time in seconds. For the max column values in the top 25% of the range have a red background and in the bottom 25% of the range have a green background. The red background is not used when the min value is within 80% of the max value.
| dbms | 256us | 1ms | 4ms | 16ms | 64ms | 256ms | 1s | 4s | 16s | gt | max |
|---|---|---|---|---|---|---|---|---|---|---|---|
| my5621_rel.cy10a_bee | 92.981 | 6.891 | 0.107 | 0.017 | 0.004 | 0.176 | |||||
| my5651_rel.cy10a_bee | 83.653 | 16.205 | 0.069 | 0.070 | 0.004 | 0.246 | |||||
| my5710_rel.cy10a_bee | 6.055 | 93.652 | 0.286 | 0.004 | 0.003 | 0.135 | |||||
| my5721_rel.cy10a_bee | 0.651 | 99.047 | 0.295 | 0.005 | 0.003 | 0.129 | |||||
| my5732_rel.cy10a_bee | 1.484 | 98.189 | 0.189 | 0.137 | 0.003 | 0.136 | |||||
| my5743_rel.cy10a_bee | 0.330 | 99.338 | 0.190 | 0.140 | 0.002 | 0.132 | |||||
| my8013_rel.cy10a_bee | 99.335 | 0.498 | 0.164 | 0.003 | nonzero | 0.299 | |||||
| my8020_rel.cy10a_bee | 99.302 | 0.523 | 0.171 | 0.004 | 0.124 | ||||||
| my8027_rel.cy10a_bee | 99.455 | 0.395 | 0.146 | 0.004 | 0.249 | ||||||
| my8034_rel.cy10a_bee | 99.358 | 0.488 | 0.150 | 0.003 | 0.099 |
Performance metrics for the DBMS listed above. Some are normalized by throughput, others are not. Legend for results is here.
ips	qps	rps	rmbps	wps	wmbps	rpq	rkbpq	wpi	wkbpi	csps	cpups	cspq	cpupq	dbgb1	dbgb2	rss	maxop	p50	p99	tag
101087	0	886	3.5	491.7	36.1	0.009	0.035	0.005	0.366	12846	21.8	0.127	17	52.6	93.1	10.6	0.176	101587	85053	800m.my5621_rel.cy10a_bee
95181	0	834	3.3	461.3	34.0	0.009	0.035	0.005	0.366	12099	21.5	0.127	18	52.6	93.1	10.6	0.246	95630	77190	800m.my5651_rel.cy10a_bee
86207	0	0	0.0	431.3	30.9	0.000	0.000	0.005	0.367	9541	21.3	0.111	20	52.6	93.1	10.9	0.135	86477	74823	800m.my5710_rel.cy10a_bee
83446	0	0	0.0	419.7	29.9	0.000	0.000	0.005	0.367	9282	21.7	0.111	21	52.6	93.1	10.9	0.129	83718	72917	800m.my5721_rel.cy10a_bee
82833	0	0	0.0	416.6	29.7	0.000	0.000	0.005	0.367	9199	21.2	0.111	20	52.6	93.1	10.9	0.136	83143	72509	800m.my5732_rel.cy10a_bee
80922	0	0	0.0	407.1	29.0	0.000	0.000	0.005	0.367	9025	21.3	0.112	21	52.6	93.1	10.9	0.132	81108	72221	800m.my5743_rel.cy10a_bee
65816	0	0	0.0	369.9	25.6	0.000	0.000	0.006	0.398	53961	34.4	0.820	42	52.4	55.0	11.1	0.299	65829	59273	800m.my8013_rel.cy10a_bee
62083	0	0	0.0	388.9	23.5	0.000	0.000	0.006	0.387	17109	21.8	0.276	28	52.4	61.0	11.1	0.124	61978	54944	800m.my8020_rel.cy10a_bee
60864	0	0	0.0	377.9	23.0	0.000	0.000	0.006	0.387	7138	20.3	0.117	27	52.4	61.0	11.0	0.249	60934	54168	800m.my8027_rel.cy10a_bee
54866	0	0	0.0	341.2	20.9	0.000	0.000	0.006	0.390	6603	19.7	0.120	29	52.4	61.0	11.1	0.099	55039	49267	800m.my8034_rel.cy10a_bee
l.x
l.x: create secondary indexes.
Average throughput:
Performance metrics for the DBMS listed above. Some are normalized by throughput, others are not. Legend for results is here.
ips	qps	rps	rmbps	wps	wmbps	rpq	rkbpq	wpi	wkbpi	csps	cpups	cspq	cpupq	dbgb1	dbgb2	rss	maxop	p50	p99	tag
84918	0	559	80.9	699.7	102.5	0.007	0.975	0.008	1.236	1963	11.3	0.023	11	108.4	148.9	10.8	0.015	NA	NA	800m.my5621_rel.cy10a_bee
85226	0	559	81.2	701.0	102.9	0.007	0.976	0.008	1.236	1939	11.2	0.023	11	108.4	148.9	10.8	0.011	NA	NA	800m.my5651_rel.cy10a_bee
118009	0	718	110.7	981.7	132.8	0.006	0.961	0.008	1.152	6552	12.4	0.056	8	117.7	158.2	11.1	0.019	NA	NA	800m.my5710_rel.cy10a_bee
116446	0	702	109.2	975.0	131.1	0.006	0.960	0.008	1.153	6443	12.4	0.055	9	117.7	158.2	11.1	0.011	NA	NA	800m.my5721_rel.cy10a_bee
107627	0	656	101.0	899.5	121.1	0.006	0.961	0.008	1.152	6074	12.1	0.056	9	117.7	158.2	11.1	0.016	NA	NA	800m.my5732_rel.cy10a_bee
108195	0	656	101.5	897.5	121.6	0.006	0.960	0.008	1.151	6078	12.0	0.056	9	117.7	158.2	11.1	0.015	NA	NA	800m.my5743_rel.cy10a_bee
105666	0	623	99.0	752.8	118.5	0.006	0.960	0.007	1.149	9515	13.8	0.090	10	117.2	119.8	11.3	0.015	NA	NA	800m.my8013_rel.cy10a_bee
102432	0	610	96.1	827.4	114.9	0.006	0.960	0.008	1.148	6377	12.1	0.062	9	117.2	125.8	11.3	0.020	NA	NA	800m.my8020_rel.cy10a_bee
113845	0	1838	172.4	2205.6	153.3	0.016	1.550	0.019	1.378	8830	43.6	0.078	31	117.2	125.8	11.2	0.011	NA	NA	800m.my8027_rel.cy10a_bee
106142	0	1714	160.6	2062.4	142.8	0.016	1.550	0.019	1.378	8499	43.6	0.080	33	117.2	125.8	11.3	0.012	NA	NA	800m.my8034_rel.cy10a_bee
l.i1
l.i1: continue load after secondary indexes created. Graphs for performance per 1-second interval are here.
Average throughput:
Insert response time histogram: each cell has the percentage of responses that take <= the time in the header and max is the max response time in seconds. For the max column values in the top 25% of the range have a red background and in the bottom 25% of the range have a green background. The red background is not used when the min value is within 80% of the max value.
| dbms | 256us | 1ms | 4ms | 16ms | 64ms | 256ms | 1s | 4s | 16s | gt | max |
|---|---|---|---|---|---|---|---|---|---|---|---|
| my5621_rel.cy10a_bee | 1.828 | 87.643 | 10.527 | 0.002 | 0.873 | ||||||
| my5651_rel.cy10a_bee | 1.815 | 87.164 | 11.016 | 0.005 | 0.777 | ||||||
| my5710_rel.cy10a_bee | 34.268 | 60.133 | 5.596 | 0.003 | 0.299 | ||||||
| my5721_rel.cy10a_bee | 32.822 | 61.618 | 5.557 | 0.003 | 0.549 | ||||||
| my5732_rel.cy10a_bee | 32.889 | 60.796 | 6.312 | 0.003 | 0.322 | ||||||
| my5743_rel.cy10a_bee | 32.006 | 61.564 | 6.428 | 0.002 | 0.346 | ||||||
| my8013_rel.cy10a_bee | 31.457 | 61.764 | 6.776 | 0.003 | 0.308 | ||||||
| my8020_rel.cy10a_bee | 27.856 | 65.646 | 6.496 | 0.002 | 0.379 | ||||||
| my8027_rel.cy10a_bee | 33.397 | 60.836 | 5.766 | 0.001 | 0.310 | ||||||
| my8034_rel.cy10a_bee | 28.273 | 65.447 | 6.279 | 0.001 | 0.358 |
Delete response time histogram: each cell has the percentage of responses that take <= the time in the header and max is the max response time in seconds. For the max column values in the top 25% of the range have a red background and in the bottom 25% of the range have a green background. The red background is not used when the min value is within 80% of the max value.
| dbms | 256us | 1ms | 4ms | 16ms | 64ms | 256ms | 1s | 4s | 16s | gt | max |
|---|---|---|---|---|---|---|---|---|---|---|---|
| my5621_rel.cy10a_bee | 2.951 | 91.090 | 5.955 | 0.003 | 0.001 | 0.733 | |||||
| my5651_rel.cy10a_bee | 3.295 | 90.845 | 5.853 | 0.006 | 0.001 | 0.598 | |||||
| my5710_rel.cy10a_bee | 91.756 | 8.037 | 0.199 | 0.008 | 0.117 | ||||||
| my5721_rel.cy10a_bee | 91.759 | 8.024 | 0.206 | 0.011 | 0.139 | ||||||
| my5732_rel.cy10a_bee | 92.131 | 7.627 | 0.238 | 0.004 | 0.141 | ||||||
| my5743_rel.cy10a_bee | 89.574 | 10.143 | 0.276 | 0.007 | 0.087 | ||||||
| my8013_rel.cy10a_bee | 82.726 | 15.260 | 1.976 | 0.038 | 0.118 | ||||||
| my8020_rel.cy10a_bee | 77.227 | 21.497 | 1.250 | 0.026 | 0.101 | ||||||
| my8027_rel.cy10a_bee | 68.088 | 31.547 | 0.359 | 0.006 | 0.220 | ||||||
| my8034_rel.cy10a_bee | 25.187 | 74.434 | 0.377 | 0.002 | 0.068 |
Performance metrics for the DBMS listed above. Some are normalized by throughput, others are not. Legend for results is here.
ips	qps	rps	rmbps	wps	wmbps	rpq	rkbpq	wpi	wkbpi	csps	cpups	cspq	cpupq	dbgb1	dbgb2	rss	maxop	p50	p99	tag
1315	0	7588	118.0	9832.8	315.7	5.771	91.885	7.479	245.927	46337	14.7	35.245	894	146.1	186.7	10.5	0.873	1249	699	800m.my5621_rel.cy10a_bee
1304	0	7551	117.4	9869.9	314.1	5.790	92.183	7.568	246.645	45958	14.7	35.242	902	146.0	186.7	10.5	0.777	1249	649	800m.my5651_rel.cy10a_bee
1823	0	9116	142.4	12135.0	389.4	5.000	79.993	6.655	218.692	58191	22.9	31.914	1005	149.5	190.4	10.7	0.299	1698	749	800m.my5710_rel.cy10a_bee
1810	0	9166	143.2	12172.4	390.5	5.065	81.040	6.727	220.955	58720	22.9	32.449	1012	149.1	190.2	10.7	0.549	1698	749	800m.my5721_rel.cy10a_bee
1761	0	8896	139.0	11822.7	379.1	5.051	80.822	6.713	220.442	57149	22.3	32.450	1013	149.2	190.1	10.7	0.322	1599	699	800m.my5732_rel.cy10a_bee
1746	0	8824	137.9	11732.4	376.3	5.055	80.874	6.720	220.692	57680	22.4	33.039	1026	149.2	190.2	10.7	0.346	1599	699	800m.my5743_rel.cy10a_bee
1730	0	8713	136.1	12658.6	403.3	5.038	80.607	7.319	238.812	94914	34.0	54.879	1573	148.7	151.7	10.7	0.308	1598	749	800m.my8013_rel.cy10a_bee
1746	0	8907	139.2	14267.3	379.1	5.102	81.630	8.172	222.364	71840	17.9	41.150	820	148.4	157.4	10.5	0.379	1648	699	800m.my8020_rel.cy10a_bee
1836	0	9336	145.9	14956.3	397.7	5.086	81.382	8.148	221.896	65767	23.3	35.831	1016	148.4	157.4	10.7	0.310	1699	699	800m.my8027_rel.cy10a_bee
1743	0	8962	140.0	14525.6	397.6	5.143	82.283	8.335	233.629	60209	24.2	34.549	1111	148.2	157.2	10.7	0.358	1648	699	800m.my8034_rel.cy10a_bee
q100.1
q100.1: range queries with 100 insert/s per client. Graphs for performance per 1-second interval are here.
Average throughput:
Query response time histogram: each cell has the percentage of responses that take <= the time in the header and max is the max response time in seconds. For max values in the top 25% of the range have a red background and in the bottom 25% of the range have a green background. The red background is not used when the min value is within 80% of the max value.
| dbms | 256us | 1ms | 4ms | 16ms | 64ms | 256ms | 1s | 4s | 16s | gt | max |
|---|---|---|---|---|---|---|---|---|---|---|---|
| my5621_rel.cy10a_bee | 28.918 | 16.794 | 52.799 | 1.480 | 0.009 | 0.048 | |||||
| my5651_rel.cy10a_bee | 28.636 | 17.047 | 52.782 | 1.527 | 0.009 | 0.048 | |||||
| my5710_rel.cy10a_bee | 12.008 | 30.501 | 55.350 | 2.130 | 0.011 | 0.041 | |||||
| my5721_rel.cy10a_bee | 10.970 | 31.394 | 55.549 | 2.077 | 0.010 | 0.046 | |||||
| my5732_rel.cy10a_bee | 9.245 | 32.788 | 55.904 | 2.053 | 0.010 | 0.039 | |||||
| my5743_rel.cy10a_bee | 8.906 | 32.900 | 56.017 | 2.166 | 0.011 | 0.046 | |||||
| my8013_rel.cy10a_bee | 15.892 | 26.081 | 55.422 | 2.590 | 0.014 | 0.045 | |||||
| my8020_rel.cy10a_bee | 12.429 | 29.792 | 56.272 | 1.481 | 0.027 | 0.051 | |||||
| my8027_rel.cy10a_bee | 3.688 | 37.690 | 56.940 | 1.660 | 0.022 | nonzero | 0.088 | ||||
| my8034_rel.cy10a_bee | 3.785 | 37.290 | 57.221 | 1.678 | 0.025 | 0.060 |
Insert response time histogram: each cell has the percentage of responses that take <= the time in the header and max is the max response time in seconds. For max values in the top 25% of the range have a red background and in the bottom 25% of the range have a green background. The red background is not used when the min value is within 80% of the max value.
| dbms | 256us | 1ms | 4ms | 16ms | 64ms | 256ms | 1s | 4s | 16s | gt | max |
|---|---|---|---|---|---|---|---|---|---|---|---|
| my5621_rel.cy10a_bee | 0.917 | 78.708 | 20.375 | 0.125 | |||||||
| my5651_rel.cy10a_bee | 2.708 | 60.875 | 36.417 | 0.125 | |||||||
| my5710_rel.cy10a_bee | 21.708 | 64.417 | 13.875 | 0.119 | |||||||
| my5721_rel.cy10a_bee | 28.333 | 59.375 | 12.292 | 0.105 | |||||||
| my5732_rel.cy10a_bee | 40.083 | 48.292 | 11.625 | 0.115 | |||||||
| my5743_rel.cy10a_bee | 20.208 | 65.000 | 14.792 | 0.104 | |||||||
| my8013_rel.cy10a_bee | 37.750 | 52.417 | 9.833 | 0.111 | |||||||
| my8020_rel.cy10a_bee | 32.833 | 64.417 | 2.750 | 0.110 | |||||||
| my8027_rel.cy10a_bee | 38.875 | 57.042 | 4.083 | 0.124 | |||||||
| my8034_rel.cy10a_bee | 27.542 | 69.083 | 3.375 | 0.121 |
Delete response time histogram: each cell has the percentage of responses that take <= the time in the header and max is the max response time in seconds. For max values in the top 25% of the range have a red background and in the bottom 25% of the range have a green background. The red background is not used when the min value is within 80% of the max value.
| dbms | 256us | 1ms | 4ms | 16ms | 64ms | 256ms | 1s | 4s | 16s | gt | max |
|---|---|---|---|---|---|---|---|---|---|---|---|
| my5621_rel.cy10a_bee | 9.542 | 68.542 | 21.917 | 0.060 | |||||||
| my5651_rel.cy10a_bee | 11.167 | 67.708 | 21.125 | 0.052 | |||||||
| my5710_rel.cy10a_bee | 52.750 | 47.167 | 0.083 | 0.019 | |||||||
| my5721_rel.cy10a_bee | 54.958 | 45.000 | 0.042 | 0.018 | |||||||
| my5732_rel.cy10a_bee | 56.625 | 43.250 | 0.125 | 0.034 | |||||||
| my5743_rel.cy10a_bee | 49.708 | 49.917 | 0.375 | 0.036 | |||||||
| my8013_rel.cy10a_bee | 69.667 | 29.625 | 0.708 | 0.058 | |||||||
| my8020_rel.cy10a_bee | 69.375 | 30.125 | 0.500 | 0.038 | |||||||
| my8027_rel.cy10a_bee | 40.208 | 59.542 | 0.250 | 0.028 | |||||||
| my8034_rel.cy10a_bee | 22.417 | 76.167 | 1.417 | 0.042 |
Performance metrics for the DBMS listed above. Some are normalized by throughput, others are not. Legend for results is here.
ips	qps	rps	rmbps	wps	wmbps	rpq	rkbpq	wpi	wkbpi	csps	cpups	cspq	cpupq	dbgb1	dbgb2	rss	maxop	p50	p99	tag
100	1024	9884	154.4	5678.3	174.8	9.649	154.317	56.897	1793.718	39389	10.6	38.451	828	146.1	186.7	10.5	0.048	927	751	800m.my5621_rel.cy10a_bee
100	1026	9823	153.4	5659.0	172.6	9.574	153.116	56.704	1771.365	39216	10.5	38.222	819	146.0	186.7	10.5	0.048	911	751	800m.my5651_rel.cy10a_bee
100	943	11709	183.0	8438.2	241.6	12.419	198.696	84.721	2483.839	52656	16.7	55.844	1417	149.5	190.4	10.7	0.041	943	751	800m.my5710_rel.cy10a_bee
100	941	11483	179.4	8353.9	234.9	12.207	195.313	83.790	2413.037	52035	16.4	55.315	1395	149.1	190.2	10.7	0.046	927	783	800m.my5721_rel.cy10a_bee
100	948	11562	180.6	8016.4	236.3	12.201	195.214	80.325	2424.082	51507	16.6	54.356	1401	149.2	190.1	10.7	0.039	943	783	800m.my5732_rel.cy10a_bee
100	926	11453	178.9	8476.1	235.6	12.372	197.950	84.846	2415.415	52964	16.6	57.215	1435	149.2	190.2	10.7	0.046	927	799	800m.my5743_rel.cy10a_bee
100	903	11454	179.0	9544.8	281.9	12.685	202.958	95.735	2895.077	88273	29.6	97.756	2622	148.7	151.7	10.7	0.045	911	719	800m.my8013_rel.cy10a_bee
100	979	11641	181.9	9689.2	247.6	11.896	190.334	97.086	2540.620	59239	14.3	60.534	1169	148.4	157.4	10.5	0.051	975	815	800m.my8020_rel.cy10a_bee
100	949	11361	177.5	9569.9	244.8	11.974	191.592	95.795	2508.784	53723	17.4	56.622	1467	148.4	157.4	10.7	0.088	927	783	800m.my8027_rel.cy10a_bee
100	929	11196	174.9	9728.3	252.5	12.054	192.860	97.772	2598.095	52472	18.0	56.494	1550	148.2	157.2	10.7	0.060	927	704	800m.my8034_rel.cy10a_bee
q500.1
q500.1: range queries with 500 insert/s per client. Graphs for performance per 1-second interval are here.
Average throughput:
Query response time histogram: each cell has the percentage of responses that take <= the time in the header and max is the max response time in seconds. For max values in the top 25% of the range have a red background and in the bottom 25% of the range have a green background. The red background is not used when the min value is within 80% of the max value.
| dbms | 256us | 1ms | 4ms | 16ms | 64ms | 256ms | 1s | 4s | 16s | gt | max |
|---|---|---|---|---|---|---|---|---|---|---|---|
| my5621_rel.cy10a_bee | 32.561 | 15.008 | 51.658 | 0.768 | 0.004 | 0.040 | |||||
| my5651_rel.cy10a_bee | 32.191 | 15.226 | 51.790 | 0.789 | 0.004 | 0.042 | |||||
| my5710_rel.cy10a_bee | 14.763 | 31.979 | 52.263 | 0.990 | 0.005 | 0.047 | |||||
| my5721_rel.cy10a_bee | 11.838 | 34.719 | 52.499 | 0.939 | 0.004 | 0.040 | |||||
| my5732_rel.cy10a_bee | 10.002 | 35.910 | 53.111 | 0.972 | 0.005 | 0.044 | |||||
| my5743_rel.cy10a_bee | 8.725 | 37.038 | 53.270 | 0.963 | 0.004 | 0.052 | |||||
| my8013_rel.cy10a_bee | 12.323 | 32.379 | 54.251 | 1.041 | 0.006 | 0.039 | |||||
| my8020_rel.cy10a_bee | 10.416 | 34.493 | 54.332 | 0.745 | 0.013 | 0.047 | |||||
| my8027_rel.cy10a_bee | 4.120 | 40.356 | 54.671 | 0.840 | 0.014 | nonzero | 0.078 | ||||
| my8034_rel.cy10a_bee | 3.944 | 40.339 | 54.847 | 0.861 | 0.010 | 0.049 |
Insert response time histogram: each cell has the percentage of responses that take <= the time in the header and max is the max response time in seconds. For max values in the top 25% of the range have a red background and in the bottom 25% of the range have a green background. The red background is not used when the min value is within 80% of the max value.
| dbms | 256us | 1ms | 4ms | 16ms | 64ms | 256ms | 1s | 4s | 16s | gt | max |
|---|---|---|---|---|---|---|---|---|---|---|---|
| my5621_rel.cy10a_bee | 1.625 | 94.658 | 3.717 | 0.112 | |||||||
| my5651_rel.cy10a_bee | 1.275 | 94.208 | 4.517 | 0.127 | |||||||
| my5710_rel.cy10a_bee | 49.617 | 49.508 | 0.875 | 0.107 | |||||||
| my5721_rel.cy10a_bee | 51.050 | 48.225 | 0.725 | 0.095 | |||||||
| my5732_rel.cy10a_bee | 64.025 | 35.675 | 0.300 | 0.095 | |||||||
| my5743_rel.cy10a_bee | 60.683 | 39.067 | 0.250 | 0.088 | |||||||
| my8013_rel.cy10a_bee | 40.758 | 58.758 | 0.483 | 0.099 | |||||||
| my8020_rel.cy10a_bee | 20.367 | 79.583 | 0.050 | 0.090 | |||||||
| my8027_rel.cy10a_bee | 46.975 | 52.917 | 0.108 | 0.098 | |||||||
| my8034_rel.cy10a_bee | 27.992 | 72.008 | 0.061 |
Delete response time histogram: each cell has the percentage of responses that take <= the time in the header and max is the max response time in seconds. For max values in the top 25% of the range have a red background and in the bottom 25% of the range have a green background. The red background is not used when the min value is within 80% of the max value.
| dbms | 256us | 1ms | 4ms | 16ms | 64ms | 256ms | 1s | 4s | 16s | gt | max |
|---|---|---|---|---|---|---|---|---|---|---|---|
| my5621_rel.cy10a_bee | 14.617 | 80.033 | 5.342 | 0.008 | 0.071 | ||||||
| my5651_rel.cy10a_bee | 15.250 | 79.033 | 5.700 | 0.017 | 0.087 | ||||||
| my5710_rel.cy10a_bee | 99.017 | 0.983 | 0.013 | ||||||||
| my5721_rel.cy10a_bee | 99.017 | 0.983 | 0.015 | ||||||||
| my5732_rel.cy10a_bee | 94.658 | 5.342 | 0.015 | ||||||||
| my5743_rel.cy10a_bee | 94.283 | 5.717 | 0.014 | ||||||||
| my8013_rel.cy10a_bee | 94.133 | 5.250 | 0.617 | 0.052 | |||||||
| my8020_rel.cy10a_bee | 91.483 | 8.342 | 0.175 | 0.032 | |||||||
| my8027_rel.cy10a_bee | 98.300 | 1.700 | 0.014 | ||||||||
| my8034_rel.cy10a_bee | 90.125 | 9.808 | 0.067 | 0.026 |
Performance metrics for the DBMS listed above. Some are normalized by throughput, others are not. Legend for results is here.
ips	qps	rps	rmbps	wps	wmbps	rpq	rkbpq	wpi	wkbpi	csps	cpups	cspq	cpupq	dbgb1	dbgb2	rss	maxop	p50	p99	tag
499	1132	9376	146.3	4071.5	125.5	8.279	132.264	8.164	257.719	34456	10.4	30.425	735	146.1	186.7	10.5	0.040	1135	1054	800m.my5621_rel.cy10a_bee
499	1127	9338	145.7	4104.8	125.2	8.288	132.405	8.224	256.931	34312	10.4	30.451	738	146.0	186.7	10.5	0.042	1119	1055	800m.my5651_rel.cy10a_bee
499	1109	9338	145.9	4360.8	133.4	8.420	134.713	8.744	274.013	36054	11.6	32.507	837	149.5	190.4	10.7	0.047	1103	1052	800m.my5710_rel.cy10a_bee
499	1106	9301	145.3	4308.5	131.9	8.409	134.541	8.632	270.532	35848	11.6	32.409	839	149.1	190.2	10.7	0.040	1103	1039	800m.my5721_rel.cy10a_bee
499	1087	9223	144.1	4295.7	131.9	8.484	135.736	8.614	270.907	35553	11.6	32.701	854	149.2	190.1	10.7	0.044	1087	1023	800m.my5732_rel.cy10a_bee
499	1082	9203	143.8	4318.6	132.6	8.503	136.046	8.660	272.236	35900	11.7	33.170	865	149.2	190.2	10.7	0.052	1087	1023	800m.my5743_rel.cy10a_bee
499	1046	9079	141.9	4948.4	151.8	8.678	138.855	9.915	311.455	48708	15.9	46.557	1216	148.7	151.7	10.7	0.039	1055	974	800m.my8013_rel.cy10a_bee
499	1067	9146	142.9	5391.5	137.6	8.572	137.148	10.802	282.377	38075	11.2	35.684	840	148.4	157.4	10.5	0.047	1071	991	800m.my8020_rel.cy10a_bee
499	1039	9008	140.7	5353.3	136.8	8.672	138.757	10.734	280.861	37179	12.4	35.794	955	148.4	157.4	10.7	0.078	1039	975	800m.my8027_rel.cy10a_bee
499	1022	8905	139.1	5434.0	141.6	8.714	139.418	10.896	290.813	36638	12.9	35.850	1010	148.2	157.2	10.7	0.049	1023	959	800m.my8034_rel.cy10a_bee
q1000.1
q1000.1: range queries with 1000 insert/s per client. Graphs for performance per 1-second interval are here.
Average throughput:
Query response time histogram: each cell has the percentage of responses that take <= the time in the header and max is the max response time in seconds. For max values in the top 25% of the range have a red background and in the bottom 25% of the range have a green background. The red background is not used when the min value is within 80% of the max value.
| dbms | 256us | 1ms | 4ms | 16ms | 64ms | 256ms | 1s | 4s | 16s | gt | max |
|---|---|---|---|---|---|---|---|---|---|---|---|
| my5621_rel.cy10a_bee | 22.007 | 18.855 | 56.819 | 2.309 | 0.011 | 0.044 | |||||
| my5651_rel.cy10a_bee | 20.336 | 20.390 | 56.918 | 2.344 | 0.011 | 0.044 | |||||
| my5710_rel.cy10a_bee | 13.361 | 30.153 | 54.532 | 1.943 | 0.011 | 0.049 | |||||
| my5721_rel.cy10a_bee | 11.200 | 32.053 | 54.788 | 1.948 | 0.010 | 0.043 | |||||
| my5732_rel.cy10a_bee | 9.780 | 32.922 | 55.305 | 1.982 | 0.011 | 0.054 | |||||
| my5743_rel.cy10a_bee | 9.625 | 33.116 | 55.248 | 2.000 | 0.011 | 0.043 | |||||
| my8013_rel.cy10a_bee | 14.028 | 28.165 | 55.454 | 2.339 | 0.013 | 0.057 | |||||
| my8020_rel.cy10a_bee | 11.927 | 30.206 | 56.335 | 1.493 | 0.039 | 0.051 | |||||
| my8027_rel.cy10a_bee | 3.853 | 37.637 | 56.815 | 1.661 | 0.034 | nonzero | 0.158 | ||||
| my8034_rel.cy10a_bee | 3.832 | 37.235 | 57.164 | 1.741 | 0.029 | 0.049 |
Insert response time histogram: each cell has the percentage of responses that take <= the time in the header and max is the max response time in seconds. For max values in the top 25% of the range have a red background and in the bottom 25% of the range have a green background. The red background is not used when the min value is within 80% of the max value.
| dbms | 256us | 1ms | 4ms | 16ms | 64ms | 256ms | 1s | 4s | 16s | gt | max |
|---|---|---|---|---|---|---|---|---|---|---|---|
| my5621_rel.cy10a_bee | 12.858 | 80.308 | 6.833 | 0.129 | |||||||
| my5651_rel.cy10a_bee | 12.304 | 81.117 | 6.579 | 0.131 | |||||||
| my5710_rel.cy10a_bee | 70.183 | 29.517 | 0.300 | 0.106 | |||||||
| my5721_rel.cy10a_bee | 69.729 | 29.967 | 0.304 | 0.126 | |||||||
| my5732_rel.cy10a_bee | 72.854 | 26.896 | 0.250 | 0.085 | |||||||
| my5743_rel.cy10a_bee | 70.525 | 29.204 | 0.271 | 0.095 | |||||||
| my8013_rel.cy10a_bee | 60.337 | 38.012 | 1.650 | 0.121 | |||||||
| my8020_rel.cy10a_bee | 65.021 | 33.296 | 1.683 | 0.120 | |||||||
| my8027_rel.cy10a_bee | 84.971 | 14.250 | 0.779 | 0.111 | |||||||
| my8034_rel.cy10a_bee | 70.487 | 27.683 | 1.829 | 0.139 |
Delete response time histogram: each cell has the percentage of responses that take <= the time in the header and max is the max response time in seconds. For max values in the top 25% of the range have a red background and in the bottom 25% of the range have a green background. The red background is not used when the min value is within 80% of the max value.
| dbms | 256us | 1ms | 4ms | 16ms | 64ms | 256ms | 1s | 4s | 16s | gt | max |
|---|---|---|---|---|---|---|---|---|---|---|---|
| my5621_rel.cy10a_bee | 7.025 | 89.154 | 3.821 | 0.060 | |||||||
| my5651_rel.cy10a_bee | 7.037 | 89.079 | 3.883 | 0.052 | |||||||
| my5710_rel.cy10a_bee | 96.775 | 3.200 | 0.025 | 0.042 | |||||||
| my5721_rel.cy10a_bee | 96.792 | 3.188 | 0.021 | 0.031 | |||||||
| my5732_rel.cy10a_bee | 96.213 | 3.758 | 0.029 | 0.034 | |||||||
| my5743_rel.cy10a_bee | 96.075 | 3.921 | 0.004 | 0.016 | |||||||
| my8013_rel.cy10a_bee | 96.737 | 2.525 | 0.733 | 0.004 | 0.083 | ||||||
| my8020_rel.cy10a_bee | 93.829 | 4.942 | 1.229 | 0.058 | |||||||
| my8027_rel.cy10a_bee | 96.312 | 3.450 | 0.237 | 0.059 | |||||||
| my8034_rel.cy10a_bee | 74.462 | 25.233 | 0.304 | 0.034 |
Performance metrics for the DBMS listed above. Some are normalized by throughput, others are not. Legend for results is here.
ips	qps	rps	rmbps	wps	wmbps	rpq	rkbpq	wpi	wkbpi	csps	cpups	cspq	cpupq	dbgb1	dbgb2	rss	maxop	p50	p99	tag
998	888	11453	178.5	7526.3	232.2	12.905	205.988	7.545	238.369	49378	15.6	55.637	1406	146.1	186.7	10.5	0.044	880	800	800m.my5621_rel.cy10a_bee
998	880	11408	177.8	7588.3	231.9	12.958	206.836	7.601	237.898	49126	15.5	55.800	1408	146.0	186.7	10.5	0.044	879	815	800m.my5651_rel.cy10a_bee
998	988	12060	188.4	7741.0	238.8	12.201	195.218	7.754	244.955	51964	17.0	52.573	1376	149.5	190.4	10.7	0.049	991	863	800m.my5710_rel.cy10a_bee
998	983	12018	187.8	7735.8	238.5	12.226	195.613	7.749	244.622	52008	17.1	52.907	1392	149.1	190.2	10.7	0.043	991	863	800m.my5721_rel.cy10a_bee
998	969	11944	186.6	7729.8	238.1	12.325	197.205	7.749	244.436	51956	17.1	53.613	1412	149.2	190.1	10.7	0.054	975	831	800m.my5732_rel.cy10a_bee
998	970	11944	186.6	7730.4	238.0	12.316	197.062	7.744	244.141	52646	17.3	54.286	1427	149.2	190.2	10.7	0.043	975	831	800m.my5743_rel.cy10a_bee
998	934	11777	184.0	8901.0	274.0	12.603	201.643	8.916	281.063	79967	26.4	85.572	2260	148.7	151.7	10.7	0.057	928	816	800m.my8013_rel.cy10a_bee
998	975	12007	187.6	9760.4	249.8	12.316	197.058	9.777	256.273	58512	15.7	60.019	1288	148.4	157.4	10.5	0.051	975	895	800m.my8020_rel.cy10a_bee
998	944	11858	185.3	9752.3	249.8	12.565	201.034	9.769	256.242	55493	17.8	58.798	1509	148.4	157.4	10.7	0.158	943	863	800m.my8027_rel.cy10a_bee
997	924	11733	183.3	9965.3	260.2	12.691	203.058	9.999	267.303	54779	19.0	59.253	1644	148.2	157.2	10.7	0.049	927	847	800m.my8034_rel.cy10a_bee
l.i0
l.i0: load without secondary indexes
Performance metrics for all DBMS, not just the ones listed above. Some are normalized by throughput, others are not. Legend for results is here.
ips	qps	rps	rmbps	wps	wmbps	rpq	rkbpq	wpi	wkbpi	csps	cpups	cspq	cpupq	dbgb1	dbgb2	rss	maxop	p50	p99	tag
101087	0	886	3.5	491.7	36.1	0.009	0.035	0.005	0.366	12846	21.8	0.127	17	52.6	93.1	10.6	0.176	101587	85053	800m.my5621_rel.cy10a_bee
95181	0	834	3.3	461.3	34.0	0.009	0.035	0.005	0.366	12099	21.5	0.127	18	52.6	93.1	10.6	0.246	95630	77190	800m.my5651_rel.cy10a_bee
86207	0	0	0.0	431.3	30.9	0.000	0.000	0.005	0.367	9541	21.3	0.111	20	52.6	93.1	10.9	0.135	86477	74823	800m.my5710_rel.cy10a_bee
83446	0	0	0.0	419.7	29.9	0.000	0.000	0.005	0.367	9282	21.7	0.111	21	52.6	93.1	10.9	0.129	83718	72917	800m.my5721_rel.cy10a_bee
82833	0	0	0.0	416.6	29.7	0.000	0.000	0.005	0.367	9199	21.2	0.111	20	52.6	93.1	10.9	0.136	83143	72509	800m.my5732_rel.cy10a_bee
80922	0	0	0.0	407.1	29.0	0.000	0.000	0.005	0.367	9025	21.3	0.112	21	52.6	93.1	10.9	0.132	81108	72221	800m.my5743_rel.cy10a_bee
65816	0	0	0.0	369.9	25.6	0.000	0.000	0.006	0.398	53961	34.4	0.820	42	52.4	55.0	11.1	0.299	65829	59273	800m.my8013_rel.cy10a_bee
62083	0	0	0.0	388.9	23.5	0.000	0.000	0.006	0.387	17109	21.8	0.276	28	52.4	61.0	11.1	0.124	61978	54944	800m.my8020_rel.cy10a_bee
60864	0	0	0.0	377.9	23.0	0.000	0.000	0.006	0.387	7138	20.3	0.117	27	52.4	61.0	11.0	0.249	60934	54168	800m.my8027_rel.cy10a_bee
54866	0	0	0.0	341.2	20.9	0.000	0.000	0.006	0.390	6603	19.7	0.120	29	52.4	61.0	11.1	0.099	55039	49267	800m.my8034_rel.cy10a_bee
l.x
l.x: create secondary indexes
Performance metrics for all DBMS, not just the ones listed above. Some are normalized by throughput, others are not. Legend for results is here.
ips	qps	rps	rmbps	wps	wmbps	rpq	rkbpq	wpi	wkbpi	csps	cpups	cspq	cpupq	dbgb1	dbgb2	rss	maxop	p50	p99	tag
84918	0	559	80.9	699.7	102.5	0.007	0.975	0.008	1.236	1963	11.3	0.023	11	108.4	148.9	10.8	0.015	NA	NA	800m.my5621_rel.cy10a_bee
85226	0	559	81.2	701.0	102.9	0.007	0.976	0.008	1.236	1939	11.2	0.023	11	108.4	148.9	10.8	0.011	NA	NA	800m.my5651_rel.cy10a_bee
118009	0	718	110.7	981.7	132.8	0.006	0.961	0.008	1.152	6552	12.4	0.056	8	117.7	158.2	11.1	0.019	NA	NA	800m.my5710_rel.cy10a_bee
116446	0	702	109.2	975.0	131.1	0.006	0.960	0.008	1.153	6443	12.4	0.055	9	117.7	158.2	11.1	0.011	NA	NA	800m.my5721_rel.cy10a_bee
107627	0	656	101.0	899.5	121.1	0.006	0.961	0.008	1.152	6074	12.1	0.056	9	117.7	158.2	11.1	0.016	NA	NA	800m.my5732_rel.cy10a_bee
108195	0	656	101.5	897.5	121.6	0.006	0.960	0.008	1.151	6078	12.0	0.056	9	117.7	158.2	11.1	0.015	NA	NA	800m.my5743_rel.cy10a_bee
105666	0	623	99.0	752.8	118.5	0.006	0.960	0.007	1.149	9515	13.8	0.090	10	117.2	119.8	11.3	0.015	NA	NA	800m.my8013_rel.cy10a_bee
102432	0	610	96.1	827.4	114.9	0.006	0.960	0.008	1.148	6377	12.1	0.062	9	117.2	125.8	11.3	0.020	NA	NA	800m.my8020_rel.cy10a_bee
113845	0	1838	172.4	2205.6	153.3	0.016	1.550	0.019	1.378	8830	43.6	0.078	31	117.2	125.8	11.2	0.011	NA	NA	800m.my8027_rel.cy10a_bee
106142	0	1714	160.6	2062.4	142.8	0.016	1.550	0.019	1.378	8499	43.6	0.080	33	117.2	125.8	11.3	0.012	NA	NA	800m.my8034_rel.cy10a_bee
l.i1
l.i1: continue load after secondary indexes created
Performance metrics for all DBMS, not just the ones listed above. Some are normalized by throughput, others are not. Legend for results is here.
ips	qps	rps	rmbps	wps	wmbps	rpq	rkbpq	wpi	wkbpi	csps	cpups	cspq	cpupq	dbgb1	dbgb2	rss	maxop	p50	p99	tag
1315	0	7588	118.0	9832.8	315.7	5.771	91.885	7.479	245.927	46337	14.7	35.245	894	146.1	186.7	10.5	0.873	1249	699	800m.my5621_rel.cy10a_bee
1304	0	7551	117.4	9869.9	314.1	5.790	92.183	7.568	246.645	45958	14.7	35.242	902	146.0	186.7	10.5	0.777	1249	649	800m.my5651_rel.cy10a_bee
1823	0	9116	142.4	12135.0	389.4	5.000	79.993	6.655	218.692	58191	22.9	31.914	1005	149.5	190.4	10.7	0.299	1698	749	800m.my5710_rel.cy10a_bee
1810	0	9166	143.2	12172.4	390.5	5.065	81.040	6.727	220.955	58720	22.9	32.449	1012	149.1	190.2	10.7	0.549	1698	749	800m.my5721_rel.cy10a_bee
1761	0	8896	139.0	11822.7	379.1	5.051	80.822	6.713	220.442	57149	22.3	32.450	1013	149.2	190.1	10.7	0.322	1599	699	800m.my5732_rel.cy10a_bee
1746	0	8824	137.9	11732.4	376.3	5.055	80.874	6.720	220.692	57680	22.4	33.039	1026	149.2	190.2	10.7	0.346	1599	699	800m.my5743_rel.cy10a_bee
1730	0	8713	136.1	12658.6	403.3	5.038	80.607	7.319	238.812	94914	34.0	54.879	1573	148.7	151.7	10.7	0.308	1598	749	800m.my8013_rel.cy10a_bee
1746	0	8907	139.2	14267.3	379.1	5.102	81.630	8.172	222.364	71840	17.9	41.150	820	148.4	157.4	10.5	0.379	1648	699	800m.my8020_rel.cy10a_bee
1836	0	9336	145.9	14956.3	397.7	5.086	81.382	8.148	221.896	65767	23.3	35.831	1016	148.4	157.4	10.7	0.310	1699	699	800m.my8027_rel.cy10a_bee
1743	0	8962	140.0	14525.6	397.6	5.143	82.283	8.335	233.629	60209	24.2	34.549	1111	148.2	157.2	10.7	0.358	1648	699	800m.my8034_rel.cy10a_bee
q100.1
q100.1: range queries with 100 insert/s per client
Performance metrics for all DBMS, not just the ones listed above. Some are normalized by throughput, others are not. Legend for results is here.
ips	qps	rps	rmbps	wps	wmbps	rpq	rkbpq	wpi	wkbpi	csps	cpups	cspq	cpupq	dbgb1	dbgb2	rss	maxop	p50	p99	tag
100	1024	9884	154.4	5678.3	174.8	9.649	154.317	56.897	1793.718	39389	10.6	38.451	828	146.1	186.7	10.5	0.048	927	751	800m.my5621_rel.cy10a_bee
100	1026	9823	153.4	5659.0	172.6	9.574	153.116	56.704	1771.365	39216	10.5	38.222	819	146.0	186.7	10.5	0.048	911	751	800m.my5651_rel.cy10a_bee
100	943	11709	183.0	8438.2	241.6	12.419	198.696	84.721	2483.839	52656	16.7	55.844	1417	149.5	190.4	10.7	0.041	943	751	800m.my5710_rel.cy10a_bee
100	941	11483	179.4	8353.9	234.9	12.207	195.313	83.790	2413.037	52035	16.4	55.315	1395	149.1	190.2	10.7	0.046	927	783	800m.my5721_rel.cy10a_bee
100	948	11562	180.6	8016.4	236.3	12.201	195.214	80.325	2424.082	51507	16.6	54.356	1401	149.2	190.1	10.7	0.039	943	783	800m.my5732_rel.cy10a_bee
100	926	11453	178.9	8476.1	235.6	12.372	197.950	84.846	2415.415	52964	16.6	57.215	1435	149.2	190.2	10.7	0.046	927	799	800m.my5743_rel.cy10a_bee
100	903	11454	179.0	9544.8	281.9	12.685	202.958	95.735	2895.077	88273	29.6	97.756	2622	148.7	151.7	10.7	0.045	911	719	800m.my8013_rel.cy10a_bee
100	979	11641	181.9	9689.2	247.6	11.896	190.334	97.086	2540.620	59239	14.3	60.534	1169	148.4	157.4	10.5	0.051	975	815	800m.my8020_rel.cy10a_bee
100	949	11361	177.5	9569.9	244.8	11.974	191.592	95.795	2508.784	53723	17.4	56.622	1467	148.4	157.4	10.7	0.088	927	783	800m.my8027_rel.cy10a_bee
100	929	11196	174.9	9728.3	252.5	12.054	192.860	97.772	2598.095	52472	18.0	56.494	1550	148.2	157.2	10.7	0.060	927	704	800m.my8034_rel.cy10a_bee
q500.1
q500.1: range queries with 500 insert/s per client
Performance metrics for all DBMS, not just the ones listed above. Some are normalized by throughput, others are not. Legend for results is here.
ips	qps	rps	rmbps	wps	wmbps	rpq	rkbpq	wpi	wkbpi	csps	cpups	cspq	cpupq	dbgb1	dbgb2	rss	maxop	p50	p99	tag
499	1132	9376	146.3	4071.5	125.5	8.279	132.264	8.164	257.719	34456	10.4	30.425	735	146.1	186.7	10.5	0.040	1135	1054	800m.my5621_rel.cy10a_bee
499	1127	9338	145.7	4104.8	125.2	8.288	132.405	8.224	256.931	34312	10.4	30.451	738	146.0	186.7	10.5	0.042	1119	1055	800m.my5651_rel.cy10a_bee
499	1109	9338	145.9	4360.8	133.4	8.420	134.713	8.744	274.013	36054	11.6	32.507	837	149.5	190.4	10.7	0.047	1103	1052	800m.my5710_rel.cy10a_bee
499	1106	9301	145.3	4308.5	131.9	8.409	134.541	8.632	270.532	35848	11.6	32.409	839	149.1	190.2	10.7	0.040	1103	1039	800m.my5721_rel.cy10a_bee
499	1087	9223	144.1	4295.7	131.9	8.484	135.736	8.614	270.907	35553	11.6	32.701	854	149.2	190.1	10.7	0.044	1087	1023	800m.my5732_rel.cy10a_bee
499	1082	9203	143.8	4318.6	132.6	8.503	136.046	8.660	272.236	35900	11.7	33.170	865	149.2	190.2	10.7	0.052	1087	1023	800m.my5743_rel.cy10a_bee
499	1046	9079	141.9	4948.4	151.8	8.678	138.855	9.915	311.455	48708	15.9	46.557	1216	148.7	151.7	10.7	0.039	1055	974	800m.my8013_rel.cy10a_bee
499	1067	9146	142.9	5391.5	137.6	8.572	137.148	10.802	282.377	38075	11.2	35.684	840	148.4	157.4	10.5	0.047	1071	991	800m.my8020_rel.cy10a_bee
499	1039	9008	140.7	5353.3	136.8	8.672	138.757	10.734	280.861	37179	12.4	35.794	955	148.4	157.4	10.7	0.078	1039	975	800m.my8027_rel.cy10a_bee
499	1022	8905	139.1	5434.0	141.6	8.714	139.418	10.896	290.813	36638	12.9	35.850	1010	148.2	157.2	10.7	0.049	1023	959	800m.my8034_rel.cy10a_bee
q1000.1
q1000.1: range queries with 1000 insert/s per client
Performance metrics for all DBMS, not just the ones listed above. Some are normalized by throughput, others are not. Legend for results is here.
ips	qps	rps	rmbps	wps	wmbps	rpq	rkbpq	wpi	wkbpi	csps	cpups	cspq	cpupq	dbgb1	dbgb2	rss	maxop	p50	p99	tag
998	888	11453	178.5	7526.3	232.2	12.905	205.988	7.545	238.369	49378	15.6	55.637	1406	146.1	186.7	10.5	0.044	880	800	800m.my5621_rel.cy10a_bee
998	880	11408	177.8	7588.3	231.9	12.958	206.836	7.601	237.898	49126	15.5	55.800	1408	146.0	186.7	10.5	0.044	879	815	800m.my5651_rel.cy10a_bee
998	988	12060	188.4	7741.0	238.8	12.201	195.218	7.754	244.955	51964	17.0	52.573	1376	149.5	190.4	10.7	0.049	991	863	800m.my5710_rel.cy10a_bee
998	983	12018	187.8	7735.8	238.5	12.226	195.613	7.749	244.622	52008	17.1	52.907	1392	149.1	190.2	10.7	0.043	991	863	800m.my5721_rel.cy10a_bee
998	969	11944	186.6	7729.8	238.1	12.325	197.205	7.749	244.436	51956	17.1	53.613	1412	149.2	190.1	10.7	0.054	975	831	800m.my5732_rel.cy10a_bee
998	970	11944	186.6	7730.4	238.0	12.316	197.062	7.744	244.141	52646	17.3	54.286	1427	149.2	190.2	10.7	0.043	975	831	800m.my5743_rel.cy10a_bee
998	934	11777	184.0	8901.0	274.0	12.603	201.643	8.916	281.063	79967	26.4	85.572	2260	148.7	151.7	10.7	0.057	928	816	800m.my8013_rel.cy10a_bee
998	975	12007	187.6	9760.4	249.8	12.316	197.058	9.777	256.273	58512	15.7	60.019	1288	148.4	157.4	10.5	0.051	975	895	800m.my8020_rel.cy10a_bee
998	944	11858	185.3	9752.3	249.8	12.565	201.034	9.769	256.242	55493	17.8	58.798	1509	148.4	157.4	10.7	0.158	943	863	800m.my8027_rel.cy10a_bee
997	924	11733	183.3	9965.3	260.2	12.691	203.058	9.999	267.303	54779	19.0	59.253	1644	148.2	157.2	10.7	0.049	927	847	800m.my8034_rel.cy10a_bee
l.i0
- l.i0: load without secondary indexes
- Legend for results is here.
- Each entry lists the percentage of responses that fit in that bucket (slower than max time for previous bucket, faster than min time for next bucket).
Insert response time histogram
256us	1ms	4ms	16ms	64ms	256ms	1s	4s	16s	gt	max	tag
0.000	92.981	6.891	0.107	0.017	0.004	0.000	0.000	0.000	0.000	0.176	my5621_rel.cy10a_bee
0.000	83.653	16.205	0.069	0.070	0.004	0.000	0.000	0.000	0.000	0.246	my5651_rel.cy10a_bee
0.000	6.055	93.652	0.286	0.004	0.003	0.000	0.000	0.000	0.000	0.135	my5710_rel.cy10a_bee
0.000	0.651	99.047	0.295	0.005	0.003	0.000	0.000	0.000	0.000	0.129	my5721_rel.cy10a_bee
0.000	1.484	98.189	0.189	0.137	0.003	0.000	0.000	0.000	0.000	0.136	my5732_rel.cy10a_bee
0.000	0.330	99.338	0.190	0.140	0.002	0.000	0.000	0.000	0.000	0.132	my5743_rel.cy10a_bee
0.000	0.000	99.335	0.498	0.164	0.003	nonzero	0.000	0.000	0.000	0.299	my8013_rel.cy10a_bee
0.000	0.000	99.302	0.523	0.171	0.004	0.000	0.000	0.000	0.000	0.124	my8020_rel.cy10a_bee
0.000	0.000	99.455	0.395	0.146	0.004	0.000	0.000	0.000	0.000	0.249	my8027_rel.cy10a_bee
0.000	0.000	99.358	0.488	0.150	0.003	0.000	0.000	0.000	0.000	0.099	my8034_rel.cy10a_bee
l.x
- l.x: create secondary indexes
- Legend for results is here.
- Each entry lists the percentage of responses that fit in that bucket (slower than max time for previous bucket, faster than min time for next bucket).
TODO - determine whether there is data for create index response time
l.i1
- l.i1: continue load after secondary indexes created
- Legend for results is here.
- Each entry lists the percentage of responses that fit in that bucket (slower than max time for previous bucket, faster than min time for next bucket).
Insert response time histogram
256us	1ms	4ms	16ms	64ms	256ms	1s	4s	16s	gt	max	tag
0.000	0.000	0.000	1.828	87.643	10.527	0.002	0.000	0.000	0.000	0.873	my5621_rel.cy10a_bee
0.000	0.000	0.000	1.815	87.164	11.016	0.005	0.000	0.000	0.000	0.777	my5651_rel.cy10a_bee
0.000	0.000	0.000	34.268	60.133	5.596	0.003	0.000	0.000	0.000	0.299	my5710_rel.cy10a_bee
0.000	0.000	0.000	32.822	61.618	5.557	0.003	0.000	0.000	0.000	0.549	my5721_rel.cy10a_bee
0.000	0.000	0.000	32.889	60.796	6.312	0.003	0.000	0.000	0.000	0.322	my5732_rel.cy10a_bee
0.000	0.000	0.000	32.006	61.564	6.428	0.002	0.000	0.000	0.000	0.346	my5743_rel.cy10a_bee
0.000	0.000	0.000	31.457	61.764	6.776	0.003	0.000	0.000	0.000	0.308	my8013_rel.cy10a_bee
0.000	0.000	0.000	27.856	65.646	6.496	0.002	0.000	0.000	0.000	0.379	my8020_rel.cy10a_bee
0.000	0.000	0.000	33.397	60.836	5.766	0.001	0.000	0.000	0.000	0.310	my8027_rel.cy10a_bee
0.000	0.000	0.000	28.273	65.447	6.279	0.001	0.000	0.000	0.000	0.358	my8034_rel.cy10a_bee
Delete response time histogram
256us	1ms	4ms	16ms	64ms	256ms	1s	4s	16s	gt	max	tag
0.000	0.000	2.951	91.090	5.955	0.003	0.001	0.000	0.000	0.000	0.733	my5621_rel.cy10a_bee
0.000	0.000	3.295	90.845	5.853	0.006	0.001	0.000	0.000	0.000	0.598	my5651_rel.cy10a_bee
0.000	0.000	91.756	8.037	0.199	0.008	0.000	0.000	0.000	0.000	0.117	my5710_rel.cy10a_bee
0.000	0.000	91.759	8.024	0.206	0.011	0.000	0.000	0.000	0.000	0.139	my5721_rel.cy10a_bee
0.000	0.000	92.131	7.627	0.238	0.004	0.000	0.000	0.000	0.000	0.141	my5732_rel.cy10a_bee
0.000	0.000	89.574	10.143	0.276	0.007	0.000	0.000	0.000	0.000	0.087	my5743_rel.cy10a_bee
0.000	0.000	82.726	15.260	1.976	0.038	0.000	0.000	0.000	0.000	0.118	my8013_rel.cy10a_bee
0.000	0.000	77.227	21.497	1.250	0.026	0.000	0.000	0.000	0.000	0.101	my8020_rel.cy10a_bee
0.000	0.000	68.088	31.547	0.359	0.006	0.000	0.000	0.000	0.000	0.220	my8027_rel.cy10a_bee
0.000	0.000	25.187	74.434	0.377	0.002	0.000	0.000	0.000	0.000	0.068	my8034_rel.cy10a_bee
q100.1
- q100.1: range queries with 100 insert/s per client
- Legend for results is here.
- Each entry lists the percentage of responses that fit in that bucket (slower than max time for previous bucket, faster than min time for next bucket).
Query response time histogram
256us	1ms	4ms	16ms	64ms	256ms	1s	4s	16s	gt	max	tag
28.918	16.794	52.799	1.480	0.009	0.000	0.000	0.000	0.000	0.000	0.048	my5621_rel.cy10a_bee
28.636	17.047	52.782	1.527	0.009	0.000	0.000	0.000	0.000	0.000	0.048	my5651_rel.cy10a_bee
12.008	30.501	55.350	2.130	0.011	0.000	0.000	0.000	0.000	0.000	0.041	my5710_rel.cy10a_bee
10.970	31.394	55.549	2.077	0.010	0.000	0.000	0.000	0.000	0.000	0.046	my5721_rel.cy10a_bee
9.245	32.788	55.904	2.053	0.010	0.000	0.000	0.000	0.000	0.000	0.039	my5732_rel.cy10a_bee
8.906	32.900	56.017	2.166	0.011	0.000	0.000	0.000	0.000	0.000	0.046	my5743_rel.cy10a_bee
15.892	26.081	55.422	2.590	0.014	0.000	0.000	0.000	0.000	0.000	0.045	my8013_rel.cy10a_bee
12.429	29.792	56.272	1.481	0.027	0.000	0.000	0.000	0.000	0.000	0.051	my8020_rel.cy10a_bee
3.688	37.690	56.940	1.660	0.022	nonzero	0.000	0.000	0.000	0.000	0.088	my8027_rel.cy10a_bee
3.785	37.290	57.221	1.678	0.025	0.000	0.000	0.000	0.000	0.000	0.060	my8034_rel.cy10a_bee
Insert response time histogram
256us	1ms	4ms	16ms	64ms	256ms	1s	4s	16s	gt	max	tag
0.000	0.000	0.000	0.917	78.708	20.375	0.000	0.000	0.000	0.000	0.125	my5621_rel.cy10a_bee
0.000	0.000	0.000	2.708	60.875	36.417	0.000	0.000	0.000	0.000	0.125	my5651_rel.cy10a_bee
0.000	0.000	0.000	21.708	64.417	13.875	0.000	0.000	0.000	0.000	0.119	my5710_rel.cy10a_bee
0.000	0.000	0.000	28.333	59.375	12.292	0.000	0.000	0.000	0.000	0.105	my5721_rel.cy10a_bee
0.000	0.000	0.000	40.083	48.292	11.625	0.000	0.000	0.000	0.000	0.115	my5732_rel.cy10a_bee
0.000	0.000	0.000	20.208	65.000	14.792	0.000	0.000	0.000	0.000	0.104	my5743_rel.cy10a_bee
0.000	0.000	0.000	37.750	52.417	9.833	0.000	0.000	0.000	0.000	0.111	my8013_rel.cy10a_bee
0.000	0.000	0.000	32.833	64.417	2.750	0.000	0.000	0.000	0.000	0.110	my8020_rel.cy10a_bee
0.000	0.000	0.000	38.875	57.042	4.083	0.000	0.000	0.000	0.000	0.124	my8027_rel.cy10a_bee
0.000	0.000	0.000	27.542	69.083	3.375	0.000	0.000	0.000	0.000	0.121	my8034_rel.cy10a_bee
Delete response time histogram
256us	1ms	4ms	16ms	64ms	256ms	1s	4s	16s	gt	max	tag
0.000	0.000	9.542	68.542	21.917	0.000	0.000	0.000	0.000	0.000	0.060	my5621_rel.cy10a_bee
0.000	0.000	11.167	67.708	21.125	0.000	0.000	0.000	0.000	0.000	0.052	my5651_rel.cy10a_bee
0.000	0.000	52.750	47.167	0.083	0.000	0.000	0.000	0.000	0.000	0.019	my5710_rel.cy10a_bee
0.000	0.000	54.958	45.000	0.042	0.000	0.000	0.000	0.000	0.000	0.018	my5721_rel.cy10a_bee
0.000	0.000	56.625	43.250	0.125	0.000	0.000	0.000	0.000	0.000	0.034	my5732_rel.cy10a_bee
0.000	0.000	49.708	49.917	0.375	0.000	0.000	0.000	0.000	0.000	0.036	my5743_rel.cy10a_bee
0.000	0.000	69.667	29.625	0.708	0.000	0.000	0.000	0.000	0.000	0.058	my8013_rel.cy10a_bee
0.000	0.000	69.375	30.125	0.500	0.000	0.000	0.000	0.000	0.000	0.038	my8020_rel.cy10a_bee
0.000	0.000	40.208	59.542	0.250	0.000	0.000	0.000	0.000	0.000	0.028	my8027_rel.cy10a_bee
0.000	0.000	22.417	76.167	1.417	0.000	0.000	0.000	0.000	0.000	0.042	my8034_rel.cy10a_bee
q500.1
- q500.1: range queries with 500 insert/s per client
- Legend for results is here.
- Each entry lists the percentage of responses that fit in that bucket (slower than max time for previous bucket, faster than min time for next bucket).
Query response time histogram
256us	1ms	4ms	16ms	64ms	256ms	1s	4s	16s	gt	max	tag
32.561	15.008	51.658	0.768	0.004	0.000	0.000	0.000	0.000	0.000	0.040	my5621_rel.cy10a_bee
32.191	15.226	51.790	0.789	0.004	0.000	0.000	0.000	0.000	0.000	0.042	my5651_rel.cy10a_bee
14.763	31.979	52.263	0.990	0.005	0.000	0.000	0.000	0.000	0.000	0.047	my5710_rel.cy10a_bee
11.838	34.719	52.499	0.939	0.004	0.000	0.000	0.000	0.000	0.000	0.040	my5721_rel.cy10a_bee
10.002	35.910	53.111	0.972	0.005	0.000	0.000	0.000	0.000	0.000	0.044	my5732_rel.cy10a_bee
8.725	37.038	53.270	0.963	0.004	0.000	0.000	0.000	0.000	0.000	0.052	my5743_rel.cy10a_bee
12.323	32.379	54.251	1.041	0.006	0.000	0.000	0.000	0.000	0.000	0.039	my8013_rel.cy10a_bee
10.416	34.493	54.332	0.745	0.013	0.000	0.000	0.000	0.000	0.000	0.047	my8020_rel.cy10a_bee
4.120	40.356	54.671	0.840	0.014	nonzero	0.000	0.000	0.000	0.000	0.078	my8027_rel.cy10a_bee
3.944	40.339	54.847	0.861	0.010	0.000	0.000	0.000	0.000	0.000	0.049	my8034_rel.cy10a_bee
Insert response time histogram
256us	1ms	4ms	16ms	64ms	256ms	1s	4s	16s	gt	max	tag
0.000	0.000	0.000	1.625	94.658	3.717	0.000	0.000	0.000	0.000	0.112	my5621_rel.cy10a_bee
0.000	0.000	0.000	1.275	94.208	4.517	0.000	0.000	0.000	0.000	0.127	my5651_rel.cy10a_bee
0.000	0.000	0.000	49.617	49.508	0.875	0.000	0.000	0.000	0.000	0.107	my5710_rel.cy10a_bee
0.000	0.000	0.000	51.050	48.225	0.725	0.000	0.000	0.000	0.000	0.095	my5721_rel.cy10a_bee
0.000	0.000	0.000	64.025	35.675	0.300	0.000	0.000	0.000	0.000	0.095	my5732_rel.cy10a_bee
0.000	0.000	0.000	60.683	39.067	0.250	0.000	0.000	0.000	0.000	0.088	my5743_rel.cy10a_bee
0.000	0.000	0.000	40.758	58.758	0.483	0.000	0.000	0.000	0.000	0.099	my8013_rel.cy10a_bee
0.000	0.000	0.000	20.367	79.583	0.050	0.000	0.000	0.000	0.000	0.090	my8020_rel.cy10a_bee
0.000	0.000	0.000	46.975	52.917	0.108	0.000	0.000	0.000	0.000	0.098	my8027_rel.cy10a_bee
0.000	0.000	0.000	27.992	72.008	0.000	0.000	0.000	0.000	0.000	0.061	my8034_rel.cy10a_bee
Delete response time histogram
256us	1ms	4ms	16ms	64ms	256ms	1s	4s	16s	gt	max	tag
0.000	0.000	14.617	80.033	5.342	0.008	0.000	0.000	0.000	0.000	0.071	my5621_rel.cy10a_bee
0.000	0.000	15.250	79.033	5.700	0.017	0.000	0.000	0.000	0.000	0.087	my5651_rel.cy10a_bee
0.000	0.000	99.017	0.983	0.000	0.000	0.000	0.000	0.000	0.000	0.013	my5710_rel.cy10a_bee
0.000	0.000	99.017	0.983	0.000	0.000	0.000	0.000	0.000	0.000	0.015	my5721_rel.cy10a_bee
0.000	0.000	94.658	5.342	0.000	0.000	0.000	0.000	0.000	0.000	0.015	my5732_rel.cy10a_bee
0.000	0.000	94.283	5.717	0.000	0.000	0.000	0.000	0.000	0.000	0.014	my5743_rel.cy10a_bee
0.000	0.000	94.133	5.250	0.617	0.000	0.000	0.000	0.000	0.000	0.052	my8013_rel.cy10a_bee
0.000	0.000	91.483	8.342	0.175	0.000	0.000	0.000	0.000	0.000	0.032	my8020_rel.cy10a_bee
0.000	0.000	98.300	1.700	0.000	0.000	0.000	0.000	0.000	0.000	0.014	my8027_rel.cy10a_bee
0.000	0.000	90.125	9.808	0.067	0.000	0.000	0.000	0.000	0.000	0.026	my8034_rel.cy10a_bee
q1000.1
- q1000.1: range queries with 1000 insert/s per client
- Legend for results is here.
- Each entry lists the percentage of responses that fit in that bucket (slower than max time for previous bucket, faster than min time for next bucket).
Query response time histogram
256us	1ms	4ms	16ms	64ms	256ms	1s	4s	16s	gt	max	tag
22.007	18.855	56.819	2.309	0.011	0.000	0.000	0.000	0.000	0.000	0.044	my5621_rel.cy10a_bee
20.336	20.390	56.918	2.344	0.011	0.000	0.000	0.000	0.000	0.000	0.044	my5651_rel.cy10a_bee
13.361	30.153	54.532	1.943	0.011	0.000	0.000	0.000	0.000	0.000	0.049	my5710_rel.cy10a_bee
11.200	32.053	54.788	1.948	0.010	0.000	0.000	0.000	0.000	0.000	0.043	my5721_rel.cy10a_bee
9.780	32.922	55.305	1.982	0.011	0.000	0.000	0.000	0.000	0.000	0.054	my5732_rel.cy10a_bee
9.625	33.116	55.248	2.000	0.011	0.000	0.000	0.000	0.000	0.000	0.043	my5743_rel.cy10a_bee
14.028	28.165	55.454	2.339	0.013	0.000	0.000	0.000	0.000	0.000	0.057	my8013_rel.cy10a_bee
11.927	30.206	56.335	1.493	0.039	0.000	0.000	0.000	0.000	0.000	0.051	my8020_rel.cy10a_bee
3.853	37.637	56.815	1.661	0.034	nonzero	0.000	0.000	0.000	0.000	0.158	my8027_rel.cy10a_bee
3.832	37.235	57.164	1.741	0.029	0.000	0.000	0.000	0.000	0.000	0.049	my8034_rel.cy10a_bee
Insert response time histogram
256us	1ms	4ms	16ms	64ms	256ms	1s	4s	16s	gt	max	tag
0.000	0.000	0.000	12.858	80.308	6.833	0.000	0.000	0.000	0.000	0.129	my5621_rel.cy10a_bee
0.000	0.000	0.000	12.304	81.117	6.579	0.000	0.000	0.000	0.000	0.131	my5651_rel.cy10a_bee
0.000	0.000	0.000	70.183	29.517	0.300	0.000	0.000	0.000	0.000	0.106	my5710_rel.cy10a_bee
0.000	0.000	0.000	69.729	29.967	0.304	0.000	0.000	0.000	0.000	0.126	my5721_rel.cy10a_bee
0.000	0.000	0.000	72.854	26.896	0.250	0.000	0.000	0.000	0.000	0.085	my5732_rel.cy10a_bee
0.000	0.000	0.000	70.525	29.204	0.271	0.000	0.000	0.000	0.000	0.095	my5743_rel.cy10a_bee
0.000	0.000	0.000	60.337	38.012	1.650	0.000	0.000	0.000	0.000	0.121	my8013_rel.cy10a_bee
0.000	0.000	0.000	65.021	33.296	1.683	0.000	0.000	0.000	0.000	0.120	my8020_rel.cy10a_bee
0.000	0.000	0.000	84.971	14.250	0.779	0.000	0.000	0.000	0.000	0.111	my8027_rel.cy10a_bee
0.000	0.000	0.000	70.487	27.683	1.829	0.000	0.000	0.000	0.000	0.139	my8034_rel.cy10a_bee
Delete response time histogram
256us	1ms	4ms	16ms	64ms	256ms	1s	4s	16s	gt	max	tag
0.000	0.000	7.025	89.154	3.821	0.000	0.000	0.000	0.000	0.000	0.060	my5621_rel.cy10a_bee
0.000	0.000	7.037	89.079	3.883	0.000	0.000	0.000	0.000	0.000	0.052	my5651_rel.cy10a_bee
0.000	0.000	96.775	3.200	0.025	0.000	0.000	0.000	0.000	0.000	0.042	my5710_rel.cy10a_bee
0.000	0.000	96.792	3.188	0.021	0.000	0.000	0.000	0.000	0.000	0.031	my5721_rel.cy10a_bee
0.000	0.000	96.213	3.758	0.029	0.000	0.000	0.000	0.000	0.000	0.034	my5732_rel.cy10a_bee
0.000	0.000	96.075	3.921	0.004	0.000	0.000	0.000	0.000	0.000	0.016	my5743_rel.cy10a_bee
0.000	0.000	96.737	2.525	0.733	0.004	0.000	0.000	0.000	0.000	0.083	my8013_rel.cy10a_bee
0.000	0.000	93.829	4.942	1.229	0.000	0.000	0.000	0.000	0.000	0.058	my8020_rel.cy10a_bee
0.000	0.000	96.312	3.450	0.237	0.000	0.000	0.000	0.000	0.000	0.059	my8027_rel.cy10a_bee
0.000	0.000	74.462	25.233	0.304	0.000	0.000	0.000	0.000	0.000	0.034	my8034_rel.cy10a_bee