Introduction
This is a report for the insert benchmark with 4000M docs and 8 client(s). It is generated by scripts (bash, awk, sed) and Tufte might not be impressed. An overview of the insert benchmark is here and a short update is here. Below, by DBMS, I mean DBMS+version.config. An example is my8020.c10b40 where my means MySQL, 8020 is version 8.0.20 and c10b40 is the name for the configuration file.
The test server is a c2-standard-30 with 15 cores, hyperthreads disabled, 120G RAM and XFS with SW RAID 0 across 4 NVMe SSD. The benchmark was run with 8 clients and there were 1 or 3 connections per client (1 for queries or inserts without rate limits, 1+1 for rate limited inserts+deletes). It uses 8 tables, 1 per client. It loads 500M rows per table without secondary indexes, creates secondary indexes, then inserts 60M rows per table with a delete per insert to avoid growing the table. It then does 3 read+write tests for 7200s each that do queries as fast as possible with 100, 500 and then 1000 inserts/second/client concurrent with the queries. There are also deletes to match the inserts and avoid growing the table. The database is larger than memory. Clients and the DBMS share one server. The per-database configs are in the per-database subdirectories here.
The tested DBMS are:
- pg152_o3_native_lto.cx7a28_gcp_c2s30 - Postgres 15.2, o3_native_lto build, cx7a28_gcp_c2s30 config
- pg153_o3_native_lto.cx7a28_gcp_c2s30 - Postgres 15.3, o3_native_lto build, cx7a28_gcp_c2s30 config
- pg154_o3_native_lto.cx7a28_gcp_c2s30 - Postgres 15.4, o3_native_lto build, cx7a28_gcp_c2s30 config
- pg16beta1_o3_native_lto.cx7a28_gcp_c2s30 - Postgres 16 beta1, o3_native_lto build, cx7a28_gcp_c2s30 config
- pg16beta2_o3_native_lto.cx7a28_gcp_c2s30 - Postgres 16 beta2, o3_native_lto build, cx7a28_gcp_c2s30 config
- pg16beta3_o3_native_lto.cx7a28_gcp_c2s30 - Postgres 16 beta3, o3_native_lto build, cx7a28_gcp_c2s30 config
- pg16rc1_o3_native_lto.cx7a28_gcp_c2s30 - Postgres 16 rc1, o3_native_lto build, cx7a28_gcp_c2s30 config
- pg160_o3_native_lto.cx7a28_gcp_c2s30 - Postgres 16.0, o3_native_lto build, cx7a28_gcp_c2s30 config
Contents
- Summary
- l.i0: load without secondary indexes
- l.x: create secondary indexes
- l.i1: continue load after secondary indexes created
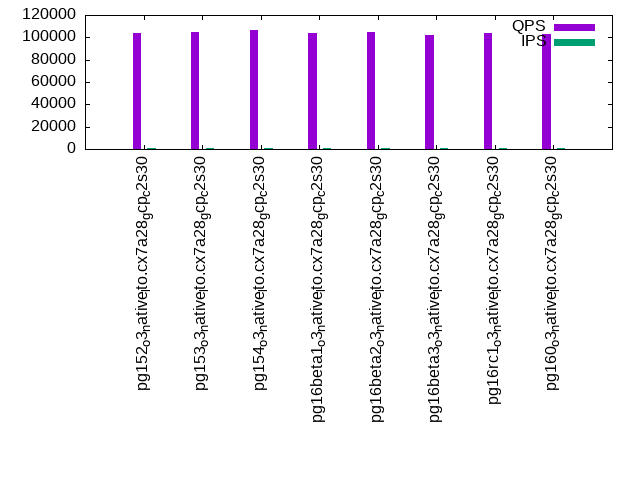
- q100.1: range queries with 100 insert/s per client
- q500.1: range queries with 500 insert/s per client
- q1000.1: range queries with 1000 insert/s per client
Summary
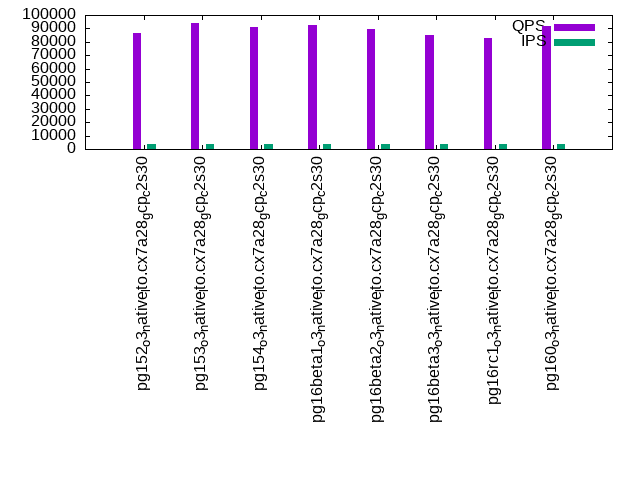
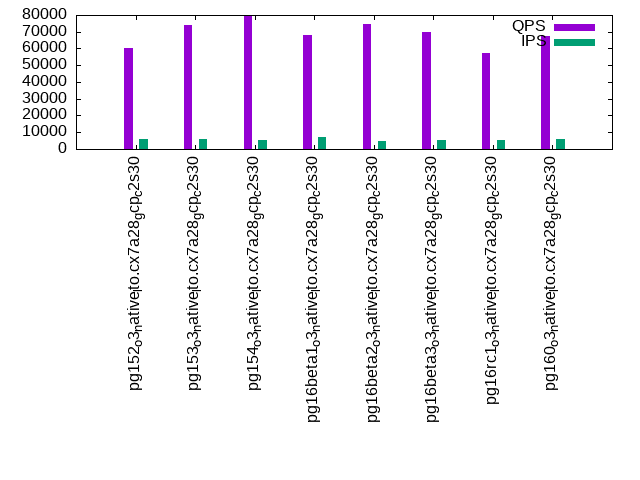
The numbers are inserts/s for l.i0 and l.i1, indexed docs (or rows) /s for l.x and queries/s for q*.2. The values are the average rate over the entire test for inserts (IPS) and queries (QPS). The range of values for IPS and QPS is split into 3 parts: bottom 25%, middle 50%, top 25%. Values in the bottom 25% have a red background, values in the top 25% have a green background and values in the middle have no color. A gray background is used for values that can be ignored because the DBMS did not sustain the target insert rate. Red backgrounds are not used when the minimum value is within 80% of the max value.
| dbms | l.i0 | l.x | l.i1 | q100.1 | q500.1 | q1000.1 |
|---|---|---|---|---|---|---|
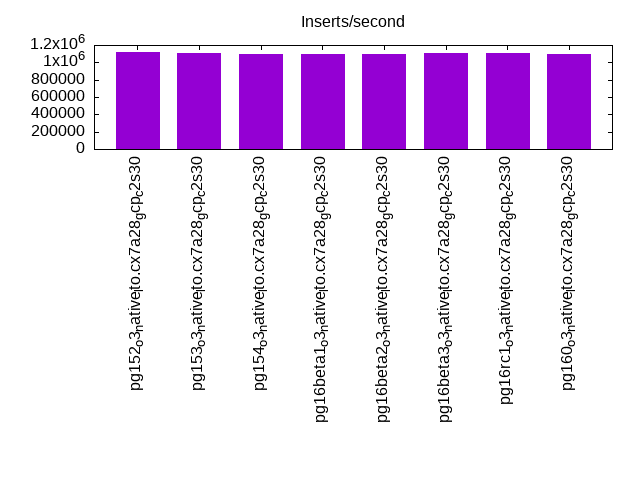
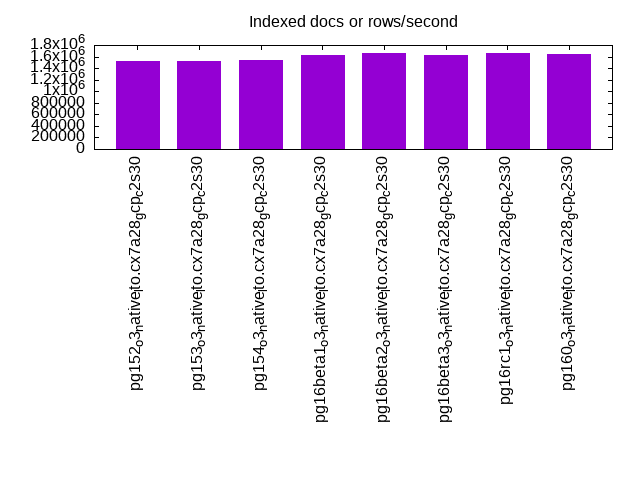
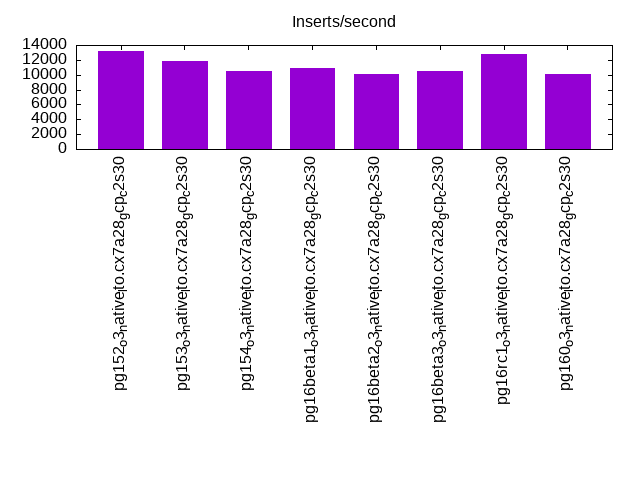
| pg152_o3_native_lto.cx7a28_gcp_c2s30 | 1121076 | 1529675 | 13232 | 103698 | 86321 | 60529 |
| pg153_o3_native_lto.cx7a28_gcp_c2s30 | 1107726 | 1522108 | 11910 | 104849 | 94240 | 73961 |
| pg154_o3_native_lto.cx7a28_gcp_c2s30 | 1094092 | 1546829 | 10464 | 106504 | 90672 | 79373 |
| pg16beta1_o3_native_lto.cx7a28_gcp_c2s30 | 1092598 | 1626057 | 10866 | 103881 | 92306 | 68307 |
| pg16beta2_o3_native_lto.cx7a28_gcp_c2s30 | 1098298 | 1662552 | 10077 | 104484 | 89502 | 74568 |
| pg16beta3_o3_native_lto.cx7a28_gcp_c2s30 | 1105583 | 1631362 | 10481 | 102381 | 85287 | 70070 |
| pg16rc1_o3_native_lto.cx7a28_gcp_c2s30 | 1110802 | 1654301 | 12777 | 103690 | 83122 | 57132 |
| pg160_o3_native_lto.cx7a28_gcp_c2s30 | 1094092 | 1646132 | 10157 | 103388 | 92147 | 67567 |
This table has relative throughput, throughput for the DBMS relative to the DBMS in the first line, using the absolute throughput from the previous table. Values less than 0.95 have a yellow background. Values greater than 1.05 have a blue background.
| dbms | l.i0 | l.x | l.i1 | q100.1 | q500.1 | q1000.1 |
|---|---|---|---|---|---|---|
| pg152_o3_native_lto.cx7a28_gcp_c2s30 | 1.00 | 1.00 | 1.00 | 1.00 | 1.00 | 1.00 |
| pg153_o3_native_lto.cx7a28_gcp_c2s30 | 0.99 | 1.00 | 0.90 | 1.01 | 1.09 | 1.22 |
| pg154_o3_native_lto.cx7a28_gcp_c2s30 | 0.98 | 1.01 | 0.79 | 1.03 | 1.05 | 1.31 |
| pg16beta1_o3_native_lto.cx7a28_gcp_c2s30 | 0.97 | 1.06 | 0.82 | 1.00 | 1.07 | 1.13 |
| pg16beta2_o3_native_lto.cx7a28_gcp_c2s30 | 0.98 | 1.09 | 0.76 | 1.01 | 1.04 | 1.23 |
| pg16beta3_o3_native_lto.cx7a28_gcp_c2s30 | 0.99 | 1.07 | 0.79 | 0.99 | 0.99 | 1.16 |
| pg16rc1_o3_native_lto.cx7a28_gcp_c2s30 | 0.99 | 1.08 | 0.97 | 1.00 | 0.96 | 0.94 |
| pg160_o3_native_lto.cx7a28_gcp_c2s30 | 0.98 | 1.08 | 0.77 | 1.00 | 1.07 | 1.12 |
This lists the average rate of inserts/s for the tests that do inserts concurrent with queries. For such tests the query rate is listed in the table above. The read+write tests are setup so that the insert rate should match the target rate every second. Cells that are not at least 95% of the target have a red background to indicate a failure to satisfy the target.
| dbms | q100.1 | q500.1 | q1000.1 |
|---|---|---|---|
| pg152_o3_native_lto.cx7a28_gcp_c2s30 | 798 | 3992 | 5880 |
| pg153_o3_native_lto.cx7a28_gcp_c2s30 | 798 | 3992 | 5735 |
| pg154_o3_native_lto.cx7a28_gcp_c2s30 | 798 | 3992 | 5135 |
| pg16beta1_o3_native_lto.cx7a28_gcp_c2s30 | 798 | 3992 | 7059 |
| pg16beta2_o3_native_lto.cx7a28_gcp_c2s30 | 798 | 3992 | 5074 |
| pg16beta3_o3_native_lto.cx7a28_gcp_c2s30 | 798 | 3992 | 5124 |
| pg16rc1_o3_native_lto.cx7a28_gcp_c2s30 | 798 | 3992 | 5666 |
| pg160_o3_native_lto.cx7a28_gcp_c2s30 | 798 | 3992 | 5734 |
| target | 800 | 4000 | 8000 |
l.i0
l.i0: load without secondary indexes. Graphs for performance per 1-second interval are here.
Average throughput:
Insert response time histogram: each cell has the percentage of responses that take <= the time in the header and max is the max response time in seconds. For the max column values in the top 25% of the range have a red background and in the bottom 25% of the range have a green background. The red background is not used when the min value is within 80% of the max value.
| dbms | 256us | 1ms | 4ms | 16ms | 64ms | 256ms | 1s | 4s | 16s | gt | max |
|---|---|---|---|---|---|---|---|---|---|---|---|
| pg152_o3_native_lto.cx7a28_gcp_c2s30 | 97.114 | 2.845 | 0.028 | 0.007 | 0.004 | 0.001 | 0.538 | ||||
| pg153_o3_native_lto.cx7a28_gcp_c2s30 | 97.313 | 2.649 | 0.027 | 0.007 | 0.004 | 0.001 | 0.525 | ||||
| pg154_o3_native_lto.cx7a28_gcp_c2s30 | 97.409 | 2.548 | 0.028 | 0.009 | 0.005 | 0.001 | 0.696 | ||||
| pg16beta1_o3_native_lto.cx7a28_gcp_c2s30 | 97.286 | 2.670 | 0.030 | 0.009 | 0.004 | 0.001 | 0.466 | ||||
| pg16beta2_o3_native_lto.cx7a28_gcp_c2s30 | 97.373 | 2.592 | 0.026 | 0.006 | 0.003 | nonzero | 0.416 | ||||
| pg16beta3_o3_native_lto.cx7a28_gcp_c2s30 | 97.232 | 2.718 | 0.031 | 0.013 | 0.005 | 0.001 | nonzero | 1.448 | |||
| pg16rc1_o3_native_lto.cx7a28_gcp_c2s30 | 97.412 | 2.547 | 0.028 | 0.008 | 0.004 | nonzero | 0.811 | ||||
| pg160_o3_native_lto.cx7a28_gcp_c2s30 | 97.377 | 2.584 | 0.027 | 0.006 | 0.005 | 0.001 | 0.690 |
Performance metrics for the DBMS listed above. Some are normalized by throughput, others are not. Legend for results is here.
ips	qps	rps	rmbps	wps	wmbps	rpq	rkbpq	wpi	wkbpi	csps	cpups	cspq	cpupq	dbgb1	dbgb2	rss	maxop	p50	p99	tag
1121076	0	546	4.3	1463.9	284.8	0.000	0.004	0.001	0.260	91873	85.0	0.082	11	382.7	414.8	7.9	0.538	144039	77132	4000m.pg152_o3_native_lto.cx7a28_gcp_c2s30
1107726	0	543	4.3	1469.1	285.9	0.000	0.004	0.001	0.264	91485	85.0	0.083	12	382.7	414.8	6.4	0.525	141938	72521	4000m.pg153_o3_native_lto.cx7a28_gcp_c2s30
1094092	0	547	4.3	1440.5	277.8	0.000	0.004	0.001	0.260	92312	84.1	0.084	12	382.7	414.8	5.0	0.696	140647	65629	4000m.pg154_o3_native_lto.cx7a28_gcp_c2s30
1092598	0	544	4.3	1452.6	281.8	0.000	0.004	0.001	0.264	90976	84.4	0.083	12	382.7	414.8	9.9	0.466	140248	74218	4000m.pg16beta1_o3_native_lto.cx7a28_gcp_c2s30
1098298	0	551	4.3	1442.3	279.2	0.001	0.004	0.001	0.260	91909	84.7	0.084	12	382.7	414.8	3.9	0.416	140447	86706	4000m.pg16beta2_o3_native_lto.cx7a28_gcp_c2s30
1105583	0	546	4.3	1457.7	284.1	0.000	0.004	0.001	0.263	91339	84.4	0.083	11	382.7	414.8	7.9	1.448	142345	64730	4000m.pg16beta3_o3_native_lto.cx7a28_gcp_c2s30
1110802	0	546	4.3	1460.8	284.5	0.000	0.004	0.001	0.262	92094	84.9	0.083	11	382.7	414.8	9.6	0.811	142246	79114	4000m.pg16rc1_o3_native_lto.cx7a28_gcp_c2s30
1094092	0	534	4.2	1446.3	277.9	0.000	0.004	0.001	0.260	91996	84.4	0.084	12	382.7	414.8	4.5	0.690	140347	67227	4000m.pg160_o3_native_lto.cx7a28_gcp_c2s30
l.x
l.x: create secondary indexes.
Average throughput:
Performance metrics for the DBMS listed above. Some are normalized by throughput, others are not. Legend for results is here.
ips	qps	rps	rmbps	wps	wmbps	rpq	rkbpq	wpi	wkbpi	csps	cpups	cspq	cpupq	dbgb1	dbgb2	rss	maxop	p50	p99	tag
1529675	0	3573	734.0	1315.6	285.2	0.002	0.491	0.001	0.191	35450	35.1	0.023	3	735.2	767.0	56.8	0.002	NA	NA	4000m.pg152_o3_native_lto.cx7a28_gcp_c2s30
1522108	0	3594	743.5	1294.0	285.6	0.002	0.500	0.001	0.192	35959	34.6	0.024	3	735.2	767.0	56.9	0.002	NA	NA	4000m.pg153_o3_native_lto.cx7a28_gcp_c2s30
1546829	0	3613	745.9	1321.9	291.1	0.002	0.494	0.001	0.193	34858	34.8	0.023	3	735.2	767.0	57.2	0.002	NA	NA	4000m.pg154_o3_native_lto.cx7a28_gcp_c2s30
1626057	0	2910	650.5	1377.7	307.8	0.002	0.410	0.001	0.194	45051	36.2	0.028	3	735.2	767.2	56.8	0.002	NA	NA	4000m.pg16beta1_o3_native_lto.cx7a28_gcp_c2s30
1662552	0	2902	653.1	1413.5	315.6	0.002	0.402	0.001	0.194	44054	36.5	0.026	3	735.2	767.1	56.7	0.002	NA	NA	4000m.pg16beta2_o3_native_lto.cx7a28_gcp_c2s30
1631362	0	2897	648.5	1387.0	312.8	0.002	0.407	0.001	0.196	44184	36.1	0.027	3	735.2	767.2	56.7	0.002	NA	NA	4000m.pg16beta3_o3_native_lto.cx7a28_gcp_c2s30
1654301	0	2879	650.5	1394.8	313.9	0.002	0.403	0.001	0.194	44489	36.3	0.027	3	735.2	767.2	56.8	0.002	NA	NA	4000m.pg16rc1_o3_native_lto.cx7a28_gcp_c2s30
1646132	0	2845	649.4	1400.8	312.2	0.002	0.404	0.001	0.194	43392	36.4	0.026	3	735.2	767.0	57.0	0.027	NA	NA	4000m.pg160_o3_native_lto.cx7a28_gcp_c2s30
l.i1
l.i1: continue load after secondary indexes created. Graphs for performance per 1-second interval are here.
Average throughput:
Insert response time histogram: each cell has the percentage of responses that take <= the time in the header and max is the max response time in seconds. For the max column values in the top 25% of the range have a red background and in the bottom 25% of the range have a green background. The red background is not used when the min value is within 80% of the max value.
| dbms | 256us | 1ms | 4ms | 16ms | 64ms | 256ms | 1s | 4s | 16s | gt | max |
|---|---|---|---|---|---|---|---|---|---|---|---|
| pg152_o3_native_lto.cx7a28_gcp_c2s30 | 30.695 | 47.324 | 21.911 | 0.068 | 0.003 | nonzero | 1.241 | ||||
| pg153_o3_native_lto.cx7a28_gcp_c2s30 | 52.231 | 28.301 | 19.429 | 0.036 | 0.003 | nonzero | 1.463 | ||||
| pg154_o3_native_lto.cx7a28_gcp_c2s30 | 41.984 | 37.245 | 20.725 | 0.044 | 0.001 | nonzero | 1.546 | ||||
| pg16beta1_o3_native_lto.cx7a28_gcp_c2s30 | 44.757 | 34.801 | 20.387 | 0.052 | 0.002 | 0.803 | |||||
| pg16beta2_o3_native_lto.cx7a28_gcp_c2s30 | 47.915 | 33.137 | 18.871 | 0.076 | 0.002 | nonzero | 1.316 | ||||
| pg16beta3_o3_native_lto.cx7a28_gcp_c2s30 | 50.419 | 30.719 | 18.796 | 0.065 | 0.002 | nonzero | 1.155 | ||||
| pg16rc1_o3_native_lto.cx7a28_gcp_c2s30 | 36.041 | 42.691 | 21.187 | 0.078 | 0.002 | nonzero | 1.162 | ||||
| pg160_o3_native_lto.cx7a28_gcp_c2s30 | 58.391 | 26.671 | 14.872 | 0.064 | 0.002 | nonzero | 1.017 |
Delete response time histogram: each cell has the percentage of responses that take <= the time in the header and max is the max response time in seconds. For the max column values in the top 25% of the range have a red background and in the bottom 25% of the range have a green background. The red background is not used when the min value is within 80% of the max value.
| dbms | 256us | 1ms | 4ms | 16ms | 64ms | 256ms | 1s | 4s | 16s | gt | max |
|---|---|---|---|---|---|---|---|---|---|---|---|
| pg152_o3_native_lto.cx7a28_gcp_c2s30 | 71.565 | 2.995 | 0.911 | 2.886 | 9.371 | 12.046 | 0.226 | 0.615 | |||
| pg153_o3_native_lto.cx7a28_gcp_c2s30 | 74.442 | 2.078 | 0.707 | 2.575 | 7.937 | 12.171 | 0.090 | nonzero | 1.022 | ||
| pg154_o3_native_lto.cx7a28_gcp_c2s30 | 74.205 | 2.617 | 0.658 | 2.274 | 9.413 | 10.825 | 0.007 | 0.520 | |||
| pg16beta1_o3_native_lto.cx7a28_gcp_c2s30 | 71.824 | 4.034 | 1.028 | 3.241 | 10.021 | 9.736 | 0.116 | 0.581 | |||
| pg16beta2_o3_native_lto.cx7a28_gcp_c2s30 | 73.262 | 4.446 | 0.567 | 1.836 | 7.565 | 12.226 | 0.098 | 0.777 | |||
| pg16beta3_o3_native_lto.cx7a28_gcp_c2s30 | 75.352 | 3.728 | 0.492 | 1.727 | 7.371 | 11.321 | 0.008 | 0.601 | |||
| pg16rc1_o3_native_lto.cx7a28_gcp_c2s30 | 70.858 | 3.870 | 0.493 | 1.692 | 10.647 | 12.438 | 0.002 | 0.458 | |||
| pg160_o3_native_lto.cx7a28_gcp_c2s30 | 76.342 | 1.408 | 0.666 | 2.112 | 7.509 | 11.770 | 0.192 | 0.893 |
Performance metrics for the DBMS listed above. Some are normalized by throughput, others are not. Legend for results is here.
ips	qps	rps	rmbps	wps	wmbps	rpq	rkbpq	wpi	wkbpi	csps	cpups	cspq	cpupq	dbgb1	dbgb2	rss	maxop	p50	p99	tag
13232	0	10482	124.8	21520.6	358.8	0.792	9.662	1.626	27.768	28006	42.2	2.117	478	780.9	813.0	56.6	1.241	649	400	4000m.pg152_o3_native_lto.cx7a28_gcp_c2s30
11910	0	7217	86.9	16055.6	292.6	0.606	7.472	1.348	25.153	20809	39.0	1.747	491	782.6	814.7	70.6	1.463	549	350	4000m.pg153_o3_native_lto.cx7a28_gcp_c2s30
10464	0	7671	91.8	15703.2	275.4	0.733	8.987	1.501	26.947	20875	33.9	1.995	486	785.2	817.3	67.8	1.546	2448	200	4000m.pg154_o3_native_lto.cx7a28_gcp_c2s30
10866	0	7326	91.4	16156.2	277.8	0.674	8.616	1.487	26.176	20628	33.5	1.898	462	777.9	810.0	70.3	0.803	1149	200	4000m.pg16beta1_o3_native_lto.cx7a28_gcp_c2s30
10077	0	6559	82.4	13919.1	264.9	0.651	8.372	1.381	26.919	18522	34.5	1.838	514	789.6	821.7	58.7	1.316	849	499	4000m.pg16beta2_o3_native_lto.cx7a28_gcp_c2s30
10481	0	6562	79.2	14182.9	268.1	0.626	7.737	1.353	26.193	18673	31.1	1.782	445	784.5	816.6	68.9	1.155	499	350	4000m.pg16beta3_o3_native_lto.cx7a28_gcp_c2s30
12777	0	9706	113.0	19989.6	340.0	0.760	9.058	1.565	27.247	26201	38.8	2.051	456	780.7	812.8	70.9	1.162	749	499	4000m.pg16rc1_o3_native_lto.cx7a28_gcp_c2s30
10157	0	5275	67.4	12426.0	249.6	0.519	6.792	1.223	25.166	16020	29.7	1.577	439	784.8	816.8	70.5	1.017	200	150	4000m.pg160_o3_native_lto.cx7a28_gcp_c2s30
q100.1
q100.1: range queries with 100 insert/s per client. Graphs for performance per 1-second interval are here.
Average throughput:
Query response time histogram: each cell has the percentage of responses that take <= the time in the header and max is the max response time in seconds. For max values in the top 25% of the range have a red background and in the bottom 25% of the range have a green background. The red background is not used when the min value is within 80% of the max value.
| dbms | 256us | 1ms | 4ms | 16ms | 64ms | 256ms | 1s | 4s | 16s | gt | max |
|---|---|---|---|---|---|---|---|---|---|---|---|
| pg152_o3_native_lto.cx7a28_gcp_c2s30 | 99.898 | 0.101 | 0.001 | nonzero | nonzero | nonzero | 0.072 | ||||
| pg153_o3_native_lto.cx7a28_gcp_c2s30 | 99.902 | 0.097 | 0.001 | nonzero | nonzero | nonzero | 0.240 | ||||
| pg154_o3_native_lto.cx7a28_gcp_c2s30 | 99.902 | 0.097 | 0.001 | nonzero | nonzero | nonzero | 0.180 | ||||
| pg16beta1_o3_native_lto.cx7a28_gcp_c2s30 | 99.916 | 0.083 | 0.001 | nonzero | nonzero | nonzero | 0.142 | ||||
| pg16beta2_o3_native_lto.cx7a28_gcp_c2s30 | 99.893 | 0.106 | 0.001 | nonzero | nonzero | nonzero | 0.065 | ||||
| pg16beta3_o3_native_lto.cx7a28_gcp_c2s30 | 99.886 | 0.113 | 0.001 | nonzero | nonzero | nonzero | 0.133 | ||||
| pg16rc1_o3_native_lto.cx7a28_gcp_c2s30 | 99.912 | 0.087 | 0.001 | nonzero | nonzero | nonzero | 0.141 | ||||
| pg160_o3_native_lto.cx7a28_gcp_c2s30 | 99.880 | 0.119 | 0.001 | nonzero | nonzero | nonzero | 0.152 |
Insert response time histogram: each cell has the percentage of responses that take <= the time in the header and max is the max response time in seconds. For max values in the top 25% of the range have a red background and in the bottom 25% of the range have a green background. The red background is not used when the min value is within 80% of the max value.
| dbms | 256us | 1ms | 4ms | 16ms | 64ms | 256ms | 1s | 4s | 16s | gt | max |
|---|---|---|---|---|---|---|---|---|---|---|---|
| pg152_o3_native_lto.cx7a28_gcp_c2s30 | 26.701 | 73.289 | 0.010 | 0.168 | |||||||
| pg153_o3_native_lto.cx7a28_gcp_c2s30 | 0.249 | 26.753 | 72.989 | 0.006 | 0.003 | 0.312 | |||||
| pg154_o3_native_lto.cx7a28_gcp_c2s30 | 2.176 | 21.989 | 75.832 | 0.003 | 0.075 | ||||||
| pg16beta1_o3_native_lto.cx7a28_gcp_c2s30 | 1.218 | 18.288 | 80.488 | 0.005 | 0.001 | 0.397 | |||||
| pg16beta2_o3_native_lto.cx7a28_gcp_c2s30 | 4.428 | 12.394 | 83.175 | 0.003 | 0.072 | ||||||
| pg16beta3_o3_native_lto.cx7a28_gcp_c2s30 | 2.439 | 16.645 | 80.909 | 0.007 | 0.111 | ||||||
| pg16rc1_o3_native_lto.cx7a28_gcp_c2s30 | 2.854 | 20.484 | 76.658 | 0.003 | 0.153 | ||||||
| pg160_o3_native_lto.cx7a28_gcp_c2s30 | 0.398 | 18.644 | 80.946 | 0.011 | 0.086 |
Delete response time histogram: each cell has the percentage of responses that take <= the time in the header and max is the max response time in seconds. For max values in the top 25% of the range have a red background and in the bottom 25% of the range have a green background. The red background is not used when the min value is within 80% of the max value.
| dbms | 256us | 1ms | 4ms | 16ms | 64ms | 256ms | 1s | 4s | 16s | gt | max |
|---|---|---|---|---|---|---|---|---|---|---|---|
| pg152_o3_native_lto.cx7a28_gcp_c2s30 | 29.447 | 23.995 | 11.462 | 22.533 | 12.563 | 0.057 | |||||
| pg153_o3_native_lto.cx7a28_gcp_c2s30 | 40.579 | 27.175 | 17.924 | 14.317 | 0.004 | 0.020 | |||||
| pg154_o3_native_lto.cx7a28_gcp_c2s30 | 39.342 | 27.777 | 17.061 | 15.815 | 0.005 | 0.025 | |||||
| pg16beta1_o3_native_lto.cx7a28_gcp_c2s30 | 31.410 | 25.569 | 22.406 | 20.607 | 0.008 | 0.024 | |||||
| pg16beta2_o3_native_lto.cx7a28_gcp_c2s30 | 36.299 | 30.667 | 16.444 | 16.586 | 0.005 | 0.021 | |||||
| pg16beta3_o3_native_lto.cx7a28_gcp_c2s30 | 31.831 | 22.773 | 16.046 | 16.846 | 12.503 | 0.001 | 0.083 | ||||
| pg16rc1_o3_native_lto.cx7a28_gcp_c2s30 | 46.854 | 29.552 | 5.736 | 5.358 | 12.499 | 0.001 | 0.086 | ||||
| pg160_o3_native_lto.cx7a28_gcp_c2s30 | 30.747 | 25.500 | 11.155 | 20.067 | 12.531 | 0.001 | 0.076 |
Performance metrics for the DBMS listed above. Some are normalized by throughput, others are not. Legend for results is here.
ips	qps	rps	rmbps	wps	wmbps	rpq	rkbpq	wpi	wkbpi	csps	cpups	cspq	cpupq	dbgb1	dbgb2	rss	maxop	p50	p99	tag
798	103698	1379	11.6	1864.2	26.1	0.013	0.114	2.335	33.456	397881	53.7	3.837	78	781.1	813.2	70.9	0.072	12935	12375	4000m.pg152_o3_native_lto.cx7a28_gcp_c2s30
798	104849	1365	11.4	1870.0	25.6	0.013	0.111	2.342	32.838	402327	53.2	3.837	76	782.8	814.9	70.9	0.240	13121	7608	4000m.pg153_o3_native_lto.cx7a28_gcp_c2s30
798	106504	1413	11.8	1829.6	25.3	0.013	0.114	2.292	32.439	408625	53.2	3.837	75	785.3	817.3	70.9	0.180	13367	12999	4000m.pg154_o3_native_lto.cx7a28_gcp_c2s30
798	103881	1363	11.4	1874.0	25.1	0.013	0.112	2.347	32.234	398677	53.3	3.838	77	778.2	810.3	70.9	0.142	12866	12178	4000m.pg16beta1_o3_native_lto.cx7a28_gcp_c2s30
798	104484	1425	11.9	1858.4	25.8	0.014	0.117	2.328	33.128	401017	53.2	3.838	76	789.7	821.7	70.9	0.065	13079	8970	4000m.pg16beta2_o3_native_lto.cx7a28_gcp_c2s30
798	102381	1422	11.9	1868.3	25.8	0.014	0.119	2.341	33.149	392966	53.6	3.838	79	784.6	816.6	70.9	0.133	12850	8007	4000m.pg16beta3_o3_native_lto.cx7a28_gcp_c2s30
798	103690	1377	11.6	1877.9	25.5	0.013	0.115	2.353	32.698	397823	53.9	3.837	78	780.9	813.0	70.9	0.141	12946	10425	4000m.pg16rc1_o3_native_lto.cx7a28_gcp_c2s30
798	103388	1444	12.1	1846.0	25.8	0.014	0.120	2.312	33.146	396733	53.6	3.837	78	784.9	816.9	70.9	0.152	12882	12626	4000m.pg160_o3_native_lto.cx7a28_gcp_c2s30
q500.1
q500.1: range queries with 500 insert/s per client. Graphs for performance per 1-second interval are here.
Average throughput:
Query response time histogram: each cell has the percentage of responses that take <= the time in the header and max is the max response time in seconds. For max values in the top 25% of the range have a red background and in the bottom 25% of the range have a green background. The red background is not used when the min value is within 80% of the max value.
| dbms | 256us | 1ms | 4ms | 16ms | 64ms | 256ms | 1s | 4s | 16s | gt | max |
|---|---|---|---|---|---|---|---|---|---|---|---|
| pg152_o3_native_lto.cx7a28_gcp_c2s30 | 99.868 | 0.129 | 0.003 | 0.001 | nonzero | 0.027 | |||||
| pg153_o3_native_lto.cx7a28_gcp_c2s30 | 99.866 | 0.129 | 0.003 | 0.001 | nonzero | 0.028 | |||||
| pg154_o3_native_lto.cx7a28_gcp_c2s30 | 99.859 | 0.138 | 0.002 | 0.001 | nonzero | 0.028 | |||||
| pg16beta1_o3_native_lto.cx7a28_gcp_c2s30 | 99.849 | 0.146 | 0.004 | 0.001 | nonzero | 0.027 | |||||
| pg16beta2_o3_native_lto.cx7a28_gcp_c2s30 | 99.839 | 0.158 | 0.003 | 0.001 | nonzero | 0.028 | |||||
| pg16beta3_o3_native_lto.cx7a28_gcp_c2s30 | 99.823 | 0.173 | 0.003 | 0.001 | nonzero | 0.027 | |||||
| pg16rc1_o3_native_lto.cx7a28_gcp_c2s30 | 99.850 | 0.147 | 0.002 | 0.001 | nonzero | 0.027 | |||||
| pg160_o3_native_lto.cx7a28_gcp_c2s30 | 99.858 | 0.136 | 0.004 | 0.001 | nonzero | 0.032 |
Insert response time histogram: each cell has the percentage of responses that take <= the time in the header and max is the max response time in seconds. For max values in the top 25% of the range have a red background and in the bottom 25% of the range have a green background. The red background is not used when the min value is within 80% of the max value.
| dbms | 256us | 1ms | 4ms | 16ms | 64ms | 256ms | 1s | 4s | 16s | gt | max |
|---|---|---|---|---|---|---|---|---|---|---|---|
| pg152_o3_native_lto.cx7a28_gcp_c2s30 | 18.771 | 81.228 | nonzero | 0.102 | |||||||
| pg153_o3_native_lto.cx7a28_gcp_c2s30 | 19.583 | 80.416 | 0.001 | 0.135 | |||||||
| pg154_o3_native_lto.cx7a28_gcp_c2s30 | 24.995 | 75.005 | 0.056 | ||||||||
| pg16beta1_o3_native_lto.cx7a28_gcp_c2s30 | 15.242 | 84.758 | nonzero | 0.070 | |||||||
| pg16beta2_o3_native_lto.cx7a28_gcp_c2s30 | 9.494 | 90.505 | 0.001 | 0.075 | |||||||
| pg16beta3_o3_native_lto.cx7a28_gcp_c2s30 | 16.663 | 83.335 | 0.002 | 0.081 | |||||||
| pg16rc1_o3_native_lto.cx7a28_gcp_c2s30 | 14.553 | 85.445 | 0.001 | 0.070 | |||||||
| pg160_o3_native_lto.cx7a28_gcp_c2s30 | 22.405 | 77.594 | 0.002 | 0.089 |
Delete response time histogram: each cell has the percentage of responses that take <= the time in the header and max is the max response time in seconds. For max values in the top 25% of the range have a red background and in the bottom 25% of the range have a green background. The red background is not used when the min value is within 80% of the max value.
| dbms | 256us | 1ms | 4ms | 16ms | 64ms | 256ms | 1s | 4s | 16s | gt | max |
|---|---|---|---|---|---|---|---|---|---|---|---|
| pg152_o3_native_lto.cx7a28_gcp_c2s30 | 57.606 | 7.994 | 0.096 | 5.653 | 27.767 | 0.884 | 0.091 | ||||
| pg153_o3_native_lto.cx7a28_gcp_c2s30 | 34.679 | 6.998 | 0.185 | 8.902 | 49.191 | 0.045 | 0.085 | ||||
| pg154_o3_native_lto.cx7a28_gcp_c2s30 | 53.067 | 7.935 | 0.154 | 7.480 | 31.365 | 0.051 | |||||
| pg16beta1_o3_native_lto.cx7a28_gcp_c2s30 | 37.141 | 8.836 | 0.182 | 9.970 | 43.863 | 0.008 | 0.077 | ||||
| pg16beta2_o3_native_lto.cx7a28_gcp_c2s30 | 55.916 | 10.452 | 0.161 | 7.285 | 26.186 | 0.055 | |||||
| pg16beta3_o3_native_lto.cx7a28_gcp_c2s30 | 41.764 | 8.375 | 0.154 | 7.140 | 38.368 | 4.199 | 0.112 | ||||
| pg16rc1_o3_native_lto.cx7a28_gcp_c2s30 | 67.136 | 8.033 | 0.138 | 2.802 | 14.635 | 7.256 | 0.113 | ||||
| pg160_o3_native_lto.cx7a28_gcp_c2s30 | 20.662 | 6.882 | 0.122 | 9.142 | 60.292 | 2.901 | 0.117 |
Performance metrics for the DBMS listed above. Some are normalized by throughput, others are not. Legend for results is here.
ips	qps	rps	rmbps	wps	wmbps	rpq	rkbpq	wpi	wkbpi	csps	cpups	cspq	cpupq	dbgb1	dbgb2	rss	maxop	p50	p99	tag
3992	86321	5880	47.6	10356.4	132.2	0.068	0.565	2.595	33.904	331144	61.0	3.836	106	782.4	814.5	70.9	0.027	10357	9717	4000m.pg152_o3_native_lto.cx7a28_gcp_c2s30
3992	94240	5897	47.7	10233.2	131.0	0.063	0.518	2.564	33.597	329653	64.1	3.498	102	783.9	816.0	0.5	0.028	11699	10165	4000m.pg153_o3_native_lto.cx7a28_gcp_c2s30
3992	90672	5907	47.9	10246.8	131.8	0.065	0.541	2.567	33.801	343621	61.0	3.790	101	785.5	817.6	70.9	0.028	11571	9813	4000m.pg154_o3_native_lto.cx7a28_gcp_c2s30
3992	92306	5873	47.5	10381.5	131.5	0.064	0.527	2.600	33.728	331215	62.7	3.588	102	780.1	812.1	70.9	0.027	11475	10069	4000m.pg16beta1_o3_native_lto.cx7a28_gcp_c2s30
3992	89502	5918	48.0	10267.1	132.9	0.066	0.550	2.572	34.089	341505	60.1	3.816	101	789.9	822.0	70.9	0.028	11299	9669	4000m.pg16beta2_o3_native_lto.cx7a28_gcp_c2s30
3992	85287	5893	47.8	10311.1	132.5	0.069	0.573	2.583	33.999	311037	64.1	3.647	113	785.0	817.1	70.9	0.027	10441	9482	4000m.pg16beta3_o3_native_lto.cx7a28_gcp_c2s30
3992	83122	5883	47.7	10431.1	131.1	0.071	0.588	2.613	33.617	323629	61.6	3.893	111	782.1	814.1	70.9	0.027	10133	9577	4000m.pg16rc1_o3_native_lto.cx7a28_gcp_c2s30
3992	92147	5902	47.8	10298.9	133.0	0.064	0.532	2.580	34.124	307816	67.3	3.340	110	785.4	817.4	70.9	0.032	11369	10293	4000m.pg160_o3_native_lto.cx7a28_gcp_c2s30
q1000.1
q1000.1: range queries with 1000 insert/s per client. Graphs for performance per 1-second interval are here.
Average throughput:
Query response time histogram: each cell has the percentage of responses that take <= the time in the header and max is the max response time in seconds. For max values in the top 25% of the range have a red background and in the bottom 25% of the range have a green background. The red background is not used when the min value is within 80% of the max value.
| dbms | 256us | 1ms | 4ms | 16ms | 64ms | 256ms | 1s | 4s | 16s | gt | max |
|---|---|---|---|---|---|---|---|---|---|---|---|
| pg152_o3_native_lto.cx7a28_gcp_c2s30 | 99.711 | 0.285 | 0.003 | 0.001 | nonzero | 0.028 | |||||
| pg153_o3_native_lto.cx7a28_gcp_c2s30 | 99.683 | 0.311 | 0.005 | 0.001 | nonzero | 0.036 | |||||
| pg154_o3_native_lto.cx7a28_gcp_c2s30 | 99.775 | 0.218 | 0.006 | 0.001 | nonzero | 0.032 | |||||
| pg16beta1_o3_native_lto.cx7a28_gcp_c2s30 | 99.675 | 0.319 | 0.004 | 0.001 | nonzero | 0.028 | |||||
| pg16beta2_o3_native_lto.cx7a28_gcp_c2s30 | 99.728 | 0.266 | 0.005 | 0.001 | nonzero | 0.028 | |||||
| pg16beta3_o3_native_lto.cx7a28_gcp_c2s30 | 99.675 | 0.320 | 0.004 | 0.001 | nonzero | 0.046 | |||||
| pg16rc1_o3_native_lto.cx7a28_gcp_c2s30 | 99.703 | 0.293 | 0.003 | 0.001 | nonzero | 0.058 | |||||
| pg160_o3_native_lto.cx7a28_gcp_c2s30 | 99.691 | 0.302 | 0.006 | 0.001 | nonzero | 0.036 |
Insert response time histogram: each cell has the percentage of responses that take <= the time in the header and max is the max response time in seconds. For max values in the top 25% of the range have a red background and in the bottom 25% of the range have a green background. The red background is not used when the min value is within 80% of the max value.
| dbms | 256us | 1ms | 4ms | 16ms | 64ms | 256ms | 1s | 4s | 16s | gt | max |
|---|---|---|---|---|---|---|---|---|---|---|---|
| pg152_o3_native_lto.cx7a28_gcp_c2s30 | nonzero | 11.878 | 88.120 | 0.001 | 0.122 | ||||||
| pg153_o3_native_lto.cx7a28_gcp_c2s30 | 22.964 | 77.036 | 0.001 | 0.123 | |||||||
| pg154_o3_native_lto.cx7a28_gcp_c2s30 | 39.580 | 60.419 | 0.001 | 0.081 | |||||||
| pg16beta1_o3_native_lto.cx7a28_gcp_c2s30 | 9.823 | 90.177 | nonzero | 0.070 | |||||||
| pg16beta2_o3_native_lto.cx7a28_gcp_c2s30 | 29.870 | 70.127 | 0.003 | 0.136 | |||||||
| pg16beta3_o3_native_lto.cx7a28_gcp_c2s30 | 25.254 | 74.743 | 0.002 | 0.091 | |||||||
| pg16rc1_o3_native_lto.cx7a28_gcp_c2s30 | 0.330 | 13.497 | 86.173 | 0.001 | 0.115 | ||||||
| pg160_o3_native_lto.cx7a28_gcp_c2s30 | 21.629 | 78.365 | 0.006 | 0.094 |
Delete response time histogram: each cell has the percentage of responses that take <= the time in the header and max is the max response time in seconds. For max values in the top 25% of the range have a red background and in the bottom 25% of the range have a green background. The red background is not used when the min value is within 80% of the max value.
| dbms | 256us | 1ms | 4ms | 16ms | 64ms | 256ms | 1s | 4s | 16s | gt | max |
|---|---|---|---|---|---|---|---|---|---|---|---|
| pg152_o3_native_lto.cx7a28_gcp_c2s30 | 66.965 | 22.554 | 0.147 | 0.023 | 1.164 | 9.147 | 0.177 | ||||
| pg153_o3_native_lto.cx7a28_gcp_c2s30 | 50.432 | 19.907 | 0.128 | 0.033 | 6.685 | 22.814 | 0.162 | ||||
| pg154_o3_native_lto.cx7a28_gcp_c2s30 | 44.573 | 15.619 | 0.141 | 0.026 | 12.457 | 27.184 | 0.206 | ||||
| pg16beta1_o3_native_lto.cx7a28_gcp_c2s30 | 64.914 | 24.177 | 0.143 | 0.020 | 6.351 | 4.395 | 0.147 | ||||
| pg16beta2_o3_native_lto.cx7a28_gcp_c2s30 | 44.817 | 23.810 | 0.135 | 0.028 | 4.617 | 26.593 | nonzero | 0.324 | |||
| pg16beta3_o3_native_lto.cx7a28_gcp_c2s30 | 52.125 | 19.486 | 0.129 | 0.028 | 1.839 | 26.393 | 0.202 | ||||
| pg16rc1_o3_native_lto.cx7a28_gcp_c2s30 | 72.021 | 18.287 | 0.144 | 0.024 | 2.179 | 7.345 | 0.153 | ||||
| pg160_o3_native_lto.cx7a28_gcp_c2s30 | 55.086 | 20.747 | 0.127 | 0.024 | 7.659 | 16.357 | 0.208 |
Performance metrics for the DBMS listed above. Some are normalized by throughput, others are not. Legend for results is here.
ips	qps	rps	rmbps	wps	wmbps	rpq	rkbpq	wpi	wkbpi	csps	cpups	cspq	cpupq	dbgb1	dbgb2	rss	maxop	p50	p99	tag
5880	60529	8738	71.2	15053.2	192.0	0.144	1.204	2.560	33.439	243176	51.9	4.017	129	785.4	817.4	70.9	0.028	9142	8758	4000m.pg152_o3_native_lto.cx7a28_gcp_c2s30
5735	73961	8424	68.8	14413.1	183.7	0.114	0.953	2.513	32.796	249896	63.2	3.379	128	786.4	818.5	70.9	0.036	10149	8614	4000m.pg153_o3_native_lto.cx7a28_gcp_c2s30
5135	79373	7504	61.5	12935.9	164.9	0.095	0.794	2.519	32.877	231731	62.9	2.920	119	787.0	819.1	70.9	0.032	12370	9478	4000m.pg154_o3_native_lto.cx7a28_gcp_c2s30
7059	68307	10495	85.1	18096.3	228.8	0.154	1.275	2.564	33.194	269206	59.3	3.941	130	784.4	816.5	70.9	0.028	8854	8407	4000m.pg16beta1_o3_native_lto.cx7a28_gcp_c2s30
5074	74568	7425	60.9	12744.2	163.7	0.100	0.837	2.512	33.043	246082	61.8	3.300	124	791.0	823.0	70.9	0.028	10393	8535	4000m.pg16beta2_o3_native_lto.cx7a28_gcp_c2s30
5124	70070	7440	61.0	12882.4	165.6	0.106	0.892	2.514	33.091	241610	60.0	3.448	128	786.7	818.7	70.9	0.046	9929	8503	4000m.pg16beta3_o3_native_lto.cx7a28_gcp_c2s30
5666	57132	8381	68.4	14482.4	181.7	0.147	1.226	2.556	32.840	230832	49.2	4.040	129	785.4	817.5	70.9	0.058	9046	8790	4000m.pg16rc1_o3_native_lto.cx7a28_gcp_c2s30
5734	67567	8488	69.3	14592.5	187.0	0.126	1.050	2.545	33.403	243003	60.0	3.596	133	787.6	819.6	70.9	0.036	8822	8474	4000m.pg160_o3_native_lto.cx7a28_gcp_c2s30
l.i0
l.i0: load without secondary indexes
Performance metrics for all DBMS, not just the ones listed above. Some are normalized by throughput, others are not. Legend for results is here.
ips	qps	rps	rmbps	wps	wmbps	rpq	rkbpq	wpi	wkbpi	csps	cpups	cspq	cpupq	dbgb1	dbgb2	rss	maxop	p50	p99	tag
1121076	0	546	4.3	1463.9	284.8	0.000	0.004	0.001	0.260	91873	85.0	0.082	11	382.7	414.8	7.9	0.538	144039	77132	4000m.pg152_o3_native_lto.cx7a28_gcp_c2s30
1107726	0	543	4.3	1469.1	285.9	0.000	0.004	0.001	0.264	91485	85.0	0.083	12	382.7	414.8	6.4	0.525	141938	72521	4000m.pg153_o3_native_lto.cx7a28_gcp_c2s30
1094092	0	547	4.3	1440.5	277.8	0.000	0.004	0.001	0.260	92312	84.1	0.084	12	382.7	414.8	5.0	0.696	140647	65629	4000m.pg154_o3_native_lto.cx7a28_gcp_c2s30
1092598	0	544	4.3	1452.6	281.8	0.000	0.004	0.001	0.264	90976	84.4	0.083	12	382.7	414.8	9.9	0.466	140248	74218	4000m.pg16beta1_o3_native_lto.cx7a28_gcp_c2s30
1098298	0	551	4.3	1442.3	279.2	0.001	0.004	0.001	0.260	91909	84.7	0.084	12	382.7	414.8	3.9	0.416	140447	86706	4000m.pg16beta2_o3_native_lto.cx7a28_gcp_c2s30
1105583	0	546	4.3	1457.7	284.1	0.000	0.004	0.001	0.263	91339	84.4	0.083	11	382.7	414.8	7.9	1.448	142345	64730	4000m.pg16beta3_o3_native_lto.cx7a28_gcp_c2s30
1110802	0	546	4.3	1460.8	284.5	0.000	0.004	0.001	0.262	92094	84.9	0.083	11	382.7	414.8	9.6	0.811	142246	79114	4000m.pg16rc1_o3_native_lto.cx7a28_gcp_c2s30
1094092	0	534	4.2	1446.3	277.9	0.000	0.004	0.001	0.260	91996	84.4	0.084	12	382.7	414.8	4.5	0.690	140347	67227	4000m.pg160_o3_native_lto.cx7a28_gcp_c2s30
l.x
l.x: create secondary indexes
Performance metrics for all DBMS, not just the ones listed above. Some are normalized by throughput, others are not. Legend for results is here.
ips	qps	rps	rmbps	wps	wmbps	rpq	rkbpq	wpi	wkbpi	csps	cpups	cspq	cpupq	dbgb1	dbgb2	rss	maxop	p50	p99	tag
1529675	0	3573	734.0	1315.6	285.2	0.002	0.491	0.001	0.191	35450	35.1	0.023	3	735.2	767.0	56.8	0.002	NA	NA	4000m.pg152_o3_native_lto.cx7a28_gcp_c2s30
1522108	0	3594	743.5	1294.0	285.6	0.002	0.500	0.001	0.192	35959	34.6	0.024	3	735.2	767.0	56.9	0.002	NA	NA	4000m.pg153_o3_native_lto.cx7a28_gcp_c2s30
1546829	0	3613	745.9	1321.9	291.1	0.002	0.494	0.001	0.193	34858	34.8	0.023	3	735.2	767.0	57.2	0.002	NA	NA	4000m.pg154_o3_native_lto.cx7a28_gcp_c2s30
1626057	0	2910	650.5	1377.7	307.8	0.002	0.410	0.001	0.194	45051	36.2	0.028	3	735.2	767.2	56.8	0.002	NA	NA	4000m.pg16beta1_o3_native_lto.cx7a28_gcp_c2s30
1662552	0	2902	653.1	1413.5	315.6	0.002	0.402	0.001	0.194	44054	36.5	0.026	3	735.2	767.1	56.7	0.002	NA	NA	4000m.pg16beta2_o3_native_lto.cx7a28_gcp_c2s30
1631362	0	2897	648.5	1387.0	312.8	0.002	0.407	0.001	0.196	44184	36.1	0.027	3	735.2	767.2	56.7	0.002	NA	NA	4000m.pg16beta3_o3_native_lto.cx7a28_gcp_c2s30
1654301	0	2879	650.5	1394.8	313.9	0.002	0.403	0.001	0.194	44489	36.3	0.027	3	735.2	767.2	56.8	0.002	NA	NA	4000m.pg16rc1_o3_native_lto.cx7a28_gcp_c2s30
1646132	0	2845	649.4	1400.8	312.2	0.002	0.404	0.001	0.194	43392	36.4	0.026	3	735.2	767.0	57.0	0.027	NA	NA	4000m.pg160_o3_native_lto.cx7a28_gcp_c2s30
l.i1
l.i1: continue load after secondary indexes created
Performance metrics for all DBMS, not just the ones listed above. Some are normalized by throughput, others are not. Legend for results is here.
ips	qps	rps	rmbps	wps	wmbps	rpq	rkbpq	wpi	wkbpi	csps	cpups	cspq	cpupq	dbgb1	dbgb2	rss	maxop	p50	p99	tag
13232	0	10482	124.8	21520.6	358.8	0.792	9.662	1.626	27.768	28006	42.2	2.117	478	780.9	813.0	56.6	1.241	649	400	4000m.pg152_o3_native_lto.cx7a28_gcp_c2s30
11910	0	7217	86.9	16055.6	292.6	0.606	7.472	1.348	25.153	20809	39.0	1.747	491	782.6	814.7	70.6	1.463	549	350	4000m.pg153_o3_native_lto.cx7a28_gcp_c2s30
10464	0	7671	91.8	15703.2	275.4	0.733	8.987	1.501	26.947	20875	33.9	1.995	486	785.2	817.3	67.8	1.546	2448	200	4000m.pg154_o3_native_lto.cx7a28_gcp_c2s30
10866	0	7326	91.4	16156.2	277.8	0.674	8.616	1.487	26.176	20628	33.5	1.898	462	777.9	810.0	70.3	0.803	1149	200	4000m.pg16beta1_o3_native_lto.cx7a28_gcp_c2s30
10077	0	6559	82.4	13919.1	264.9	0.651	8.372	1.381	26.919	18522	34.5	1.838	514	789.6	821.7	58.7	1.316	849	499	4000m.pg16beta2_o3_native_lto.cx7a28_gcp_c2s30
10481	0	6562	79.2	14182.9	268.1	0.626	7.737	1.353	26.193	18673	31.1	1.782	445	784.5	816.6	68.9	1.155	499	350	4000m.pg16beta3_o3_native_lto.cx7a28_gcp_c2s30
12777	0	9706	113.0	19989.6	340.0	0.760	9.058	1.565	27.247	26201	38.8	2.051	456	780.7	812.8	70.9	1.162	749	499	4000m.pg16rc1_o3_native_lto.cx7a28_gcp_c2s30
10157	0	5275	67.4	12426.0	249.6	0.519	6.792	1.223	25.166	16020	29.7	1.577	439	784.8	816.8	70.5	1.017	200	150	4000m.pg160_o3_native_lto.cx7a28_gcp_c2s30
q100.1
q100.1: range queries with 100 insert/s per client
Performance metrics for all DBMS, not just the ones listed above. Some are normalized by throughput, others are not. Legend for results is here.
ips	qps	rps	rmbps	wps	wmbps	rpq	rkbpq	wpi	wkbpi	csps	cpups	cspq	cpupq	dbgb1	dbgb2	rss	maxop	p50	p99	tag
798	103698	1379	11.6	1864.2	26.1	0.013	0.114	2.335	33.456	397881	53.7	3.837	78	781.1	813.2	70.9	0.072	12935	12375	4000m.pg152_o3_native_lto.cx7a28_gcp_c2s30
798	104849	1365	11.4	1870.0	25.6	0.013	0.111	2.342	32.838	402327	53.2	3.837	76	782.8	814.9	70.9	0.240	13121	7608	4000m.pg153_o3_native_lto.cx7a28_gcp_c2s30
798	106504	1413	11.8	1829.6	25.3	0.013	0.114	2.292	32.439	408625	53.2	3.837	75	785.3	817.3	70.9	0.180	13367	12999	4000m.pg154_o3_native_lto.cx7a28_gcp_c2s30
798	103881	1363	11.4	1874.0	25.1	0.013	0.112	2.347	32.234	398677	53.3	3.838	77	778.2	810.3	70.9	0.142	12866	12178	4000m.pg16beta1_o3_native_lto.cx7a28_gcp_c2s30
798	104484	1425	11.9	1858.4	25.8	0.014	0.117	2.328	33.128	401017	53.2	3.838	76	789.7	821.7	70.9	0.065	13079	8970	4000m.pg16beta2_o3_native_lto.cx7a28_gcp_c2s30
798	102381	1422	11.9	1868.3	25.8	0.014	0.119	2.341	33.149	392966	53.6	3.838	79	784.6	816.6	70.9	0.133	12850	8007	4000m.pg16beta3_o3_native_lto.cx7a28_gcp_c2s30
798	103690	1377	11.6	1877.9	25.5	0.013	0.115	2.353	32.698	397823	53.9	3.837	78	780.9	813.0	70.9	0.141	12946	10425	4000m.pg16rc1_o3_native_lto.cx7a28_gcp_c2s30
798	103388	1444	12.1	1846.0	25.8	0.014	0.120	2.312	33.146	396733	53.6	3.837	78	784.9	816.9	70.9	0.152	12882	12626	4000m.pg160_o3_native_lto.cx7a28_gcp_c2s30
q500.1
q500.1: range queries with 500 insert/s per client
Performance metrics for all DBMS, not just the ones listed above. Some are normalized by throughput, others are not. Legend for results is here.
ips	qps	rps	rmbps	wps	wmbps	rpq	rkbpq	wpi	wkbpi	csps	cpups	cspq	cpupq	dbgb1	dbgb2	rss	maxop	p50	p99	tag
3992	86321	5880	47.6	10356.4	132.2	0.068	0.565	2.595	33.904	331144	61.0	3.836	106	782.4	814.5	70.9	0.027	10357	9717	4000m.pg152_o3_native_lto.cx7a28_gcp_c2s30
3992	94240	5897	47.7	10233.2	131.0	0.063	0.518	2.564	33.597	329653	64.1	3.498	102	783.9	816.0	0.5	0.028	11699	10165	4000m.pg153_o3_native_lto.cx7a28_gcp_c2s30
3992	90672	5907	47.9	10246.8	131.8	0.065	0.541	2.567	33.801	343621	61.0	3.790	101	785.5	817.6	70.9	0.028	11571	9813	4000m.pg154_o3_native_lto.cx7a28_gcp_c2s30
3992	92306	5873	47.5	10381.5	131.5	0.064	0.527	2.600	33.728	331215	62.7	3.588	102	780.1	812.1	70.9	0.027	11475	10069	4000m.pg16beta1_o3_native_lto.cx7a28_gcp_c2s30
3992	89502	5918	48.0	10267.1	132.9	0.066	0.550	2.572	34.089	341505	60.1	3.816	101	789.9	822.0	70.9	0.028	11299	9669	4000m.pg16beta2_o3_native_lto.cx7a28_gcp_c2s30
3992	85287	5893	47.8	10311.1	132.5	0.069	0.573	2.583	33.999	311037	64.1	3.647	113	785.0	817.1	70.9	0.027	10441	9482	4000m.pg16beta3_o3_native_lto.cx7a28_gcp_c2s30
3992	83122	5883	47.7	10431.1	131.1	0.071	0.588	2.613	33.617	323629	61.6	3.893	111	782.1	814.1	70.9	0.027	10133	9577	4000m.pg16rc1_o3_native_lto.cx7a28_gcp_c2s30
3992	92147	5902	47.8	10298.9	133.0	0.064	0.532	2.580	34.124	307816	67.3	3.340	110	785.4	817.4	70.9	0.032	11369	10293	4000m.pg160_o3_native_lto.cx7a28_gcp_c2s30
q1000.1
q1000.1: range queries with 1000 insert/s per client
Performance metrics for all DBMS, not just the ones listed above. Some are normalized by throughput, others are not. Legend for results is here.
ips	qps	rps	rmbps	wps	wmbps	rpq	rkbpq	wpi	wkbpi	csps	cpups	cspq	cpupq	dbgb1	dbgb2	rss	maxop	p50	p99	tag
5880	60529	8738	71.2	15053.2	192.0	0.144	1.204	2.560	33.439	243176	51.9	4.017	129	785.4	817.4	70.9	0.028	9142	8758	4000m.pg152_o3_native_lto.cx7a28_gcp_c2s30
5735	73961	8424	68.8	14413.1	183.7	0.114	0.953	2.513	32.796	249896	63.2	3.379	128	786.4	818.5	70.9	0.036	10149	8614	4000m.pg153_o3_native_lto.cx7a28_gcp_c2s30
5135	79373	7504	61.5	12935.9	164.9	0.095	0.794	2.519	32.877	231731	62.9	2.920	119	787.0	819.1	70.9	0.032	12370	9478	4000m.pg154_o3_native_lto.cx7a28_gcp_c2s30
7059	68307	10495	85.1	18096.3	228.8	0.154	1.275	2.564	33.194	269206	59.3	3.941	130	784.4	816.5	70.9	0.028	8854	8407	4000m.pg16beta1_o3_native_lto.cx7a28_gcp_c2s30
5074	74568	7425	60.9	12744.2	163.7	0.100	0.837	2.512	33.043	246082	61.8	3.300	124	791.0	823.0	70.9	0.028	10393	8535	4000m.pg16beta2_o3_native_lto.cx7a28_gcp_c2s30
5124	70070	7440	61.0	12882.4	165.6	0.106	0.892	2.514	33.091	241610	60.0	3.448	128	786.7	818.7	70.9	0.046	9929	8503	4000m.pg16beta3_o3_native_lto.cx7a28_gcp_c2s30
5666	57132	8381	68.4	14482.4	181.7	0.147	1.226	2.556	32.840	230832	49.2	4.040	129	785.4	817.5	70.9	0.058	9046	8790	4000m.pg16rc1_o3_native_lto.cx7a28_gcp_c2s30
5734	67567	8488	69.3	14592.5	187.0	0.126	1.050	2.545	33.403	243003	60.0	3.596	133	787.6	819.6	70.9	0.036	8822	8474	4000m.pg160_o3_native_lto.cx7a28_gcp_c2s30
l.i0
- l.i0: load without secondary indexes
- Legend for results is here.
- Each entry lists the percentage of responses that fit in that bucket (slower than max time for previous bucket, faster than min time for next bucket).
Insert response time histogram
256us	1ms	4ms	16ms	64ms	256ms	1s	4s	16s	gt	max	tag
0.000	97.114	2.845	0.028	0.007	0.004	0.001	0.000	0.000	0.000	0.538	pg152_o3_native_lto.cx7a28_gcp_c2s30
0.000	97.313	2.649	0.027	0.007	0.004	0.001	0.000	0.000	0.000	0.525	pg153_o3_native_lto.cx7a28_gcp_c2s30
0.000	97.409	2.548	0.028	0.009	0.005	0.001	0.000	0.000	0.000	0.696	pg154_o3_native_lto.cx7a28_gcp_c2s30
0.000	97.286	2.670	0.030	0.009	0.004	0.001	0.000	0.000	0.000	0.466	pg16beta1_o3_native_lto.cx7a28_gcp_c2s30
0.000	97.373	2.592	0.026	0.006	0.003	nonzero	0.000	0.000	0.000	0.416	pg16beta2_o3_native_lto.cx7a28_gcp_c2s30
0.000	97.232	2.718	0.031	0.013	0.005	0.001	nonzero	0.000	0.000	1.448	pg16beta3_o3_native_lto.cx7a28_gcp_c2s30
0.000	97.412	2.547	0.028	0.008	0.004	nonzero	0.000	0.000	0.000	0.811	pg16rc1_o3_native_lto.cx7a28_gcp_c2s30
0.000	97.377	2.584	0.027	0.006	0.005	0.001	0.000	0.000	0.000	0.690	pg160_o3_native_lto.cx7a28_gcp_c2s30
l.x
- l.x: create secondary indexes
- Legend for results is here.
- Each entry lists the percentage of responses that fit in that bucket (slower than max time for previous bucket, faster than min time for next bucket).
TODO - determine whether there is data for create index response time
l.i1
- l.i1: continue load after secondary indexes created
- Legend for results is here.
- Each entry lists the percentage of responses that fit in that bucket (slower than max time for previous bucket, faster than min time for next bucket).
Insert response time histogram
256us	1ms	4ms	16ms	64ms	256ms	1s	4s	16s	gt	max	tag
0.000	0.000	30.695	47.324	21.911	0.068	0.003	nonzero	0.000	0.000	1.241	pg152_o3_native_lto.cx7a28_gcp_c2s30
0.000	0.000	52.231	28.301	19.429	0.036	0.003	nonzero	0.000	0.000	1.463	pg153_o3_native_lto.cx7a28_gcp_c2s30
0.000	0.000	41.984	37.245	20.725	0.044	0.001	nonzero	0.000	0.000	1.546	pg154_o3_native_lto.cx7a28_gcp_c2s30
0.000	0.000	44.757	34.801	20.387	0.052	0.002	0.000	0.000	0.000	0.803	pg16beta1_o3_native_lto.cx7a28_gcp_c2s30
0.000	0.000	47.915	33.137	18.871	0.076	0.002	nonzero	0.000	0.000	1.316	pg16beta2_o3_native_lto.cx7a28_gcp_c2s30
0.000	0.000	50.419	30.719	18.796	0.065	0.002	nonzero	0.000	0.000	1.155	pg16beta3_o3_native_lto.cx7a28_gcp_c2s30
0.000	0.000	36.041	42.691	21.187	0.078	0.002	nonzero	0.000	0.000	1.162	pg16rc1_o3_native_lto.cx7a28_gcp_c2s30
0.000	0.000	58.391	26.671	14.872	0.064	0.002	nonzero	0.000	0.000	1.017	pg160_o3_native_lto.cx7a28_gcp_c2s30
Delete response time histogram
256us	1ms	4ms	16ms	64ms	256ms	1s	4s	16s	gt	max	tag
71.565	2.995	0.911	2.886	9.371	12.046	0.226	0.000	0.000	0.000	0.615	pg152_o3_native_lto.cx7a28_gcp_c2s30
74.442	2.078	0.707	2.575	7.937	12.171	0.090	nonzero	0.000	0.000	1.022	pg153_o3_native_lto.cx7a28_gcp_c2s30
74.205	2.617	0.658	2.274	9.413	10.825	0.007	0.000	0.000	0.000	0.520	pg154_o3_native_lto.cx7a28_gcp_c2s30
71.824	4.034	1.028	3.241	10.021	9.736	0.116	0.000	0.000	0.000	0.581	pg16beta1_o3_native_lto.cx7a28_gcp_c2s30
73.262	4.446	0.567	1.836	7.565	12.226	0.098	0.000	0.000	0.000	0.777	pg16beta2_o3_native_lto.cx7a28_gcp_c2s30
75.352	3.728	0.492	1.727	7.371	11.321	0.008	0.000	0.000	0.000	0.601	pg16beta3_o3_native_lto.cx7a28_gcp_c2s30
70.858	3.870	0.493	1.692	10.647	12.438	0.002	0.000	0.000	0.000	0.458	pg16rc1_o3_native_lto.cx7a28_gcp_c2s30
76.342	1.408	0.666	2.112	7.509	11.770	0.192	0.000	0.000	0.000	0.893	pg160_o3_native_lto.cx7a28_gcp_c2s30
q100.1
- q100.1: range queries with 100 insert/s per client
- Legend for results is here.
- Each entry lists the percentage of responses that fit in that bucket (slower than max time for previous bucket, faster than min time for next bucket).
Query response time histogram
256us	1ms	4ms	16ms	64ms	256ms	1s	4s	16s	gt	max	tag
99.898	0.101	0.001	nonzero	nonzero	nonzero	0.000	0.000	0.000	0.000	0.072	pg152_o3_native_lto.cx7a28_gcp_c2s30
99.902	0.097	0.001	nonzero	nonzero	nonzero	0.000	0.000	0.000	0.000	0.240	pg153_o3_native_lto.cx7a28_gcp_c2s30
99.902	0.097	0.001	nonzero	nonzero	nonzero	0.000	0.000	0.000	0.000	0.180	pg154_o3_native_lto.cx7a28_gcp_c2s30
99.916	0.083	0.001	nonzero	nonzero	nonzero	0.000	0.000	0.000	0.000	0.142	pg16beta1_o3_native_lto.cx7a28_gcp_c2s30
99.893	0.106	0.001	nonzero	nonzero	nonzero	0.000	0.000	0.000	0.000	0.065	pg16beta2_o3_native_lto.cx7a28_gcp_c2s30
99.886	0.113	0.001	nonzero	nonzero	nonzero	0.000	0.000	0.000	0.000	0.133	pg16beta3_o3_native_lto.cx7a28_gcp_c2s30
99.912	0.087	0.001	nonzero	nonzero	nonzero	0.000	0.000	0.000	0.000	0.141	pg16rc1_o3_native_lto.cx7a28_gcp_c2s30
99.880	0.119	0.001	nonzero	nonzero	nonzero	0.000	0.000	0.000	0.000	0.152	pg160_o3_native_lto.cx7a28_gcp_c2s30
Insert response time histogram
256us	1ms	4ms	16ms	64ms	256ms	1s	4s	16s	gt	max	tag
0.000	0.000	0.000	26.701	73.289	0.010	0.000	0.000	0.000	0.000	0.168	pg152_o3_native_lto.cx7a28_gcp_c2s30
0.000	0.000	0.249	26.753	72.989	0.006	0.003	0.000	0.000	0.000	0.312	pg153_o3_native_lto.cx7a28_gcp_c2s30
0.000	0.000	2.176	21.989	75.832	0.003	0.000	0.000	0.000	0.000	0.075	pg154_o3_native_lto.cx7a28_gcp_c2s30
0.000	0.000	1.218	18.288	80.488	0.005	0.001	0.000	0.000	0.000	0.397	pg16beta1_o3_native_lto.cx7a28_gcp_c2s30
0.000	0.000	4.428	12.394	83.175	0.003	0.000	0.000	0.000	0.000	0.072	pg16beta2_o3_native_lto.cx7a28_gcp_c2s30
0.000	0.000	2.439	16.645	80.909	0.007	0.000	0.000	0.000	0.000	0.111	pg16beta3_o3_native_lto.cx7a28_gcp_c2s30
0.000	0.000	2.854	20.484	76.658	0.003	0.000	0.000	0.000	0.000	0.153	pg16rc1_o3_native_lto.cx7a28_gcp_c2s30
0.000	0.000	0.398	18.644	80.946	0.011	0.000	0.000	0.000	0.000	0.086	pg160_o3_native_lto.cx7a28_gcp_c2s30
Delete response time histogram
256us	1ms	4ms	16ms	64ms	256ms	1s	4s	16s	gt	max	tag
29.447	23.995	11.462	22.533	12.563	0.000	0.000	0.000	0.000	0.000	0.057	pg152_o3_native_lto.cx7a28_gcp_c2s30
40.579	27.175	17.924	14.317	0.004	0.000	0.000	0.000	0.000	0.000	0.020	pg153_o3_native_lto.cx7a28_gcp_c2s30
39.342	27.777	17.061	15.815	0.005	0.000	0.000	0.000	0.000	0.000	0.025	pg154_o3_native_lto.cx7a28_gcp_c2s30
31.410	25.569	22.406	20.607	0.008	0.000	0.000	0.000	0.000	0.000	0.024	pg16beta1_o3_native_lto.cx7a28_gcp_c2s30
36.299	30.667	16.444	16.586	0.005	0.000	0.000	0.000	0.000	0.000	0.021	pg16beta2_o3_native_lto.cx7a28_gcp_c2s30
31.831	22.773	16.046	16.846	12.503	0.001	0.000	0.000	0.000	0.000	0.083	pg16beta3_o3_native_lto.cx7a28_gcp_c2s30
46.854	29.552	5.736	5.358	12.499	0.001	0.000	0.000	0.000	0.000	0.086	pg16rc1_o3_native_lto.cx7a28_gcp_c2s30
30.747	25.500	11.155	20.067	12.531	0.001	0.000	0.000	0.000	0.000	0.076	pg160_o3_native_lto.cx7a28_gcp_c2s30
q500.1
- q500.1: range queries with 500 insert/s per client
- Legend for results is here.
- Each entry lists the percentage of responses that fit in that bucket (slower than max time for previous bucket, faster than min time for next bucket).
Query response time histogram
256us	1ms	4ms	16ms	64ms	256ms	1s	4s	16s	gt	max	tag
99.868	0.129	0.003	0.001	nonzero	0.000	0.000	0.000	0.000	0.000	0.027	pg152_o3_native_lto.cx7a28_gcp_c2s30
99.866	0.129	0.003	0.001	nonzero	0.000	0.000	0.000	0.000	0.000	0.028	pg153_o3_native_lto.cx7a28_gcp_c2s30
99.859	0.138	0.002	0.001	nonzero	0.000	0.000	0.000	0.000	0.000	0.028	pg154_o3_native_lto.cx7a28_gcp_c2s30
99.849	0.146	0.004	0.001	nonzero	0.000	0.000	0.000	0.000	0.000	0.027	pg16beta1_o3_native_lto.cx7a28_gcp_c2s30
99.839	0.158	0.003	0.001	nonzero	0.000	0.000	0.000	0.000	0.000	0.028	pg16beta2_o3_native_lto.cx7a28_gcp_c2s30
99.823	0.173	0.003	0.001	nonzero	0.000	0.000	0.000	0.000	0.000	0.027	pg16beta3_o3_native_lto.cx7a28_gcp_c2s30
99.850	0.147	0.002	0.001	nonzero	0.000	0.000	0.000	0.000	0.000	0.027	pg16rc1_o3_native_lto.cx7a28_gcp_c2s30
99.858	0.136	0.004	0.001	nonzero	0.000	0.000	0.000	0.000	0.000	0.032	pg160_o3_native_lto.cx7a28_gcp_c2s30
Insert response time histogram
256us	1ms	4ms	16ms	64ms	256ms	1s	4s	16s	gt	max	tag
0.000	0.000	0.000	18.771	81.228	nonzero	0.000	0.000	0.000	0.000	0.102	pg152_o3_native_lto.cx7a28_gcp_c2s30
0.000	0.000	0.000	19.583	80.416	0.001	0.000	0.000	0.000	0.000	0.135	pg153_o3_native_lto.cx7a28_gcp_c2s30
0.000	0.000	0.000	24.995	75.005	0.000	0.000	0.000	0.000	0.000	0.056	pg154_o3_native_lto.cx7a28_gcp_c2s30
0.000	0.000	0.000	15.242	84.758	nonzero	0.000	0.000	0.000	0.000	0.070	pg16beta1_o3_native_lto.cx7a28_gcp_c2s30
0.000	0.000	0.000	9.494	90.505	0.001	0.000	0.000	0.000	0.000	0.075	pg16beta2_o3_native_lto.cx7a28_gcp_c2s30
0.000	0.000	0.000	16.663	83.335	0.002	0.000	0.000	0.000	0.000	0.081	pg16beta3_o3_native_lto.cx7a28_gcp_c2s30
0.000	0.000	0.000	14.553	85.445	0.001	0.000	0.000	0.000	0.000	0.070	pg16rc1_o3_native_lto.cx7a28_gcp_c2s30
0.000	0.000	0.000	22.405	77.594	0.002	0.000	0.000	0.000	0.000	0.089	pg160_o3_native_lto.cx7a28_gcp_c2s30
Delete response time histogram
256us	1ms	4ms	16ms	64ms	256ms	1s	4s	16s	gt	max	tag
57.606	7.994	0.096	5.653	27.767	0.884	0.000	0.000	0.000	0.000	0.091	pg152_o3_native_lto.cx7a28_gcp_c2s30
34.679	6.998	0.185	8.902	49.191	0.045	0.000	0.000	0.000	0.000	0.085	pg153_o3_native_lto.cx7a28_gcp_c2s30
53.067	7.935	0.154	7.480	31.365	0.000	0.000	0.000	0.000	0.000	0.051	pg154_o3_native_lto.cx7a28_gcp_c2s30
37.141	8.836	0.182	9.970	43.863	0.008	0.000	0.000	0.000	0.000	0.077	pg16beta1_o3_native_lto.cx7a28_gcp_c2s30
55.916	10.452	0.161	7.285	26.186	0.000	0.000	0.000	0.000	0.000	0.055	pg16beta2_o3_native_lto.cx7a28_gcp_c2s30
41.764	8.375	0.154	7.140	38.368	4.199	0.000	0.000	0.000	0.000	0.112	pg16beta3_o3_native_lto.cx7a28_gcp_c2s30
67.136	8.033	0.138	2.802	14.635	7.256	0.000	0.000	0.000	0.000	0.113	pg16rc1_o3_native_lto.cx7a28_gcp_c2s30
20.662	6.882	0.122	9.142	60.292	2.901	0.000	0.000	0.000	0.000	0.117	pg160_o3_native_lto.cx7a28_gcp_c2s30
q1000.1
- q1000.1: range queries with 1000 insert/s per client
- Legend for results is here.
- Each entry lists the percentage of responses that fit in that bucket (slower than max time for previous bucket, faster than min time for next bucket).
Query response time histogram
256us	1ms	4ms	16ms	64ms	256ms	1s	4s	16s	gt	max	tag
99.711	0.285	0.003	0.001	nonzero	0.000	0.000	0.000	0.000	0.000	0.028	pg152_o3_native_lto.cx7a28_gcp_c2s30
99.683	0.311	0.005	0.001	nonzero	0.000	0.000	0.000	0.000	0.000	0.036	pg153_o3_native_lto.cx7a28_gcp_c2s30
99.775	0.218	0.006	0.001	nonzero	0.000	0.000	0.000	0.000	0.000	0.032	pg154_o3_native_lto.cx7a28_gcp_c2s30
99.675	0.319	0.004	0.001	nonzero	0.000	0.000	0.000	0.000	0.000	0.028	pg16beta1_o3_native_lto.cx7a28_gcp_c2s30
99.728	0.266	0.005	0.001	nonzero	0.000	0.000	0.000	0.000	0.000	0.028	pg16beta2_o3_native_lto.cx7a28_gcp_c2s30
99.675	0.320	0.004	0.001	nonzero	0.000	0.000	0.000	0.000	0.000	0.046	pg16beta3_o3_native_lto.cx7a28_gcp_c2s30
99.703	0.293	0.003	0.001	nonzero	0.000	0.000	0.000	0.000	0.000	0.058	pg16rc1_o3_native_lto.cx7a28_gcp_c2s30
99.691	0.302	0.006	0.001	nonzero	0.000	0.000	0.000	0.000	0.000	0.036	pg160_o3_native_lto.cx7a28_gcp_c2s30
Insert response time histogram
256us	1ms	4ms	16ms	64ms	256ms	1s	4s	16s	gt	max	tag
0.000	0.000	nonzero	11.878	88.120	0.001	0.000	0.000	0.000	0.000	0.122	pg152_o3_native_lto.cx7a28_gcp_c2s30
0.000	0.000	0.000	22.964	77.036	0.001	0.000	0.000	0.000	0.000	0.123	pg153_o3_native_lto.cx7a28_gcp_c2s30
0.000	0.000	0.000	39.580	60.419	0.001	0.000	0.000	0.000	0.000	0.081	pg154_o3_native_lto.cx7a28_gcp_c2s30
0.000	0.000	0.000	9.823	90.177	nonzero	0.000	0.000	0.000	0.000	0.070	pg16beta1_o3_native_lto.cx7a28_gcp_c2s30
0.000	0.000	0.000	29.870	70.127	0.003	0.000	0.000	0.000	0.000	0.136	pg16beta2_o3_native_lto.cx7a28_gcp_c2s30
0.000	0.000	0.000	25.254	74.743	0.002	0.000	0.000	0.000	0.000	0.091	pg16beta3_o3_native_lto.cx7a28_gcp_c2s30
0.000	0.000	0.330	13.497	86.173	0.001	0.000	0.000	0.000	0.000	0.115	pg16rc1_o3_native_lto.cx7a28_gcp_c2s30
0.000	0.000	0.000	21.629	78.365	0.006	0.000	0.000	0.000	0.000	0.094	pg160_o3_native_lto.cx7a28_gcp_c2s30
Delete response time histogram
256us	1ms	4ms	16ms	64ms	256ms	1s	4s	16s	gt	max	tag
66.965	22.554	0.147	0.023	1.164	9.147	0.000	0.000	0.000	0.000	0.177	pg152_o3_native_lto.cx7a28_gcp_c2s30
50.432	19.907	0.128	0.033	6.685	22.814	0.000	0.000	0.000	0.000	0.162	pg153_o3_native_lto.cx7a28_gcp_c2s30
44.573	15.619	0.141	0.026	12.457	27.184	0.000	0.000	0.000	0.000	0.206	pg154_o3_native_lto.cx7a28_gcp_c2s30
64.914	24.177	0.143	0.020	6.351	4.395	0.000	0.000	0.000	0.000	0.147	pg16beta1_o3_native_lto.cx7a28_gcp_c2s30
44.817	23.810	0.135	0.028	4.617	26.593	nonzero	0.000	0.000	0.000	0.324	pg16beta2_o3_native_lto.cx7a28_gcp_c2s30
52.125	19.486	0.129	0.028	1.839	26.393	0.000	0.000	0.000	0.000	0.202	pg16beta3_o3_native_lto.cx7a28_gcp_c2s30
72.021	18.287	0.144	0.024	2.179	7.345	0.000	0.000	0.000	0.000	0.153	pg16rc1_o3_native_lto.cx7a28_gcp_c2s30
55.086	20.747	0.127	0.024	7.659	16.357	0.000	0.000	0.000	0.000	0.208	pg160_o3_native_lto.cx7a28_gcp_c2s30