Introduction
This is a report for the insert benchmark with 160M docs and 8 client(s). It is generated by scripts (bash, awk, sed) and Tufte might not be impressed. An overview of the insert benchmark is here and a short update is here. Below, by DBMS, I mean DBMS+version.config. An example is my8020.c10b40 where my means MySQL, 8020 is version 8.0.20 and c10b40 is the name for the configuration file.
The test server is a c2-standard-30 with 15 cores, hyperthreads disabled, 120G RAM and XFS with SW RAID 0 across 4 NVMe SSD. The benchmark was run with 8 clients and there were 1 or 3 connections per client (1 for queries or inserts without rate limits, 1+1 for rate limited inserts+deletes). It uses 8 tables, 1 per client. It loads 20M rows per table without secondary indexes, creates secondary indexes, then inserts 300M rows per table with a delete per insert to avoid growing the table. It then does 3 read+write tests for 7200s each that do queries as fast as possible with 100, 500 and then 1000 inserts/second/client concurrent with the queries. There are also deletes to match the inserts and avoid growing the table. The database is cached by Postgres. Clients and the DBMS share one server. The per-database configs are in the per-database subdirectories here.
The tested DBMS are:
- pg152_o3_native_lto.cx7a28_gcp_c2s30 - Postgres 15.2, o3_native_lto build, cx7a28_gcp_c2s30 config
- pg153_o3_native_lto.cx7a28_gcp_c2s30 - Postgres 15.3, o3_native_lto build, cx7a28_gcp_c2s30 config
- pg154_o3_native_lto.cx7a28_gcp_c2s30 - Postgres 15.4, o3_native_lto build, cx7a28_gcp_c2s30 config
- pg16beta1_o3_native_lto.cx7a28_gcp_c2s30 - Postgres 16 beta1, o3_native_lto build, cx7a28_gcp_c2s30 config
- pg16beta2_o3_native_lto.cx7a28_gcp_c2s30 - Postgres 16 beta2, o3_native_lto build, cx7a28_gcp_c2s30 config
- pg16beta3_o3_native_lto.cx7a28_gcp_c2s30 - Postgres 16 beta3, o3_native_lto build, cx7a28_gcp_c2s30 config
- pg16rc1_o3_native_lto.cx7a28_gcp_c2s30 - Postgres 16 rc1, o3_native_lto build, cx7a28_gcp_c2s30 config
- pg160_o3_native_lto.cx7a28_gcp_c2s30 - Postgres 16.0, o3_native_lto build, cx7a28_gcp_c2s30 config
Contents
- Summary
- l.i0: load without secondary indexes
- l.x: create secondary indexes
- l.i1: continue load after secondary indexes created
- q100.1: range queries with 100 insert/s per client
- q500.1: range queries with 500 insert/s per client
- q1000.1: range queries with 1000 insert/s per client
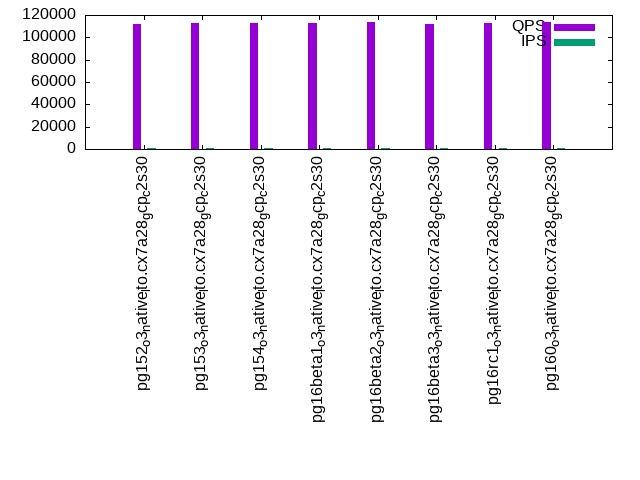
Summary
The numbers are inserts/s for l.i0 and l.i1, indexed docs (or rows) /s for l.x and queries/s for q*.2. The values are the average rate over the entire test for inserts (IPS) and queries (QPS). The range of values for IPS and QPS is split into 3 parts: bottom 25%, middle 50%, top 25%. Values in the bottom 25% have a red background, values in the top 25% have a green background and values in the middle have no color. A gray background is used for values that can be ignored because the DBMS did not sustain the target insert rate. Red backgrounds are not used when the minimum value is within 80% of the max value.
| dbms | l.i0 | l.x | l.i1 | q100.1 | q500.1 | q1000.1 |
|---|---|---|---|---|---|---|
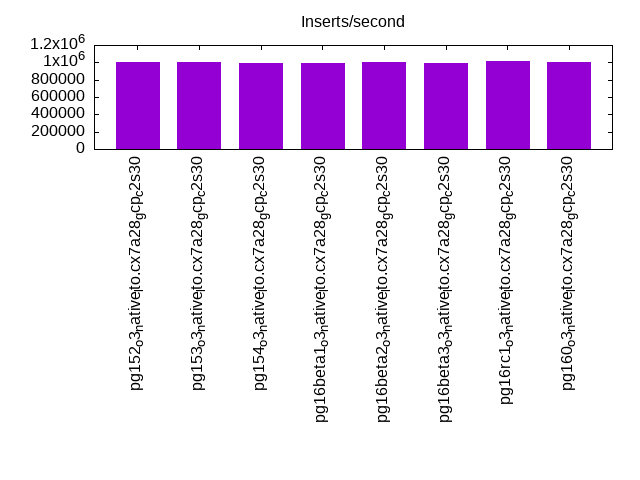
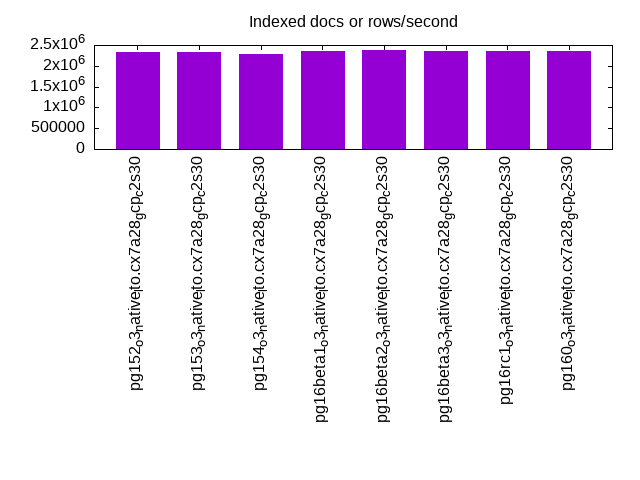
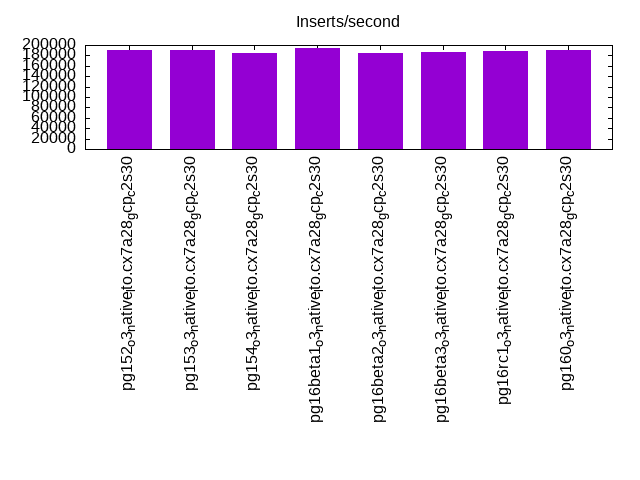
| pg152_o3_native_lto.cx7a28_gcp_c2s30 | 1006289 | 2320290 | 190946 | 112326 | 108533 | 106272 |
| pg153_o3_native_lto.cx7a28_gcp_c2s30 | 1000000 | 2320290 | 189918 | 113262 | 108885 | 106786 |
| pg154_o3_native_lto.cx7a28_gcp_c2s30 | 993789 | 2287143 | 184417 | 113152 | 109651 | 107446 |
| pg16beta1_o3_native_lto.cx7a28_gcp_c2s30 | 993789 | 2354412 | 194049 | 112928 | 109622 | 108006 |
| pg16beta2_o3_native_lto.cx7a28_gcp_c2s30 | 1000000 | 2389552 | 185500 | 113526 | 109912 | 108031 |
| pg16beta3_o3_native_lto.cx7a28_gcp_c2s30 | 993789 | 2354412 | 186712 | 112323 | 108753 | 106942 |
| pg16rc1_o3_native_lto.cx7a28_gcp_c2s30 | 1012658 | 2354412 | 188014 | 112762 | 109455 | 107715 |
| pg160_o3_native_lto.cx7a28_gcp_c2s30 | 1006289 | 2354412 | 190054 | 113965 | 109846 | 107079 |
This table has relative throughput, throughput for the DBMS relative to the DBMS in the first line, using the absolute throughput from the previous table. Values less than 0.95 have a yellow background. Values greater than 1.05 have a blue background.
| dbms | l.i0 | l.x | l.i1 | q100.1 | q500.1 | q1000.1 |
|---|---|---|---|---|---|---|
| pg152_o3_native_lto.cx7a28_gcp_c2s30 | 1.00 | 1.00 | 1.00 | 1.00 | 1.00 | 1.00 |
| pg153_o3_native_lto.cx7a28_gcp_c2s30 | 0.99 | 1.00 | 0.99 | 1.01 | 1.00 | 1.00 |
| pg154_o3_native_lto.cx7a28_gcp_c2s30 | 0.99 | 0.99 | 0.97 | 1.01 | 1.01 | 1.01 |
| pg16beta1_o3_native_lto.cx7a28_gcp_c2s30 | 0.99 | 1.01 | 1.02 | 1.01 | 1.01 | 1.02 |
| pg16beta2_o3_native_lto.cx7a28_gcp_c2s30 | 0.99 | 1.03 | 0.97 | 1.01 | 1.01 | 1.02 |
| pg16beta3_o3_native_lto.cx7a28_gcp_c2s30 | 0.99 | 1.01 | 0.98 | 1.00 | 1.00 | 1.01 |
| pg16rc1_o3_native_lto.cx7a28_gcp_c2s30 | 1.01 | 1.01 | 0.98 | 1.00 | 1.01 | 1.01 |
| pg160_o3_native_lto.cx7a28_gcp_c2s30 | 1.00 | 1.01 | 1.00 | 1.01 | 1.01 | 1.01 |
This lists the average rate of inserts/s for the tests that do inserts concurrent with queries. For such tests the query rate is listed in the table above. The read+write tests are setup so that the insert rate should match the target rate every second. Cells that are not at least 95% of the target have a red background to indicate a failure to satisfy the target.
| dbms | q100.1 | q500.1 | q1000.1 |
|---|---|---|---|
| pg152_o3_native_lto.cx7a28_gcp_c2s30 | 798 | 3992 | 7982 |
| pg153_o3_native_lto.cx7a28_gcp_c2s30 | 798 | 3992 | 7983 |
| pg154_o3_native_lto.cx7a28_gcp_c2s30 | 798 | 3991 | 7984 |
| pg16beta1_o3_native_lto.cx7a28_gcp_c2s30 | 798 | 3992 | 7983 |
| pg16beta2_o3_native_lto.cx7a28_gcp_c2s30 | 798 | 3991 | 7983 |
| pg16beta3_o3_native_lto.cx7a28_gcp_c2s30 | 798 | 3992 | 7983 |
| pg16rc1_o3_native_lto.cx7a28_gcp_c2s30 | 798 | 3991 | 7984 |
| pg160_o3_native_lto.cx7a28_gcp_c2s30 | 798 | 3992 | 7983 |
| target | 800 | 4000 | 8000 |
l.i0
l.i0: load without secondary indexes. Graphs for performance per 1-second interval are here.
Average throughput:
Insert response time histogram: each cell has the percentage of responses that take <= the time in the header and max is the max response time in seconds. For the max column values in the top 25% of the range have a red background and in the bottom 25% of the range have a green background. The red background is not used when the min value is within 80% of the max value.
| dbms | 256us | 1ms | 4ms | 16ms | 64ms | 256ms | 1s | 4s | 16s | gt | max |
|---|---|---|---|---|---|---|---|---|---|---|---|
| pg152_o3_native_lto.cx7a28_gcp_c2s30 | 97.519 | 2.424 | 0.044 | 0.003 | 0.009 | 0.002 | 0.628 | ||||
| pg153_o3_native_lto.cx7a28_gcp_c2s30 | 97.841 | 2.100 | 0.047 | 0.001 | 0.009 | 0.002 | 0.458 | ||||
| pg154_o3_native_lto.cx7a28_gcp_c2s30 | 97.642 | 2.298 | 0.047 | 0.003 | 0.010 | 0.002 | 0.372 | ||||
| pg16beta1_o3_native_lto.cx7a28_gcp_c2s30 | 97.933 | 2.009 | 0.045 | 0.001 | 0.009 | 0.002 | 0.802 | ||||
| pg16beta2_o3_native_lto.cx7a28_gcp_c2s30 | 97.979 | 1.961 | 0.046 | 0.003 | 0.010 | 0.002 | 0.648 | ||||
| pg16beta3_o3_native_lto.cx7a28_gcp_c2s30 | 98.063 | 1.876 | 0.048 | 0.003 | 0.010 | 0.001 | 0.339 | ||||
| pg16rc1_o3_native_lto.cx7a28_gcp_c2s30 | 98.034 | 1.908 | 0.045 | 0.004 | 0.008 | 0.001 | 0.763 | ||||
| pg160_o3_native_lto.cx7a28_gcp_c2s30 | 98.128 | 1.810 | 0.052 | 0.002 | 0.006 | 0.001 | nonzero | 1.318 |
Performance metrics for the DBMS listed above. Some are normalized by throughput, others are not. Legend for results is here.
ips	qps	rps	rmbps	wps	wmbps	rpq	rkbpq	wpi	wkbpi	csps	cpups	cspq	cpupq	dbgb1	dbgb2	rss	maxop	p50	p99	tag
1006289	0	0	0.0	1176.0	375.6	0.000	0.000	0.001	0.382	84193	77.5	0.084	12	15.3	41.9	1.7	0.628	143596	42054	160m.pg152_o3_native_lto.cx7a28_gcp_c2s30
1000000	0	0	0.0	1164.4	364.9	0.000	0.000	0.001	0.374	84504	77.9	0.085	12	15.3	41.8	1.7	0.458	142545	51662	160m.pg153_o3_native_lto.cx7a28_gcp_c2s30
993789	0	0	0.0	1153.0	364.1	0.000	0.000	0.001	0.375	83797	76.5	0.084	12	15.3	42.0	1.7	0.372	142045	54341	160m.pg154_o3_native_lto.cx7a28_gcp_c2s30
993789	0	0	0.0	1150.3	361.7	0.000	0.000	0.001	0.373	82052	76.5	0.083	12	15.3	41.9	3.2	0.802	142646	54539	160m.pg16beta1_o3_native_lto.cx7a28_gcp_c2s30
1000000	0	0	0.0	1152.3	359.6	0.000	0.000	0.001	0.368	82835	76.3	0.083	11	15.3	42.0	4.7	0.648	143399	52761	160m.pg16beta2_o3_native_lto.cx7a28_gcp_c2s30
993789	0	0	0.0	1153.1	368.8	0.000	0.000	0.001	0.380	83241	76.9	0.084	12	15.3	42.0	1.7	0.339	141744	62330	160m.pg16beta3_o3_native_lto.cx7a28_gcp_c2s30
1012658	0	0	0.0	1179.7	373.3	0.000	0.000	0.001	0.378	84146	77.9	0.083	12	15.3	42.0	1.7	0.763	143545	48247	160m.pg16rc1_o3_native_lto.cx7a28_gcp_c2s30
1006289	0	0	0.0	1178.1	375.3	0.000	0.000	0.001	0.382	84251	77.9	0.084	12	15.3	42.1	1.7	1.318	143444	52144	160m.pg160_o3_native_lto.cx7a28_gcp_c2s30
l.x
l.x: create secondary indexes.
Average throughput:
Performance metrics for the DBMS listed above. Some are normalized by throughput, others are not. Legend for results is here.
ips	qps	rps	rmbps	wps	wmbps	rpq	rkbpq	wpi	wkbpi	csps	cpups	cspq	cpupq	dbgb1	dbgb2	rss	maxop	p50	p99	tag
2320290	0	0	0.0	1303.2	504.5	0.000	0.000	0.001	0.223	16089	41.2	0.007	3	29.4	61.5	13.1	0.002	NA	NA	160m.pg152_o3_native_lto.cx7a28_gcp_c2s30
2320290	0	0	0.0	1374.5	534.4	0.000	0.000	0.001	0.236	17875	39.3	0.008	3	29.4	61.5	13.1	0.002	NA	NA	160m.pg153_o3_native_lto.cx7a28_gcp_c2s30
2287143	0	0	0.0	1371.1	528.9	0.000	0.000	0.001	0.237	20986	38.5	0.009	3	29.4	61.5	13.1	0.002	NA	NA	160m.pg154_o3_native_lto.cx7a28_gcp_c2s30
2354412	0	0	0.0	1366.7	517.0	0.000	0.000	0.001	0.225	18260	40.1	0.008	3	29.4	61.5	13.2	0.002	NA	NA	160m.pg16beta1_o3_native_lto.cx7a28_gcp_c2s30
2389552	0	0	0.0	1408.0	546.5	0.000	0.000	0.001	0.234	17810	40.1	0.007	3	29.4	61.5	13.1	0.002	NA	NA	160m.pg16beta2_o3_native_lto.cx7a28_gcp_c2s30
2354412	0	0	0.0	1334.8	508.3	0.000	0.000	0.001	0.221	18710	40.0	0.008	3	29.4	61.5	13.1	0.002	NA	NA	160m.pg16beta3_o3_native_lto.cx7a28_gcp_c2s30
2354412	0	0	0.0	1350.3	509.7	0.000	0.000	0.001	0.222	15212	40.3	0.006	3	29.4	61.5	13.2	0.002	NA	NA	160m.pg16rc1_o3_native_lto.cx7a28_gcp_c2s30
2354412	0	0	0.0	1333.2	509.1	0.000	0.000	0.001	0.221	16719	40.4	0.007	3	29.4	61.5	13.2	0.002	NA	NA	160m.pg160_o3_native_lto.cx7a28_gcp_c2s30
l.i1
l.i1: continue load after secondary indexes created. Graphs for performance per 1-second interval are here.
Average throughput:
Insert response time histogram: each cell has the percentage of responses that take <= the time in the header and max is the max response time in seconds. For the max column values in the top 25% of the range have a red background and in the bottom 25% of the range have a green background. The red background is not used when the min value is within 80% of the max value.
| dbms | 256us | 1ms | 4ms | 16ms | 64ms | 256ms | 1s | 4s | 16s | gt | max |
|---|---|---|---|---|---|---|---|---|---|---|---|
| pg152_o3_native_lto.cx7a28_gcp_c2s30 | 0.046 | 98.890 | 0.434 | 0.582 | 0.048 | nonzero | 0.312 | ||||
| pg153_o3_native_lto.cx7a28_gcp_c2s30 | 0.012 | 98.924 | 0.445 | 0.567 | 0.051 | nonzero | 0.368 | ||||
| pg154_o3_native_lto.cx7a28_gcp_c2s30 | 0.041 | 98.879 | 0.440 | 0.591 | 0.049 | 0.001 | 0.459 | ||||
| pg16beta1_o3_native_lto.cx7a28_gcp_c2s30 | 0.401 | 98.588 | 0.415 | 0.548 | 0.048 | nonzero | 0.322 | ||||
| pg16beta2_o3_native_lto.cx7a28_gcp_c2s30 | 0.078 | 98.883 | 0.431 | 0.555 | 0.053 | 0.001 | nonzero | 1.334 | |||
| pg16beta3_o3_native_lto.cx7a28_gcp_c2s30 | 0.207 | 98.725 | 0.433 | 0.586 | 0.049 | 0.204 | |||||
| pg16rc1_o3_native_lto.cx7a28_gcp_c2s30 | 0.273 | 98.683 | 0.426 | 0.570 | 0.048 | nonzero | 0.359 | ||||
| pg160_o3_native_lto.cx7a28_gcp_c2s30 | 0.059 | 98.882 | 0.425 | 0.582 | 0.052 | nonzero | 0.356 |
Delete response time histogram: each cell has the percentage of responses that take <= the time in the header and max is the max response time in seconds. For the max column values in the top 25% of the range have a red background and in the bottom 25% of the range have a green background. The red background is not used when the min value is within 80% of the max value.
| dbms | 256us | 1ms | 4ms | 16ms | 64ms | 256ms | 1s | 4s | 16s | gt | max |
|---|---|---|---|---|---|---|---|---|---|---|---|
| pg152_o3_native_lto.cx7a28_gcp_c2s30 | 75.908 | 9.840 | 10.057 | 3.824 | 0.339 | 0.032 | nonzero | 0.313 | |||
| pg153_o3_native_lto.cx7a28_gcp_c2s30 | 76.122 | 9.513 | 9.873 | 4.132 | 0.327 | 0.034 | nonzero | 0.366 | |||
| pg154_o3_native_lto.cx7a28_gcp_c2s30 | 76.672 | 8.951 | 9.675 | 4.311 | 0.355 | 0.034 | nonzero | 0.448 | |||
| pg16beta1_o3_native_lto.cx7a28_gcp_c2s30 | 76.149 | 9.618 | 10.206 | 3.664 | 0.329 | 0.033 | nonzero | 0.321 | |||
| pg16beta2_o3_native_lto.cx7a28_gcp_c2s30 | 76.001 | 9.536 | 9.408 | 4.674 | 0.343 | 0.038 | nonzero | nonzero | 1.338 | ||
| pg16beta3_o3_native_lto.cx7a28_gcp_c2s30 | 75.287 | 9.990 | 10.064 | 4.268 | 0.357 | 0.035 | 0.165 | ||||
| pg16rc1_o3_native_lto.cx7a28_gcp_c2s30 | 76.193 | 9.252 | 9.990 | 4.184 | 0.349 | 0.034 | nonzero | 0.342 | |||
| pg160_o3_native_lto.cx7a28_gcp_c2s30 | 76.462 | 9.020 | 9.860 | 4.264 | 0.358 | 0.036 | nonzero | 0.306 |
Performance metrics for the DBMS listed above. Some are normalized by throughput, others are not. Legend for results is here.
ips	qps	rps	rmbps	wps	wmbps	rpq	rkbpq	wpi	wkbpi	csps	cpups	cspq	cpupq	dbgb1	dbgb2	rss	maxop	p50	p99	tag
190946	0	0	0.0	10662.5	897.6	0.000	0.000	0.056	4.814	75246	70.8	0.394	56	41.7	73.8	36.3	0.312	29268	2397	160m.pg152_o3_native_lto.cx7a28_gcp_c2s30
189918	0	0	0.0	10728.0	892.0	0.000	0.000	0.056	4.809	75673	71.0	0.398	56	41.8	73.9	35.5	0.368	29030	2497	160m.pg153_o3_native_lto.cx7a28_gcp_c2s30
184417	0	0	0.0	10653.3	881.7	0.000	0.000	0.058	4.896	72614	69.9	0.394	57	41.7	73.8	19.8	0.459	27071	2349	160m.pg154_o3_native_lto.cx7a28_gcp_c2s30
194049	0	0	0.0	10221.6	879.9	0.000	0.000	0.053	4.643	76507	69.5	0.394	54	41.7	73.8	34.2	0.322	29578	2348	160m.pg16beta1_o3_native_lto.cx7a28_gcp_c2s30
185500	0	0	0.0	10584.7	871.0	0.000	0.000	0.057	4.808	73103	69.4	0.394	56	41.7	73.7	21.2	1.334	27214	2148	160m.pg16beta2_o3_native_lto.cx7a28_gcp_c2s30
186712	0	0	0.0	10705.3	887.2	0.000	0.000	0.057	4.866	74010	69.7	0.396	56	41.7	73.7	25.7	0.204	27370	2697	160m.pg16beta3_o3_native_lto.cx7a28_gcp_c2s30
188014	0	0	0.0	10270.1	869.1	0.000	0.000	0.055	4.733	74525	69.3	0.396	55	41.7	73.7	35.5	0.359	28731	2999	160m.pg16rc1_o3_native_lto.cx7a28_gcp_c2s30
190054	0	0	0.0	10581.5	889.7	0.000	0.000	0.056	4.794	74537	70.2	0.392	55	41.6	73.7	28.7	0.356	28169	2597	160m.pg160_o3_native_lto.cx7a28_gcp_c2s30
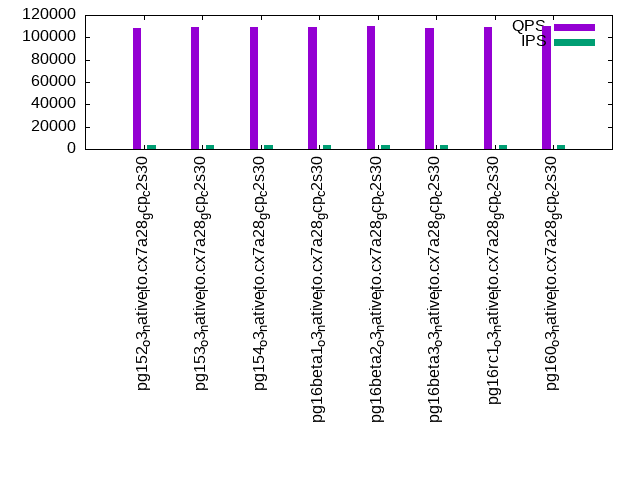
q100.1
q100.1: range queries with 100 insert/s per client. Graphs for performance per 1-second interval are here.
Average throughput:
Query response time histogram: each cell has the percentage of responses that take <= the time in the header and max is the max response time in seconds. For max values in the top 25% of the range have a red background and in the bottom 25% of the range have a green background. The red background is not used when the min value is within 80% of the max value.
| dbms | 256us | 1ms | 4ms | 16ms | 64ms | 256ms | 1s | 4s | 16s | gt | max |
|---|---|---|---|---|---|---|---|---|---|---|---|
| pg152_o3_native_lto.cx7a28_gcp_c2s30 | 99.996 | 0.003 | 0.001 | nonzero | 0.010 | ||||||
| pg153_o3_native_lto.cx7a28_gcp_c2s30 | 99.996 | 0.003 | 0.001 | nonzero | 0.008 | ||||||
| pg154_o3_native_lto.cx7a28_gcp_c2s30 | 99.996 | 0.003 | 0.001 | nonzero | 0.007 | ||||||
| pg16beta1_o3_native_lto.cx7a28_gcp_c2s30 | 99.996 | 0.003 | 0.001 | nonzero | 0.010 | ||||||
| pg16beta2_o3_native_lto.cx7a28_gcp_c2s30 | 99.996 | 0.003 | 0.001 | nonzero | 0.009 | ||||||
| pg16beta3_o3_native_lto.cx7a28_gcp_c2s30 | 99.996 | 0.003 | 0.001 | nonzero | 0.008 | ||||||
| pg16rc1_o3_native_lto.cx7a28_gcp_c2s30 | 99.997 | 0.003 | 0.001 | nonzero | 0.009 | ||||||
| pg160_o3_native_lto.cx7a28_gcp_c2s30 | 99.996 | 0.003 | 0.001 | nonzero | 0.008 |
Insert response time histogram: each cell has the percentage of responses that take <= the time in the header and max is the max response time in seconds. For max values in the top 25% of the range have a red background and in the bottom 25% of the range have a green background. The red background is not used when the min value is within 80% of the max value.
| dbms | 256us | 1ms | 4ms | 16ms | 64ms | 256ms | 1s | 4s | 16s | gt | max |
|---|---|---|---|---|---|---|---|---|---|---|---|
| pg152_o3_native_lto.cx7a28_gcp_c2s30 | 99.944 | 0.056 | 0.008 | ||||||||
| pg153_o3_native_lto.cx7a28_gcp_c2s30 | 99.931 | 0.069 | 0.010 | ||||||||
| pg154_o3_native_lto.cx7a28_gcp_c2s30 | 99.938 | 0.062 | 0.007 | ||||||||
| pg16beta1_o3_native_lto.cx7a28_gcp_c2s30 | 99.969 | 0.031 | 0.006 | ||||||||
| pg16beta2_o3_native_lto.cx7a28_gcp_c2s30 | 99.947 | 0.053 | 0.012 | ||||||||
| pg16beta3_o3_native_lto.cx7a28_gcp_c2s30 | 99.955 | 0.045 | 0.009 | ||||||||
| pg16rc1_o3_native_lto.cx7a28_gcp_c2s30 | 99.953 | 0.047 | 0.009 | ||||||||
| pg160_o3_native_lto.cx7a28_gcp_c2s30 | 99.959 | 0.041 | 0.008 |
Delete response time histogram: each cell has the percentage of responses that take <= the time in the header and max is the max response time in seconds. For max values in the top 25% of the range have a red background and in the bottom 25% of the range have a green background. The red background is not used when the min value is within 80% of the max value.
| dbms | 256us | 1ms | 4ms | 16ms | 64ms | 256ms | 1s | 4s | 16s | gt | max |
|---|---|---|---|---|---|---|---|---|---|---|---|
| pg152_o3_native_lto.cx7a28_gcp_c2s30 | 68.910 | 11.161 | 17.227 | 2.701 | 0.011 | ||||||
| pg153_o3_native_lto.cx7a28_gcp_c2s30 | 68.650 | 12.943 | 16.378 | 2.030 | 0.010 | ||||||
| pg154_o3_native_lto.cx7a28_gcp_c2s30 | 65.877 | 13.259 | 15.831 | 5.034 | 0.013 | ||||||
| pg16beta1_o3_native_lto.cx7a28_gcp_c2s30 | 62.528 | 13.499 | 18.937 | 5.036 | 0.011 | ||||||
| pg16beta2_o3_native_lto.cx7a28_gcp_c2s30 | 65.753 | 16.042 | 14.577 | 3.628 | 0.008 | ||||||
| pg16beta3_o3_native_lto.cx7a28_gcp_c2s30 | 64.930 | 12.845 | 18.634 | 3.592 | 0.012 | ||||||
| pg16rc1_o3_native_lto.cx7a28_gcp_c2s30 | 66.127 | 10.901 | 19.912 | 3.060 | 0.009 | ||||||
| pg160_o3_native_lto.cx7a28_gcp_c2s30 | 73.913 | 13.093 | 11.361 | 1.633 | 0.008 |
Performance metrics for the DBMS listed above. Some are normalized by throughput, others are not. Legend for results is here.
ips	qps	rps	rmbps	wps	wmbps	rpq	rkbpq	wpi	wkbpi	csps	cpups	cspq	cpupq	dbgb1	dbgb2	rss	maxop	p50	p99	tag
798	112326	0	0.0	330.6	11.9	0.000	0.000	0.414	15.268	427892	52.8	3.809	71	41.7	73.8	1.0	0.010	14054	13761	160m.pg152_o3_native_lto.cx7a28_gcp_c2s30
798	113262	0	0.0	314.0	11.4	0.000	0.000	0.393	14.672	431294	52.9	3.808	70	41.8	73.9	11.5	0.008	14070	13809	160m.pg153_o3_native_lto.cx7a28_gcp_c2s30
798	113152	0	0.0	290.3	10.6	0.000	0.000	0.364	13.587	430877	52.9	3.808	70	41.8	73.8	42.6	0.007	14065	13809	160m.pg154_o3_native_lto.cx7a28_gcp_c2s30
798	112928	0	0.0	388.3	12.5	0.000	0.000	0.486	15.985	430136	53.0	3.809	70	41.7	73.8	8.1	0.010	14182	13921	160m.pg16beta1_o3_native_lto.cx7a28_gcp_c2s30
798	113526	0	0.0	309.3	11.0	0.000	0.000	0.387	14.127	432335	52.9	3.808	70	41.7	73.7	11.4	0.009	14134	13878	160m.pg16beta2_o3_native_lto.cx7a28_gcp_c2s30
798	112323	0	0.0	395.8	12.3	0.000	0.000	0.496	15.727	427852	52.9	3.809	71	41.7	73.7	6.5	0.008	13937	13686	160m.pg16beta3_o3_native_lto.cx7a28_gcp_c2s30
798	112762	0	0.0	313.8	11.4	0.000	0.000	0.393	14.633	429497	52.8	3.809	70	41.7	73.7	10.8	0.009	14070	13798	160m.pg16rc1_o3_native_lto.cx7a28_gcp_c2s30
798	113965	0	0.0	287.4	10.4	0.000	0.000	0.360	13.356	433962	52.7	3.808	69	41.6	73.6	10.7	0.008	14224	13944	160m.pg160_o3_native_lto.cx7a28_gcp_c2s30
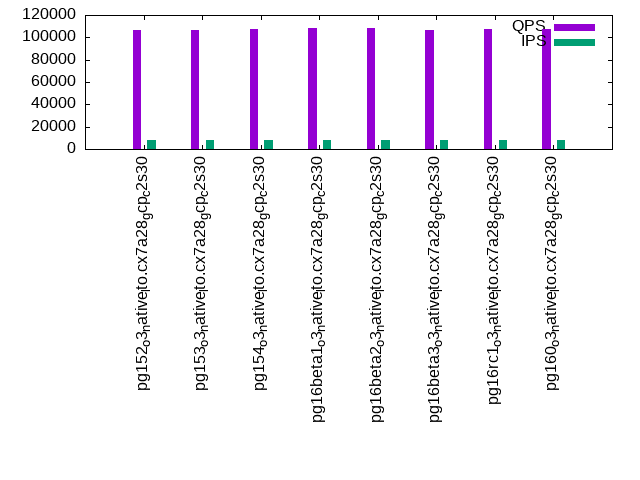
q500.1
q500.1: range queries with 500 insert/s per client. Graphs for performance per 1-second interval are here.
Average throughput:
Query response time histogram: each cell has the percentage of responses that take <= the time in the header and max is the max response time in seconds. For max values in the top 25% of the range have a red background and in the bottom 25% of the range have a green background. The red background is not used when the min value is within 80% of the max value.
| dbms | 256us | 1ms | 4ms | 16ms | 64ms | 256ms | 1s | 4s | 16s | gt | max |
|---|---|---|---|---|---|---|---|---|---|---|---|
| pg152_o3_native_lto.cx7a28_gcp_c2s30 | 99.988 | 0.008 | 0.004 | nonzero | nonzero | nonzero | 0.071 | ||||
| pg153_o3_native_lto.cx7a28_gcp_c2s30 | 99.989 | 0.007 | 0.004 | nonzero | nonzero | nonzero | 0.082 | ||||
| pg154_o3_native_lto.cx7a28_gcp_c2s30 | 99.989 | 0.007 | 0.004 | nonzero | nonzero | nonzero | 0.065 | ||||
| pg16beta1_o3_native_lto.cx7a28_gcp_c2s30 | 99.989 | 0.008 | 0.004 | nonzero | nonzero | nonzero | 0.077 | ||||
| pg16beta2_o3_native_lto.cx7a28_gcp_c2s30 | 99.988 | 0.008 | 0.004 | nonzero | nonzero | 0.064 | |||||
| pg16beta3_o3_native_lto.cx7a28_gcp_c2s30 | 99.987 | 0.009 | 0.005 | nonzero | nonzero | 0.023 | |||||
| pg16rc1_o3_native_lto.cx7a28_gcp_c2s30 | 99.986 | 0.009 | 0.005 | nonzero | nonzero | nonzero | 0.089 | ||||
| pg160_o3_native_lto.cx7a28_gcp_c2s30 | 99.987 | 0.008 | 0.004 | nonzero | nonzero | nonzero | 0.073 |
Insert response time histogram: each cell has the percentage of responses that take <= the time in the header and max is the max response time in seconds. For max values in the top 25% of the range have a red background and in the bottom 25% of the range have a green background. The red background is not used when the min value is within 80% of the max value.
| dbms | 256us | 1ms | 4ms | 16ms | 64ms | 256ms | 1s | 4s | 16s | gt | max |
|---|---|---|---|---|---|---|---|---|---|---|---|
| pg152_o3_native_lto.cx7a28_gcp_c2s30 | 99.946 | 0.053 | 0.001 | 0.017 | |||||||
| pg153_o3_native_lto.cx7a28_gcp_c2s30 | 99.969 | 0.030 | nonzero | 0.025 | |||||||
| pg154_o3_native_lto.cx7a28_gcp_c2s30 | 99.965 | 0.034 | 0.001 | 0.018 | |||||||
| pg16beta1_o3_native_lto.cx7a28_gcp_c2s30 | 99.972 | 0.027 | 0.001 | 0.025 | |||||||
| pg16beta2_o3_native_lto.cx7a28_gcp_c2s30 | 99.968 | 0.032 | 0.001 | 0.017 | |||||||
| pg16beta3_o3_native_lto.cx7a28_gcp_c2s30 | 99.952 | 0.047 | 0.001 | 0.021 | |||||||
| pg16rc1_o3_native_lto.cx7a28_gcp_c2s30 | 99.935 | 0.064 | nonzero | nonzero | 0.085 | ||||||
| pg160_o3_native_lto.cx7a28_gcp_c2s30 | 99.953 | 0.047 | 0.001 | 0.018 |
Delete response time histogram: each cell has the percentage of responses that take <= the time in the header and max is the max response time in seconds. For max values in the top 25% of the range have a red background and in the bottom 25% of the range have a green background. The red background is not used when the min value is within 80% of the max value.
| dbms | 256us | 1ms | 4ms | 16ms | 64ms | 256ms | 1s | 4s | 16s | gt | max |
|---|---|---|---|---|---|---|---|---|---|---|---|
| pg152_o3_native_lto.cx7a28_gcp_c2s30 | 77.525 | 10.395 | 9.728 | 2.351 | 0.001 | 0.022 | |||||
| pg153_o3_native_lto.cx7a28_gcp_c2s30 | 77.627 | 7.837 | 12.301 | 2.234 | 0.001 | 0.021 | |||||
| pg154_o3_native_lto.cx7a28_gcp_c2s30 | 78.167 | 8.274 | 10.581 | 2.977 | nonzero | 0.018 | |||||
| pg16beta1_o3_native_lto.cx7a28_gcp_c2s30 | 77.952 | 9.448 | 12.005 | 0.595 | 0.016 | ||||||
| pg16beta2_o3_native_lto.cx7a28_gcp_c2s30 | 76.999 | 9.664 | 10.063 | 3.273 | nonzero | 0.018 | |||||
| pg16beta3_o3_native_lto.cx7a28_gcp_c2s30 | 76.987 | 11.494 | 9.597 | 1.921 | 0.001 | 0.021 | |||||
| pg16rc1_o3_native_lto.cx7a28_gcp_c2s30 | 77.790 | 11.442 | 8.281 | 2.486 | 0.001 | nonzero | 0.084 | ||||
| pg160_o3_native_lto.cx7a28_gcp_c2s30 | 77.230 | 8.709 | 6.759 | 7.301 | 0.001 | 0.021 |
Performance metrics for the DBMS listed above. Some are normalized by throughput, others are not. Legend for results is here.
ips	qps	rps	rmbps	wps	wmbps	rpq	rkbpq	wpi	wkbpi	csps	cpups	cspq	cpupq	dbgb1	dbgb2	rss	maxop	p50	p99	tag
3992	108533	0	0.0	256.8	20.4	0.000	0.000	0.064	5.226	413972	53.7	3.814	74	41.7	73.7	19.1	0.071	13591	11363	160m.pg152_o3_native_lto.cx7a28_gcp_c2s30
3992	108885	0	0.0	260.0	20.4	0.000	0.000	0.065	5.232	415315	53.8	3.814	74	41.7	73.7	28.5	0.082	13617	11384	160m.pg153_o3_native_lto.cx7a28_gcp_c2s30
3991	109651	0	0.0	256.3	20.2	0.000	0.000	0.064	5.179	418267	53.9	3.815	74	41.7	73.8	11.7	0.065	13617	11385	160m.pg154_o3_native_lto.cx7a28_gcp_c2s30
3992	109622	0	0.0	219.4	21.1	0.000	0.000	0.055	5.409	418289	53.8	3.816	74	41.6	73.7	2.9	0.077	13729	11475	160m.pg16beta1_o3_native_lto.cx7a28_gcp_c2s30
3991	109912	0	0.0	252.9	20.0	0.000	0.000	0.063	5.134	419243	53.8	3.814	73	41.6	73.7	14.6	0.064	13713	11332	160m.pg16beta2_o3_native_lto.cx7a28_gcp_c2s30
3992	108753	0	0.0	226.1	21.1	0.000	0.000	0.057	5.420	414859	53.8	3.815	74	41.7	73.7	11.1	0.023	13441	11172	160m.pg16beta3_o3_native_lto.cx7a28_gcp_c2s30
3991	109455	0	0.0	257.1	20.4	0.000	0.000	0.064	5.229	417437	53.7	3.814	74	41.6	73.6	17.9	0.089	13745	11443	160m.pg16rc1_o3_native_lto.cx7a28_gcp_c2s30
3992	109846	0	0.0	251.0	20.0	0.000	0.000	0.063	5.135	418851	53.9	3.813	74	41.5	73.6	9.8	0.073	13793	11512	160m.pg160_o3_native_lto.cx7a28_gcp_c2s30
q1000.1
q1000.1: range queries with 1000 insert/s per client. Graphs for performance per 1-second interval are here.
Average throughput:
Query response time histogram: each cell has the percentage of responses that take <= the time in the header and max is the max response time in seconds. For max values in the top 25% of the range have a red background and in the bottom 25% of the range have a green background. The red background is not used when the min value is within 80% of the max value.
| dbms | 256us | 1ms | 4ms | 16ms | 64ms | 256ms | 1s | 4s | 16s | gt | max |
|---|---|---|---|---|---|---|---|---|---|---|---|
| pg152_o3_native_lto.cx7a28_gcp_c2s30 | 99.958 | 0.033 | 0.008 | nonzero | nonzero | nonzero | 0.091 | ||||
| pg153_o3_native_lto.cx7a28_gcp_c2s30 | 99.957 | 0.033 | 0.009 | nonzero | nonzero | nonzero | 0.070 | ||||
| pg154_o3_native_lto.cx7a28_gcp_c2s30 | 99.961 | 0.031 | 0.008 | nonzero | nonzero | nonzero | 0.134 | ||||
| pg16beta1_o3_native_lto.cx7a28_gcp_c2s30 | 99.949 | 0.040 | 0.011 | nonzero | nonzero | nonzero | 0.088 | ||||
| pg16beta2_o3_native_lto.cx7a28_gcp_c2s30 | 99.954 | 0.035 | 0.010 | nonzero | nonzero | nonzero | 0.077 | ||||
| pg16beta3_o3_native_lto.cx7a28_gcp_c2s30 | 99.955 | 0.035 | 0.010 | nonzero | nonzero | nonzero | 0.089 | ||||
| pg16rc1_o3_native_lto.cx7a28_gcp_c2s30 | 99.961 | 0.031 | 0.008 | nonzero | nonzero | nonzero | 0.074 | ||||
| pg160_o3_native_lto.cx7a28_gcp_c2s30 | 99.960 | 0.031 | 0.009 | nonzero | nonzero | 0.062 |
Insert response time histogram: each cell has the percentage of responses that take <= the time in the header and max is the max response time in seconds. For max values in the top 25% of the range have a red background and in the bottom 25% of the range have a green background. The red background is not used when the min value is within 80% of the max value.
| dbms | 256us | 1ms | 4ms | 16ms | 64ms | 256ms | 1s | 4s | 16s | gt | max |
|---|---|---|---|---|---|---|---|---|---|---|---|
| pg152_o3_native_lto.cx7a28_gcp_c2s30 | 99.761 | 0.231 | 0.007 | 0.001 | 0.076 | ||||||
| pg153_o3_native_lto.cx7a28_gcp_c2s30 | 99.761 | 0.232 | 0.008 | 0.047 | |||||||
| pg154_o3_native_lto.cx7a28_gcp_c2s30 | 99.757 | 0.228 | 0.013 | 0.002 | 0.133 | ||||||
| pg16beta1_o3_native_lto.cx7a28_gcp_c2s30 | 99.676 | 0.308 | 0.016 | 0.060 | |||||||
| pg16beta2_o3_native_lto.cx7a28_gcp_c2s30 | 99.567 | 0.418 | 0.015 | nonzero | 0.082 | ||||||
| pg16beta3_o3_native_lto.cx7a28_gcp_c2s30 | 99.645 | 0.344 | 0.010 | 0.001 | 0.088 | ||||||
| pg16rc1_o3_native_lto.cx7a28_gcp_c2s30 | nonzero | 99.732 | 0.256 | 0.012 | 0.045 | ||||||
| pg160_o3_native_lto.cx7a28_gcp_c2s30 | 99.677 | 0.308 | 0.015 | nonzero | 0.065 |
Delete response time histogram: each cell has the percentage of responses that take <= the time in the header and max is the max response time in seconds. For max values in the top 25% of the range have a red background and in the bottom 25% of the range have a green background. The red background is not used when the min value is within 80% of the max value.
| dbms | 256us | 1ms | 4ms | 16ms | 64ms | 256ms | 1s | 4s | 16s | gt | max |
|---|---|---|---|---|---|---|---|---|---|---|---|
| pg152_o3_native_lto.cx7a28_gcp_c2s30 | 78.606 | 12.672 | 7.170 | 1.550 | 0.002 | nonzero | 0.072 | ||||
| pg153_o3_native_lto.cx7a28_gcp_c2s30 | 77.808 | 12.670 | 8.662 | 0.858 | 0.002 | 0.030 | |||||
| pg154_o3_native_lto.cx7a28_gcp_c2s30 | 77.993 | 11.100 | 10.164 | 0.738 | 0.004 | 0.001 | 0.126 | ||||
| pg16beta1_o3_native_lto.cx7a28_gcp_c2s30 | 77.244 | 14.874 | 7.684 | 0.195 | 0.003 | 0.048 | |||||
| pg16beta2_o3_native_lto.cx7a28_gcp_c2s30 | 77.072 | 11.469 | 9.957 | 1.499 | 0.003 | nonzero | 0.080 | ||||
| pg16beta3_o3_native_lto.cx7a28_gcp_c2s30 | 77.736 | 12.115 | 8.041 | 2.104 | 0.004 | nonzero | 0.086 | ||||
| pg16rc1_o3_native_lto.cx7a28_gcp_c2s30 | 78.453 | 11.786 | 8.122 | 1.634 | 0.005 | 0.043 | |||||
| pg160_o3_native_lto.cx7a28_gcp_c2s30 | 77.595 | 7.949 | 10.162 | 4.289 | 0.005 | 0.035 |
Performance metrics for the DBMS listed above. Some are normalized by throughput, others are not. Legend for results is here.
ips	qps	rps	rmbps	wps	wmbps	rpq	rkbpq	wpi	wkbpi	csps	cpups	cspq	cpupq	dbgb1	dbgb2	rss	maxop	p50	p99	tag
7982	106272	0	0.0	400.1	37.7	0.000	0.000	0.050	4.834	405408	54.9	3.815	77	41.5	73.6	18.5	0.091	13233	10900	160m.pg152_o3_native_lto.cx7a28_gcp_c2s30
7983	106786	0	0.0	406.7	37.6	0.000	0.000	0.051	4.829	407256	54.9	3.814	77	41.6	73.7	17.7	0.070	13351	11176	160m.pg153_o3_native_lto.cx7a28_gcp_c2s30
7984	107446	0	0.0	398.9	37.6	0.000	0.000	0.050	4.823	409928	54.9	3.815	77	41.6	73.6	37.6	0.134	13505	10868	160m.pg154_o3_native_lto.cx7a28_gcp_c2s30
7983	108006	0	0.0	402.4	37.9	0.000	0.000	0.050	4.857	411375	54.8	3.809	76	41.5	73.5	16.4	0.088	13649	11332	160m.pg16beta1_o3_native_lto.cx7a28_gcp_c2s30
7983	108031	0	0.0	397.5	37.8	0.000	0.000	0.050	4.846	411571	54.9	3.810	76	41.6	73.6	20.4	0.077	13537	11264	160m.pg16beta2_o3_native_lto.cx7a28_gcp_c2s30
7983	106942	0	0.0	401.4	37.9	0.000	0.000	0.050	4.864	407635	54.8	3.812	77	41.4	73.5	28.4	0.089	13297	11140	160m.pg16beta3_o3_native_lto.cx7a28_gcp_c2s30
7984	107715	0	0.0	402.4	37.5	0.000	0.000	0.050	4.814	410868	54.9	3.814	76	41.5	73.6	4.0	0.074	13601	11332	160m.pg16rc1_o3_native_lto.cx7a28_gcp_c2s30
7983	107079	0	0.0	394.1	37.6	0.000	0.000	0.049	4.823	408143	55.1	3.812	77	41.5	73.6	3.3	0.062	13393	11268	160m.pg160_o3_native_lto.cx7a28_gcp_c2s30
l.i0
l.i0: load without secondary indexes
Performance metrics for all DBMS, not just the ones listed above. Some are normalized by throughput, others are not. Legend for results is here.
ips	qps	rps	rmbps	wps	wmbps	rpq	rkbpq	wpi	wkbpi	csps	cpups	cspq	cpupq	dbgb1	dbgb2	rss	maxop	p50	p99	tag
1006289	0	0	0.0	1176.0	375.6	0.000	0.000	0.001	0.382	84193	77.5	0.084	12	15.3	41.9	1.7	0.628	143596	42054	160m.pg152_o3_native_lto.cx7a28_gcp_c2s30
1000000	0	0	0.0	1164.4	364.9	0.000	0.000	0.001	0.374	84504	77.9	0.085	12	15.3	41.8	1.7	0.458	142545	51662	160m.pg153_o3_native_lto.cx7a28_gcp_c2s30
993789	0	0	0.0	1153.0	364.1	0.000	0.000	0.001	0.375	83797	76.5	0.084	12	15.3	42.0	1.7	0.372	142045	54341	160m.pg154_o3_native_lto.cx7a28_gcp_c2s30
993789	0	0	0.0	1150.3	361.7	0.000	0.000	0.001	0.373	82052	76.5	0.083	12	15.3	41.9	3.2	0.802	142646	54539	160m.pg16beta1_o3_native_lto.cx7a28_gcp_c2s30
1000000	0	0	0.0	1152.3	359.6	0.000	0.000	0.001	0.368	82835	76.3	0.083	11	15.3	42.0	4.7	0.648	143399	52761	160m.pg16beta2_o3_native_lto.cx7a28_gcp_c2s30
993789	0	0	0.0	1153.1	368.8	0.000	0.000	0.001	0.380	83241	76.9	0.084	12	15.3	42.0	1.7	0.339	141744	62330	160m.pg16beta3_o3_native_lto.cx7a28_gcp_c2s30
1012658	0	0	0.0	1179.7	373.3	0.000	0.000	0.001	0.378	84146	77.9	0.083	12	15.3	42.0	1.7	0.763	143545	48247	160m.pg16rc1_o3_native_lto.cx7a28_gcp_c2s30
1006289	0	0	0.0	1178.1	375.3	0.000	0.000	0.001	0.382	84251	77.9	0.084	12	15.3	42.1	1.7	1.318	143444	52144	160m.pg160_o3_native_lto.cx7a28_gcp_c2s30
l.x
l.x: create secondary indexes
Performance metrics for all DBMS, not just the ones listed above. Some are normalized by throughput, others are not. Legend for results is here.
ips	qps	rps	rmbps	wps	wmbps	rpq	rkbpq	wpi	wkbpi	csps	cpups	cspq	cpupq	dbgb1	dbgb2	rss	maxop	p50	p99	tag
2320290	0	0	0.0	1303.2	504.5	0.000	0.000	0.001	0.223	16089	41.2	0.007	3	29.4	61.5	13.1	0.002	NA	NA	160m.pg152_o3_native_lto.cx7a28_gcp_c2s30
2320290	0	0	0.0	1374.5	534.4	0.000	0.000	0.001	0.236	17875	39.3	0.008	3	29.4	61.5	13.1	0.002	NA	NA	160m.pg153_o3_native_lto.cx7a28_gcp_c2s30
2287143	0	0	0.0	1371.1	528.9	0.000	0.000	0.001	0.237	20986	38.5	0.009	3	29.4	61.5	13.1	0.002	NA	NA	160m.pg154_o3_native_lto.cx7a28_gcp_c2s30
2354412	0	0	0.0	1366.7	517.0	0.000	0.000	0.001	0.225	18260	40.1	0.008	3	29.4	61.5	13.2	0.002	NA	NA	160m.pg16beta1_o3_native_lto.cx7a28_gcp_c2s30
2389552	0	0	0.0	1408.0	546.5	0.000	0.000	0.001	0.234	17810	40.1	0.007	3	29.4	61.5	13.1	0.002	NA	NA	160m.pg16beta2_o3_native_lto.cx7a28_gcp_c2s30
2354412	0	0	0.0	1334.8	508.3	0.000	0.000	0.001	0.221	18710	40.0	0.008	3	29.4	61.5	13.1	0.002	NA	NA	160m.pg16beta3_o3_native_lto.cx7a28_gcp_c2s30
2354412	0	0	0.0	1350.3	509.7	0.000	0.000	0.001	0.222	15212	40.3	0.006	3	29.4	61.5	13.2	0.002	NA	NA	160m.pg16rc1_o3_native_lto.cx7a28_gcp_c2s30
2354412	0	0	0.0	1333.2	509.1	0.000	0.000	0.001	0.221	16719	40.4	0.007	3	29.4	61.5	13.2	0.002	NA	NA	160m.pg160_o3_native_lto.cx7a28_gcp_c2s30
l.i1
l.i1: continue load after secondary indexes created
Performance metrics for all DBMS, not just the ones listed above. Some are normalized by throughput, others are not. Legend for results is here.
ips	qps	rps	rmbps	wps	wmbps	rpq	rkbpq	wpi	wkbpi	csps	cpups	cspq	cpupq	dbgb1	dbgb2	rss	maxop	p50	p99	tag
190946	0	0	0.0	10662.5	897.6	0.000	0.000	0.056	4.814	75246	70.8	0.394	56	41.7	73.8	36.3	0.312	29268	2397	160m.pg152_o3_native_lto.cx7a28_gcp_c2s30
189918	0	0	0.0	10728.0	892.0	0.000	0.000	0.056	4.809	75673	71.0	0.398	56	41.8	73.9	35.5	0.368	29030	2497	160m.pg153_o3_native_lto.cx7a28_gcp_c2s30
184417	0	0	0.0	10653.3	881.7	0.000	0.000	0.058	4.896	72614	69.9	0.394	57	41.7	73.8	19.8	0.459	27071	2349	160m.pg154_o3_native_lto.cx7a28_gcp_c2s30
194049	0	0	0.0	10221.6	879.9	0.000	0.000	0.053	4.643	76507	69.5	0.394	54	41.7	73.8	34.2	0.322	29578	2348	160m.pg16beta1_o3_native_lto.cx7a28_gcp_c2s30
185500	0	0	0.0	10584.7	871.0	0.000	0.000	0.057	4.808	73103	69.4	0.394	56	41.7	73.7	21.2	1.334	27214	2148	160m.pg16beta2_o3_native_lto.cx7a28_gcp_c2s30
186712	0	0	0.0	10705.3	887.2	0.000	0.000	0.057	4.866	74010	69.7	0.396	56	41.7	73.7	25.7	0.204	27370	2697	160m.pg16beta3_o3_native_lto.cx7a28_gcp_c2s30
188014	0	0	0.0	10270.1	869.1	0.000	0.000	0.055	4.733	74525	69.3	0.396	55	41.7	73.7	35.5	0.359	28731	2999	160m.pg16rc1_o3_native_lto.cx7a28_gcp_c2s30
190054	0	0	0.0	10581.5	889.7	0.000	0.000	0.056	4.794	74537	70.2	0.392	55	41.6	73.7	28.7	0.356	28169	2597	160m.pg160_o3_native_lto.cx7a28_gcp_c2s30
q100.1
q100.1: range queries with 100 insert/s per client
Performance metrics for all DBMS, not just the ones listed above. Some are normalized by throughput, others are not. Legend for results is here.
ips	qps	rps	rmbps	wps	wmbps	rpq	rkbpq	wpi	wkbpi	csps	cpups	cspq	cpupq	dbgb1	dbgb2	rss	maxop	p50	p99	tag
798	112326	0	0.0	330.6	11.9	0.000	0.000	0.414	15.268	427892	52.8	3.809	71	41.7	73.8	1.0	0.010	14054	13761	160m.pg152_o3_native_lto.cx7a28_gcp_c2s30
798	113262	0	0.0	314.0	11.4	0.000	0.000	0.393	14.672	431294	52.9	3.808	70	41.8	73.9	11.5	0.008	14070	13809	160m.pg153_o3_native_lto.cx7a28_gcp_c2s30
798	113152	0	0.0	290.3	10.6	0.000	0.000	0.364	13.587	430877	52.9	3.808	70	41.8	73.8	42.6	0.007	14065	13809	160m.pg154_o3_native_lto.cx7a28_gcp_c2s30
798	112928	0	0.0	388.3	12.5	0.000	0.000	0.486	15.985	430136	53.0	3.809	70	41.7	73.8	8.1	0.010	14182	13921	160m.pg16beta1_o3_native_lto.cx7a28_gcp_c2s30
798	113526	0	0.0	309.3	11.0	0.000	0.000	0.387	14.127	432335	52.9	3.808	70	41.7	73.7	11.4	0.009	14134	13878	160m.pg16beta2_o3_native_lto.cx7a28_gcp_c2s30
798	112323	0	0.0	395.8	12.3	0.000	0.000	0.496	15.727	427852	52.9	3.809	71	41.7	73.7	6.5	0.008	13937	13686	160m.pg16beta3_o3_native_lto.cx7a28_gcp_c2s30
798	112762	0	0.0	313.8	11.4	0.000	0.000	0.393	14.633	429497	52.8	3.809	70	41.7	73.7	10.8	0.009	14070	13798	160m.pg16rc1_o3_native_lto.cx7a28_gcp_c2s30
798	113965	0	0.0	287.4	10.4	0.000	0.000	0.360	13.356	433962	52.7	3.808	69	41.6	73.6	10.7	0.008	14224	13944	160m.pg160_o3_native_lto.cx7a28_gcp_c2s30
q500.1
q500.1: range queries with 500 insert/s per client
Performance metrics for all DBMS, not just the ones listed above. Some are normalized by throughput, others are not. Legend for results is here.
ips	qps	rps	rmbps	wps	wmbps	rpq	rkbpq	wpi	wkbpi	csps	cpups	cspq	cpupq	dbgb1	dbgb2	rss	maxop	p50	p99	tag
3992	108533	0	0.0	256.8	20.4	0.000	0.000	0.064	5.226	413972	53.7	3.814	74	41.7	73.7	19.1	0.071	13591	11363	160m.pg152_o3_native_lto.cx7a28_gcp_c2s30
3992	108885	0	0.0	260.0	20.4	0.000	0.000	0.065	5.232	415315	53.8	3.814	74	41.7	73.7	28.5	0.082	13617	11384	160m.pg153_o3_native_lto.cx7a28_gcp_c2s30
3991	109651	0	0.0	256.3	20.2	0.000	0.000	0.064	5.179	418267	53.9	3.815	74	41.7	73.8	11.7	0.065	13617	11385	160m.pg154_o3_native_lto.cx7a28_gcp_c2s30
3992	109622	0	0.0	219.4	21.1	0.000	0.000	0.055	5.409	418289	53.8	3.816	74	41.6	73.7	2.9	0.077	13729	11475	160m.pg16beta1_o3_native_lto.cx7a28_gcp_c2s30
3991	109912	0	0.0	252.9	20.0	0.000	0.000	0.063	5.134	419243	53.8	3.814	73	41.6	73.7	14.6	0.064	13713	11332	160m.pg16beta2_o3_native_lto.cx7a28_gcp_c2s30
3992	108753	0	0.0	226.1	21.1	0.000	0.000	0.057	5.420	414859	53.8	3.815	74	41.7	73.7	11.1	0.023	13441	11172	160m.pg16beta3_o3_native_lto.cx7a28_gcp_c2s30
3991	109455	0	0.0	257.1	20.4	0.000	0.000	0.064	5.229	417437	53.7	3.814	74	41.6	73.6	17.9	0.089	13745	11443	160m.pg16rc1_o3_native_lto.cx7a28_gcp_c2s30
3992	109846	0	0.0	251.0	20.0	0.000	0.000	0.063	5.135	418851	53.9	3.813	74	41.5	73.6	9.8	0.073	13793	11512	160m.pg160_o3_native_lto.cx7a28_gcp_c2s30
q1000.1
q1000.1: range queries with 1000 insert/s per client
Performance metrics for all DBMS, not just the ones listed above. Some are normalized by throughput, others are not. Legend for results is here.
ips	qps	rps	rmbps	wps	wmbps	rpq	rkbpq	wpi	wkbpi	csps	cpups	cspq	cpupq	dbgb1	dbgb2	rss	maxop	p50	p99	tag
7982	106272	0	0.0	400.1	37.7	0.000	0.000	0.050	4.834	405408	54.9	3.815	77	41.5	73.6	18.5	0.091	13233	10900	160m.pg152_o3_native_lto.cx7a28_gcp_c2s30
7983	106786	0	0.0	406.7	37.6	0.000	0.000	0.051	4.829	407256	54.9	3.814	77	41.6	73.7	17.7	0.070	13351	11176	160m.pg153_o3_native_lto.cx7a28_gcp_c2s30
7984	107446	0	0.0	398.9	37.6	0.000	0.000	0.050	4.823	409928	54.9	3.815	77	41.6	73.6	37.6	0.134	13505	10868	160m.pg154_o3_native_lto.cx7a28_gcp_c2s30
7983	108006	0	0.0	402.4	37.9	0.000	0.000	0.050	4.857	411375	54.8	3.809	76	41.5	73.5	16.4	0.088	13649	11332	160m.pg16beta1_o3_native_lto.cx7a28_gcp_c2s30
7983	108031	0	0.0	397.5	37.8	0.000	0.000	0.050	4.846	411571	54.9	3.810	76	41.6	73.6	20.4	0.077	13537	11264	160m.pg16beta2_o3_native_lto.cx7a28_gcp_c2s30
7983	106942	0	0.0	401.4	37.9	0.000	0.000	0.050	4.864	407635	54.8	3.812	77	41.4	73.5	28.4	0.089	13297	11140	160m.pg16beta3_o3_native_lto.cx7a28_gcp_c2s30
7984	107715	0	0.0	402.4	37.5	0.000	0.000	0.050	4.814	410868	54.9	3.814	76	41.5	73.6	4.0	0.074	13601	11332	160m.pg16rc1_o3_native_lto.cx7a28_gcp_c2s30
7983	107079	0	0.0	394.1	37.6	0.000	0.000	0.049	4.823	408143	55.1	3.812	77	41.5	73.6	3.3	0.062	13393	11268	160m.pg160_o3_native_lto.cx7a28_gcp_c2s30
l.i0
- l.i0: load without secondary indexes
- Legend for results is here.
- Each entry lists the percentage of responses that fit in that bucket (slower than max time for previous bucket, faster than min time for next bucket).
Insert response time histogram
256us	1ms	4ms	16ms	64ms	256ms	1s	4s	16s	gt	max	tag
0.000	97.519	2.424	0.044	0.003	0.009	0.002	0.000	0.000	0.000	0.628	pg152_o3_native_lto.cx7a28_gcp_c2s30
0.000	97.841	2.100	0.047	0.001	0.009	0.002	0.000	0.000	0.000	0.458	pg153_o3_native_lto.cx7a28_gcp_c2s30
0.000	97.642	2.298	0.047	0.003	0.010	0.002	0.000	0.000	0.000	0.372	pg154_o3_native_lto.cx7a28_gcp_c2s30
0.000	97.933	2.009	0.045	0.001	0.009	0.002	0.000	0.000	0.000	0.802	pg16beta1_o3_native_lto.cx7a28_gcp_c2s30
0.000	97.979	1.961	0.046	0.003	0.010	0.002	0.000	0.000	0.000	0.648	pg16beta2_o3_native_lto.cx7a28_gcp_c2s30
0.000	98.063	1.876	0.048	0.003	0.010	0.001	0.000	0.000	0.000	0.339	pg16beta3_o3_native_lto.cx7a28_gcp_c2s30
0.000	98.034	1.908	0.045	0.004	0.008	0.001	0.000	0.000	0.000	0.763	pg16rc1_o3_native_lto.cx7a28_gcp_c2s30
0.000	98.128	1.810	0.052	0.002	0.006	0.001	nonzero	0.000	0.000	1.318	pg160_o3_native_lto.cx7a28_gcp_c2s30
l.x
- l.x: create secondary indexes
- Legend for results is here.
- Each entry lists the percentage of responses that fit in that bucket (slower than max time for previous bucket, faster than min time for next bucket).
TODO - determine whether there is data for create index response time
l.i1
- l.i1: continue load after secondary indexes created
- Legend for results is here.
- Each entry lists the percentage of responses that fit in that bucket (slower than max time for previous bucket, faster than min time for next bucket).
Insert response time histogram
256us	1ms	4ms	16ms	64ms	256ms	1s	4s	16s	gt	max	tag
0.000	0.046	98.890	0.434	0.582	0.048	nonzero	0.000	0.000	0.000	0.312	pg152_o3_native_lto.cx7a28_gcp_c2s30
0.000	0.012	98.924	0.445	0.567	0.051	nonzero	0.000	0.000	0.000	0.368	pg153_o3_native_lto.cx7a28_gcp_c2s30
0.000	0.041	98.879	0.440	0.591	0.049	0.001	0.000	0.000	0.000	0.459	pg154_o3_native_lto.cx7a28_gcp_c2s30
0.000	0.401	98.588	0.415	0.548	0.048	nonzero	0.000	0.000	0.000	0.322	pg16beta1_o3_native_lto.cx7a28_gcp_c2s30
0.000	0.078	98.883	0.431	0.555	0.053	0.001	nonzero	0.000	0.000	1.334	pg16beta2_o3_native_lto.cx7a28_gcp_c2s30
0.000	0.207	98.725	0.433	0.586	0.049	0.000	0.000	0.000	0.000	0.204	pg16beta3_o3_native_lto.cx7a28_gcp_c2s30
0.000	0.273	98.683	0.426	0.570	0.048	nonzero	0.000	0.000	0.000	0.359	pg16rc1_o3_native_lto.cx7a28_gcp_c2s30
0.000	0.059	98.882	0.425	0.582	0.052	nonzero	0.000	0.000	0.000	0.356	pg160_o3_native_lto.cx7a28_gcp_c2s30
Delete response time histogram
256us	1ms	4ms	16ms	64ms	256ms	1s	4s	16s	gt	max	tag
75.908	9.840	10.057	3.824	0.339	0.032	nonzero	0.000	0.000	0.000	0.313	pg152_o3_native_lto.cx7a28_gcp_c2s30
76.122	9.513	9.873	4.132	0.327	0.034	nonzero	0.000	0.000	0.000	0.366	pg153_o3_native_lto.cx7a28_gcp_c2s30
76.672	8.951	9.675	4.311	0.355	0.034	nonzero	0.000	0.000	0.000	0.448	pg154_o3_native_lto.cx7a28_gcp_c2s30
76.149	9.618	10.206	3.664	0.329	0.033	nonzero	0.000	0.000	0.000	0.321	pg16beta1_o3_native_lto.cx7a28_gcp_c2s30
76.001	9.536	9.408	4.674	0.343	0.038	nonzero	nonzero	0.000	0.000	1.338	pg16beta2_o3_native_lto.cx7a28_gcp_c2s30
75.287	9.990	10.064	4.268	0.357	0.035	0.000	0.000	0.000	0.000	0.165	pg16beta3_o3_native_lto.cx7a28_gcp_c2s30
76.193	9.252	9.990	4.184	0.349	0.034	nonzero	0.000	0.000	0.000	0.342	pg16rc1_o3_native_lto.cx7a28_gcp_c2s30
76.462	9.020	9.860	4.264	0.358	0.036	nonzero	0.000	0.000	0.000	0.306	pg160_o3_native_lto.cx7a28_gcp_c2s30
q100.1
- q100.1: range queries with 100 insert/s per client
- Legend for results is here.
- Each entry lists the percentage of responses that fit in that bucket (slower than max time for previous bucket, faster than min time for next bucket).
Query response time histogram
256us	1ms	4ms	16ms	64ms	256ms	1s	4s	16s	gt	max	tag
99.996	0.003	0.001	nonzero	0.000	0.000	0.000	0.000	0.000	0.000	0.010	pg152_o3_native_lto.cx7a28_gcp_c2s30
99.996	0.003	0.001	nonzero	0.000	0.000	0.000	0.000	0.000	0.000	0.008	pg153_o3_native_lto.cx7a28_gcp_c2s30
99.996	0.003	0.001	nonzero	0.000	0.000	0.000	0.000	0.000	0.000	0.007	pg154_o3_native_lto.cx7a28_gcp_c2s30
99.996	0.003	0.001	nonzero	0.000	0.000	0.000	0.000	0.000	0.000	0.010	pg16beta1_o3_native_lto.cx7a28_gcp_c2s30
99.996	0.003	0.001	nonzero	0.000	0.000	0.000	0.000	0.000	0.000	0.009	pg16beta2_o3_native_lto.cx7a28_gcp_c2s30
99.996	0.003	0.001	nonzero	0.000	0.000	0.000	0.000	0.000	0.000	0.008	pg16beta3_o3_native_lto.cx7a28_gcp_c2s30
99.997	0.003	0.001	nonzero	0.000	0.000	0.000	0.000	0.000	0.000	0.009	pg16rc1_o3_native_lto.cx7a28_gcp_c2s30
99.996	0.003	0.001	nonzero	0.000	0.000	0.000	0.000	0.000	0.000	0.008	pg160_o3_native_lto.cx7a28_gcp_c2s30
Insert response time histogram
256us	1ms	4ms	16ms	64ms	256ms	1s	4s	16s	gt	max	tag
0.000	0.000	99.944	0.056	0.000	0.000	0.000	0.000	0.000	0.000	0.008	pg152_o3_native_lto.cx7a28_gcp_c2s30
0.000	0.000	99.931	0.069	0.000	0.000	0.000	0.000	0.000	0.000	0.010	pg153_o3_native_lto.cx7a28_gcp_c2s30
0.000	0.000	99.938	0.062	0.000	0.000	0.000	0.000	0.000	0.000	0.007	pg154_o3_native_lto.cx7a28_gcp_c2s30
0.000	0.000	99.969	0.031	0.000	0.000	0.000	0.000	0.000	0.000	0.006	pg16beta1_o3_native_lto.cx7a28_gcp_c2s30
0.000	0.000	99.947	0.053	0.000	0.000	0.000	0.000	0.000	0.000	0.012	pg16beta2_o3_native_lto.cx7a28_gcp_c2s30
0.000	0.000	99.955	0.045	0.000	0.000	0.000	0.000	0.000	0.000	0.009	pg16beta3_o3_native_lto.cx7a28_gcp_c2s30
0.000	0.000	99.953	0.047	0.000	0.000	0.000	0.000	0.000	0.000	0.009	pg16rc1_o3_native_lto.cx7a28_gcp_c2s30
0.000	0.000	99.959	0.041	0.000	0.000	0.000	0.000	0.000	0.000	0.008	pg160_o3_native_lto.cx7a28_gcp_c2s30
Delete response time histogram
256us	1ms	4ms	16ms	64ms	256ms	1s	4s	16s	gt	max	tag
68.910	11.161	17.227	2.701	0.000	0.000	0.000	0.000	0.000	0.000	0.011	pg152_o3_native_lto.cx7a28_gcp_c2s30
68.650	12.943	16.378	2.030	0.000	0.000	0.000	0.000	0.000	0.000	0.010	pg153_o3_native_lto.cx7a28_gcp_c2s30
65.877	13.259	15.831	5.034	0.000	0.000	0.000	0.000	0.000	0.000	0.013	pg154_o3_native_lto.cx7a28_gcp_c2s30
62.528	13.499	18.937	5.036	0.000	0.000	0.000	0.000	0.000	0.000	0.011	pg16beta1_o3_native_lto.cx7a28_gcp_c2s30
65.753	16.042	14.577	3.628	0.000	0.000	0.000	0.000	0.000	0.000	0.008	pg16beta2_o3_native_lto.cx7a28_gcp_c2s30
64.930	12.845	18.634	3.592	0.000	0.000	0.000	0.000	0.000	0.000	0.012	pg16beta3_o3_native_lto.cx7a28_gcp_c2s30
66.127	10.901	19.912	3.060	0.000	0.000	0.000	0.000	0.000	0.000	0.009	pg16rc1_o3_native_lto.cx7a28_gcp_c2s30
73.913	13.093	11.361	1.633	0.000	0.000	0.000	0.000	0.000	0.000	0.008	pg160_o3_native_lto.cx7a28_gcp_c2s30
q500.1
- q500.1: range queries with 500 insert/s per client
- Legend for results is here.
- Each entry lists the percentage of responses that fit in that bucket (slower than max time for previous bucket, faster than min time for next bucket).
Query response time histogram
256us	1ms	4ms	16ms	64ms	256ms	1s	4s	16s	gt	max	tag
99.988	0.008	0.004	nonzero	nonzero	nonzero	0.000	0.000	0.000	0.000	0.071	pg152_o3_native_lto.cx7a28_gcp_c2s30
99.989	0.007	0.004	nonzero	nonzero	nonzero	0.000	0.000	0.000	0.000	0.082	pg153_o3_native_lto.cx7a28_gcp_c2s30
99.989	0.007	0.004	nonzero	nonzero	nonzero	0.000	0.000	0.000	0.000	0.065	pg154_o3_native_lto.cx7a28_gcp_c2s30
99.989	0.008	0.004	nonzero	nonzero	nonzero	0.000	0.000	0.000	0.000	0.077	pg16beta1_o3_native_lto.cx7a28_gcp_c2s30
99.988	0.008	0.004	nonzero	nonzero	0.000	0.000	0.000	0.000	0.000	0.064	pg16beta2_o3_native_lto.cx7a28_gcp_c2s30
99.987	0.009	0.005	nonzero	nonzero	0.000	0.000	0.000	0.000	0.000	0.023	pg16beta3_o3_native_lto.cx7a28_gcp_c2s30
99.986	0.009	0.005	nonzero	nonzero	nonzero	0.000	0.000	0.000	0.000	0.089	pg16rc1_o3_native_lto.cx7a28_gcp_c2s30
99.987	0.008	0.004	nonzero	nonzero	nonzero	0.000	0.000	0.000	0.000	0.073	pg160_o3_native_lto.cx7a28_gcp_c2s30
Insert response time histogram
256us	1ms	4ms	16ms	64ms	256ms	1s	4s	16s	gt	max	tag
0.000	0.000	99.946	0.053	0.001	0.000	0.000	0.000	0.000	0.000	0.017	pg152_o3_native_lto.cx7a28_gcp_c2s30
0.000	0.000	99.969	0.030	nonzero	0.000	0.000	0.000	0.000	0.000	0.025	pg153_o3_native_lto.cx7a28_gcp_c2s30
0.000	0.000	99.965	0.034	0.001	0.000	0.000	0.000	0.000	0.000	0.018	pg154_o3_native_lto.cx7a28_gcp_c2s30
0.000	0.000	99.972	0.027	0.001	0.000	0.000	0.000	0.000	0.000	0.025	pg16beta1_o3_native_lto.cx7a28_gcp_c2s30
0.000	0.000	99.968	0.032	0.001	0.000	0.000	0.000	0.000	0.000	0.017	pg16beta2_o3_native_lto.cx7a28_gcp_c2s30
0.000	0.000	99.952	0.047	0.001	0.000	0.000	0.000	0.000	0.000	0.021	pg16beta3_o3_native_lto.cx7a28_gcp_c2s30
0.000	0.000	99.935	0.064	nonzero	nonzero	0.000	0.000	0.000	0.000	0.085	pg16rc1_o3_native_lto.cx7a28_gcp_c2s30
0.000	0.000	99.953	0.047	0.001	0.000	0.000	0.000	0.000	0.000	0.018	pg160_o3_native_lto.cx7a28_gcp_c2s30
Delete response time histogram
256us	1ms	4ms	16ms	64ms	256ms	1s	4s	16s	gt	max	tag
77.525	10.395	9.728	2.351	0.001	0.000	0.000	0.000	0.000	0.000	0.022	pg152_o3_native_lto.cx7a28_gcp_c2s30
77.627	7.837	12.301	2.234	0.001	0.000	0.000	0.000	0.000	0.000	0.021	pg153_o3_native_lto.cx7a28_gcp_c2s30
78.167	8.274	10.581	2.977	nonzero	0.000	0.000	0.000	0.000	0.000	0.018	pg154_o3_native_lto.cx7a28_gcp_c2s30
77.952	9.448	12.005	0.595	0.000	0.000	0.000	0.000	0.000	0.000	0.016	pg16beta1_o3_native_lto.cx7a28_gcp_c2s30
76.999	9.664	10.063	3.273	nonzero	0.000	0.000	0.000	0.000	0.000	0.018	pg16beta2_o3_native_lto.cx7a28_gcp_c2s30
76.987	11.494	9.597	1.921	0.001	0.000	0.000	0.000	0.000	0.000	0.021	pg16beta3_o3_native_lto.cx7a28_gcp_c2s30
77.790	11.442	8.281	2.486	0.001	nonzero	0.000	0.000	0.000	0.000	0.084	pg16rc1_o3_native_lto.cx7a28_gcp_c2s30
77.230	8.709	6.759	7.301	0.001	0.000	0.000	0.000	0.000	0.000	0.021	pg160_o3_native_lto.cx7a28_gcp_c2s30
q1000.1
- q1000.1: range queries with 1000 insert/s per client
- Legend for results is here.
- Each entry lists the percentage of responses that fit in that bucket (slower than max time for previous bucket, faster than min time for next bucket).
Query response time histogram
256us	1ms	4ms	16ms	64ms	256ms	1s	4s	16s	gt	max	tag
99.958	0.033	0.008	nonzero	nonzero	nonzero	0.000	0.000	0.000	0.000	0.091	pg152_o3_native_lto.cx7a28_gcp_c2s30
99.957	0.033	0.009	nonzero	nonzero	nonzero	0.000	0.000	0.000	0.000	0.070	pg153_o3_native_lto.cx7a28_gcp_c2s30
99.961	0.031	0.008	nonzero	nonzero	nonzero	0.000	0.000	0.000	0.000	0.134	pg154_o3_native_lto.cx7a28_gcp_c2s30
99.949	0.040	0.011	nonzero	nonzero	nonzero	0.000	0.000	0.000	0.000	0.088	pg16beta1_o3_native_lto.cx7a28_gcp_c2s30
99.954	0.035	0.010	nonzero	nonzero	nonzero	0.000	0.000	0.000	0.000	0.077	pg16beta2_o3_native_lto.cx7a28_gcp_c2s30
99.955	0.035	0.010	nonzero	nonzero	nonzero	0.000	0.000	0.000	0.000	0.089	pg16beta3_o3_native_lto.cx7a28_gcp_c2s30
99.961	0.031	0.008	nonzero	nonzero	nonzero	0.000	0.000	0.000	0.000	0.074	pg16rc1_o3_native_lto.cx7a28_gcp_c2s30
99.960	0.031	0.009	nonzero	nonzero	0.000	0.000	0.000	0.000	0.000	0.062	pg160_o3_native_lto.cx7a28_gcp_c2s30
Insert response time histogram
256us	1ms	4ms	16ms	64ms	256ms	1s	4s	16s	gt	max	tag
0.000	0.000	99.761	0.231	0.007	0.001	0.000	0.000	0.000	0.000	0.076	pg152_o3_native_lto.cx7a28_gcp_c2s30
0.000	0.000	99.761	0.232	0.008	0.000	0.000	0.000	0.000	0.000	0.047	pg153_o3_native_lto.cx7a28_gcp_c2s30
0.000	0.000	99.757	0.228	0.013	0.002	0.000	0.000	0.000	0.000	0.133	pg154_o3_native_lto.cx7a28_gcp_c2s30
0.000	0.000	99.676	0.308	0.016	0.000	0.000	0.000	0.000	0.000	0.060	pg16beta1_o3_native_lto.cx7a28_gcp_c2s30
0.000	0.000	99.567	0.418	0.015	nonzero	0.000	0.000	0.000	0.000	0.082	pg16beta2_o3_native_lto.cx7a28_gcp_c2s30
0.000	0.000	99.645	0.344	0.010	0.001	0.000	0.000	0.000	0.000	0.088	pg16beta3_o3_native_lto.cx7a28_gcp_c2s30
0.000	nonzero	99.732	0.256	0.012	0.000	0.000	0.000	0.000	0.000	0.045	pg16rc1_o3_native_lto.cx7a28_gcp_c2s30
0.000	0.000	99.677	0.308	0.015	nonzero	0.000	0.000	0.000	0.000	0.065	pg160_o3_native_lto.cx7a28_gcp_c2s30
Delete response time histogram
256us	1ms	4ms	16ms	64ms	256ms	1s	4s	16s	gt	max	tag
78.606	12.672	7.170	1.550	0.002	nonzero	0.000	0.000	0.000	0.000	0.072	pg152_o3_native_lto.cx7a28_gcp_c2s30
77.808	12.670	8.662	0.858	0.002	0.000	0.000	0.000	0.000	0.000	0.030	pg153_o3_native_lto.cx7a28_gcp_c2s30
77.993	11.100	10.164	0.738	0.004	0.001	0.000	0.000	0.000	0.000	0.126	pg154_o3_native_lto.cx7a28_gcp_c2s30
77.244	14.874	7.684	0.195	0.003	0.000	0.000	0.000	0.000	0.000	0.048	pg16beta1_o3_native_lto.cx7a28_gcp_c2s30
77.072	11.469	9.957	1.499	0.003	nonzero	0.000	0.000	0.000	0.000	0.080	pg16beta2_o3_native_lto.cx7a28_gcp_c2s30
77.736	12.115	8.041	2.104	0.004	nonzero	0.000	0.000	0.000	0.000	0.086	pg16beta3_o3_native_lto.cx7a28_gcp_c2s30
78.453	11.786	8.122	1.634	0.005	0.000	0.000	0.000	0.000	0.000	0.043	pg16rc1_o3_native_lto.cx7a28_gcp_c2s30
77.595	7.949	10.162	4.289	0.005	0.000	0.000	0.000	0.000	0.000	0.035	pg160_o3_native_lto.cx7a28_gcp_c2s30