Introduction
This is a report for the insert benchmark with 20M docs and 1 client(s). It is generated by scripts (bash, awk, sed) and Tufte might not be impressed. An overview of the insert benchmark is here and a short update is here. Below, by DBMS, I mean DBMS+version.config. An example is my8020.c10b40 where my means MySQL, 8020 is version 8.0.20 and c10b40 is the name for the configuration file.
The test server has 8 AMD cores, 16G RAM and an NVMe SSD. It is described here as the Beelink. The benchmark was run with 1 client and there were 1 or 3 connections per client (1 for queries or inserts without rate limits, 1+1 for rate limited inserts+deletes). It uses 1 table. It loads 20M rows per table without secondary indexes, creates secondary indexes, then inserts 300M rows per table with a delete per insert to avoid growing the table. It then does 3 read+write tests for 7200s each that do queries as fast as possible with 100, 500 and then 1000 inserts/second/client concurrent with the queries and 1000 deletes/second to avoid growing the table. The database is cached by Postgres. Clients and the DBMS share one server. The per-database configs are in the per-database subdirectories here.
The tested DBMS are:
- pg152_o3_native_lto.cx9a1_bee - Postgres 15.3, o3_native_lto build that used -O3 -march/-mtune=native, -flto, a1 config
- pg153_o3_native_lto.cx9a1_bee - Postgres 15.3, o3_native_lto build that used -O3 -march/-mtune=native, -flto, a1 config
- pg154_o3_native_lto.cx9a1_bee - Postgres 15.4, o3_native_lto build that used -O3 -march/-mtune=native, -flto, a1 config
- pg16beta1_o3_native_lto.cx9a1_bee - Postgres 16 beta1, o3_native_lto build that used -O3 -march/-mtune=native, -flto, a1 config
- pg16beta2_o3_native_lto.cx9a1_bee - Postgres 16 beta2, o3_native_lto build that used -O3 -march/-mtune=native, -flto, a1 config
- pg16beta3_o3_native_lto.cx9a1_bee - Postgres 16 beta3, o3_native_lto build that used -O3 -march/-mtune=native, -flto, a1 config
- pg16rc1_o3_native_lto.cx9a1_bee - Postgres 16 rc1, o3_native_lto build that used -O3 -march/-mtune=native, -flto, a1 config
- pg160_o3_native_lto.cx9a1_bee - Postgres 16.0, o3_native_lto build that used -O3 -march/-mtune=native, -flto, a1 config
Contents
- Summary
- l.i0: load without secondary indexes
- l.x: create secondary indexes
- l.i1: continue load after secondary indexes created
- q100.1: range queries with 100 insert/s per client
- q500.1: range queries with 500 insert/s per client
- q1000.1: range queries with 1000 insert/s per client
Summary
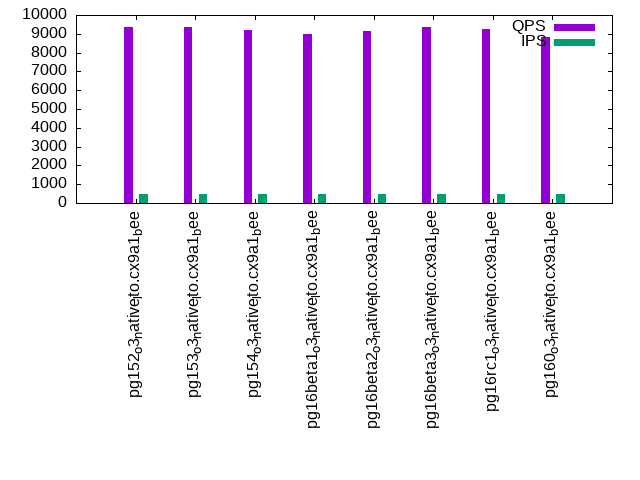
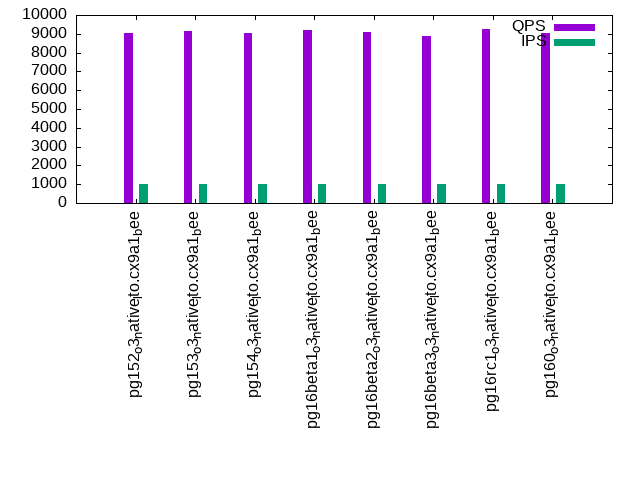
The numbers are inserts/s for l.i0 and l.i1, indexed docs (or rows) /s for l.x and queries/s for q*.2. The values are the average rate over the entire test for inserts (IPS) and queries (QPS). The range of values for IPS and QPS is split into 3 parts: bottom 25%, middle 50%, top 25%. Values in the bottom 25% have a red background, values in the top 25% have a green background and values in the middle have no color. A gray background is used for values that can be ignored because the DBMS did not sustain the target insert rate. Red backgrounds are not used when the minimum value is within 80% of the max value.
| dbms | l.i0 | l.x | l.i1 | q100.1 | q500.1 | q1000.1 |
|---|---|---|---|---|---|---|
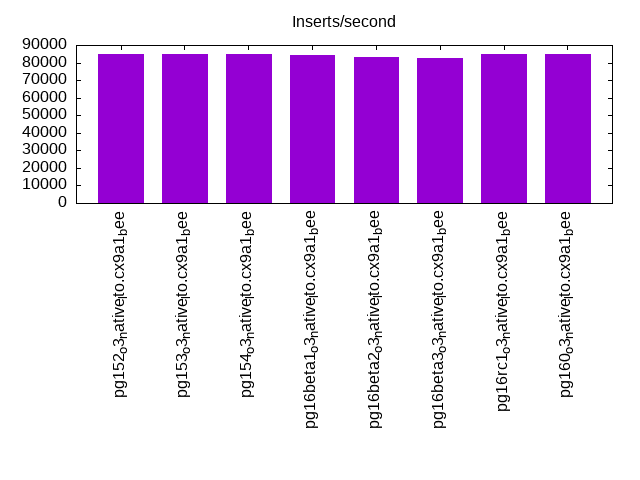
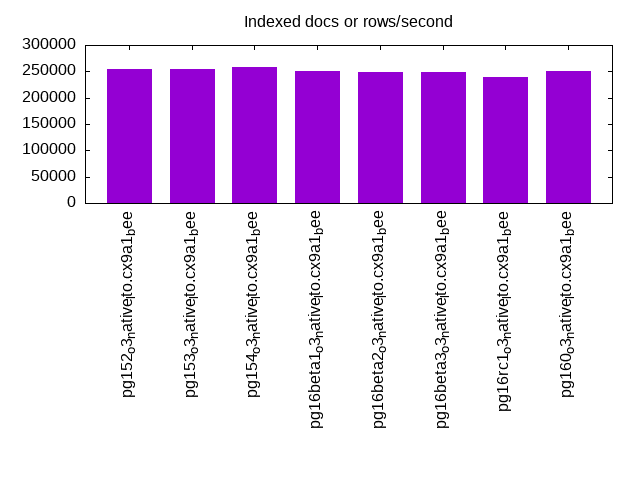
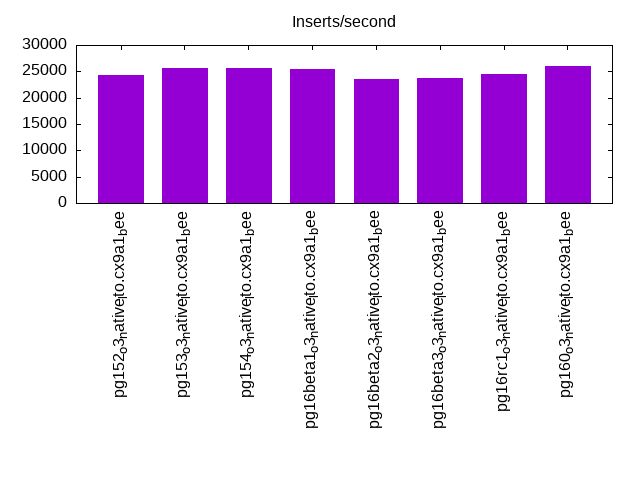
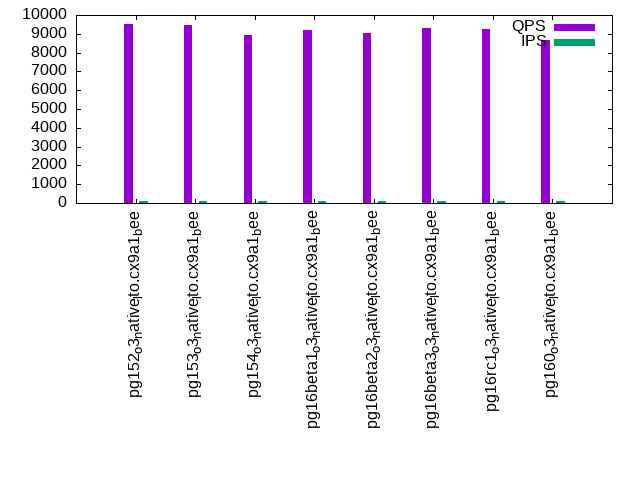
| pg152_o3_native_lto.cx9a1_bee | 85106 | 254430 | 24351 | 9508 | 9385 | 9027 |
| pg153_o3_native_lto.cx9a1_bee | 84746 | 254430 | 25612 | 9453 | 9375 | 9137 |
| pg154_o3_native_lto.cx9a1_bee | 85106 | 257692 | 25621 | 8914 | 9216 | 9017 |
| pg16beta1_o3_native_lto.cx9a1_bee | 84388 | 251250 | 25517 | 9213 | 8973 | 9194 |
| pg16beta2_o3_native_lto.cx9a1_bee | 83333 | 248148 | 23520 | 9016 | 9146 | 9075 |
| pg16beta3_o3_native_lto.cx9a1_bee | 82645 | 248148 | 23672 | 9288 | 9347 | 8879 |
| pg16rc1_o3_native_lto.cx9a1_bee | 84746 | 239286 | 24466 | 9260 | 9239 | 9242 |
| pg160_o3_native_lto.cx9a1_bee | 84746 | 251250 | 25931 | 8694 | 8844 | 9026 |
This table has relative throughput, throughput for the DBMS relative to the DBMS in the first line, using the absolute throughput from the previous table. Values less than 0.95 have a yellow background. Values greater than 1.05 have a blue background.
| dbms | l.i0 | l.x | l.i1 | q100.1 | q500.1 | q1000.1 |
|---|---|---|---|---|---|---|
| pg152_o3_native_lto.cx9a1_bee | 1.00 | 1.00 | 1.00 | 1.00 | 1.00 | 1.00 |
| pg153_o3_native_lto.cx9a1_bee | 1.00 | 1.00 | 1.05 | 0.99 | 1.00 | 1.01 |
| pg154_o3_native_lto.cx9a1_bee | 1.00 | 1.01 | 1.05 | 0.94 | 0.98 | 1.00 |
| pg16beta1_o3_native_lto.cx9a1_bee | 0.99 | 0.99 | 1.05 | 0.97 | 0.96 | 1.02 |
| pg16beta2_o3_native_lto.cx9a1_bee | 0.98 | 0.98 | 0.97 | 0.95 | 0.97 | 1.01 |
| pg16beta3_o3_native_lto.cx9a1_bee | 0.97 | 0.98 | 0.97 | 0.98 | 1.00 | 0.98 |
| pg16rc1_o3_native_lto.cx9a1_bee | 1.00 | 0.94 | 1.00 | 0.97 | 0.98 | 1.02 |
| pg160_o3_native_lto.cx9a1_bee | 1.00 | 0.99 | 1.06 | 0.91 | 0.94 | 1.00 |
This lists the average rate of inserts/s for the tests that do inserts concurrent with queries. For such tests the query rate is listed in the table above. The read+write tests are setup so that the insert rate should match the target rate every second. Cells that are not at least 95% of the target have a red background to indicate a failure to satisfy the target.
| dbms | q100.1 | q500.1 | q1000.1 |
|---|---|---|---|
| pg152_o3_native_lto.cx9a1_bee | 100 | 499 | 998 |
| pg153_o3_native_lto.cx9a1_bee | 100 | 499 | 998 |
| pg154_o3_native_lto.cx9a1_bee | 100 | 499 | 997 |
| pg16beta1_o3_native_lto.cx9a1_bee | 100 | 499 | 997 |
| pg16beta2_o3_native_lto.cx9a1_bee | 100 | 499 | 998 |
| pg16beta3_o3_native_lto.cx9a1_bee | 100 | 499 | 998 |
| pg16rc1_o3_native_lto.cx9a1_bee | 100 | 499 | 998 |
| pg160_o3_native_lto.cx9a1_bee | 100 | 499 | 998 |
| target | 100 | 500 | 1000 |
l.i0
l.i0: load without secondary indexes. Graphs for performance per 1-second interval are here.
Average throughput:
Insert response time histogram: each cell has the percentage of responses that take <= the time in the header and max is the max response time in seconds. For the max column values in the top 25% of the range have a red background and in the bottom 25% of the range have a green background. The red background is not used when the min value is within 80% of the max value.
| dbms | 256us | 1ms | 4ms | 16ms | 64ms | 256ms | 1s | 4s | 16s | gt | max |
|---|---|---|---|---|---|---|---|---|---|---|---|
| pg152_o3_native_lto.cx9a1_bee | 0.006 | 99.993 | 0.003 | ||||||||
| pg153_o3_native_lto.cx9a1_bee | 0.002 | 99.999 | 0.003 | ||||||||
| pg154_o3_native_lto.cx9a1_bee | 0.017 | 99.982 | 0.001 | 0.005 | |||||||
| pg16beta1_o3_native_lto.cx9a1_bee | 0.004 | 99.996 | 0.001 | 0.006 | |||||||
| pg16beta2_o3_native_lto.cx9a1_bee | 99.999 | 0.001 | 0.009 | ||||||||
| pg16beta3_o3_native_lto.cx9a1_bee | 99.999 | 0.001 | 0.010 | ||||||||
| pg16rc1_o3_native_lto.cx9a1_bee | 0.006 | 99.994 | 0.001 | 0.006 | |||||||
| pg160_o3_native_lto.cx9a1_bee | 0.003 | 99.996 | 0.003 |
Performance metrics for the DBMS listed above. Some are normalized by throughput, others are not. Legend for results is here.
ips	qps	rps	rmbps	wps	wmbps	rpq	rkbpq	wpi	wkbpi	csps	cpups	cspq	cpupq	dbgb1	dbgb2	rss	maxop	p50	p99	tag
85106	0	0	0.0	98.0	36.2	0.000	0.000	0.001	0.435	10243	22.7	0.120	21	1.9	5.2	0.2	0.003	85409	81900	20m.pg152_o3_native_lto.cx9a1_bee
84746	0	0	0.0	98.6	36.0	0.000	0.000	0.001	0.435	10214	23.0	0.121	22	1.9	5.2	0.3	0.003	85007	81182	20m.pg153_o3_native_lto.cx9a1_bee
85106	0	0	0.0	99.6	36.1	0.000	0.000	0.001	0.434	10262	22.4	0.121	21	1.9	5.2	2.0	0.005	85307	82206	20m.pg154_o3_native_lto.cx9a1_bee
84388	0	0	0.0	100.1	36.1	0.000	0.000	0.001	0.438	10260	22.5	0.122	21	1.9	5.2	2.0	0.006	85152	73991	20m.pg16beta1_o3_native_lto.cx9a1_bee
83333	0	0	0.0	98.2	35.3	0.000	0.000	0.001	0.433	10115	23.3	0.121	22	1.9	5.2	0.2	0.009	83509	80001	20m.pg16beta2_o3_native_lto.cx9a1_bee
82645	0	0	0.0	97.7	35.1	0.000	0.000	0.001	0.434	10049	23.0	0.122	22	1.9	5.2	1.9	0.010	83007	80108	20m.pg16beta3_o3_native_lto.cx9a1_bee
84746	0	0	0.0	97.5	36.0	0.000	0.000	0.001	0.435	10221	22.4	0.121	21	1.9	5.2	0.2	0.006	84977	81272	20m.pg16rc1_o3_native_lto.cx9a1_bee
84746	0	0	0.0	97.6	36.0	0.000	0.000	0.001	0.435	10245	22.3	0.121	21	1.9	5.2	0.3	0.003	85207	82305	20m.pg160_o3_native_lto.cx9a1_bee
l.x
l.x: create secondary indexes.
Average throughput:
Performance metrics for the DBMS listed above. Some are normalized by throughput, others are not. Legend for results is here.
ips	qps	rps	rmbps	wps	wmbps	rpq	rkbpq	wpi	wkbpi	csps	cpups	cspq	cpupq	dbgb1	dbgb2	rss	maxop	p50	p99	tag
254430	0	0	0.0	78.2	36.6	0.000	0.000	0.000	0.147	722	12.2	0.003	4	3.7	8.0	2.1	0.003	NA	NA	20m.pg152_o3_native_lto.cx9a1_bee
254430	0	0	0.0	80.0	37.2	0.000	0.000	0.000	0.150	688	12.1	0.003	4	3.7	8.0	2.1	0.003	NA	NA	20m.pg153_o3_native_lto.cx9a1_bee
257692	0	0	0.0	81.0	37.7	0.000	0.000	0.000	0.150	836	12.1	0.003	4	3.7	8.0	2.1	0.003	NA	NA	20m.pg154_o3_native_lto.cx9a1_bee
251250	0	0	0.0	125.4	58.5	0.000	0.000	0.000	0.238	780	12.2	0.003	4	3.7	8.0	2.1	0.003	NA	NA	20m.pg16beta1_o3_native_lto.cx9a1_bee
248148	0	0	0.0	90.7	41.9	0.000	0.000	0.000	0.173	670	12.3	0.003	4	3.7	8.0	2.1	0.003	NA	NA	20m.pg16beta2_o3_native_lto.cx9a1_bee
248148	0	0	0.0	91.7	42.2	0.000	0.000	0.000	0.174	680	12.3	0.003	4	3.7	8.0	2.1	0.003	NA	NA	20m.pg16beta3_o3_native_lto.cx9a1_bee
239286	0	0	0.0	75.7	35.3	0.000	0.000	0.000	0.151	790	12.2	0.003	4	3.7	8.0	2.1	0.003	NA	NA	20m.pg16rc1_o3_native_lto.cx9a1_bee
251250	0	0	0.0	119.7	56.9	0.000	0.000	0.000	0.232	797	12.2	0.003	4	3.7	8.0	2.1	0.003	NA	NA	20m.pg160_o3_native_lto.cx9a1_bee
l.i1
l.i1: continue load after secondary indexes created. Graphs for performance per 1-second interval are here.
Average throughput:
Insert response time histogram: each cell has the percentage of responses that take <= the time in the header and max is the max response time in seconds. For the max column values in the top 25% of the range have a red background and in the bottom 25% of the range have a green background. The red background is not used when the min value is within 80% of the max value.
| dbms | 256us | 1ms | 4ms | 16ms | 64ms | 256ms | 1s | 4s | 16s | gt | max |
|---|---|---|---|---|---|---|---|---|---|---|---|
| pg152_o3_native_lto.cx9a1_bee | 99.991 | 0.009 | nonzero | 0.024 | |||||||
| pg153_o3_native_lto.cx9a1_bee | 99.996 | 0.004 | nonzero | 0.050 | |||||||
| pg154_o3_native_lto.cx9a1_bee | 99.996 | 0.004 | nonzero | 0.028 | |||||||
| pg16beta1_o3_native_lto.cx9a1_bee | 99.996 | 0.004 | nonzero | 0.022 | |||||||
| pg16beta2_o3_native_lto.cx9a1_bee | 99.994 | 0.006 | nonzero | 0.021 | |||||||
| pg16beta3_o3_native_lto.cx9a1_bee | 99.996 | 0.004 | nonzero | 0.020 | |||||||
| pg16rc1_o3_native_lto.cx9a1_bee | 99.985 | 0.015 | nonzero | 0.054 | |||||||
| pg160_o3_native_lto.cx9a1_bee | 99.996 | 0.004 | nonzero | 0.059 |
Delete response time histogram: each cell has the percentage of responses that take <= the time in the header and max is the max response time in seconds. For the max column values in the top 25% of the range have a red background and in the bottom 25% of the range have a green background. The red background is not used when the min value is within 80% of the max value.
| dbms | 256us | 1ms | 4ms | 16ms | 64ms | 256ms | 1s | 4s | 16s | gt | max |
|---|---|---|---|---|---|---|---|---|---|---|---|
| pg152_o3_native_lto.cx9a1_bee | 0.545 | 83.724 | 2.462 | 13.270 | nonzero | 0.022 | |||||
| pg153_o3_native_lto.cx9a1_bee | 0.548 | 83.507 | 8.790 | 7.155 | nonzero | 0.049 | |||||
| pg154_o3_native_lto.cx9a1_bee | 0.466 | 83.473 | 9.143 | 6.917 | nonzero | 0.035 | |||||
| pg16beta1_o3_native_lto.cx9a1_bee | 0.576 | 83.321 | 8.196 | 7.906 | nonzero | 0.020 | |||||
| pg16beta2_o3_native_lto.cx9a1_bee | 0.511 | 83.613 | 2.079 | 13.798 | nonzero | 0.020 | |||||
| pg16beta3_o3_native_lto.cx9a1_bee | 0.495 | 83.794 | 1.970 | 13.741 | nonzero | 0.018 | |||||
| pg16rc1_o3_native_lto.cx9a1_bee | 0.510 | 83.856 | 3.618 | 12.016 | nonzero | 0.019 | |||||
| pg160_o3_native_lto.cx9a1_bee | 0.456 | 83.703 | 9.207 | 6.634 | nonzero | 0.023 |
Performance metrics for the DBMS listed above. Some are normalized by throughput, others are not. Legend for results is here.
ips	qps	rps	rmbps	wps	wmbps	rpq	rkbpq	wpi	wkbpi	csps	cpups	cspq	cpupq	dbgb1	dbgb2	rss	maxop	p50	p99	tag
24351	0	0	0.0	67.0	18.4	0.000	0.000	0.003	0.776	11609	23.3	0.477	77	5.1	45.2	0.0	0.024	32063	8491	20m.pg152_o3_native_lto.cx9a1_bee
25612	0	0	0.0	71.1	19.4	0.000	0.000	0.003	0.776	12232	23.9	0.478	75	5.1	45.2	0.3	0.050	32364	6443	20m.pg153_o3_native_lto.cx9a1_bee
25621	0	0	0.0	71.0	19.4	0.000	0.000	0.003	0.775	12241	23.8	0.478	74	5.1	45.1	5.1	0.028	32564	5644	20m.pg154_o3_native_lto.cx9a1_bee
25517	0	0	0.0	70.7	19.4	0.000	0.000	0.003	0.777	12219	23.9	0.479	75	5.1	45.2	3.8	0.022	32378	6793	20m.pg16beta1_o3_native_lto.cx9a1_bee
23520	0	0	0.0	66.0	17.9	0.000	0.000	0.003	0.779	11258	22.9	0.479	78	5.1	45.2	2.4	0.021	32026	5647	20m.pg16beta2_o3_native_lto.cx9a1_bee
23672	0	0	0.0	66.1	18.0	0.000	0.000	0.003	0.778	11363	23.0	0.480	78	5.1	45.2	4.7	0.020	31966	5744	20m.pg16beta3_o3_native_lto.cx9a1_bee
24466	0	0	0.0	67.1	18.5	0.000	0.000	0.003	0.774	11704	23.2	0.478	76	5.1	45.1	5.1	0.054	32176	4645	20m.pg16rc1_o3_native_lto.cx9a1_bee
25931	0	0	0.0	71.6	19.6	0.000	0.000	0.003	0.775	12398	23.9	0.478	74	5.1	45.1	3.0	0.059	32463	5646	20m.pg160_o3_native_lto.cx9a1_bee
q100.1
q100.1: range queries with 100 insert/s per client. Graphs for performance per 1-second interval are here.
Average throughput:
Query response time histogram: each cell has the percentage of responses that take <= the time in the header and max is the max response time in seconds. For max values in the top 25% of the range have a red background and in the bottom 25% of the range have a green background. The red background is not used when the min value is within 80% of the max value.
| dbms | 256us | 1ms | 4ms | 16ms | 64ms | 256ms | 1s | 4s | 16s | gt | max |
|---|---|---|---|---|---|---|---|---|---|---|---|
| pg152_o3_native_lto.cx9a1_bee | 99.966 | 0.034 | nonzero | 0.004 | |||||||
| pg153_o3_native_lto.cx9a1_bee | 99.970 | 0.030 | nonzero | nonzero | 0.005 | ||||||
| pg154_o3_native_lto.cx9a1_bee | 99.956 | 0.043 | nonzero | nonzero | 0.004 | ||||||
| pg16beta1_o3_native_lto.cx9a1_bee | 99.972 | 0.028 | nonzero | nonzero | 0.005 | ||||||
| pg16beta2_o3_native_lto.cx9a1_bee | 99.951 | 0.048 | nonzero | nonzero | 0.006 | ||||||
| pg16beta3_o3_native_lto.cx9a1_bee | 99.963 | 0.037 | nonzero | nonzero | 0.004 | ||||||
| pg16rc1_o3_native_lto.cx9a1_bee | 99.962 | 0.038 | nonzero | nonzero | 0.005 | ||||||
| pg160_o3_native_lto.cx9a1_bee | 99.966 | 0.034 | nonzero | 0.004 |
Insert response time histogram: each cell has the percentage of responses that take <= the time in the header and max is the max response time in seconds. For max values in the top 25% of the range have a red background and in the bottom 25% of the range have a green background. The red background is not used when the min value is within 80% of the max value.
| dbms | 256us | 1ms | 4ms | 16ms | 64ms | 256ms | 1s | 4s | 16s | gt | max |
|---|---|---|---|---|---|---|---|---|---|---|---|
| pg152_o3_native_lto.cx9a1_bee | 73.528 | 26.472 | 0.006 | ||||||||
| pg153_o3_native_lto.cx9a1_bee | 73.299 | 26.701 | 0.007 | ||||||||
| pg154_o3_native_lto.cx9a1_bee | 73.479 | 26.521 | 0.010 | ||||||||
| pg16beta1_o3_native_lto.cx9a1_bee | 72.667 | 27.333 | 0.008 | ||||||||
| pg16beta2_o3_native_lto.cx9a1_bee | 75.368 | 24.632 | 0.006 | ||||||||
| pg16beta3_o3_native_lto.cx9a1_bee | 73.049 | 26.951 | 0.007 | ||||||||
| pg16rc1_o3_native_lto.cx9a1_bee | 74.333 | 25.667 | 0.006 | ||||||||
| pg160_o3_native_lto.cx9a1_bee | 73.868 | 26.132 | 0.006 |
Delete response time histogram: each cell has the percentage of responses that take <= the time in the header and max is the max response time in seconds. For max values in the top 25% of the range have a red background and in the bottom 25% of the range have a green background. The red background is not used when the min value is within 80% of the max value.
| dbms | 256us | 1ms | 4ms | 16ms | 64ms | 256ms | 1s | 4s | 16s | gt | max |
|---|---|---|---|---|---|---|---|---|---|---|---|
| pg152_o3_native_lto.cx9a1_bee | 0.569 | 71.069 | 0.007 | 28.354 | 0.011 | ||||||
| pg153_o3_native_lto.cx9a1_bee | 0.458 | 75.847 | 0.007 | 23.688 | 0.011 | ||||||
| pg154_o3_native_lto.cx9a1_bee | 1.542 | 69.424 | 4.139 | 24.896 | 0.008 | ||||||
| pg16beta1_o3_native_lto.cx9a1_bee | 0.806 | 68.938 | 12.569 | 17.688 | 0.009 | ||||||
| pg16beta2_o3_native_lto.cx9a1_bee | 2.924 | 70.083 | 0.076 | 26.917 | 0.011 | ||||||
| pg16beta3_o3_native_lto.cx9a1_bee | 1.222 | 81.382 | 0.021 | 17.375 | 0.011 | ||||||
| pg16rc1_o3_native_lto.cx9a1_bee | 0.583 | 71.819 | 6.326 | 21.271 | 0.009 | ||||||
| pg160_o3_native_lto.cx9a1_bee | 0.889 | 80.958 | 18.153 | 0.003 |
Performance metrics for the DBMS listed above. Some are normalized by throughput, others are not. Legend for results is here.
ips	qps	rps	rmbps	wps	wmbps	rpq	rkbpq	wpi	wkbpi	csps	cpups	cspq	cpupq	dbgb1	dbgb2	rss	maxop	p50	p99	tag
100	9508	0	0.0	53.3	1.9	0.000	0.000	0.535	19.502	36600	12.8	3.849	108	5.1	43.4	1.5	0.004	8898	8502	20m.pg152_o3_native_lto.cx9a1_bee
100	9453	0	0.0	52.6	1.9	0.000	0.000	0.527	19.483	36361	12.9	3.846	109	5.1	43.4	3.4	0.005	8965	8420	20m.pg153_o3_native_lto.cx9a1_bee
100	8914	0	0.0	52.8	1.9	0.000	0.000	0.530	19.338	34329	13.1	3.851	118	5.1	43.3	3.4	0.004	8645	8469	20m.pg154_o3_native_lto.cx9a1_bee
100	9213	0	0.0	53.2	1.9	0.000	0.000	0.533	19.490	35496	12.9	3.853	112	5.1	43.4	3.5	0.005	8738	8514	20m.pg16beta1_o3_native_lto.cx9a1_bee
100	9016	0	0.0	52.0	1.9	0.000	0.000	0.522	19.890	34699	13.0	3.849	115	5.1	43.4	3.4	0.006	8651	8455	20m.pg16beta2_o3_native_lto.cx9a1_bee
100	9288	0	0.0	52.2	1.9	0.000	0.000	0.524	19.800	35752	12.8	3.849	110	5.1	43.3	3.5	0.004	8694	8366	20m.pg16beta3_o3_native_lto.cx9a1_bee
100	9260	0	0.0	53.1	1.9	0.000	0.000	0.532	19.481	35630	13.2	3.848	114	5.1	43.3	3.4	0.005	8726	8520	20m.pg16rc1_o3_native_lto.cx9a1_bee
100	8694	0	0.0	53.0	1.9	0.000	0.000	0.531	19.432	33484	13.2	3.851	121	5.1	43.3	3.4	0.004	8597	8434	20m.pg160_o3_native_lto.cx9a1_bee
q500.1
q500.1: range queries with 500 insert/s per client. Graphs for performance per 1-second interval are here.
Average throughput:
Query response time histogram: each cell has the percentage of responses that take <= the time in the header and max is the max response time in seconds. For max values in the top 25% of the range have a red background and in the bottom 25% of the range have a green background. The red background is not used when the min value is within 80% of the max value.
| dbms | 256us | 1ms | 4ms | 16ms | 64ms | 256ms | 1s | 4s | 16s | gt | max |
|---|---|---|---|---|---|---|---|---|---|---|---|
| pg152_o3_native_lto.cx9a1_bee | 99.969 | 0.031 | nonzero | nonzero | 0.013 | ||||||
| pg153_o3_native_lto.cx9a1_bee | 99.968 | 0.032 | nonzero | nonzero | 0.006 | ||||||
| pg154_o3_native_lto.cx9a1_bee | 99.970 | 0.030 | nonzero | nonzero | nonzero | 0.030 | |||||
| pg16beta1_o3_native_lto.cx9a1_bee | 99.970 | 0.030 | nonzero | nonzero | 0.004 | ||||||
| pg16beta2_o3_native_lto.cx9a1_bee | 99.966 | 0.034 | nonzero | nonzero | 0.011 | ||||||
| pg16beta3_o3_native_lto.cx9a1_bee | 99.971 | 0.029 | nonzero | nonzero | 0.004 | ||||||
| pg16rc1_o3_native_lto.cx9a1_bee | 99.966 | 0.033 | nonzero | 0.003 | |||||||
| pg160_o3_native_lto.cx9a1_bee | 99.961 | 0.039 | nonzero | nonzero | nonzero | 0.017 |
Insert response time histogram: each cell has the percentage of responses that take <= the time in the header and max is the max response time in seconds. For max values in the top 25% of the range have a red background and in the bottom 25% of the range have a green background. The red background is not used when the min value is within 80% of the max value.
| dbms | 256us | 1ms | 4ms | 16ms | 64ms | 256ms | 1s | 4s | 16s | gt | max |
|---|---|---|---|---|---|---|---|---|---|---|---|
| pg152_o3_native_lto.cx9a1_bee | 94.783 | 5.217 | 0.008 | ||||||||
| pg153_o3_native_lto.cx9a1_bee | 94.508 | 5.489 | 0.003 | 0.033 | |||||||
| pg154_o3_native_lto.cx9a1_bee | 95.233 | 4.767 | 0.008 | ||||||||
| pg16beta1_o3_native_lto.cx9a1_bee | 94.276 | 5.724 | 0.010 | ||||||||
| pg16beta2_o3_native_lto.cx9a1_bee | 94.399 | 5.601 | 0.006 | ||||||||
| pg16beta3_o3_native_lto.cx9a1_bee | 94.557 | 5.443 | 0.010 | ||||||||
| pg16rc1_o3_native_lto.cx9a1_bee | 94.888 | 5.110 | 0.003 | 0.024 | |||||||
| pg160_o3_native_lto.cx9a1_bee | 94.839 | 5.161 | 0.014 |
Delete response time histogram: each cell has the percentage of responses that take <= the time in the header and max is the max response time in seconds. For max values in the top 25% of the range have a red background and in the bottom 25% of the range have a green background. The red background is not used when the min value is within 80% of the max value.
| dbms | 256us | 1ms | 4ms | 16ms | 64ms | 256ms | 1s | 4s | 16s | gt | max |
|---|---|---|---|---|---|---|---|---|---|---|---|
| pg152_o3_native_lto.cx9a1_bee | 7.828 | 75.985 | 0.106 | 16.082 | 0.011 | ||||||
| pg153_o3_native_lto.cx9a1_bee | 7.928 | 74.118 | 0.106 | 17.846 | 0.003 | 0.031 | |||||
| pg154_o3_native_lto.cx9a1_bee | 5.857 | 78.556 | 15.581 | 0.007 | 0.005 | ||||||
| pg16beta1_o3_native_lto.cx9a1_bee | 7.225 | 72.060 | 17.464 | 3.251 | 0.007 | ||||||
| pg16beta2_o3_native_lto.cx9a1_bee | 6.919 | 72.693 | 5.989 | 14.399 | 0.009 | ||||||
| pg16beta3_o3_native_lto.cx9a1_bee | 6.875 | 74.815 | 8.912 | 9.356 | 0.042 | 0.027 | |||||
| pg16rc1_o3_native_lto.cx9a1_bee | 6.553 | 72.272 | 15.135 | 6.039 | 0.001 | 0.020 | |||||
| pg160_o3_native_lto.cx9a1_bee | 5.907 | 79.561 | 14.532 | 0.004 |
Performance metrics for the DBMS listed above. Some are normalized by throughput, others are not. Legend for results is here.
ips	qps	rps	rmbps	wps	wmbps	rpq	rkbpq	wpi	wkbpi	csps	cpups	cspq	cpupq	dbgb1	dbgb2	rss	maxop	p50	p99	tag
499	9385	0	0.0	30.8	2.6	0.000	0.000	0.062	5.324	36222	13.1	3.860	112	5.1	38.1	4.4	0.013	8771	8499	20m.pg152_o3_native_lto.cx9a1_bee
499	9375	0	0.0	31.6	2.6	0.000	0.000	0.063	5.305	36184	13.1	3.860	112	5.1	38.1	1.8	0.006	8744	8464	20m.pg153_o3_native_lto.cx9a1_bee
499	9216	0	0.0	31.0	2.6	0.000	0.000	0.062	5.315	35603	13.0	3.863	113	5.1	37.9	2.7	0.030	8630	8420	20m.pg154_o3_native_lto.cx9a1_bee
499	8973	0	0.0	32.7	2.6	0.000	0.000	0.066	5.299	34672	13.3	3.864	119	5.1	38.0	1.9	0.004	8680	8496	20m.pg16beta1_o3_native_lto.cx9a1_bee
499	9146	0	0.0	29.2	2.6	0.000	0.000	0.059	5.345	35336	13.1	3.863	115	5.1	38.2	1.9	0.011	8685	8486	20m.pg16beta2_o3_native_lto.cx9a1_bee
499	9347	0	0.0	28.8	2.6	0.000	0.000	0.058	5.349	36074	13.0	3.859	111	5.1	38.0	5.2	0.004	8720	8358	20m.pg16beta3_o3_native_lto.cx9a1_bee
499	9239	0	0.0	30.9	2.6	0.000	0.000	0.062	5.317	35673	13.3	3.861	115	5.1	38.0	5.2	0.003	8712	8502	20m.pg16rc1_o3_native_lto.cx9a1_bee
499	8844	0	0.0	31.1	2.6	0.000	0.000	0.062	5.323	34166	13.2	3.863	119	5.1	38.1	5.1	0.017	8519	8356	20m.pg160_o3_native_lto.cx9a1_bee
q1000.1
q1000.1: range queries with 1000 insert/s per client. Graphs for performance per 1-second interval are here.
Average throughput:
Query response time histogram: each cell has the percentage of responses that take <= the time in the header and max is the max response time in seconds. For max values in the top 25% of the range have a red background and in the bottom 25% of the range have a green background. The red background is not used when the min value is within 80% of the max value.
| dbms | 256us | 1ms | 4ms | 16ms | 64ms | 256ms | 1s | 4s | 16s | gt | max |
|---|---|---|---|---|---|---|---|---|---|---|---|
| pg152_o3_native_lto.cx9a1_bee | 99.965 | 0.035 | nonzero | nonzero | 0.009 | ||||||
| pg153_o3_native_lto.cx9a1_bee | 99.961 | 0.038 | nonzero | nonzero | 0.004 | ||||||
| pg154_o3_native_lto.cx9a1_bee | 99.962 | 0.038 | nonzero | nonzero | nonzero | 0.017 | |||||
| pg16beta1_o3_native_lto.cx9a1_bee | 99.966 | 0.034 | nonzero | 0.003 | |||||||
| pg16beta2_o3_native_lto.cx9a1_bee | 99.966 | 0.034 | nonzero | nonzero | 0.005 | ||||||
| pg16beta3_o3_native_lto.cx9a1_bee | 99.961 | 0.039 | nonzero | nonzero | nonzero | 0.016 | |||||
| pg16rc1_o3_native_lto.cx9a1_bee | 99.963 | 0.036 | nonzero | nonzero | 0.015 | ||||||
| pg160_o3_native_lto.cx9a1_bee | 99.963 | 0.037 | nonzero | nonzero | nonzero | 0.042 |
Insert response time histogram: each cell has the percentage of responses that take <= the time in the header and max is the max response time in seconds. For max values in the top 25% of the range have a red background and in the bottom 25% of the range have a green background. The red background is not used when the min value is within 80% of the max value.
| dbms | 256us | 1ms | 4ms | 16ms | 64ms | 256ms | 1s | 4s | 16s | gt | max |
|---|---|---|---|---|---|---|---|---|---|---|---|
| pg152_o3_native_lto.cx9a1_bee | 97.440 | 2.558 | 0.002 | 0.023 | |||||||
| pg153_o3_native_lto.cx9a1_bee | 97.298 | 2.699 | 0.003 | 0.026 | |||||||
| pg154_o3_native_lto.cx9a1_bee | 97.968 | 2.028 | 0.004 | 0.029 | |||||||
| pg16beta1_o3_native_lto.cx9a1_bee | 97.440 | 2.560 | 0.007 | ||||||||
| pg16beta2_o3_native_lto.cx9a1_bee | 97.218 | 2.782 | 0.009 | ||||||||
| pg16beta3_o3_native_lto.cx9a1_bee | 97.292 | 2.708 | 0.006 | ||||||||
| pg16rc1_o3_native_lto.cx9a1_bee | 97.684 | 2.313 | 0.003 | 0.027 | |||||||
| pg160_o3_native_lto.cx9a1_bee | 97.674 | 2.324 | 0.002 | 0.023 |
Delete response time histogram: each cell has the percentage of responses that take <= the time in the header and max is the max response time in seconds. For max values in the top 25% of the range have a red background and in the bottom 25% of the range have a green background. The red background is not used when the min value is within 80% of the max value.
| dbms | 256us | 1ms | 4ms | 16ms | 64ms | 256ms | 1s | 4s | 16s | gt | max |
|---|---|---|---|---|---|---|---|---|---|---|---|
| pg152_o3_native_lto.cx9a1_bee | 4.679 | 72.927 | 10.945 | 11.447 | 0.002 | 0.019 | |||||
| pg153_o3_native_lto.cx9a1_bee | 5.084 | 71.554 | 10.207 | 13.153 | 0.001 | 0.022 | |||||
| pg154_o3_native_lto.cx9a1_bee | 4.184 | 79.912 | 15.899 | 0.003 | 0.003 | 0.026 | |||||
| pg16beta1_o3_native_lto.cx9a1_bee | 4.694 | 80.592 | 14.710 | 0.004 | 0.006 | ||||||
| pg16beta2_o3_native_lto.cx9a1_bee | 4.578 | 76.176 | 16.732 | 2.514 | 0.009 | ||||||
| pg16beta3_o3_native_lto.cx9a1_bee | 4.239 | 75.867 | 0.097 | 19.797 | 0.014 | ||||||
| pg16rc1_o3_native_lto.cx9a1_bee | 4.802 | 78.378 | 16.812 | 0.005 | 0.002 | 0.023 | |||||
| pg160_o3_native_lto.cx9a1_bee | 4.549 | 80.681 | 14.765 | 0.003 | 0.002 | 0.019 |
Performance metrics for the DBMS listed above. Some are normalized by throughput, others are not. Legend for results is here.
ips	qps	rps	rmbps	wps	wmbps	rpq	rkbpq	wpi	wkbpi	csps	cpups	cspq	cpupq	dbgb1	dbgb2	rss	maxop	p50	p99	tag
998	9027	0	0.0	27.1	2.9	0.000	0.000	0.027	2.973	35061	13.8	3.884	122	5.1	30.9	4.9	0.009	8612	8422	20m.pg152_o3_native_lto.cx9a1_bee
998	9137	0	0.0	28.0	2.9	0.000	0.000	0.028	2.968	35504	13.8	3.886	121	5.1	30.9	2.8	0.004	8614	8405	20m.pg153_o3_native_lto.cx9a1_bee
997	9017	0	0.0	26.5	2.9	0.000	0.000	0.027	2.958	35074	13.6	3.890	121	5.1	30.8	3.7	0.017	8550	8364	20m.pg154_o3_native_lto.cx9a1_bee
997	9194	0	0.0	26.7	2.9	0.000	0.000	0.027	2.982	35746	13.6	3.888	118	5.1	30.8	1.3	0.003	8666	8440	20m.pg16beta1_o3_native_lto.cx9a1_bee
998	9075	0	0.0	26.7	2.9	0.000	0.000	0.027	2.980	35242	13.8	3.883	122	5.1	31.0	0.2	0.005	8646	8470	20m.pg16beta2_o3_native_lto.cx9a1_bee
998	8879	0	0.0	26.9	2.9	0.000	0.000	0.027	2.981	34498	14.0	3.885	126	5.1	31.0	5.2	0.016	8428	8248	20m.pg16beta3_o3_native_lto.cx9a1_bee
998	9242	0	0.0	27.0	2.9	0.000	0.000	0.027	2.966	35899	13.6	3.884	118	5.1	30.9	2.6	0.015	8742	8548	20m.pg16rc1_o3_native_lto.cx9a1_bee
998	9026	0	0.0	26.8	2.9	0.000	0.000	0.027	2.973	35042	13.7	3.882	121	5.1	30.9	5.2	0.042	8572	8390	20m.pg160_o3_native_lto.cx9a1_bee
l.i0
l.i0: load without secondary indexes
Performance metrics for all DBMS, not just the ones listed above. Some are normalized by throughput, others are not. Legend for results is here.
ips	qps	rps	rmbps	wps	wmbps	rpq	rkbpq	wpi	wkbpi	csps	cpups	cspq	cpupq	dbgb1	dbgb2	rss	maxop	p50	p99	tag
85106	0	0	0.0	98.0	36.2	0.000	0.000	0.001	0.435	10243	22.7	0.120	21	1.9	5.2	0.2	0.003	85409	81900	20m.pg152_o3_native_lto.cx9a1_bee
84746	0	0	0.0	98.6	36.0	0.000	0.000	0.001	0.435	10214	23.0	0.121	22	1.9	5.2	0.3	0.003	85007	81182	20m.pg153_o3_native_lto.cx9a1_bee
85106	0	0	0.0	99.6	36.1	0.000	0.000	0.001	0.434	10262	22.4	0.121	21	1.9	5.2	2.0	0.005	85307	82206	20m.pg154_o3_native_lto.cx9a1_bee
84388	0	0	0.0	100.1	36.1	0.000	0.000	0.001	0.438	10260	22.5	0.122	21	1.9	5.2	2.0	0.006	85152	73991	20m.pg16beta1_o3_native_lto.cx9a1_bee
83333	0	0	0.0	98.2	35.3	0.000	0.000	0.001	0.433	10115	23.3	0.121	22	1.9	5.2	0.2	0.009	83509	80001	20m.pg16beta2_o3_native_lto.cx9a1_bee
82645	0	0	0.0	97.7	35.1	0.000	0.000	0.001	0.434	10049	23.0	0.122	22	1.9	5.2	1.9	0.010	83007	80108	20m.pg16beta3_o3_native_lto.cx9a1_bee
84746	0	0	0.0	97.5	36.0	0.000	0.000	0.001	0.435	10221	22.4	0.121	21	1.9	5.2	0.2	0.006	84977	81272	20m.pg16rc1_o3_native_lto.cx9a1_bee
84746	0	0	0.0	97.6	36.0	0.000	0.000	0.001	0.435	10245	22.3	0.121	21	1.9	5.2	0.3	0.003	85207	82305	20m.pg160_o3_native_lto.cx9a1_bee
l.x
l.x: create secondary indexes
Performance metrics for all DBMS, not just the ones listed above. Some are normalized by throughput, others are not. Legend for results is here.
ips	qps	rps	rmbps	wps	wmbps	rpq	rkbpq	wpi	wkbpi	csps	cpups	cspq	cpupq	dbgb1	dbgb2	rss	maxop	p50	p99	tag
254430	0	0	0.0	78.2	36.6	0.000	0.000	0.000	0.147	722	12.2	0.003	4	3.7	8.0	2.1	0.003	NA	NA	20m.pg152_o3_native_lto.cx9a1_bee
254430	0	0	0.0	80.0	37.2	0.000	0.000	0.000	0.150	688	12.1	0.003	4	3.7	8.0	2.1	0.003	NA	NA	20m.pg153_o3_native_lto.cx9a1_bee
257692	0	0	0.0	81.0	37.7	0.000	0.000	0.000	0.150	836	12.1	0.003	4	3.7	8.0	2.1	0.003	NA	NA	20m.pg154_o3_native_lto.cx9a1_bee
251250	0	0	0.0	125.4	58.5	0.000	0.000	0.000	0.238	780	12.2	0.003	4	3.7	8.0	2.1	0.003	NA	NA	20m.pg16beta1_o3_native_lto.cx9a1_bee
248148	0	0	0.0	90.7	41.9	0.000	0.000	0.000	0.173	670	12.3	0.003	4	3.7	8.0	2.1	0.003	NA	NA	20m.pg16beta2_o3_native_lto.cx9a1_bee
248148	0	0	0.0	91.7	42.2	0.000	0.000	0.000	0.174	680	12.3	0.003	4	3.7	8.0	2.1	0.003	NA	NA	20m.pg16beta3_o3_native_lto.cx9a1_bee
239286	0	0	0.0	75.7	35.3	0.000	0.000	0.000	0.151	790	12.2	0.003	4	3.7	8.0	2.1	0.003	NA	NA	20m.pg16rc1_o3_native_lto.cx9a1_bee
251250	0	0	0.0	119.7	56.9	0.000	0.000	0.000	0.232	797	12.2	0.003	4	3.7	8.0	2.1	0.003	NA	NA	20m.pg160_o3_native_lto.cx9a1_bee
l.i1
l.i1: continue load after secondary indexes created
Performance metrics for all DBMS, not just the ones listed above. Some are normalized by throughput, others are not. Legend for results is here.
ips	qps	rps	rmbps	wps	wmbps	rpq	rkbpq	wpi	wkbpi	csps	cpups	cspq	cpupq	dbgb1	dbgb2	rss	maxop	p50	p99	tag
24351	0	0	0.0	67.0	18.4	0.000	0.000	0.003	0.776	11609	23.3	0.477	77	5.1	45.2	0.0	0.024	32063	8491	20m.pg152_o3_native_lto.cx9a1_bee
25612	0	0	0.0	71.1	19.4	0.000	0.000	0.003	0.776	12232	23.9	0.478	75	5.1	45.2	0.3	0.050	32364	6443	20m.pg153_o3_native_lto.cx9a1_bee
25621	0	0	0.0	71.0	19.4	0.000	0.000	0.003	0.775	12241	23.8	0.478	74	5.1	45.1	5.1	0.028	32564	5644	20m.pg154_o3_native_lto.cx9a1_bee
25517	0	0	0.0	70.7	19.4	0.000	0.000	0.003	0.777	12219	23.9	0.479	75	5.1	45.2	3.8	0.022	32378	6793	20m.pg16beta1_o3_native_lto.cx9a1_bee
23520	0	0	0.0	66.0	17.9	0.000	0.000	0.003	0.779	11258	22.9	0.479	78	5.1	45.2	2.4	0.021	32026	5647	20m.pg16beta2_o3_native_lto.cx9a1_bee
23672	0	0	0.0	66.1	18.0	0.000	0.000	0.003	0.778	11363	23.0	0.480	78	5.1	45.2	4.7	0.020	31966	5744	20m.pg16beta3_o3_native_lto.cx9a1_bee
24466	0	0	0.0	67.1	18.5	0.000	0.000	0.003	0.774	11704	23.2	0.478	76	5.1	45.1	5.1	0.054	32176	4645	20m.pg16rc1_o3_native_lto.cx9a1_bee
25931	0	0	0.0	71.6	19.6	0.000	0.000	0.003	0.775	12398	23.9	0.478	74	5.1	45.1	3.0	0.059	32463	5646	20m.pg160_o3_native_lto.cx9a1_bee
q100.1
q100.1: range queries with 100 insert/s per client
Performance metrics for all DBMS, not just the ones listed above. Some are normalized by throughput, others are not. Legend for results is here.
ips	qps	rps	rmbps	wps	wmbps	rpq	rkbpq	wpi	wkbpi	csps	cpups	cspq	cpupq	dbgb1	dbgb2	rss	maxop	p50	p99	tag
100	9508	0	0.0	53.3	1.9	0.000	0.000	0.535	19.502	36600	12.8	3.849	108	5.1	43.4	1.5	0.004	8898	8502	20m.pg152_o3_native_lto.cx9a1_bee
100	9453	0	0.0	52.6	1.9	0.000	0.000	0.527	19.483	36361	12.9	3.846	109	5.1	43.4	3.4	0.005	8965	8420	20m.pg153_o3_native_lto.cx9a1_bee
100	8914	0	0.0	52.8	1.9	0.000	0.000	0.530	19.338	34329	13.1	3.851	118	5.1	43.3	3.4	0.004	8645	8469	20m.pg154_o3_native_lto.cx9a1_bee
100	9213	0	0.0	53.2	1.9	0.000	0.000	0.533	19.490	35496	12.9	3.853	112	5.1	43.4	3.5	0.005	8738	8514	20m.pg16beta1_o3_native_lto.cx9a1_bee
100	9016	0	0.0	52.0	1.9	0.000	0.000	0.522	19.890	34699	13.0	3.849	115	5.1	43.4	3.4	0.006	8651	8455	20m.pg16beta2_o3_native_lto.cx9a1_bee
100	9288	0	0.0	52.2	1.9	0.000	0.000	0.524	19.800	35752	12.8	3.849	110	5.1	43.3	3.5	0.004	8694	8366	20m.pg16beta3_o3_native_lto.cx9a1_bee
100	9260	0	0.0	53.1	1.9	0.000	0.000	0.532	19.481	35630	13.2	3.848	114	5.1	43.3	3.4	0.005	8726	8520	20m.pg16rc1_o3_native_lto.cx9a1_bee
100	8694	0	0.0	53.0	1.9	0.000	0.000	0.531	19.432	33484	13.2	3.851	121	5.1	43.3	3.4	0.004	8597	8434	20m.pg160_o3_native_lto.cx9a1_bee
q500.1
q500.1: range queries with 500 insert/s per client
Performance metrics for all DBMS, not just the ones listed above. Some are normalized by throughput, others are not. Legend for results is here.
ips	qps	rps	rmbps	wps	wmbps	rpq	rkbpq	wpi	wkbpi	csps	cpups	cspq	cpupq	dbgb1	dbgb2	rss	maxop	p50	p99	tag
499	9385	0	0.0	30.8	2.6	0.000	0.000	0.062	5.324	36222	13.1	3.860	112	5.1	38.1	4.4	0.013	8771	8499	20m.pg152_o3_native_lto.cx9a1_bee
499	9375	0	0.0	31.6	2.6	0.000	0.000	0.063	5.305	36184	13.1	3.860	112	5.1	38.1	1.8	0.006	8744	8464	20m.pg153_o3_native_lto.cx9a1_bee
499	9216	0	0.0	31.0	2.6	0.000	0.000	0.062	5.315	35603	13.0	3.863	113	5.1	37.9	2.7	0.030	8630	8420	20m.pg154_o3_native_lto.cx9a1_bee
499	8973	0	0.0	32.7	2.6	0.000	0.000	0.066	5.299	34672	13.3	3.864	119	5.1	38.0	1.9	0.004	8680	8496	20m.pg16beta1_o3_native_lto.cx9a1_bee
499	9146	0	0.0	29.2	2.6	0.000	0.000	0.059	5.345	35336	13.1	3.863	115	5.1	38.2	1.9	0.011	8685	8486	20m.pg16beta2_o3_native_lto.cx9a1_bee
499	9347	0	0.0	28.8	2.6	0.000	0.000	0.058	5.349	36074	13.0	3.859	111	5.1	38.0	5.2	0.004	8720	8358	20m.pg16beta3_o3_native_lto.cx9a1_bee
499	9239	0	0.0	30.9	2.6	0.000	0.000	0.062	5.317	35673	13.3	3.861	115	5.1	38.0	5.2	0.003	8712	8502	20m.pg16rc1_o3_native_lto.cx9a1_bee
499	8844	0	0.0	31.1	2.6	0.000	0.000	0.062	5.323	34166	13.2	3.863	119	5.1	38.1	5.1	0.017	8519	8356	20m.pg160_o3_native_lto.cx9a1_bee
q1000.1
q1000.1: range queries with 1000 insert/s per client
Performance metrics for all DBMS, not just the ones listed above. Some are normalized by throughput, others are not. Legend for results is here.
ips	qps	rps	rmbps	wps	wmbps	rpq	rkbpq	wpi	wkbpi	csps	cpups	cspq	cpupq	dbgb1	dbgb2	rss	maxop	p50	p99	tag
998	9027	0	0.0	27.1	2.9	0.000	0.000	0.027	2.973	35061	13.8	3.884	122	5.1	30.9	4.9	0.009	8612	8422	20m.pg152_o3_native_lto.cx9a1_bee
998	9137	0	0.0	28.0	2.9	0.000	0.000	0.028	2.968	35504	13.8	3.886	121	5.1	30.9	2.8	0.004	8614	8405	20m.pg153_o3_native_lto.cx9a1_bee
997	9017	0	0.0	26.5	2.9	0.000	0.000	0.027	2.958	35074	13.6	3.890	121	5.1	30.8	3.7	0.017	8550	8364	20m.pg154_o3_native_lto.cx9a1_bee
997	9194	0	0.0	26.7	2.9	0.000	0.000	0.027	2.982	35746	13.6	3.888	118	5.1	30.8	1.3	0.003	8666	8440	20m.pg16beta1_o3_native_lto.cx9a1_bee
998	9075	0	0.0	26.7	2.9	0.000	0.000	0.027	2.980	35242	13.8	3.883	122	5.1	31.0	0.2	0.005	8646	8470	20m.pg16beta2_o3_native_lto.cx9a1_bee
998	8879	0	0.0	26.9	2.9	0.000	0.000	0.027	2.981	34498	14.0	3.885	126	5.1	31.0	5.2	0.016	8428	8248	20m.pg16beta3_o3_native_lto.cx9a1_bee
998	9242	0	0.0	27.0	2.9	0.000	0.000	0.027	2.966	35899	13.6	3.884	118	5.1	30.9	2.6	0.015	8742	8548	20m.pg16rc1_o3_native_lto.cx9a1_bee
998	9026	0	0.0	26.8	2.9	0.000	0.000	0.027	2.973	35042	13.7	3.882	121	5.1	30.9	5.2	0.042	8572	8390	20m.pg160_o3_native_lto.cx9a1_bee
l.i0
- l.i0: load without secondary indexes
- Legend for results is here.
- Each entry lists the percentage of responses that fit in that bucket (slower than max time for previous bucket, faster than min time for next bucket).
Insert response time histogram
256us	1ms	4ms	16ms	64ms	256ms	1s	4s	16s	gt	max	tag
0.000	0.006	99.993	0.000	0.000	0.000	0.000	0.000	0.000	0.000	0.003	pg152_o3_native_lto.cx9a1_bee
0.000	0.002	99.999	0.000	0.000	0.000	0.000	0.000	0.000	0.000	0.003	pg153_o3_native_lto.cx9a1_bee
0.000	0.017	99.982	0.001	0.000	0.000	0.000	0.000	0.000	0.000	0.005	pg154_o3_native_lto.cx9a1_bee
0.000	0.004	99.996	0.001	0.000	0.000	0.000	0.000	0.000	0.000	0.006	pg16beta1_o3_native_lto.cx9a1_bee
0.000	0.000	99.999	0.001	0.000	0.000	0.000	0.000	0.000	0.000	0.009	pg16beta2_o3_native_lto.cx9a1_bee
0.000	0.000	99.999	0.001	0.000	0.000	0.000	0.000	0.000	0.000	0.010	pg16beta3_o3_native_lto.cx9a1_bee
0.000	0.006	99.994	0.001	0.000	0.000	0.000	0.000	0.000	0.000	0.006	pg16rc1_o3_native_lto.cx9a1_bee
0.000	0.003	99.996	0.000	0.000	0.000	0.000	0.000	0.000	0.000	0.003	pg160_o3_native_lto.cx9a1_bee
l.x
- l.x: create secondary indexes
- Legend for results is here.
- Each entry lists the percentage of responses that fit in that bucket (slower than max time for previous bucket, faster than min time for next bucket).
TODO - determine whether there is data for create index response time
l.i1
- l.i1: continue load after secondary indexes created
- Legend for results is here.
- Each entry lists the percentage of responses that fit in that bucket (slower than max time for previous bucket, faster than min time for next bucket).
Insert response time histogram
256us	1ms	4ms	16ms	64ms	256ms	1s	4s	16s	gt	max	tag
0.000	0.000	99.991	0.009	nonzero	0.000	0.000	0.000	0.000	0.000	0.024	pg152_o3_native_lto.cx9a1_bee
0.000	0.000	99.996	0.004	nonzero	0.000	0.000	0.000	0.000	0.000	0.050	pg153_o3_native_lto.cx9a1_bee
0.000	0.000	99.996	0.004	nonzero	0.000	0.000	0.000	0.000	0.000	0.028	pg154_o3_native_lto.cx9a1_bee
0.000	0.000	99.996	0.004	nonzero	0.000	0.000	0.000	0.000	0.000	0.022	pg16beta1_o3_native_lto.cx9a1_bee
0.000	0.000	99.994	0.006	nonzero	0.000	0.000	0.000	0.000	0.000	0.021	pg16beta2_o3_native_lto.cx9a1_bee
0.000	0.000	99.996	0.004	nonzero	0.000	0.000	0.000	0.000	0.000	0.020	pg16beta3_o3_native_lto.cx9a1_bee
0.000	0.000	99.985	0.015	nonzero	0.000	0.000	0.000	0.000	0.000	0.054	pg16rc1_o3_native_lto.cx9a1_bee
0.000	0.000	99.996	0.004	nonzero	0.000	0.000	0.000	0.000	0.000	0.059	pg160_o3_native_lto.cx9a1_bee
Delete response time histogram
256us	1ms	4ms	16ms	64ms	256ms	1s	4s	16s	gt	max	tag
0.545	83.724	2.462	13.270	nonzero	0.000	0.000	0.000	0.000	0.000	0.022	pg152_o3_native_lto.cx9a1_bee
0.548	83.507	8.790	7.155	nonzero	0.000	0.000	0.000	0.000	0.000	0.049	pg153_o3_native_lto.cx9a1_bee
0.466	83.473	9.143	6.917	nonzero	0.000	0.000	0.000	0.000	0.000	0.035	pg154_o3_native_lto.cx9a1_bee
0.576	83.321	8.196	7.906	nonzero	0.000	0.000	0.000	0.000	0.000	0.020	pg16beta1_o3_native_lto.cx9a1_bee
0.511	83.613	2.079	13.798	nonzero	0.000	0.000	0.000	0.000	0.000	0.020	pg16beta2_o3_native_lto.cx9a1_bee
0.495	83.794	1.970	13.741	nonzero	0.000	0.000	0.000	0.000	0.000	0.018	pg16beta3_o3_native_lto.cx9a1_bee
0.510	83.856	3.618	12.016	nonzero	0.000	0.000	0.000	0.000	0.000	0.019	pg16rc1_o3_native_lto.cx9a1_bee
0.456	83.703	9.207	6.634	nonzero	0.000	0.000	0.000	0.000	0.000	0.023	pg160_o3_native_lto.cx9a1_bee
q100.1
- q100.1: range queries with 100 insert/s per client
- Legend for results is here.
- Each entry lists the percentage of responses that fit in that bucket (slower than max time for previous bucket, faster than min time for next bucket).
Query response time histogram
256us	1ms	4ms	16ms	64ms	256ms	1s	4s	16s	gt	max	tag
99.966	0.034	nonzero	0.000	0.000	0.000	0.000	0.000	0.000	0.000	0.004	pg152_o3_native_lto.cx9a1_bee
99.970	0.030	nonzero	nonzero	0.000	0.000	0.000	0.000	0.000	0.000	0.005	pg153_o3_native_lto.cx9a1_bee
99.956	0.043	nonzero	nonzero	0.000	0.000	0.000	0.000	0.000	0.000	0.004	pg154_o3_native_lto.cx9a1_bee
99.972	0.028	nonzero	nonzero	0.000	0.000	0.000	0.000	0.000	0.000	0.005	pg16beta1_o3_native_lto.cx9a1_bee
99.951	0.048	nonzero	nonzero	0.000	0.000	0.000	0.000	0.000	0.000	0.006	pg16beta2_o3_native_lto.cx9a1_bee
99.963	0.037	nonzero	nonzero	0.000	0.000	0.000	0.000	0.000	0.000	0.004	pg16beta3_o3_native_lto.cx9a1_bee
99.962	0.038	nonzero	nonzero	0.000	0.000	0.000	0.000	0.000	0.000	0.005	pg16rc1_o3_native_lto.cx9a1_bee
99.966	0.034	nonzero	0.000	0.000	0.000	0.000	0.000	0.000	0.000	0.004	pg160_o3_native_lto.cx9a1_bee
Insert response time histogram
256us	1ms	4ms	16ms	64ms	256ms	1s	4s	16s	gt	max	tag
0.000	0.000	73.528	26.472	0.000	0.000	0.000	0.000	0.000	0.000	0.006	pg152_o3_native_lto.cx9a1_bee
0.000	0.000	73.299	26.701	0.000	0.000	0.000	0.000	0.000	0.000	0.007	pg153_o3_native_lto.cx9a1_bee
0.000	0.000	73.479	26.521	0.000	0.000	0.000	0.000	0.000	0.000	0.010	pg154_o3_native_lto.cx9a1_bee
0.000	0.000	72.667	27.333	0.000	0.000	0.000	0.000	0.000	0.000	0.008	pg16beta1_o3_native_lto.cx9a1_bee
0.000	0.000	75.368	24.632	0.000	0.000	0.000	0.000	0.000	0.000	0.006	pg16beta2_o3_native_lto.cx9a1_bee
0.000	0.000	73.049	26.951	0.000	0.000	0.000	0.000	0.000	0.000	0.007	pg16beta3_o3_native_lto.cx9a1_bee
0.000	0.000	74.333	25.667	0.000	0.000	0.000	0.000	0.000	0.000	0.006	pg16rc1_o3_native_lto.cx9a1_bee
0.000	0.000	73.868	26.132	0.000	0.000	0.000	0.000	0.000	0.000	0.006	pg160_o3_native_lto.cx9a1_bee
Delete response time histogram
256us	1ms	4ms	16ms	64ms	256ms	1s	4s	16s	gt	max	tag
0.569	71.069	0.007	28.354	0.000	0.000	0.000	0.000	0.000	0.000	0.011	pg152_o3_native_lto.cx9a1_bee
0.458	75.847	0.007	23.688	0.000	0.000	0.000	0.000	0.000	0.000	0.011	pg153_o3_native_lto.cx9a1_bee
1.542	69.424	4.139	24.896	0.000	0.000	0.000	0.000	0.000	0.000	0.008	pg154_o3_native_lto.cx9a1_bee
0.806	68.938	12.569	17.688	0.000	0.000	0.000	0.000	0.000	0.000	0.009	pg16beta1_o3_native_lto.cx9a1_bee
2.924	70.083	0.076	26.917	0.000	0.000	0.000	0.000	0.000	0.000	0.011	pg16beta2_o3_native_lto.cx9a1_bee
1.222	81.382	0.021	17.375	0.000	0.000	0.000	0.000	0.000	0.000	0.011	pg16beta3_o3_native_lto.cx9a1_bee
0.583	71.819	6.326	21.271	0.000	0.000	0.000	0.000	0.000	0.000	0.009	pg16rc1_o3_native_lto.cx9a1_bee
0.889	80.958	18.153	0.000	0.000	0.000	0.000	0.000	0.000	0.000	0.003	pg160_o3_native_lto.cx9a1_bee
q500.1
- q500.1: range queries with 500 insert/s per client
- Legend for results is here.
- Each entry lists the percentage of responses that fit in that bucket (slower than max time for previous bucket, faster than min time for next bucket).
Query response time histogram
256us	1ms	4ms	16ms	64ms	256ms	1s	4s	16s	gt	max	tag
99.969	0.031	nonzero	nonzero	0.000	0.000	0.000	0.000	0.000	0.000	0.013	pg152_o3_native_lto.cx9a1_bee
99.968	0.032	nonzero	nonzero	0.000	0.000	0.000	0.000	0.000	0.000	0.006	pg153_o3_native_lto.cx9a1_bee
99.970	0.030	nonzero	nonzero	nonzero	0.000	0.000	0.000	0.000	0.000	0.030	pg154_o3_native_lto.cx9a1_bee
99.970	0.030	nonzero	nonzero	0.000	0.000	0.000	0.000	0.000	0.000	0.004	pg16beta1_o3_native_lto.cx9a1_bee
99.966	0.034	nonzero	nonzero	0.000	0.000	0.000	0.000	0.000	0.000	0.011	pg16beta2_o3_native_lto.cx9a1_bee
99.971	0.029	nonzero	nonzero	0.000	0.000	0.000	0.000	0.000	0.000	0.004	pg16beta3_o3_native_lto.cx9a1_bee
99.966	0.033	nonzero	0.000	0.000	0.000	0.000	0.000	0.000	0.000	0.003	pg16rc1_o3_native_lto.cx9a1_bee
99.961	0.039	nonzero	nonzero	nonzero	0.000	0.000	0.000	0.000	0.000	0.017	pg160_o3_native_lto.cx9a1_bee
Insert response time histogram
256us	1ms	4ms	16ms	64ms	256ms	1s	4s	16s	gt	max	tag
0.000	0.000	94.783	5.217	0.000	0.000	0.000	0.000	0.000	0.000	0.008	pg152_o3_native_lto.cx9a1_bee
0.000	0.000	94.508	5.489	0.003	0.000	0.000	0.000	0.000	0.000	0.033	pg153_o3_native_lto.cx9a1_bee
0.000	0.000	95.233	4.767	0.000	0.000	0.000	0.000	0.000	0.000	0.008	pg154_o3_native_lto.cx9a1_bee
0.000	0.000	94.276	5.724	0.000	0.000	0.000	0.000	0.000	0.000	0.010	pg16beta1_o3_native_lto.cx9a1_bee
0.000	0.000	94.399	5.601	0.000	0.000	0.000	0.000	0.000	0.000	0.006	pg16beta2_o3_native_lto.cx9a1_bee
0.000	0.000	94.557	5.443	0.000	0.000	0.000	0.000	0.000	0.000	0.010	pg16beta3_o3_native_lto.cx9a1_bee
0.000	0.000	94.888	5.110	0.003	0.000	0.000	0.000	0.000	0.000	0.024	pg16rc1_o3_native_lto.cx9a1_bee
0.000	0.000	94.839	5.161	0.000	0.000	0.000	0.000	0.000	0.000	0.014	pg160_o3_native_lto.cx9a1_bee
Delete response time histogram
256us	1ms	4ms	16ms	64ms	256ms	1s	4s	16s	gt	max	tag
7.828	75.985	0.106	16.082	0.000	0.000	0.000	0.000	0.000	0.000	0.011	pg152_o3_native_lto.cx9a1_bee
7.928	74.118	0.106	17.846	0.003	0.000	0.000	0.000	0.000	0.000	0.031	pg153_o3_native_lto.cx9a1_bee
5.857	78.556	15.581	0.007	0.000	0.000	0.000	0.000	0.000	0.000	0.005	pg154_o3_native_lto.cx9a1_bee
7.225	72.060	17.464	3.251	0.000	0.000	0.000	0.000	0.000	0.000	0.007	pg16beta1_o3_native_lto.cx9a1_bee
6.919	72.693	5.989	14.399	0.000	0.000	0.000	0.000	0.000	0.000	0.009	pg16beta2_o3_native_lto.cx9a1_bee
6.875	74.815	8.912	9.356	0.042	0.000	0.000	0.000	0.000	0.000	0.027	pg16beta3_o3_native_lto.cx9a1_bee
6.553	72.272	15.135	6.039	0.001	0.000	0.000	0.000	0.000	0.000	0.020	pg16rc1_o3_native_lto.cx9a1_bee
5.907	79.561	14.532	0.000	0.000	0.000	0.000	0.000	0.000	0.000	0.004	pg160_o3_native_lto.cx9a1_bee
q1000.1
- q1000.1: range queries with 1000 insert/s per client
- Legend for results is here.
- Each entry lists the percentage of responses that fit in that bucket (slower than max time for previous bucket, faster than min time for next bucket).
Query response time histogram
256us	1ms	4ms	16ms	64ms	256ms	1s	4s	16s	gt	max	tag
99.965	0.035	nonzero	nonzero	0.000	0.000	0.000	0.000	0.000	0.000	0.009	pg152_o3_native_lto.cx9a1_bee
99.961	0.038	nonzero	nonzero	0.000	0.000	0.000	0.000	0.000	0.000	0.004	pg153_o3_native_lto.cx9a1_bee
99.962	0.038	nonzero	nonzero	nonzero	0.000	0.000	0.000	0.000	0.000	0.017	pg154_o3_native_lto.cx9a1_bee
99.966	0.034	nonzero	0.000	0.000	0.000	0.000	0.000	0.000	0.000	0.003	pg16beta1_o3_native_lto.cx9a1_bee
99.966	0.034	nonzero	nonzero	0.000	0.000	0.000	0.000	0.000	0.000	0.005	pg16beta2_o3_native_lto.cx9a1_bee
99.961	0.039	nonzero	nonzero	nonzero	0.000	0.000	0.000	0.000	0.000	0.016	pg16beta3_o3_native_lto.cx9a1_bee
99.963	0.036	nonzero	nonzero	0.000	0.000	0.000	0.000	0.000	0.000	0.015	pg16rc1_o3_native_lto.cx9a1_bee
99.963	0.037	nonzero	nonzero	nonzero	0.000	0.000	0.000	0.000	0.000	0.042	pg160_o3_native_lto.cx9a1_bee
Insert response time histogram
256us	1ms	4ms	16ms	64ms	256ms	1s	4s	16s	gt	max	tag
0.000	0.000	97.440	2.558	0.002	0.000	0.000	0.000	0.000	0.000	0.023	pg152_o3_native_lto.cx9a1_bee
0.000	0.000	97.298	2.699	0.003	0.000	0.000	0.000	0.000	0.000	0.026	pg153_o3_native_lto.cx9a1_bee
0.000	0.000	97.968	2.028	0.004	0.000	0.000	0.000	0.000	0.000	0.029	pg154_o3_native_lto.cx9a1_bee
0.000	0.000	97.440	2.560	0.000	0.000	0.000	0.000	0.000	0.000	0.007	pg16beta1_o3_native_lto.cx9a1_bee
0.000	0.000	97.218	2.782	0.000	0.000	0.000	0.000	0.000	0.000	0.009	pg16beta2_o3_native_lto.cx9a1_bee
0.000	0.000	97.292	2.708	0.000	0.000	0.000	0.000	0.000	0.000	0.006	pg16beta3_o3_native_lto.cx9a1_bee
0.000	0.000	97.684	2.313	0.003	0.000	0.000	0.000	0.000	0.000	0.027	pg16rc1_o3_native_lto.cx9a1_bee
0.000	0.000	97.674	2.324	0.002	0.000	0.000	0.000	0.000	0.000	0.023	pg160_o3_native_lto.cx9a1_bee
Delete response time histogram
256us	1ms	4ms	16ms	64ms	256ms	1s	4s	16s	gt	max	tag
4.679	72.927	10.945	11.447	0.002	0.000	0.000	0.000	0.000	0.000	0.019	pg152_o3_native_lto.cx9a1_bee
5.084	71.554	10.207	13.153	0.001	0.000	0.000	0.000	0.000	0.000	0.022	pg153_o3_native_lto.cx9a1_bee
4.184	79.912	15.899	0.003	0.003	0.000	0.000	0.000	0.000	0.000	0.026	pg154_o3_native_lto.cx9a1_bee
4.694	80.592	14.710	0.004	0.000	0.000	0.000	0.000	0.000	0.000	0.006	pg16beta1_o3_native_lto.cx9a1_bee
4.578	76.176	16.732	2.514	0.000	0.000	0.000	0.000	0.000	0.000	0.009	pg16beta2_o3_native_lto.cx9a1_bee
4.239	75.867	0.097	19.797	0.000	0.000	0.000	0.000	0.000	0.000	0.014	pg16beta3_o3_native_lto.cx9a1_bee
4.802	78.378	16.812	0.005	0.002	0.000	0.000	0.000	0.000	0.000	0.023	pg16rc1_o3_native_lto.cx9a1_bee
4.549	80.681	14.765	0.003	0.002	0.000	0.000	0.000	0.000	0.000	0.019	pg160_o3_native_lto.cx9a1_bee