Introduction
This is a report for the insert benchmark with 20M docs and 1 client(s). It is generated by scripts (bash, awk, sed) and Tufte might not be impressed. An overview of the insert benchmark is here and a short update is here. Below, by DBMS, I mean DBMS+version.config. An example is my8020.c10b40 where my means MySQL, 8020 is version 8.0.20 and c10b40 is the name for the configuration file.
The test server has 8 AMD cores, 16G RAM and an NVMe SSD. It is described here as the Beelink. The benchmark was run with 1 client and there were 1 or 3 connections per client (1 for queries or inserts without rate limits, 1+1 for rate limited inserts+deletes). There is 1 table. It loads 20M rows without secondary indexes, creates secondary indexes, then inserts 50M rows with a delete per insert to avoid growing the table. It then does 3 read+write tests for 1200s each that do queries as fast as possible with 100, 500 and then 1000 inserts/second/client concurrent with the queries and 1000 deletes/second to avoid growing the table. The database is (or should be) cached by InnoDB.
The tested DBMS are:
- my5621_rel.cy10a_bee - InnoDB and MySQL 5.6.21, rel build, cy10a_bee config, compiled with CMAKE_BUILD_TYPE=Release, base config
- my5651_rel.cy10a_bee - InnoDB and MySQL 5.6.51, rel build, cy10a_bee config, compiled with CMAKE_BUILD_TYPE=Release, base config
- my5710_rel.cy10a_bee - InnoDB and MySQL 5.7.10, rel build, cy10a_bee config, compiled with CMAKE_BUILD_TYPE=Release, base config
- my5721_rel.cy10a_bee - InnoDB and MySQL 5.7.21, rel build, cy10a_bee config, compiled with CMAKE_BUILD_TYPE=Release, base config
- my5732_rel.cy10a_bee - InnoDB and MySQL 5.7.32, rel build, cy10a_bee config, compiled with CMAKE_BUILD_TYPE=Release, base config
- my5743_rel.cy10a_bee - InnoDB and MySQL 5.7.43, rel build, cy10a_bee config, compiled with CMAKE_BUILD_TYPE=Release, base config
- my8013_rel.cy10a_bee - InnoDB and MySQL 8.0.13, rel build, cy10a_bee config, compiled with CMAKE_BUILD_TYPE=Release, base config
- my8020_rel.cy10a_bee - InnoDB and MySQL 8.0.20, rel build, cy10a_bee config, compiled with CMAKE_BUILD_TYPE=Release, base config
- my8027_rel.cy10a_bee - InnoDB and MySQL 8.0.27, rel build, cy10a_bee config, compiled with CMAKE_BUILD_TYPE=Release, base config
- my8034_rel.cy10a_bee - InnoDB and MySQL 8.0.34, rel build, cy10a_bee config, compiled with CMAKE_BUILD_TYPE=Release, base config
Contents
- Summary
- l.i0: load without secondary indexes
- l.x: create secondary indexes
- l.i1: continue load after secondary indexes created
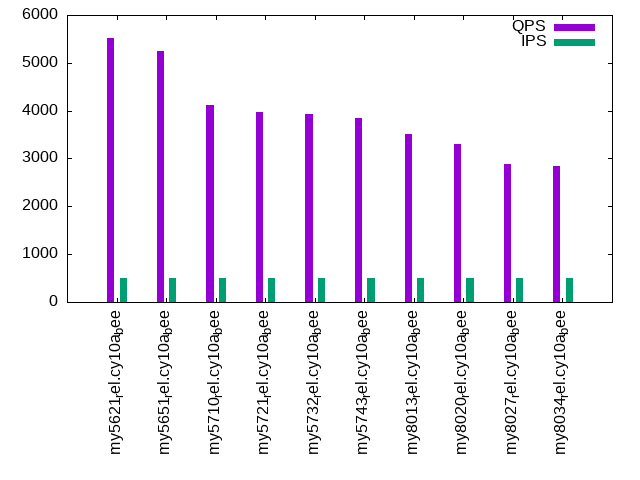
- q100.1: range queries with 100 insert/s per client
- q500.1: range queries with 500 insert/s per client
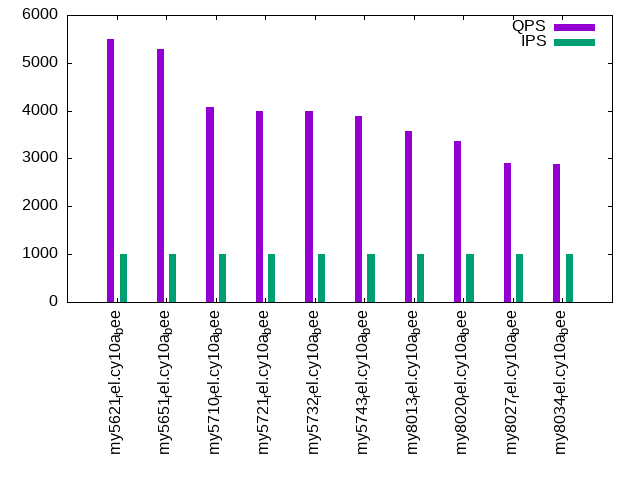
- q1000.1: range queries with 1000 insert/s per client
Summary
The numbers are inserts/s for l.i0 and l.i1, indexed docs (or rows) /s for l.x and queries/s for q100, q500, q1000. The values are the average rate over the entire test for inserts (IPS) and queries (QPS). The range of values for IPS and QPS is split into 3 parts: bottom 25%, middle 50%, top 25%. Values in the bottom 25% have a red background, values in the top 25% have a green background and values in the middle have no color. A gray background is used for values that can be ignored because the DBMS did not sustain the target insert rate. Red backgrounds are not used when the minimum value is within 80% of the max value.
| dbms | l.i0 | l.x | l.i1 | q100.1 | q500.1 | q1000.1 |
|---|---|---|---|---|---|---|
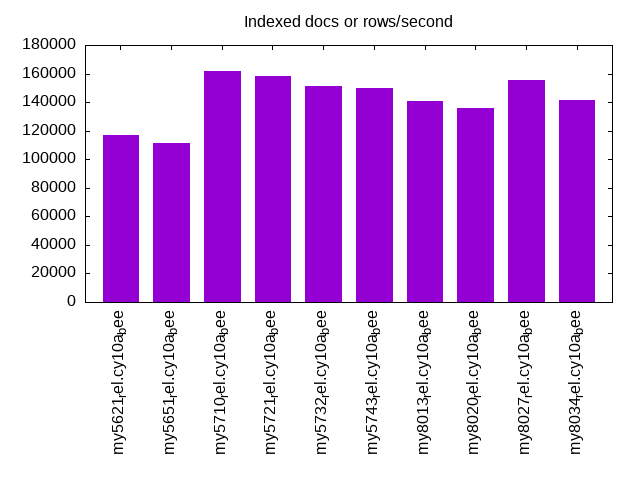
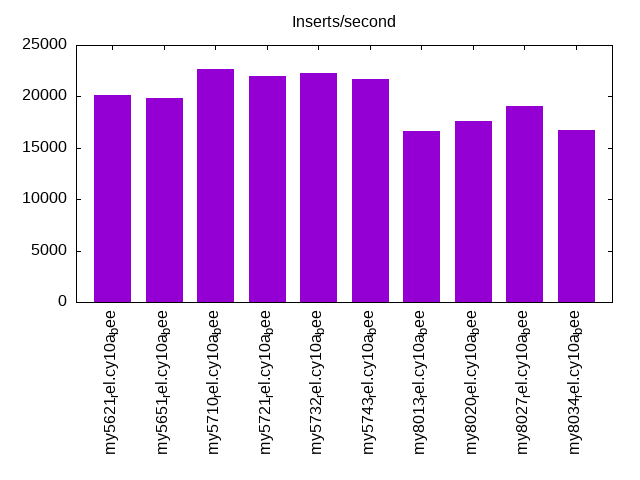
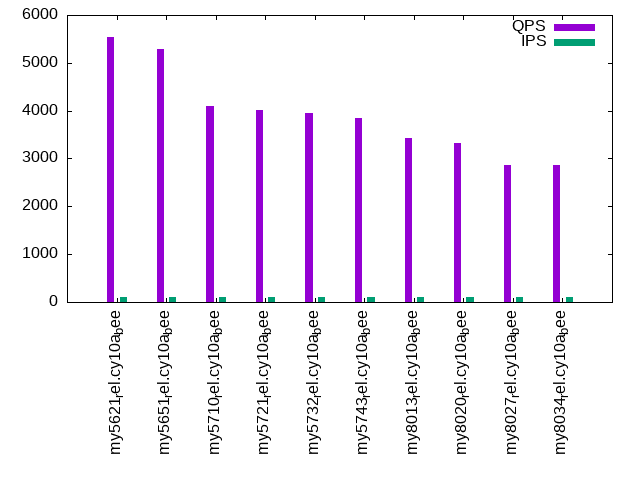
| my5621_rel.cy10a_bee | 104712 | 116860 | 20137 | 5533 | 5519 | 5505 |
| my5651_rel.cy10a_bee | 101010 | 111667 | 19881 | 5296 | 5245 | 5285 |
| my5710_rel.cy10a_bee | 88889 | 162097 | 22645 | 4104 | 4127 | 4087 |
| my5721_rel.cy10a_bee | 86207 | 158268 | 22007 | 4009 | 3981 | 3988 |
| my5732_rel.cy10a_bee | 86580 | 151128 | 22272 | 3958 | 3920 | 3992 |
| my5743_rel.cy10a_bee | 84034 | 150000 | 21730 | 3854 | 3856 | 3885 |
| my8013_rel.cy10a_bee | 69444 | 140559 | 16667 | 3438 | 3522 | 3568 |
| my8020_rel.cy10a_bee | 64102 | 135811 | 17606 | 3321 | 3306 | 3362 |
| my8027_rel.cy10a_bee | 63291 | 155814 | 19069 | 2871 | 2880 | 2897 |
| my8034_rel.cy10a_bee | 55710 | 141549 | 16773 | 2860 | 2852 | 2891 |
This table has relative throughput, throughput for the DBMS relative to the DBMS in the first line, using the absolute throughput from the previous table. Values less than 0.95 have a yellow background. Values greater than 1.05 have a blue background.
| dbms | l.i0 | l.x | l.i1 | q100.1 | q500.1 | q1000.1 |
|---|---|---|---|---|---|---|
| my5621_rel.cy10a_bee | 1.00 | 1.00 | 1.00 | 1.00 | 1.00 | 1.00 |
| my5651_rel.cy10a_bee | 0.96 | 0.96 | 0.99 | 0.96 | 0.95 | 0.96 |
| my5710_rel.cy10a_bee | 0.85 | 1.39 | 1.12 | 0.74 | 0.75 | 0.74 |
| my5721_rel.cy10a_bee | 0.82 | 1.35 | 1.09 | 0.72 | 0.72 | 0.72 |
| my5732_rel.cy10a_bee | 0.83 | 1.29 | 1.11 | 0.72 | 0.71 | 0.73 |
| my5743_rel.cy10a_bee | 0.80 | 1.28 | 1.08 | 0.70 | 0.70 | 0.71 |
| my8013_rel.cy10a_bee | 0.66 | 1.20 | 0.83 | 0.62 | 0.64 | 0.65 |
| my8020_rel.cy10a_bee | 0.61 | 1.16 | 0.87 | 0.60 | 0.60 | 0.61 |
| my8027_rel.cy10a_bee | 0.60 | 1.33 | 0.95 | 0.52 | 0.52 | 0.53 |
| my8034_rel.cy10a_bee | 0.53 | 1.21 | 0.83 | 0.52 | 0.52 | 0.53 |
This lists the average rate of inserts/s for the tests that do inserts concurrent with queries. For such tests the query rate is listed in the table above. The read+write tests are setup so that the insert rate should match the target rate every second. Cells that are not at least 95% of the target have a red background to indicate a failure to satisfy the target.
| dbms | q100.1 | q500.1 | q1000.1 |
|---|---|---|---|
| my5621_rel.cy10a_bee | 100 | 499 | 997 |
| my5651_rel.cy10a_bee | 100 | 498 | 997 |
| my5710_rel.cy10a_bee | 100 | 499 | 997 |
| my5721_rel.cy10a_bee | 100 | 499 | 998 |
| my5732_rel.cy10a_bee | 100 | 499 | 998 |
| my5743_rel.cy10a_bee | 100 | 499 | 997 |
| my8013_rel.cy10a_bee | 100 | 499 | 998 |
| my8020_rel.cy10a_bee | 100 | 499 | 997 |
| my8027_rel.cy10a_bee | 100 | 499 | 998 |
| my8034_rel.cy10a_bee | 100 | 499 | 998 |
| target | 100 | 500 | 1000 |
l.i0
l.i0: load without secondary indexes. Graphs for performance per 1-second interval are here.
Average throughput:
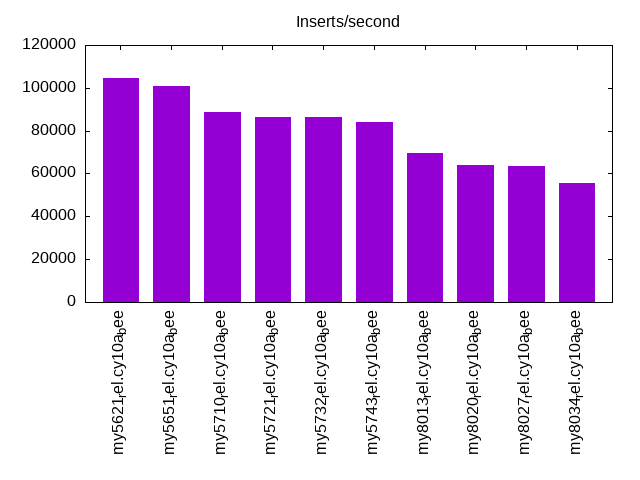
Insert response time histogram: each cell has the percentage of responses that take <= the time in the header and max is the max response time in seconds. For the max column values in the top 25% of the range have a red background and in the bottom 25% of the range have a green background. The red background is not used when the min value is within 80% of the max value.
| dbms | 256us | 1ms | 4ms | 16ms | 64ms | 256ms | 1s | 4s | 16s | gt | max |
|---|---|---|---|---|---|---|---|---|---|---|---|
| my5621_rel.cy10a_bee | 95.609 | 4.290 | 0.097 | 0.003 | 0.100 | ||||||
| my5651_rel.cy10a_bee | 93.077 | 6.814 | 0.103 | 0.002 | 0.003 | 0.100 | |||||
| my5710_rel.cy10a_bee | 24.671 | 75.035 | 0.285 | 0.005 | 0.003 | 0.102 | |||||
| my5721_rel.cy10a_bee | 5.181 | 94.522 | 0.288 | 0.006 | 0.003 | 0.104 | |||||
| my5732_rel.cy10a_bee | 10.859 | 88.797 | 0.201 | 0.139 | 0.003 | 0.109 | |||||
| my5743_rel.cy10a_bee | 3.051 | 96.596 | 0.205 | 0.145 | 0.003 | 0.103 | |||||
| my8013_rel.cy10a_bee | 99.399 | 0.497 | 0.103 | 0.061 | |||||||
| my8020_rel.cy10a_bee | 99.350 | 0.495 | 0.151 | 0.003 | 0.078 | ||||||
| my8027_rel.cy10a_bee | 99.545 | 0.309 | 0.143 | 0.003 | 0.076 | ||||||
| my8034_rel.cy10a_bee | 99.398 | 0.459 | 0.141 | 0.003 | 0.076 |
Performance metrics for the DBMS listed above. Some are normalized by throughput, others are not. Legend for results is here.
ips	qps	rps	rmbps	wps	wmbps	rpq	rkbpq	wpi	wkbpi	csps	cpups	cspq	cpupq	dbgb1	dbgb2	rss	maxop	p50	p99	tag
104712	0	921	3.6	55.0	23.9	0.009	0.035	0.001	0.234	11974	22.3	0.114	17	1.3	41.8	1.9	0.100	105919	90695	20m.my5621_rel.cy10a_bee
101010	0	884	3.5	53.0	23.0	0.009	0.035	0.001	0.233	11523	21.8	0.114	17	1.3	41.8	1.9	0.100	101591	88504	20m.my5651_rel.cy10a_bee
88889	0	0	0.0	138.1	22.5	0.000	0.000	0.002	0.259	8725	21.0	0.098	19	1.3	41.8	2.2	0.102	89541	77824	20m.my5710_rel.cy10a_bee
86207	0	0	0.0	133.6	21.9	0.000	0.000	0.002	0.260	8483	21.0	0.098	19	1.3	41.8	2.2	0.104	86705	75515	20m.my5721_rel.cy10a_bee
86580	0	0	0.0	135.2	21.9	0.000	0.000	0.002	0.259	8520	20.7	0.098	19	1.3	41.8	2.2	0.109	86886	74515	20m.my5732_rel.cy10a_bee
84034	0	0	0.0	132.5	21.4	0.000	0.000	0.002	0.261	8366	20.8	0.100	20	1.3	41.8	2.3	0.103	85161	73065	20m.my5743_rel.cy10a_bee
69444	0	0	0.0	370.5	26.4	0.000	0.000	0.005	0.389	56060	35.0	0.807	40	1.3	3.9	2.4	0.061	69523	63629	20m.my8013_rel.cy10a_bee
64102	0	0	0.0	306.4	21.7	0.000	0.000	0.005	0.347	17332	22.5	0.270	28	1.3	9.9	2.4	0.078	64242	58036	20m.my8020_rel.cy10a_bee
63291	0	0	0.0	297.3	21.4	0.000	0.000	0.005	0.346	7099	20.8	0.112	26	1.3	9.9	2.4	0.076	63535	57236	20m.my8027_rel.cy10a_bee
55710	0	0	0.0	273.9	19.3	0.000	0.000	0.005	0.355	6477	20.0	0.116	29	1.3	9.9	2.5	0.076	56053	49964	20m.my8034_rel.cy10a_bee
l.x
l.x: create secondary indexes.
Average throughput:
Performance metrics for the DBMS listed above. Some are normalized by throughput, others are not. Legend for results is here.
ips	qps	rps	rmbps	wps	wmbps	rpq	rkbpq	wpi	wkbpi	csps	cpups	cspq	cpupq	dbgb1	dbgb2	rss	maxop	p50	p99	tag
116860	0	17	0.1	1308.4	121.0	0.000	0.001	0.011	1.061	3863	11.8	0.033	8	2.7	43.2	3.1	0.010	NA	NA	20m.my5621_rel.cy10a_bee
111667	0	22	0.1	1307.8	117.5	0.000	0.001	0.012	1.078	3879	11.4	0.035	8	2.7	43.2	3.0	0.009	NA	NA	20m.my5651_rel.cy10a_bee
162097	0	0	0.0	1680.8	142.0	0.000	0.000	0.010	0.897	8871	12.3	0.055	6	3.0	43.5	3.4	0.012	NA	NA	20m.my5710_rel.cy10a_bee
158268	0	0	0.0	1662.1	140.5	0.000	0.000	0.011	0.909	9695	12.5	0.061	6	3.0	43.5	3.3	0.012	NA	NA	20m.my5721_rel.cy10a_bee
151128	0	0	0.0	1565.5	133.0	0.000	0.000	0.010	0.901	8951	12.4	0.059	7	3.0	43.5	3.2	0.019	NA	NA	20m.my5732_rel.cy10a_bee
150000	0	0	0.0	1573.0	132.8	0.000	0.000	0.010	0.907	8760	12.4	0.058	7	3.0	43.5	3.2	0.019	NA	NA	20m.my5743_rel.cy10a_bee
140559	0	0	0.0	970.4	109.7	0.000	0.000	0.007	0.800	12044	14.2	0.086	8	3.0	5.5	3.4	0.011	NA	NA	20m.my8013_rel.cy10a_bee
135811	0	0	0.0	1131.2	107.3	0.000	0.000	0.008	0.809	8199	12.2	0.060	7	3.0	11.5	3.0	0.014	NA	NA	20m.my8020_rel.cy10a_bee
155814	0	791	51.4	2243.0	150.9	0.005	0.338	0.014	0.991	9103	43.4	0.058	22	3.0	11.5	3.5	0.011	NA	NA	20m.my8027_rel.cy10a_bee
141549	0	706	45.9	2475.1	143.5	0.005	0.332	0.017	1.038	9649	42.7	0.068	24	3.0	11.5	3.0	0.012	NA	NA	20m.my8034_rel.cy10a_bee
l.i1
l.i1: continue load after secondary indexes created. Graphs for performance per 1-second interval are here.
Average throughput:
Insert response time histogram: each cell has the percentage of responses that take <= the time in the header and max is the max response time in seconds. For the max column values in the top 25% of the range have a red background and in the bottom 25% of the range have a green background. The red background is not used when the min value is within 80% of the max value.
| dbms | 256us | 1ms | 4ms | 16ms | 64ms | 256ms | 1s | 4s | 16s | gt | max |
|---|---|---|---|---|---|---|---|---|---|---|---|
| my5621_rel.cy10a_bee | 96.483 | 3.355 | 0.159 | 0.003 | 0.101 | ||||||
| my5651_rel.cy10a_bee | 96.381 | 3.458 | 0.160 | 0.002 | 0.100 | ||||||
| my5710_rel.cy10a_bee | 98.244 | 1.722 | 0.030 | 0.004 | 0.102 | ||||||
| my5721_rel.cy10a_bee | 97.947 | 2.027 | 0.023 | 0.004 | 0.094 | ||||||
| my5732_rel.cy10a_bee | 97.939 | 2.005 | 0.052 | 0.003 | 0.093 | ||||||
| my5743_rel.cy10a_bee | 97.885 | 2.057 | 0.054 | 0.003 | 0.086 | ||||||
| my8013_rel.cy10a_bee | 93.838 | 5.231 | 0.898 | 0.034 | 0.188 | ||||||
| my8020_rel.cy10a_bee | 96.658 | 2.926 | 0.382 | 0.034 | 0.173 | ||||||
| my8027_rel.cy10a_bee | 96.917 | 2.952 | 0.129 | 0.002 | 0.106 | ||||||
| my8034_rel.cy10a_bee | 95.687 | 4.135 | 0.178 | 0.001 | 0.112 |
Delete response time histogram: each cell has the percentage of responses that take <= the time in the header and max is the max response time in seconds. For the max column values in the top 25% of the range have a red background and in the bottom 25% of the range have a green background. The red background is not used when the min value is within 80% of the max value.
| dbms | 256us | 1ms | 4ms | 16ms | 64ms | 256ms | 1s | 4s | 16s | gt | max |
|---|---|---|---|---|---|---|---|---|---|---|---|
| my5621_rel.cy10a_bee | 97.378 | 2.499 | 0.120 | 0.003 | 0.083 | ||||||
| my5651_rel.cy10a_bee | 97.456 | 2.426 | 0.117 | 0.001 | 0.078 | ||||||
| my5710_rel.cy10a_bee | 98.874 | 1.112 | 0.011 | 0.003 | 0.102 | ||||||
| my5721_rel.cy10a_bee | 98.533 | 1.454 | 0.009 | 0.003 | 0.097 | ||||||
| my5732_rel.cy10a_bee | 98.484 | 1.502 | 0.010 | 0.003 | 0.094 | ||||||
| my5743_rel.cy10a_bee | 98.472 | 1.513 | 0.011 | 0.003 | 0.088 | ||||||
| my8013_rel.cy10a_bee | 95.407 | 3.963 | 0.615 | 0.015 | 0.154 | ||||||
| my8020_rel.cy10a_bee | 97.982 | 1.694 | 0.308 | 0.015 | 0.166 | ||||||
| my8027_rel.cy10a_bee | 97.769 | 2.188 | 0.041 | 0.002 | 0.108 | ||||||
| my8034_rel.cy10a_bee | 97.109 | 2.823 | 0.067 | 0.001 | 0.112 |
Performance metrics for the DBMS listed above. Some are normalized by throughput, others are not. Legend for results is here.
ips	qps	rps	rmbps	wps	wmbps	rpq	rkbpq	wpi	wkbpi	csps	cpups	cspq	cpupq	dbgb1	dbgb2	rss	maxop	p50	p99	tag
20137	0	680	2.7	992.5	55.3	0.034	0.135	0.049	2.812	14242	34.6	0.707	137	3.8	44.3	4.5	0.101	21486	5094	20m.my5621_rel.cy10a_bee
19881	0	667	2.6	972.7	54.4	0.034	0.134	0.049	2.803	14194	34.4	0.714	138	3.8	44.3	4.5	0.100	21227	4795	20m.my5651_rel.cy10a_bee
22645	0	0	0.0	1119.3	58.9	0.000	0.000	0.049	2.665	12843	38.4	0.567	136	4.5	45.0	5.5	0.102	23035	7689	20m.my5710_rel.cy10a_bee
22007	0	0	0.0	1128.7	60.0	0.000	0.000	0.051	2.791	12732	38.1	0.579	139	4.4	44.9	5.5	0.094	22525	8493	20m.my5721_rel.cy10a_bee
22272	0	0	0.0	1149.6	61.2	0.000	0.000	0.052	2.814	12618	37.8	0.567	136	4.4	44.9	5.5	0.093	22823	7542	20m.my5732_rel.cy10a_bee
21730	0	0	0.0	1130.5	59.9	0.000	0.000	0.052	2.822	12353	37.7	0.569	139	4.4	44.9	5.5	0.086	22275	7492	20m.my5743_rel.cy10a_bee
16667	0	0	0.0	5584.5	188.6	0.000	0.000	0.335	11.585	73462	47.3	4.408	227	4.0	6.6	5.2	0.188	17738	4745	20m.my8013_rel.cy10a_bee
17606	0	32	0.5	2905.3	94.8	0.002	0.030	0.165	5.512	31080	37.3	1.765	169	4.1	12.8	5.4	0.173	18530	5644	20m.my8020_rel.cy10a_bee
19069	0	35	0.6	3028.8	99.4	0.002	0.030	0.159	5.337	17752	36.7	0.931	154	4.3	13.0	5.5	0.106	19828	5742	20m.my8027_rel.cy10a_bee
16773	0	31	0.5	3619.6	118.5	0.002	0.030	0.216	7.237	18813	36.2	1.122	173	4.2	13.0	5.6	0.112	17481	4545	20m.my8034_rel.cy10a_bee
q100.1
q100.1: range queries with 100 insert/s per client. Graphs for performance per 1-second interval are here.
Average throughput:
Query response time histogram: each cell has the percentage of responses that take <= the time in the header and max is the max response time in seconds. For max values in the top 25% of the range have a red background and in the bottom 25% of the range have a green background. The red background is not used when the min value is within 80% of the max value.
| dbms | 256us | 1ms | 4ms | 16ms | 64ms | 256ms | 1s | 4s | 16s | gt | max |
|---|---|---|---|---|---|---|---|---|---|---|---|
| my5621_rel.cy10a_bee | 95.789 | 4.206 | 0.002 | 0.003 | 0.015 | ||||||
| my5651_rel.cy10a_bee | 94.855 | 5.139 | 0.003 | 0.003 | nonzero | 0.016 | |||||
| my5710_rel.cy10a_bee | 71.023 | 28.977 | nonzero | 0.003 | |||||||
| my5721_rel.cy10a_bee | 69.148 | 30.852 | nonzero | 0.002 | |||||||
| my5732_rel.cy10a_bee | 67.452 | 32.547 | 0.001 | nonzero | 0.004 | ||||||
| my5743_rel.cy10a_bee | 63.890 | 36.110 | nonzero | 0.003 | |||||||
| my8013_rel.cy10a_bee | 43.466 | 56.534 | nonzero | 0.004 | |||||||
| my8020_rel.cy10a_bee | 34.839 | 65.161 | nonzero | 0.003 | |||||||
| my8027_rel.cy10a_bee | 8.089 | 91.910 | nonzero | 0.003 | |||||||
| my8034_rel.cy10a_bee | 7.318 | 92.681 | 0.001 | 0.003 |
Insert response time histogram: each cell has the percentage of responses that take <= the time in the header and max is the max response time in seconds. For max values in the top 25% of the range have a red background and in the bottom 25% of the range have a green background. The red background is not used when the min value is within 80% of the max value.
| dbms | 256us | 1ms | 4ms | 16ms | 64ms | 256ms | 1s | 4s | 16s | gt | max |
|---|---|---|---|---|---|---|---|---|---|---|---|
| my5621_rel.cy10a_bee | 50.500 | 48.417 | 1.083 | 0.025 | |||||||
| my5651_rel.cy10a_bee | 54.917 | 44.250 | 0.833 | 0.026 | |||||||
| my5710_rel.cy10a_bee | 99.583 | 0.417 | 0.011 | ||||||||
| my5721_rel.cy10a_bee | 99.125 | 0.875 | 0.009 | ||||||||
| my5732_rel.cy10a_bee | 99.542 | 0.458 | 0.012 | ||||||||
| my5743_rel.cy10a_bee | 99.667 | 0.333 | 0.009 | ||||||||
| my8013_rel.cy10a_bee | 93.625 | 6.042 | 0.333 | 0.023 | |||||||
| my8020_rel.cy10a_bee | 97.667 | 2.333 | 0.014 | ||||||||
| my8027_rel.cy10a_bee | 99.542 | 0.458 | 0.014 | ||||||||
| my8034_rel.cy10a_bee | 99.667 | 0.292 | 0.042 | 0.016 |
Delete response time histogram: each cell has the percentage of responses that take <= the time in the header and max is the max response time in seconds. For max values in the top 25% of the range have a red background and in the bottom 25% of the range have a green background. The red background is not used when the min value is within 80% of the max value.
| dbms | 256us | 1ms | 4ms | 16ms | 64ms | 256ms | 1s | 4s | 16s | gt | max |
|---|---|---|---|---|---|---|---|---|---|---|---|
| my5621_rel.cy10a_bee | 51.958 | 47.833 | 0.208 | 0.018 | |||||||
| my5651_rel.cy10a_bee | 58.083 | 41.375 | 0.542 | 0.027 | |||||||
| my5710_rel.cy10a_bee | 99.625 | 0.375 | 0.008 | ||||||||
| my5721_rel.cy10a_bee | 99.292 | 0.708 | 0.008 | ||||||||
| my5732_rel.cy10a_bee | 99.625 | 0.375 | 0.012 | ||||||||
| my5743_rel.cy10a_bee | 99.708 | 0.292 | 0.008 | ||||||||
| my8013_rel.cy10a_bee | 95.708 | 4.167 | 0.125 | 0.018 | |||||||
| my8020_rel.cy10a_bee | 98.833 | 1.167 | 0.014 | ||||||||
| my8027_rel.cy10a_bee | 99.667 | 0.333 | 0.014 | ||||||||
| my8034_rel.cy10a_bee | 99.750 | 0.250 | 0.008 |
Performance metrics for the DBMS listed above. Some are normalized by throughput, others are not. Legend for results is here.
ips	qps	rps	rmbps	wps	wmbps	rpq	rkbpq	wpi	wkbpi	csps	cpups	cspq	cpupq	dbgb1	dbgb2	rss	maxop	p50	p99	tag
100	5533	4	0.0	716.9	21.5	0.001	0.003	7.183	220.870	23647	13.1	4.274	189	3.8	44.3	4.5	0.015	5482	5308	20m.my5621_rel.cy10a_bee
100	5296	4	0.0	696.0	20.9	0.001	0.003	6.988	215.051	22863	13.3	4.317	201	3.8	44.3	4.5	0.016	5258	5051	20m.my5651_rel.cy10a_bee
100	4104	0	0.0	64.0	1.9	0.000	0.000	0.642	19.556	16089	12.6	3.921	246	4.5	45.0	5.5	0.003	4063	3851	20m.my5710_rel.cy10a_bee
100	4009	0	0.0	54.8	1.6	0.000	0.000	0.549	16.709	15654	12.8	3.905	255	4.4	44.9	5.5	0.002	3995	3788	20m.my5721_rel.cy10a_bee
100	3958	0	0.0	48.1	1.4	0.000	0.000	0.483	14.677	15459	12.7	3.905	257	4.4	44.9	5.5	0.004	3927	3724	20m.my5732_rel.cy10a_bee
100	3854	0	0.0	55.6	1.7	0.000	0.000	0.557	17.004	15088	12.7	3.915	264	4.4	44.9	5.5	0.003	3835	3628	20m.my5743_rel.cy10a_bee
100	3438	0	0.0	330.0	9.6	0.000	0.000	3.307	98.781	15815	13.2	4.600	307	4.0	6.6	5.2	0.004	3436	3245	20m.my8013_rel.cy10a_bee
100	3321	0	0.0	132.0	3.3	0.000	0.000	1.324	33.941	13798	12.8	4.155	308	4.1	12.8	5.4	0.003	3294	3116	20m.my8020_rel.cy10a_bee
100	2871	0	0.0	149.0	3.6	0.000	0.000	1.493	37.447	11643	12.7	4.056	354	4.3	13.0	5.6	0.003	2845	2734	20m.my8027_rel.cy10a_bee
100	2860	0	0.0	212.0	5.3	0.000	0.000	2.124	54.334	11962	12.8	4.182	358	4.2	13.0	5.6	0.003	2844	2717	20m.my8034_rel.cy10a_bee
q500.1
q500.1: range queries with 500 insert/s per client. Graphs for performance per 1-second interval are here.
Average throughput:
Query response time histogram: each cell has the percentage of responses that take <= the time in the header and max is the max response time in seconds. For max values in the top 25% of the range have a red background and in the bottom 25% of the range have a green background. The red background is not used when the min value is within 80% of the max value.
| dbms | 256us | 1ms | 4ms | 16ms | 64ms | 256ms | 1s | 4s | 16s | gt | max |
|---|---|---|---|---|---|---|---|---|---|---|---|
| my5621_rel.cy10a_bee | 95.715 | 4.280 | 0.003 | 0.002 | 0.016 | ||||||
| my5651_rel.cy10a_bee | 94.373 | 5.622 | 0.003 | 0.003 | nonzero | 0.016 | |||||
| my5710_rel.cy10a_bee | 71.102 | 28.897 | 0.001 | nonzero | 0.006 | ||||||
| my5721_rel.cy10a_bee | 67.843 | 32.156 | nonzero | 0.003 | |||||||
| my5732_rel.cy10a_bee | 65.408 | 34.592 | nonzero | 0.003 | |||||||
| my5743_rel.cy10a_bee | 63.728 | 36.272 | nonzero | 0.003 | |||||||
| my8013_rel.cy10a_bee | 48.658 | 51.341 | 0.001 | nonzero | 0.008 | ||||||
| my8020_rel.cy10a_bee | 34.476 | 65.523 | nonzero | 0.003 | |||||||
| my8027_rel.cy10a_bee | 9.322 | 90.676 | 0.002 | 0.004 | |||||||
| my8034_rel.cy10a_bee | 7.191 | 92.808 | 0.001 | nonzero | 0.005 |
Insert response time histogram: each cell has the percentage of responses that take <= the time in the header and max is the max response time in seconds. For max values in the top 25% of the range have a red background and in the bottom 25% of the range have a green background. The red background is not used when the min value is within 80% of the max value.
| dbms | 256us | 1ms | 4ms | 16ms | 64ms | 256ms | 1s | 4s | 16s | gt | max |
|---|---|---|---|---|---|---|---|---|---|---|---|
| my5621_rel.cy10a_bee | 87.642 | 12.200 | 0.158 | 0.023 | |||||||
| my5651_rel.cy10a_bee | 89.375 | 10.500 | 0.125 | 0.019 | |||||||
| my5710_rel.cy10a_bee | 99.467 | 0.533 | 0.015 | ||||||||
| my5721_rel.cy10a_bee | 99.442 | 0.558 | 0.013 | ||||||||
| my5732_rel.cy10a_bee | 99.650 | 0.350 | 0.013 | ||||||||
| my5743_rel.cy10a_bee | 99.608 | 0.392 | 0.013 | ||||||||
| my8013_rel.cy10a_bee | 94.500 | 5.442 | 0.058 | 0.026 | |||||||
| my8020_rel.cy10a_bee | 97.817 | 2.150 | 0.033 | 0.040 | |||||||
| my8027_rel.cy10a_bee | 99.533 | 0.467 | 0.015 | ||||||||
| my8034_rel.cy10a_bee | 98.950 | 1.033 | 0.017 | 0.025 |
Delete response time histogram: each cell has the percentage of responses that take <= the time in the header and max is the max response time in seconds. For max values in the top 25% of the range have a red background and in the bottom 25% of the range have a green background. The red background is not used when the min value is within 80% of the max value.
| dbms | 256us | 1ms | 4ms | 16ms | 64ms | 256ms | 1s | 4s | 16s | gt | max |
|---|---|---|---|---|---|---|---|---|---|---|---|
| my5621_rel.cy10a_bee | 89.933 | 9.958 | 0.108 | 0.024 | |||||||
| my5651_rel.cy10a_bee | 90.300 | 9.642 | 0.058 | 0.029 | |||||||
| my5710_rel.cy10a_bee | 99.617 | 0.383 | 0.014 | ||||||||
| my5721_rel.cy10a_bee | 99.692 | 0.308 | 0.012 | ||||||||
| my5732_rel.cy10a_bee | 99.742 | 0.258 | 0.012 | ||||||||
| my5743_rel.cy10a_bee | 99.742 | 0.258 | 0.012 | ||||||||
| my8013_rel.cy10a_bee | 95.758 | 4.192 | 0.050 | 0.024 | |||||||
| my8020_rel.cy10a_bee | 98.442 | 1.525 | 0.033 | 0.027 | |||||||
| my8027_rel.cy10a_bee | 99.650 | 0.350 | 0.015 | ||||||||
| my8034_rel.cy10a_bee | 99.408 | 0.583 | 0.008 | 0.025 |
Performance metrics for the DBMS listed above. Some are normalized by throughput, others are not. Legend for results is here.
ips	qps	rps	rmbps	wps	wmbps	rpq	rkbpq	wpi	wkbpi	csps	cpups	cspq	cpupq	dbgb1	dbgb2	rss	maxop	p50	p99	tag
499	5519	16	0.1	1028.5	31.4	0.003	0.012	2.062	64.420	24792	13.7	4.492	199	3.8	44.3	4.5	0.016	5471	5305	20m.my5621_rel.cy10a_bee
498	5245	16	0.1	348.8	11.0	0.003	0.013	0.701	22.549	21719	13.6	4.141	207	3.8	44.3	4.5	0.016	5227	5018	20m.my5651_rel.cy10a_bee
499	4127	0	0.0	20.2	1.1	0.000	0.000	0.040	2.180	16103	13.5	3.902	262	4.5	45.0	5.6	0.006	4075	3869	20m.my5710_rel.cy10a_bee
499	3981	0	0.0	5.5	0.6	0.000	0.000	0.011	1.277	15503	13.7	3.894	275	4.4	44.9	5.5	0.003	3964	3756	20m.my5721_rel.cy10a_bee
499	3920	0	0.0	6.1	0.6	0.000	0.000	0.012	1.314	15271	13.5	3.896	276	4.4	44.9	5.5	0.003	3883	3676	20m.my5732_rel.cy10a_bee
499	3856	0	0.0	7.6	0.7	0.000	0.000	0.015	1.430	15029	13.5	3.898	280	4.4	44.9	5.5	0.003	3805	3598	20m.my5743_rel.cy10a_bee
499	3522	0	0.0	361.1	11.0	0.000	0.000	0.724	22.578	18117	14.1	5.143	320	4.0	6.6	5.2	0.008	3500	3278	20m.my8013_rel.cy10a_bee
499	3306	0	0.0	26.8	1.1	0.000	0.000	0.054	2.246	13977	13.8	4.227	334	4.1	12.8	5.4	0.003	3286	3116	20m.my8020_rel.cy10a_bee
499	2880	0	0.0	21.5	0.9	0.000	0.000	0.043	1.760	11362	13.4	3.945	372	4.3	13.0	5.6	0.004	2861	2749	20m.my8027_rel.cy10a_bee
499	2852	0	0.0	166.2	4.7	0.000	0.000	0.333	9.590	11888	13.6	4.169	382	4.2	13.0	5.6	0.005	2829	2717	20m.my8034_rel.cy10a_bee
q1000.1
q1000.1: range queries with 1000 insert/s per client. Graphs for performance per 1-second interval are here.
Average throughput:
Query response time histogram: each cell has the percentage of responses that take <= the time in the header and max is the max response time in seconds. For max values in the top 25% of the range have a red background and in the bottom 25% of the range have a green background. The red background is not used when the min value is within 80% of the max value.
| dbms | 256us | 1ms | 4ms | 16ms | 64ms | 256ms | 1s | 4s | 16s | gt | max |
|---|---|---|---|---|---|---|---|---|---|---|---|
| my5621_rel.cy10a_bee | 95.561 | 4.431 | 0.005 | 0.002 | nonzero | 0.020 | |||||
| my5651_rel.cy10a_bee | 94.666 | 5.328 | 0.002 | 0.003 | 0.010 | ||||||
| my5710_rel.cy10a_bee | 70.283 | 29.716 | 0.001 | nonzero | 0.011 | ||||||
| my5721_rel.cy10a_bee | 68.028 | 31.972 | nonzero | nonzero | 0.005 | ||||||
| my5732_rel.cy10a_bee | 68.022 | 31.977 | 0.001 | nonzero | 0.004 | ||||||
| my5743_rel.cy10a_bee | 64.810 | 35.189 | 0.001 | 0.003 | |||||||
| my8013_rel.cy10a_bee | 50.864 | 49.134 | 0.002 | nonzero | 0.005 | ||||||
| my8020_rel.cy10a_bee | 37.741 | 62.257 | 0.002 | nonzero | 0.012 | ||||||
| my8027_rel.cy10a_bee | 10.717 | 89.279 | 0.005 | nonzero | 0.005 | ||||||
| my8034_rel.cy10a_bee | 9.836 | 90.162 | 0.003 | 0.004 |
Insert response time histogram: each cell has the percentage of responses that take <= the time in the header and max is the max response time in seconds. For max values in the top 25% of the range have a red background and in the bottom 25% of the range have a green background. The red background is not used when the min value is within 80% of the max value.
| dbms | 256us | 1ms | 4ms | 16ms | 64ms | 256ms | 1s | 4s | 16s | gt | max |
|---|---|---|---|---|---|---|---|---|---|---|---|
| my5621_rel.cy10a_bee | 90.754 | 9.142 | 0.104 | 0.026 | |||||||
| my5651_rel.cy10a_bee | 94.871 | 5.079 | 0.050 | 0.018 | |||||||
| my5710_rel.cy10a_bee | 99.638 | 0.363 | 0.015 | ||||||||
| my5721_rel.cy10a_bee | 99.542 | 0.458 | 0.016 | ||||||||
| my5732_rel.cy10a_bee | 99.558 | 0.442 | 0.015 | ||||||||
| my5743_rel.cy10a_bee | 99.558 | 0.442 | 0.011 | ||||||||
| my8013_rel.cy10a_bee | 95.062 | 4.862 | 0.075 | 0.021 | |||||||
| my8020_rel.cy10a_bee | 95.650 | 4.263 | 0.088 | 0.021 | |||||||
| my8027_rel.cy10a_bee | 99.321 | 0.662 | 0.017 | 0.020 | |||||||
| my8034_rel.cy10a_bee | 96.933 | 3.042 | 0.025 | 0.026 |
Delete response time histogram: each cell has the percentage of responses that take <= the time in the header and max is the max response time in seconds. For max values in the top 25% of the range have a red background and in the bottom 25% of the range have a green background. The red background is not used when the min value is within 80% of the max value.
| dbms | 256us | 1ms | 4ms | 16ms | 64ms | 256ms | 1s | 4s | 16s | gt | max |
|---|---|---|---|---|---|---|---|---|---|---|---|
| my5621_rel.cy10a_bee | 92.050 | 7.888 | 0.062 | 0.025 | |||||||
| my5651_rel.cy10a_bee | 95.029 | 4.967 | 0.004 | 0.016 | |||||||
| my5710_rel.cy10a_bee | 99.713 | 0.287 | 0.015 | ||||||||
| my5721_rel.cy10a_bee | 99.650 | 0.350 | 0.015 | ||||||||
| my5732_rel.cy10a_bee | 99.662 | 0.338 | 0.014 | ||||||||
| my5743_rel.cy10a_bee | 99.633 | 0.367 | 0.011 | ||||||||
| my8013_rel.cy10a_bee | 95.458 | 4.496 | 0.046 | 0.024 | |||||||
| my8020_rel.cy10a_bee | 96.350 | 3.612 | 0.037 | 0.023 | |||||||
| my8027_rel.cy10a_bee | 99.617 | 0.379 | 0.004 | 0.021 | |||||||
| my8034_rel.cy10a_bee | 99.279 | 0.700 | 0.021 | 0.025 |
Performance metrics for the DBMS listed above. Some are normalized by throughput, others are not. Legend for results is here.
ips	qps	rps	rmbps	wps	wmbps	rpq	rkbpq	wpi	wkbpi	csps	cpups	cspq	cpupq	dbgb1	dbgb2	rss	maxop	p50	p99	tag
997	5505	33	0.1	1169.5	36.1	0.006	0.024	1.173	37.095	25390	14.8	4.612	215	3.8	44.3	4.5	0.020	5466	5273	20m.my5621_rel.cy10a_bee
997	5285	33	0.1	3.7	1.1	0.006	0.025	0.004	1.088	20967	14.6	3.967	221	3.8	44.3	4.5	0.010	5243	5052	20m.my5651_rel.cy10a_bee
997	4087	0	0.0	12.7	1.3	0.000	0.000	0.013	1.370	16112	14.6	3.943	286	4.5	45.0	5.6	0.011	4044	3836	20m.my5710_rel.cy10a_bee
998	3988	0	0.0	40.3	2.0	0.000	0.000	0.040	2.045	15840	14.9	3.972	299	4.4	44.9	5.5	0.005	3965	3772	20m.my5721_rel.cy10a_bee
998	3992	0	0.0	50.4	2.2	0.000	0.000	0.051	2.297	15896	14.7	3.982	295	4.4	44.9	5.5	0.004	3932	3709	20m.my5732_rel.cy10a_bee
997	3885	0	0.0	51.5	2.3	0.000	0.000	0.052	2.340	15502	14.8	3.991	305	4.4	44.9	5.5	0.003	3853	3644	20m.my5743_rel.cy10a_bee
998	3568	0	0.0	641.2	20.0	0.000	0.000	0.643	20.502	21523	15.7	6.032	352	4.0	6.6	5.2	0.005	3532	3292	20m.my8013_rel.cy10a_bee
997	3362	0	0.0	313.1	8.7	0.000	0.000	0.314	8.899	15531	15.3	4.620	364	4.1	12.8	5.4	0.012	3340	3103	20m.my8020_rel.cy10a_bee
998	2897	0	0.0	324.4	9.0	0.000	0.000	0.325	9.242	12566	14.5	4.338	400	4.3	13.0	5.6	0.005	2877	2747	20m.my8027_rel.cy10a_bee
998	2891	0	0.0	357.2	10.1	0.000	0.000	0.358	10.385	12810	15.0	4.431	415	4.2	13.0	5.6	0.004	2862	2733	20m.my8034_rel.cy10a_bee
l.i0
l.i0: load without secondary indexes
Performance metrics for all DBMS, not just the ones listed above. Some are normalized by throughput, others are not. Legend for results is here.
ips	qps	rps	rmbps	wps	wmbps	rpq	rkbpq	wpi	wkbpi	csps	cpups	cspq	cpupq	dbgb1	dbgb2	rss	maxop	p50	p99	tag
104712	0	921	3.6	55.0	23.9	0.009	0.035	0.001	0.234	11974	22.3	0.114	17	1.3	41.8	1.9	0.100	105919	90695	20m.my5621_rel.cy10a_bee
101010	0	884	3.5	53.0	23.0	0.009	0.035	0.001	0.233	11523	21.8	0.114	17	1.3	41.8	1.9	0.100	101591	88504	20m.my5651_rel.cy10a_bee
88889	0	0	0.0	138.1	22.5	0.000	0.000	0.002	0.259	8725	21.0	0.098	19	1.3	41.8	2.2	0.102	89541	77824	20m.my5710_rel.cy10a_bee
86207	0	0	0.0	133.6	21.9	0.000	0.000	0.002	0.260	8483	21.0	0.098	19	1.3	41.8	2.2	0.104	86705	75515	20m.my5721_rel.cy10a_bee
86580	0	0	0.0	135.2	21.9	0.000	0.000	0.002	0.259	8520	20.7	0.098	19	1.3	41.8	2.2	0.109	86886	74515	20m.my5732_rel.cy10a_bee
84034	0	0	0.0	132.5	21.4	0.000	0.000	0.002	0.261	8366	20.8	0.100	20	1.3	41.8	2.3	0.103	85161	73065	20m.my5743_rel.cy10a_bee
69444	0	0	0.0	370.5	26.4	0.000	0.000	0.005	0.389	56060	35.0	0.807	40	1.3	3.9	2.4	0.061	69523	63629	20m.my8013_rel.cy10a_bee
64102	0	0	0.0	306.4	21.7	0.000	0.000	0.005	0.347	17332	22.5	0.270	28	1.3	9.9	2.4	0.078	64242	58036	20m.my8020_rel.cy10a_bee
63291	0	0	0.0	297.3	21.4	0.000	0.000	0.005	0.346	7099	20.8	0.112	26	1.3	9.9	2.4	0.076	63535	57236	20m.my8027_rel.cy10a_bee
55710	0	0	0.0	273.9	19.3	0.000	0.000	0.005	0.355	6477	20.0	0.116	29	1.3	9.9	2.5	0.076	56053	49964	20m.my8034_rel.cy10a_bee
l.x
l.x: create secondary indexes
Performance metrics for all DBMS, not just the ones listed above. Some are normalized by throughput, others are not. Legend for results is here.
ips	qps	rps	rmbps	wps	wmbps	rpq	rkbpq	wpi	wkbpi	csps	cpups	cspq	cpupq	dbgb1	dbgb2	rss	maxop	p50	p99	tag
116860	0	17	0.1	1308.4	121.0	0.000	0.001	0.011	1.061	3863	11.8	0.033	8	2.7	43.2	3.1	0.010	NA	NA	20m.my5621_rel.cy10a_bee
111667	0	22	0.1	1307.8	117.5	0.000	0.001	0.012	1.078	3879	11.4	0.035	8	2.7	43.2	3.0	0.009	NA	NA	20m.my5651_rel.cy10a_bee
162097	0	0	0.0	1680.8	142.0	0.000	0.000	0.010	0.897	8871	12.3	0.055	6	3.0	43.5	3.4	0.012	NA	NA	20m.my5710_rel.cy10a_bee
158268	0	0	0.0	1662.1	140.5	0.000	0.000	0.011	0.909	9695	12.5	0.061	6	3.0	43.5	3.3	0.012	NA	NA	20m.my5721_rel.cy10a_bee
151128	0	0	0.0	1565.5	133.0	0.000	0.000	0.010	0.901	8951	12.4	0.059	7	3.0	43.5	3.2	0.019	NA	NA	20m.my5732_rel.cy10a_bee
150000	0	0	0.0	1573.0	132.8	0.000	0.000	0.010	0.907	8760	12.4	0.058	7	3.0	43.5	3.2	0.019	NA	NA	20m.my5743_rel.cy10a_bee
140559	0	0	0.0	970.4	109.7	0.000	0.000	0.007	0.800	12044	14.2	0.086	8	3.0	5.5	3.4	0.011	NA	NA	20m.my8013_rel.cy10a_bee
135811	0	0	0.0	1131.2	107.3	0.000	0.000	0.008	0.809	8199	12.2	0.060	7	3.0	11.5	3.0	0.014	NA	NA	20m.my8020_rel.cy10a_bee
155814	0	791	51.4	2243.0	150.9	0.005	0.338	0.014	0.991	9103	43.4	0.058	22	3.0	11.5	3.5	0.011	NA	NA	20m.my8027_rel.cy10a_bee
141549	0	706	45.9	2475.1	143.5	0.005	0.332	0.017	1.038	9649	42.7	0.068	24	3.0	11.5	3.0	0.012	NA	NA	20m.my8034_rel.cy10a_bee
l.i1
l.i1: continue load after secondary indexes created
Performance metrics for all DBMS, not just the ones listed above. Some are normalized by throughput, others are not. Legend for results is here.
ips	qps	rps	rmbps	wps	wmbps	rpq	rkbpq	wpi	wkbpi	csps	cpups	cspq	cpupq	dbgb1	dbgb2	rss	maxop	p50	p99	tag
20137	0	680	2.7	992.5	55.3	0.034	0.135	0.049	2.812	14242	34.6	0.707	137	3.8	44.3	4.5	0.101	21486	5094	20m.my5621_rel.cy10a_bee
19881	0	667	2.6	972.7	54.4	0.034	0.134	0.049	2.803	14194	34.4	0.714	138	3.8	44.3	4.5	0.100	21227	4795	20m.my5651_rel.cy10a_bee
22645	0	0	0.0	1119.3	58.9	0.000	0.000	0.049	2.665	12843	38.4	0.567	136	4.5	45.0	5.5	0.102	23035	7689	20m.my5710_rel.cy10a_bee
22007	0	0	0.0	1128.7	60.0	0.000	0.000	0.051	2.791	12732	38.1	0.579	139	4.4	44.9	5.5	0.094	22525	8493	20m.my5721_rel.cy10a_bee
22272	0	0	0.0	1149.6	61.2	0.000	0.000	0.052	2.814	12618	37.8	0.567	136	4.4	44.9	5.5	0.093	22823	7542	20m.my5732_rel.cy10a_bee
21730	0	0	0.0	1130.5	59.9	0.000	0.000	0.052	2.822	12353	37.7	0.569	139	4.4	44.9	5.5	0.086	22275	7492	20m.my5743_rel.cy10a_bee
16667	0	0	0.0	5584.5	188.6	0.000	0.000	0.335	11.585	73462	47.3	4.408	227	4.0	6.6	5.2	0.188	17738	4745	20m.my8013_rel.cy10a_bee
17606	0	32	0.5	2905.3	94.8	0.002	0.030	0.165	5.512	31080	37.3	1.765	169	4.1	12.8	5.4	0.173	18530	5644	20m.my8020_rel.cy10a_bee
19069	0	35	0.6	3028.8	99.4	0.002	0.030	0.159	5.337	17752	36.7	0.931	154	4.3	13.0	5.5	0.106	19828	5742	20m.my8027_rel.cy10a_bee
16773	0	31	0.5	3619.6	118.5	0.002	0.030	0.216	7.237	18813	36.2	1.122	173	4.2	13.0	5.6	0.112	17481	4545	20m.my8034_rel.cy10a_bee
q100.1
q100.1: range queries with 100 insert/s per client
Performance metrics for all DBMS, not just the ones listed above. Some are normalized by throughput, others are not. Legend for results is here.
ips	qps	rps	rmbps	wps	wmbps	rpq	rkbpq	wpi	wkbpi	csps	cpups	cspq	cpupq	dbgb1	dbgb2	rss	maxop	p50	p99	tag
100	5533	4	0.0	716.9	21.5	0.001	0.003	7.183	220.870	23647	13.1	4.274	189	3.8	44.3	4.5	0.015	5482	5308	20m.my5621_rel.cy10a_bee
100	5296	4	0.0	696.0	20.9	0.001	0.003	6.988	215.051	22863	13.3	4.317	201	3.8	44.3	4.5	0.016	5258	5051	20m.my5651_rel.cy10a_bee
100	4104	0	0.0	64.0	1.9	0.000	0.000	0.642	19.556	16089	12.6	3.921	246	4.5	45.0	5.5	0.003	4063	3851	20m.my5710_rel.cy10a_bee
100	4009	0	0.0	54.8	1.6	0.000	0.000	0.549	16.709	15654	12.8	3.905	255	4.4	44.9	5.5	0.002	3995	3788	20m.my5721_rel.cy10a_bee
100	3958	0	0.0	48.1	1.4	0.000	0.000	0.483	14.677	15459	12.7	3.905	257	4.4	44.9	5.5	0.004	3927	3724	20m.my5732_rel.cy10a_bee
100	3854	0	0.0	55.6	1.7	0.000	0.000	0.557	17.004	15088	12.7	3.915	264	4.4	44.9	5.5	0.003	3835	3628	20m.my5743_rel.cy10a_bee
100	3438	0	0.0	330.0	9.6	0.000	0.000	3.307	98.781	15815	13.2	4.600	307	4.0	6.6	5.2	0.004	3436	3245	20m.my8013_rel.cy10a_bee
100	3321	0	0.0	132.0	3.3	0.000	0.000	1.324	33.941	13798	12.8	4.155	308	4.1	12.8	5.4	0.003	3294	3116	20m.my8020_rel.cy10a_bee
100	2871	0	0.0	149.0	3.6	0.000	0.000	1.493	37.447	11643	12.7	4.056	354	4.3	13.0	5.6	0.003	2845	2734	20m.my8027_rel.cy10a_bee
100	2860	0	0.0	212.0	5.3	0.000	0.000	2.124	54.334	11962	12.8	4.182	358	4.2	13.0	5.6	0.003	2844	2717	20m.my8034_rel.cy10a_bee
q500.1
q500.1: range queries with 500 insert/s per client
Performance metrics for all DBMS, not just the ones listed above. Some are normalized by throughput, others are not. Legend for results is here.
ips	qps	rps	rmbps	wps	wmbps	rpq	rkbpq	wpi	wkbpi	csps	cpups	cspq	cpupq	dbgb1	dbgb2	rss	maxop	p50	p99	tag
499	5519	16	0.1	1028.5	31.4	0.003	0.012	2.062	64.420	24792	13.7	4.492	199	3.8	44.3	4.5	0.016	5471	5305	20m.my5621_rel.cy10a_bee
498	5245	16	0.1	348.8	11.0	0.003	0.013	0.701	22.549	21719	13.6	4.141	207	3.8	44.3	4.5	0.016	5227	5018	20m.my5651_rel.cy10a_bee
499	4127	0	0.0	20.2	1.1	0.000	0.000	0.040	2.180	16103	13.5	3.902	262	4.5	45.0	5.6	0.006	4075	3869	20m.my5710_rel.cy10a_bee
499	3981	0	0.0	5.5	0.6	0.000	0.000	0.011	1.277	15503	13.7	3.894	275	4.4	44.9	5.5	0.003	3964	3756	20m.my5721_rel.cy10a_bee
499	3920	0	0.0	6.1	0.6	0.000	0.000	0.012	1.314	15271	13.5	3.896	276	4.4	44.9	5.5	0.003	3883	3676	20m.my5732_rel.cy10a_bee
499	3856	0	0.0	7.6	0.7	0.000	0.000	0.015	1.430	15029	13.5	3.898	280	4.4	44.9	5.5	0.003	3805	3598	20m.my5743_rel.cy10a_bee
499	3522	0	0.0	361.1	11.0	0.000	0.000	0.724	22.578	18117	14.1	5.143	320	4.0	6.6	5.2	0.008	3500	3278	20m.my8013_rel.cy10a_bee
499	3306	0	0.0	26.8	1.1	0.000	0.000	0.054	2.246	13977	13.8	4.227	334	4.1	12.8	5.4	0.003	3286	3116	20m.my8020_rel.cy10a_bee
499	2880	0	0.0	21.5	0.9	0.000	0.000	0.043	1.760	11362	13.4	3.945	372	4.3	13.0	5.6	0.004	2861	2749	20m.my8027_rel.cy10a_bee
499	2852	0	0.0	166.2	4.7	0.000	0.000	0.333	9.590	11888	13.6	4.169	382	4.2	13.0	5.6	0.005	2829	2717	20m.my8034_rel.cy10a_bee
q1000.1
q1000.1: range queries with 1000 insert/s per client
Performance metrics for all DBMS, not just the ones listed above. Some are normalized by throughput, others are not. Legend for results is here.
ips	qps	rps	rmbps	wps	wmbps	rpq	rkbpq	wpi	wkbpi	csps	cpups	cspq	cpupq	dbgb1	dbgb2	rss	maxop	p50	p99	tag
997	5505	33	0.1	1169.5	36.1	0.006	0.024	1.173	37.095	25390	14.8	4.612	215	3.8	44.3	4.5	0.020	5466	5273	20m.my5621_rel.cy10a_bee
997	5285	33	0.1	3.7	1.1	0.006	0.025	0.004	1.088	20967	14.6	3.967	221	3.8	44.3	4.5	0.010	5243	5052	20m.my5651_rel.cy10a_bee
997	4087	0	0.0	12.7	1.3	0.000	0.000	0.013	1.370	16112	14.6	3.943	286	4.5	45.0	5.6	0.011	4044	3836	20m.my5710_rel.cy10a_bee
998	3988	0	0.0	40.3	2.0	0.000	0.000	0.040	2.045	15840	14.9	3.972	299	4.4	44.9	5.5	0.005	3965	3772	20m.my5721_rel.cy10a_bee
998	3992	0	0.0	50.4	2.2	0.000	0.000	0.051	2.297	15896	14.7	3.982	295	4.4	44.9	5.5	0.004	3932	3709	20m.my5732_rel.cy10a_bee
997	3885	0	0.0	51.5	2.3	0.000	0.000	0.052	2.340	15502	14.8	3.991	305	4.4	44.9	5.5	0.003	3853	3644	20m.my5743_rel.cy10a_bee
998	3568	0	0.0	641.2	20.0	0.000	0.000	0.643	20.502	21523	15.7	6.032	352	4.0	6.6	5.2	0.005	3532	3292	20m.my8013_rel.cy10a_bee
997	3362	0	0.0	313.1	8.7	0.000	0.000	0.314	8.899	15531	15.3	4.620	364	4.1	12.8	5.4	0.012	3340	3103	20m.my8020_rel.cy10a_bee
998	2897	0	0.0	324.4	9.0	0.000	0.000	0.325	9.242	12566	14.5	4.338	400	4.3	13.0	5.6	0.005	2877	2747	20m.my8027_rel.cy10a_bee
998	2891	0	0.0	357.2	10.1	0.000	0.000	0.358	10.385	12810	15.0	4.431	415	4.2	13.0	5.6	0.004	2862	2733	20m.my8034_rel.cy10a_bee
l.i0
- l.i0: load without secondary indexes
- Legend for results is here.
- Each entry lists the percentage of responses that fit in that bucket (slower than max time for previous bucket, faster than min time for next bucket).
Insert response time histogram
256us	1ms	4ms	16ms	64ms	256ms	1s	4s	16s	gt	max	tag
0.000	95.609	4.290	0.097	0.000	0.003	0.000	0.000	0.000	0.000	0.100	my5621_rel.cy10a_bee
0.000	93.077	6.814	0.103	0.002	0.003	0.000	0.000	0.000	0.000	0.100	my5651_rel.cy10a_bee
0.000	24.671	75.035	0.285	0.005	0.003	0.000	0.000	0.000	0.000	0.102	my5710_rel.cy10a_bee
0.000	5.181	94.522	0.288	0.006	0.003	0.000	0.000	0.000	0.000	0.104	my5721_rel.cy10a_bee
0.000	10.859	88.797	0.201	0.139	0.003	0.000	0.000	0.000	0.000	0.109	my5732_rel.cy10a_bee
0.000	3.051	96.596	0.205	0.145	0.003	0.000	0.000	0.000	0.000	0.103	my5743_rel.cy10a_bee
0.000	0.000	99.399	0.497	0.103	0.000	0.000	0.000	0.000	0.000	0.061	my8013_rel.cy10a_bee
0.000	0.000	99.350	0.495	0.151	0.003	0.000	0.000	0.000	0.000	0.078	my8020_rel.cy10a_bee
0.000	0.000	99.545	0.309	0.143	0.003	0.000	0.000	0.000	0.000	0.076	my8027_rel.cy10a_bee
0.000	0.000	99.398	0.459	0.141	0.003	0.000	0.000	0.000	0.000	0.076	my8034_rel.cy10a_bee
l.x
- l.x: create secondary indexes
- Legend for results is here.
- Each entry lists the percentage of responses that fit in that bucket (slower than max time for previous bucket, faster than min time for next bucket).
TODO - determine whether there is data for create index response time
l.i1
- l.i1: continue load after secondary indexes created
- Legend for results is here.
- Each entry lists the percentage of responses that fit in that bucket (slower than max time for previous bucket, faster than min time for next bucket).
Insert response time histogram
256us	1ms	4ms	16ms	64ms	256ms	1s	4s	16s	gt	max	tag
0.000	0.000	96.483	3.355	0.159	0.003	0.000	0.000	0.000	0.000	0.101	my5621_rel.cy10a_bee
0.000	0.000	96.381	3.458	0.160	0.002	0.000	0.000	0.000	0.000	0.100	my5651_rel.cy10a_bee
0.000	0.000	98.244	1.722	0.030	0.004	0.000	0.000	0.000	0.000	0.102	my5710_rel.cy10a_bee
0.000	0.000	97.947	2.027	0.023	0.004	0.000	0.000	0.000	0.000	0.094	my5721_rel.cy10a_bee
0.000	0.000	97.939	2.005	0.052	0.003	0.000	0.000	0.000	0.000	0.093	my5732_rel.cy10a_bee
0.000	0.000	97.885	2.057	0.054	0.003	0.000	0.000	0.000	0.000	0.086	my5743_rel.cy10a_bee
0.000	0.000	93.838	5.231	0.898	0.034	0.000	0.000	0.000	0.000	0.188	my8013_rel.cy10a_bee
0.000	0.000	96.658	2.926	0.382	0.034	0.000	0.000	0.000	0.000	0.173	my8020_rel.cy10a_bee
0.000	0.000	96.917	2.952	0.129	0.002	0.000	0.000	0.000	0.000	0.106	my8027_rel.cy10a_bee
0.000	0.000	95.687	4.135	0.178	0.001	0.000	0.000	0.000	0.000	0.112	my8034_rel.cy10a_bee
Delete response time histogram
256us	1ms	4ms	16ms	64ms	256ms	1s	4s	16s	gt	max	tag
0.000	0.000	97.378	2.499	0.120	0.003	0.000	0.000	0.000	0.000	0.083	my5621_rel.cy10a_bee
0.000	0.000	97.456	2.426	0.117	0.001	0.000	0.000	0.000	0.000	0.078	my5651_rel.cy10a_bee
0.000	0.000	98.874	1.112	0.011	0.003	0.000	0.000	0.000	0.000	0.102	my5710_rel.cy10a_bee
0.000	0.000	98.533	1.454	0.009	0.003	0.000	0.000	0.000	0.000	0.097	my5721_rel.cy10a_bee
0.000	0.000	98.484	1.502	0.010	0.003	0.000	0.000	0.000	0.000	0.094	my5732_rel.cy10a_bee
0.000	0.000	98.472	1.513	0.011	0.003	0.000	0.000	0.000	0.000	0.088	my5743_rel.cy10a_bee
0.000	0.000	95.407	3.963	0.615	0.015	0.000	0.000	0.000	0.000	0.154	my8013_rel.cy10a_bee
0.000	0.000	97.982	1.694	0.308	0.015	0.000	0.000	0.000	0.000	0.166	my8020_rel.cy10a_bee
0.000	0.000	97.769	2.188	0.041	0.002	0.000	0.000	0.000	0.000	0.108	my8027_rel.cy10a_bee
0.000	0.000	97.109	2.823	0.067	0.001	0.000	0.000	0.000	0.000	0.112	my8034_rel.cy10a_bee
q100.1
- q100.1: range queries with 100 insert/s per client
- Legend for results is here.
- Each entry lists the percentage of responses that fit in that bucket (slower than max time for previous bucket, faster than min time for next bucket).
Query response time histogram
256us	1ms	4ms	16ms	64ms	256ms	1s	4s	16s	gt	max	tag
95.789	4.206	0.002	0.003	0.000	0.000	0.000	0.000	0.000	0.000	0.015	my5621_rel.cy10a_bee
94.855	5.139	0.003	0.003	nonzero	0.000	0.000	0.000	0.000	0.000	0.016	my5651_rel.cy10a_bee
71.023	28.977	nonzero	0.000	0.000	0.000	0.000	0.000	0.000	0.000	0.003	my5710_rel.cy10a_bee
69.148	30.852	nonzero	0.000	0.000	0.000	0.000	0.000	0.000	0.000	0.002	my5721_rel.cy10a_bee
67.452	32.547	0.001	nonzero	0.000	0.000	0.000	0.000	0.000	0.000	0.004	my5732_rel.cy10a_bee
63.890	36.110	nonzero	0.000	0.000	0.000	0.000	0.000	0.000	0.000	0.003	my5743_rel.cy10a_bee
43.466	56.534	nonzero	0.000	0.000	0.000	0.000	0.000	0.000	0.000	0.004	my8013_rel.cy10a_bee
34.839	65.161	nonzero	0.000	0.000	0.000	0.000	0.000	0.000	0.000	0.003	my8020_rel.cy10a_bee
8.089	91.910	nonzero	0.000	0.000	0.000	0.000	0.000	0.000	0.000	0.003	my8027_rel.cy10a_bee
7.318	92.681	0.001	0.000	0.000	0.000	0.000	0.000	0.000	0.000	0.003	my8034_rel.cy10a_bee
Insert response time histogram
256us	1ms	4ms	16ms	64ms	256ms	1s	4s	16s	gt	max	tag
0.000	0.000	50.500	48.417	1.083	0.000	0.000	0.000	0.000	0.000	0.025	my5621_rel.cy10a_bee
0.000	0.000	54.917	44.250	0.833	0.000	0.000	0.000	0.000	0.000	0.026	my5651_rel.cy10a_bee
0.000	0.000	99.583	0.417	0.000	0.000	0.000	0.000	0.000	0.000	0.011	my5710_rel.cy10a_bee
0.000	0.000	99.125	0.875	0.000	0.000	0.000	0.000	0.000	0.000	0.009	my5721_rel.cy10a_bee
0.000	0.000	99.542	0.458	0.000	0.000	0.000	0.000	0.000	0.000	0.012	my5732_rel.cy10a_bee
0.000	0.000	99.667	0.333	0.000	0.000	0.000	0.000	0.000	0.000	0.009	my5743_rel.cy10a_bee
0.000	0.000	93.625	6.042	0.333	0.000	0.000	0.000	0.000	0.000	0.023	my8013_rel.cy10a_bee
0.000	0.000	97.667	2.333	0.000	0.000	0.000	0.000	0.000	0.000	0.014	my8020_rel.cy10a_bee
0.000	0.000	99.542	0.458	0.000	0.000	0.000	0.000	0.000	0.000	0.014	my8027_rel.cy10a_bee
0.000	0.000	99.667	0.292	0.042	0.000	0.000	0.000	0.000	0.000	0.016	my8034_rel.cy10a_bee
Delete response time histogram
256us	1ms	4ms	16ms	64ms	256ms	1s	4s	16s	gt	max	tag
0.000	0.000	51.958	47.833	0.208	0.000	0.000	0.000	0.000	0.000	0.018	my5621_rel.cy10a_bee
0.000	0.000	58.083	41.375	0.542	0.000	0.000	0.000	0.000	0.000	0.027	my5651_rel.cy10a_bee
0.000	0.000	99.625	0.375	0.000	0.000	0.000	0.000	0.000	0.000	0.008	my5710_rel.cy10a_bee
0.000	0.000	99.292	0.708	0.000	0.000	0.000	0.000	0.000	0.000	0.008	my5721_rel.cy10a_bee
0.000	0.000	99.625	0.375	0.000	0.000	0.000	0.000	0.000	0.000	0.012	my5732_rel.cy10a_bee
0.000	0.000	99.708	0.292	0.000	0.000	0.000	0.000	0.000	0.000	0.008	my5743_rel.cy10a_bee
0.000	0.000	95.708	4.167	0.125	0.000	0.000	0.000	0.000	0.000	0.018	my8013_rel.cy10a_bee
0.000	0.000	98.833	1.167	0.000	0.000	0.000	0.000	0.000	0.000	0.014	my8020_rel.cy10a_bee
0.000	0.000	99.667	0.333	0.000	0.000	0.000	0.000	0.000	0.000	0.014	my8027_rel.cy10a_bee
0.000	0.000	99.750	0.250	0.000	0.000	0.000	0.000	0.000	0.000	0.008	my8034_rel.cy10a_bee
q500.1
- q500.1: range queries with 500 insert/s per client
- Legend for results is here.
- Each entry lists the percentage of responses that fit in that bucket (slower than max time for previous bucket, faster than min time for next bucket).
Query response time histogram
256us	1ms	4ms	16ms	64ms	256ms	1s	4s	16s	gt	max	tag
95.715	4.280	0.003	0.002	0.000	0.000	0.000	0.000	0.000	0.000	0.016	my5621_rel.cy10a_bee
94.373	5.622	0.003	0.003	nonzero	0.000	0.000	0.000	0.000	0.000	0.016	my5651_rel.cy10a_bee
71.102	28.897	0.001	nonzero	0.000	0.000	0.000	0.000	0.000	0.000	0.006	my5710_rel.cy10a_bee
67.843	32.156	nonzero	0.000	0.000	0.000	0.000	0.000	0.000	0.000	0.003	my5721_rel.cy10a_bee
65.408	34.592	nonzero	0.000	0.000	0.000	0.000	0.000	0.000	0.000	0.003	my5732_rel.cy10a_bee
63.728	36.272	nonzero	0.000	0.000	0.000	0.000	0.000	0.000	0.000	0.003	my5743_rel.cy10a_bee
48.658	51.341	0.001	nonzero	0.000	0.000	0.000	0.000	0.000	0.000	0.008	my8013_rel.cy10a_bee
34.476	65.523	nonzero	0.000	0.000	0.000	0.000	0.000	0.000	0.000	0.003	my8020_rel.cy10a_bee
9.322	90.676	0.002	0.000	0.000	0.000	0.000	0.000	0.000	0.000	0.004	my8027_rel.cy10a_bee
7.191	92.808	0.001	nonzero	0.000	0.000	0.000	0.000	0.000	0.000	0.005	my8034_rel.cy10a_bee
Insert response time histogram
256us	1ms	4ms	16ms	64ms	256ms	1s	4s	16s	gt	max	tag
0.000	0.000	87.642	12.200	0.158	0.000	0.000	0.000	0.000	0.000	0.023	my5621_rel.cy10a_bee
0.000	0.000	89.375	10.500	0.125	0.000	0.000	0.000	0.000	0.000	0.019	my5651_rel.cy10a_bee
0.000	0.000	99.467	0.533	0.000	0.000	0.000	0.000	0.000	0.000	0.015	my5710_rel.cy10a_bee
0.000	0.000	99.442	0.558	0.000	0.000	0.000	0.000	0.000	0.000	0.013	my5721_rel.cy10a_bee
0.000	0.000	99.650	0.350	0.000	0.000	0.000	0.000	0.000	0.000	0.013	my5732_rel.cy10a_bee
0.000	0.000	99.608	0.392	0.000	0.000	0.000	0.000	0.000	0.000	0.013	my5743_rel.cy10a_bee
0.000	0.000	94.500	5.442	0.058	0.000	0.000	0.000	0.000	0.000	0.026	my8013_rel.cy10a_bee
0.000	0.000	97.817	2.150	0.033	0.000	0.000	0.000	0.000	0.000	0.040	my8020_rel.cy10a_bee
0.000	0.000	99.533	0.467	0.000	0.000	0.000	0.000	0.000	0.000	0.015	my8027_rel.cy10a_bee
0.000	0.000	98.950	1.033	0.017	0.000	0.000	0.000	0.000	0.000	0.025	my8034_rel.cy10a_bee
Delete response time histogram
256us	1ms	4ms	16ms	64ms	256ms	1s	4s	16s	gt	max	tag
0.000	0.000	89.933	9.958	0.108	0.000	0.000	0.000	0.000	0.000	0.024	my5621_rel.cy10a_bee
0.000	0.000	90.300	9.642	0.058	0.000	0.000	0.000	0.000	0.000	0.029	my5651_rel.cy10a_bee
0.000	0.000	99.617	0.383	0.000	0.000	0.000	0.000	0.000	0.000	0.014	my5710_rel.cy10a_bee
0.000	0.000	99.692	0.308	0.000	0.000	0.000	0.000	0.000	0.000	0.012	my5721_rel.cy10a_bee
0.000	0.000	99.742	0.258	0.000	0.000	0.000	0.000	0.000	0.000	0.012	my5732_rel.cy10a_bee
0.000	0.000	99.742	0.258	0.000	0.000	0.000	0.000	0.000	0.000	0.012	my5743_rel.cy10a_bee
0.000	0.000	95.758	4.192	0.050	0.000	0.000	0.000	0.000	0.000	0.024	my8013_rel.cy10a_bee
0.000	0.000	98.442	1.525	0.033	0.000	0.000	0.000	0.000	0.000	0.027	my8020_rel.cy10a_bee
0.000	0.000	99.650	0.350	0.000	0.000	0.000	0.000	0.000	0.000	0.015	my8027_rel.cy10a_bee
0.000	0.000	99.408	0.583	0.008	0.000	0.000	0.000	0.000	0.000	0.025	my8034_rel.cy10a_bee
q1000.1
- q1000.1: range queries with 1000 insert/s per client
- Legend for results is here.
- Each entry lists the percentage of responses that fit in that bucket (slower than max time for previous bucket, faster than min time for next bucket).
Query response time histogram
256us	1ms	4ms	16ms	64ms	256ms	1s	4s	16s	gt	max	tag
95.561	4.431	0.005	0.002	nonzero	0.000	0.000	0.000	0.000	0.000	0.020	my5621_rel.cy10a_bee
94.666	5.328	0.002	0.003	0.000	0.000	0.000	0.000	0.000	0.000	0.010	my5651_rel.cy10a_bee
70.283	29.716	0.001	nonzero	0.000	0.000	0.000	0.000	0.000	0.000	0.011	my5710_rel.cy10a_bee
68.028	31.972	nonzero	nonzero	0.000	0.000	0.000	0.000	0.000	0.000	0.005	my5721_rel.cy10a_bee
68.022	31.977	0.001	nonzero	0.000	0.000	0.000	0.000	0.000	0.000	0.004	my5732_rel.cy10a_bee
64.810	35.189	0.001	0.000	0.000	0.000	0.000	0.000	0.000	0.000	0.003	my5743_rel.cy10a_bee
50.864	49.134	0.002	nonzero	0.000	0.000	0.000	0.000	0.000	0.000	0.005	my8013_rel.cy10a_bee
37.741	62.257	0.002	nonzero	0.000	0.000	0.000	0.000	0.000	0.000	0.012	my8020_rel.cy10a_bee
10.717	89.279	0.005	nonzero	0.000	0.000	0.000	0.000	0.000	0.000	0.005	my8027_rel.cy10a_bee
9.836	90.162	0.003	0.000	0.000	0.000	0.000	0.000	0.000	0.000	0.004	my8034_rel.cy10a_bee
Insert response time histogram
256us	1ms	4ms	16ms	64ms	256ms	1s	4s	16s	gt	max	tag
0.000	0.000	90.754	9.142	0.104	0.000	0.000	0.000	0.000	0.000	0.026	my5621_rel.cy10a_bee
0.000	0.000	94.871	5.079	0.050	0.000	0.000	0.000	0.000	0.000	0.018	my5651_rel.cy10a_bee
0.000	0.000	99.638	0.363	0.000	0.000	0.000	0.000	0.000	0.000	0.015	my5710_rel.cy10a_bee
0.000	0.000	99.542	0.458	0.000	0.000	0.000	0.000	0.000	0.000	0.016	my5721_rel.cy10a_bee
0.000	0.000	99.558	0.442	0.000	0.000	0.000	0.000	0.000	0.000	0.015	my5732_rel.cy10a_bee
0.000	0.000	99.558	0.442	0.000	0.000	0.000	0.000	0.000	0.000	0.011	my5743_rel.cy10a_bee
0.000	0.000	95.062	4.862	0.075	0.000	0.000	0.000	0.000	0.000	0.021	my8013_rel.cy10a_bee
0.000	0.000	95.650	4.263	0.088	0.000	0.000	0.000	0.000	0.000	0.021	my8020_rel.cy10a_bee
0.000	0.000	99.321	0.662	0.017	0.000	0.000	0.000	0.000	0.000	0.020	my8027_rel.cy10a_bee
0.000	0.000	96.933	3.042	0.025	0.000	0.000	0.000	0.000	0.000	0.026	my8034_rel.cy10a_bee
Delete response time histogram
256us	1ms	4ms	16ms	64ms	256ms	1s	4s	16s	gt	max	tag
0.000	0.000	92.050	7.888	0.062	0.000	0.000	0.000	0.000	0.000	0.025	my5621_rel.cy10a_bee
0.000	0.000	95.029	4.967	0.004	0.000	0.000	0.000	0.000	0.000	0.016	my5651_rel.cy10a_bee
0.000	0.000	99.713	0.287	0.000	0.000	0.000	0.000	0.000	0.000	0.015	my5710_rel.cy10a_bee
0.000	0.000	99.650	0.350	0.000	0.000	0.000	0.000	0.000	0.000	0.015	my5721_rel.cy10a_bee
0.000	0.000	99.662	0.338	0.000	0.000	0.000	0.000	0.000	0.000	0.014	my5732_rel.cy10a_bee
0.000	0.000	99.633	0.367	0.000	0.000	0.000	0.000	0.000	0.000	0.011	my5743_rel.cy10a_bee
0.000	0.000	95.458	4.496	0.046	0.000	0.000	0.000	0.000	0.000	0.024	my8013_rel.cy10a_bee
0.000	0.000	96.350	3.612	0.037	0.000	0.000	0.000	0.000	0.000	0.023	my8020_rel.cy10a_bee
0.000	0.000	99.617	0.379	0.004	0.000	0.000	0.000	0.000	0.000	0.021	my8027_rel.cy10a_bee
0.000	0.000	99.279	0.700	0.021	0.000	0.000	0.000	0.000	0.000	0.025	my8034_rel.cy10a_bee