Introduction
This is a report for the insert benchmark with 20M docs and 1 client(s). It is generated by scripts (bash, awk, sed) and Tufte might not be impressed. An overview of the insert benchmark is here and a short update is here. Below, by DBMS, I mean DBMS+version.config. An example is my8020.c10b40 where my means MySQL, 8020 is version 8.0.20 and c10b40 is the name for the configuration file.
The test server has 8 AMD cores, 16G RAM and an NVMe SSD. It is described here as the Beelink. The benchmark was run with 1 client and there were 1 or 3 connections per client (1 for queries or inserts without rate limits, 1+1 for rate limited inserts+deletes). There is 1 table. It loads 20M rows without secondary indexes, creates secondary indexes, then inserts 50M rows with a delete per insert to avoid growing the table. It then does 3 read+write tests for 1200s each that do queries as fast as possible with 100, 500 and then 1000 inserts/second/client concurrent with the queries and 1000 deletes/second to avoid growing the table. The database is (or should be) cached by InnoDB.
The tested DBMS are:
- my5621_rel.cy10a_bee - InnoDB and MySQL 5.6.21, rel build, cy10a_bee config, compiled with CMAKE_BUILD_TYPE=Release, base config
my5641_rel.cy10a_bee - InnoDB and MySQL 5.6.41, rel build, cy10a_bee config, compiled with CMAKE_BUILD_TYPE=Release, base config - my5651_rel.cy10a_bee - InnoDB and MySQL 5.6.51, rel build, cy10a_bee config, compiled with CMAKE_BUILD_TYPE=Release, base config
Contents
- Summary
- l.i0: load without secondary indexes
- l.x: create secondary indexes
- l.i1: continue load after secondary indexes created
- q100.1: range queries with 100 insert/s per client
- q500.1: range queries with 500 insert/s per client
- q1000.1: range queries with 1000 insert/s per client
Summary
The numbers are inserts/s for l.i0 and l.i1, indexed docs (or rows) /s for l.x and queries/s for q100, q500, q1000. The values are the average rate over the entire test for inserts (IPS) and queries (QPS). The range of values for IPS and QPS is split into 3 parts: bottom 25%, middle 50%, top 25%. Values in the bottom 25% have a red background, values in the top 25% have a green background and values in the middle have no color. A gray background is used for values that can be ignored because the DBMS did not sustain the target insert rate. Red backgrounds are not used when the minimum value is within 80% of the max value.
| dbms | l.i0 | l.x | l.i1 | q100.1 | q500.1 | q1000.1 |
|---|---|---|---|---|---|---|
| my5621_rel.cy10a_bee | 104712 | 116860 | 20137 | 5533 | 5519 | 5505 |
| my5631_rel.cy10a_bee | 99010 | 113559 | 19577 | 5305 | 5332 | 5346 |
| my5641_rel.cy10a_bee | 99010 | 116185 | 19448 | 5223 | 5244 | 5210 |
| my5651_rel.cy10a_bee | 101010 | 111667 | 19881 | 5296 | 5245 | 5285 |
This table has relative throughput, throughput for the DBMS relative to the DBMS in the first line, using the absolute throughput from the previous table. Values less than 0.95 have a yellow background. Values greater than 1.05 have a blue background.
| dbms | l.i0 | l.x | l.i1 | q100.1 | q500.1 | q1000.1 |
|---|---|---|---|---|---|---|
| my5621_rel.cy10a_bee | 1.00 | 1.00 | 1.00 | 1.00 | 1.00 | 1.00 |
| my5631_rel.cy10a_bee | 0.95 | 0.97 | 0.97 | 0.96 | 0.97 | 0.97 |
| my5641_rel.cy10a_bee | 0.95 | 0.99 | 0.97 | 0.94 | 0.95 | 0.95 |
| my5651_rel.cy10a_bee | 0.96 | 0.96 | 0.99 | 0.96 | 0.95 | 0.96 |
This lists the average rate of inserts/s for the tests that do inserts concurrent with queries. For such tests the query rate is listed in the table above. The read+write tests are setup so that the insert rate should match the target rate every second. Cells that are not at least 95% of the target have a red background to indicate a failure to satisfy the target.
| dbms | q100.1 | q500.1 | q1000.1 |
|---|---|---|---|
| my5621_rel.cy10a_bee | 100 | 499 | 997 |
| my5631_rel.cy10a_bee | 100 | 498 | 998 |
| my5641_rel.cy10a_bee | 100 | 498 | 997 |
| my5651_rel.cy10a_bee | 100 | 498 | 997 |
| target | 100 | 500 | 1000 |
l.i0
l.i0: load without secondary indexes. Graphs for performance per 1-second interval are here.
Average throughput:

Insert response time histogram: each cell has the percentage of responses that take <= the time in the header and max is the max response time in seconds. For the max column values in the top 25% of the range have a red background and in the bottom 25% of the range have a green background. The red background is not used when the min value is within 80% of the max value.
| dbms | 256us | 1ms | 4ms | 16ms | 64ms | 256ms | 1s | 4s | 16s | gt | max |
|---|---|---|---|---|---|---|---|---|---|---|---|
| my5621_rel.cy10a_bee | 95.609 | 4.290 | 0.097 | 0.003 | 0.100 | ||||||
| my5631_rel.cy10a_bee | 90.429 | 9.434 | 0.131 | 0.002 | 0.003 | 0.099 | |||||
| my5641_rel.cy10a_bee | 90.340 | 9.554 | 0.103 | 0.001 | 0.003 | 0.105 | |||||
| my5651_rel.cy10a_bee | 93.077 | 6.814 | 0.103 | 0.002 | 0.003 | 0.100 |
Performance metrics for the DBMS listed above. Some are normalized by throughput, others are not. Legend for results is here.
ips	qps	rps	rmbps	wps	wmbps	rpq	rkbpq	wpi	wkbpi	csps	cpups	cspq	cpupq	dbgb1	dbgb2	rss	maxop	p50	p99	tag
104712	0	921	3.6	55.0	23.9	0.009	0.035	0.001	0.234	11974	22.3	0.114	17	1.3	41.8	1.9	0.100	105919	90695	20m.my5621_rel.cy10a_bee
99010	0	873	3.4	52.4	22.7	0.009	0.035	0.001	0.234	11409	21.8	0.115	18	1.3	41.8	1.9	0.099	100089	87679	20m.my5631_rel.cy10a_bee
99010	0	869	3.4	52.6	22.6	0.009	0.035	0.001	0.234	11359	21.6	0.115	17	1.3	41.8	1.9	0.105	99781	86104	20m.my5641_rel.cy10a_bee
101010	0	884	3.5	53.0	23.0	0.009	0.035	0.001	0.233	11523	21.8	0.114	17	1.3	41.8	1.9	0.100	101591	88504	20m.my5651_rel.cy10a_bee
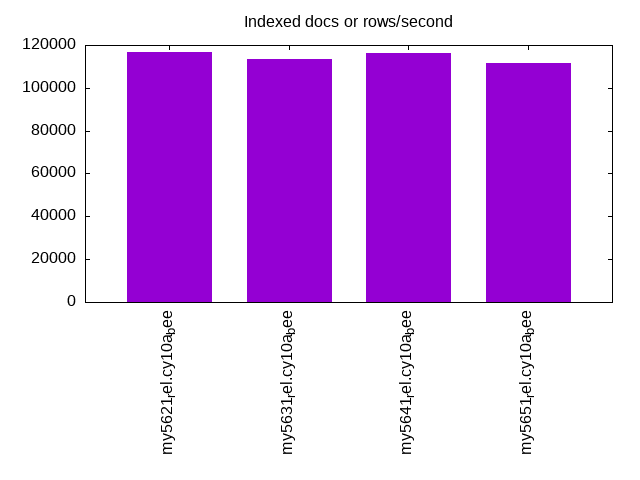
l.x
l.x: create secondary indexes.
Average throughput:
Performance metrics for the DBMS listed above. Some are normalized by throughput, others are not. Legend for results is here.
ips	qps	rps	rmbps	wps	wmbps	rpq	rkbpq	wpi	wkbpi	csps	cpups	cspq	cpupq	dbgb1	dbgb2	rss	maxop	p50	p99	tag
116860	0	17	0.1	1308.4	121.0	0.000	0.001	0.011	1.061	3863	11.8	0.033	8	2.7	43.2	3.1	0.010	NA	NA	20m.my5621_rel.cy10a_bee
113559	0	16	0.1	1263.7	117.4	0.000	0.001	0.011	1.059	3903	12.0	0.034	8	2.7	43.2	2.9	0.016	NA	NA	20m.my5631_rel.cy10a_bee
116185	0	17	0.1	1292.9	120.1	0.000	0.001	0.011	1.059	3958	11.8	0.034	8	2.7	43.2	3.0	0.008	NA	NA	20m.my5641_rel.cy10a_bee
111667	0	22	0.1	1307.8	117.5	0.000	0.001	0.012	1.078	3879	11.4	0.035	8	2.7	43.2	3.0	0.009	NA	NA	20m.my5651_rel.cy10a_bee
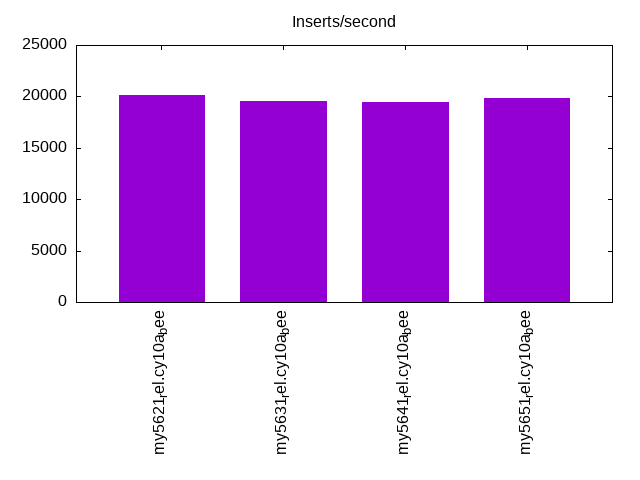
l.i1
l.i1: continue load after secondary indexes created. Graphs for performance per 1-second interval are here.
Average throughput:
Insert response time histogram: each cell has the percentage of responses that take <= the time in the header and max is the max response time in seconds. For the max column values in the top 25% of the range have a red background and in the bottom 25% of the range have a green background. The red background is not used when the min value is within 80% of the max value.
| dbms | 256us | 1ms | 4ms | 16ms | 64ms | 256ms | 1s | 4s | 16s | gt | max |
|---|---|---|---|---|---|---|---|---|---|---|---|
| my5621_rel.cy10a_bee | 96.483 | 3.355 | 0.159 | 0.003 | 0.101 | ||||||
| my5631_rel.cy10a_bee | 96.271 | 3.565 | 0.162 | 0.002 | 0.109 | ||||||
| my5641_rel.cy10a_bee | 96.180 | 3.656 | 0.161 | 0.002 | 0.099 | ||||||
| my5651_rel.cy10a_bee | 96.381 | 3.458 | 0.160 | 0.002 | 0.100 |
Delete response time histogram: each cell has the percentage of responses that take <= the time in the header and max is the max response time in seconds. For the max column values in the top 25% of the range have a red background and in the bottom 25% of the range have a green background. The red background is not used when the min value is within 80% of the max value.
| dbms | 256us | 1ms | 4ms | 16ms | 64ms | 256ms | 1s | 4s | 16s | gt | max |
|---|---|---|---|---|---|---|---|---|---|---|---|
| my5621_rel.cy10a_bee | 97.378 | 2.499 | 0.120 | 0.003 | 0.083 | ||||||
| my5631_rel.cy10a_bee | 97.279 | 2.607 | 0.113 | 0.002 | 0.087 | ||||||
| my5641_rel.cy10a_bee | 97.287 | 2.596 | 0.116 | 0.002 | 0.078 | ||||||
| my5651_rel.cy10a_bee | 97.456 | 2.426 | 0.117 | 0.001 | 0.078 |
Performance metrics for the DBMS listed above. Some are normalized by throughput, others are not. Legend for results is here.
ips	qps	rps	rmbps	wps	wmbps	rpq	rkbpq	wpi	wkbpi	csps	cpups	cspq	cpupq	dbgb1	dbgb2	rss	maxop	p50	p99	tag
20137	0	680	2.7	992.5	55.3	0.034	0.135	0.049	2.812	14242	34.6	0.707	137	3.8	44.3	4.5	0.101	21486	5094	20m.my5621_rel.cy10a_bee
19577	0	657	2.6	957.3	53.6	0.034	0.134	0.049	2.802	13962	34.3	0.713	140	3.8	44.3	4.5	0.109	20934	4945	20m.my5631_rel.cy10a_bee
19448	0	650	2.5	964.1	53.6	0.033	0.134	0.050	2.824	13981	34.1	0.719	140	3.8	44.3	4.5	0.099	20787	4595	20m.my5641_rel.cy10a_bee
19881	0	667	2.6	972.7	54.4	0.034	0.134	0.049	2.803	14194	34.4	0.714	138	3.8	44.3	4.5	0.100	21227	4795	20m.my5651_rel.cy10a_bee
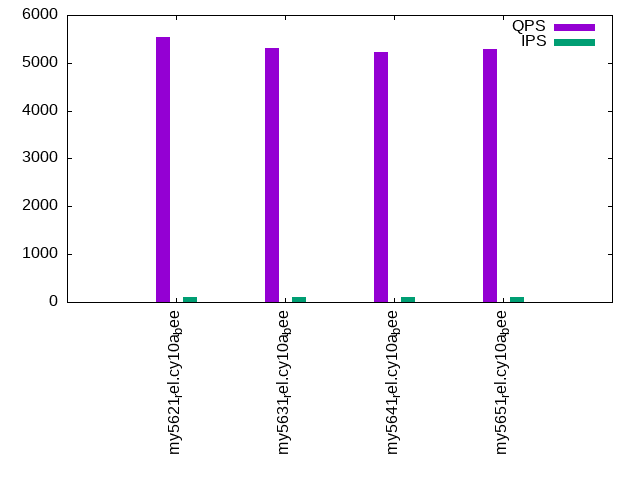
q100.1
q100.1: range queries with 100 insert/s per client. Graphs for performance per 1-second interval are here.
Average throughput:
Query response time histogram: each cell has the percentage of responses that take <= the time in the header and max is the max response time in seconds. For max values in the top 25% of the range have a red background and in the bottom 25% of the range have a green background. The red background is not used when the min value is within 80% of the max value.
| dbms | 256us | 1ms | 4ms | 16ms | 64ms | 256ms | 1s | 4s | 16s | gt | max |
|---|---|---|---|---|---|---|---|---|---|---|---|
| my5621_rel.cy10a_bee | 95.789 | 4.206 | 0.002 | 0.003 | 0.015 | ||||||
| my5631_rel.cy10a_bee | 95.169 | 4.826 | 0.002 | 0.003 | 0.016 | ||||||
| my5641_rel.cy10a_bee | 94.580 | 5.415 | 0.002 | 0.003 | nonzero | 0.017 | |||||
| my5651_rel.cy10a_bee | 94.855 | 5.139 | 0.003 | 0.003 | nonzero | 0.016 |
Insert response time histogram: each cell has the percentage of responses that take <= the time in the header and max is the max response time in seconds. For max values in the top 25% of the range have a red background and in the bottom 25% of the range have a green background. The red background is not used when the min value is within 80% of the max value.
| dbms | 256us | 1ms | 4ms | 16ms | 64ms | 256ms | 1s | 4s | 16s | gt | max |
|---|---|---|---|---|---|---|---|---|---|---|---|
| my5621_rel.cy10a_bee | 50.500 | 48.417 | 1.083 | 0.025 | |||||||
| my5631_rel.cy10a_bee | 51.000 | 47.500 | 1.500 | 0.025 | |||||||
| my5641_rel.cy10a_bee | 49.583 | 49.125 | 1.292 | 0.033 | |||||||
| my5651_rel.cy10a_bee | 54.917 | 44.250 | 0.833 | 0.026 |
Delete response time histogram: each cell has the percentage of responses that take <= the time in the header and max is the max response time in seconds. For max values in the top 25% of the range have a red background and in the bottom 25% of the range have a green background. The red background is not used when the min value is within 80% of the max value.
| dbms | 256us | 1ms | 4ms | 16ms | 64ms | 256ms | 1s | 4s | 16s | gt | max |
|---|---|---|---|---|---|---|---|---|---|---|---|
| my5621_rel.cy10a_bee | 51.958 | 47.833 | 0.208 | 0.018 | |||||||
| my5631_rel.cy10a_bee | 52.542 | 46.458 | 1.000 | 0.030 | |||||||
| my5641_rel.cy10a_bee | 52.375 | 46.917 | 0.708 | 0.024 | |||||||
| my5651_rel.cy10a_bee | 58.083 | 41.375 | 0.542 | 0.027 |
Performance metrics for the DBMS listed above. Some are normalized by throughput, others are not. Legend for results is here.
ips	qps	rps	rmbps	wps	wmbps	rpq	rkbpq	wpi	wkbpi	csps	cpups	cspq	cpupq	dbgb1	dbgb2	rss	maxop	p50	p99	tag
100	5533	4	0.0	716.9	21.5	0.001	0.003	7.183	220.870	23647	13.1	4.274	189	3.8	44.3	4.5	0.015	5482	5308	20m.my5621_rel.cy10a_bee
100	5305	4	0.0	745.9	22.4	0.001	0.003	7.481	230.100	22857	13.2	4.309	199	3.8	44.3	4.5	0.016	5275	5115	20m.my5631_rel.cy10a_bee
100	5223	4	0.0	744.0	22.3	0.001	0.003	7.477	229.929	22602	13.0	4.327	199	3.8	44.3	4.5	0.017	5194	5002	20m.my5641_rel.cy10a_bee
100	5296	4	0.0	696.0	20.9	0.001	0.003	6.988	215.051	22863	13.3	4.317	201	3.8	44.3	4.5	0.016	5258	5051	20m.my5651_rel.cy10a_bee
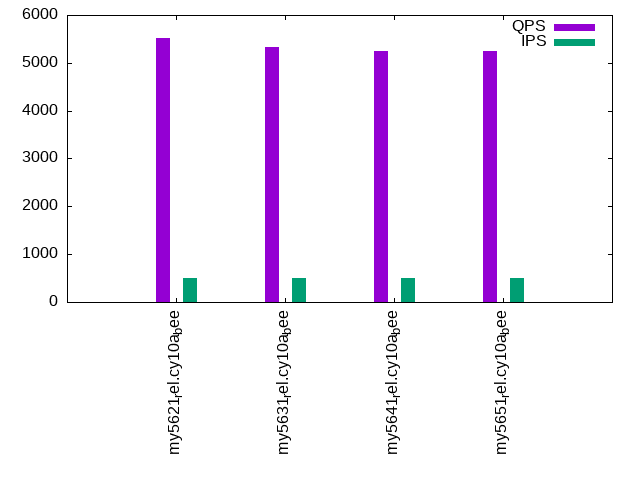
q500.1
q500.1: range queries with 500 insert/s per client. Graphs for performance per 1-second interval are here.
Average throughput:
Query response time histogram: each cell has the percentage of responses that take <= the time in the header and max is the max response time in seconds. For max values in the top 25% of the range have a red background and in the bottom 25% of the range have a green background. The red background is not used when the min value is within 80% of the max value.
| dbms | 256us | 1ms | 4ms | 16ms | 64ms | 256ms | 1s | 4s | 16s | gt | max |
|---|---|---|---|---|---|---|---|---|---|---|---|
| my5621_rel.cy10a_bee | 95.715 | 4.280 | 0.003 | 0.002 | 0.016 | ||||||
| my5631_rel.cy10a_bee | 95.008 | 4.987 | 0.002 | 0.003 | 0.016 | ||||||
| my5641_rel.cy10a_bee | 94.601 | 5.394 | 0.002 | 0.002 | 0.010 | ||||||
| my5651_rel.cy10a_bee | 94.373 | 5.622 | 0.003 | 0.003 | nonzero | 0.016 |
Insert response time histogram: each cell has the percentage of responses that take <= the time in the header and max is the max response time in seconds. For max values in the top 25% of the range have a red background and in the bottom 25% of the range have a green background. The red background is not used when the min value is within 80% of the max value.
| dbms | 256us | 1ms | 4ms | 16ms | 64ms | 256ms | 1s | 4s | 16s | gt | max |
|---|---|---|---|---|---|---|---|---|---|---|---|
| my5621_rel.cy10a_bee | 87.642 | 12.200 | 0.158 | 0.023 | |||||||
| my5631_rel.cy10a_bee | 89.542 | 10.325 | 0.133 | 0.022 | |||||||
| my5641_rel.cy10a_bee | 89.333 | 10.583 | 0.083 | 0.019 | |||||||
| my5651_rel.cy10a_bee | 89.375 | 10.500 | 0.125 | 0.019 |
Delete response time histogram: each cell has the percentage of responses that take <= the time in the header and max is the max response time in seconds. For max values in the top 25% of the range have a red background and in the bottom 25% of the range have a green background. The red background is not used when the min value is within 80% of the max value.
| dbms | 256us | 1ms | 4ms | 16ms | 64ms | 256ms | 1s | 4s | 16s | gt | max |
|---|---|---|---|---|---|---|---|---|---|---|---|
| my5621_rel.cy10a_bee | 89.933 | 9.958 | 0.108 | 0.024 | |||||||
| my5631_rel.cy10a_bee | 90.167 | 9.767 | 0.067 | 0.020 | |||||||
| my5641_rel.cy10a_bee | 90.875 | 9.092 | 0.033 | 0.017 | |||||||
| my5651_rel.cy10a_bee | 90.300 | 9.642 | 0.058 | 0.029 |
Performance metrics for the DBMS listed above. Some are normalized by throughput, others are not. Legend for results is here.
ips	qps	rps	rmbps	wps	wmbps	rpq	rkbpq	wpi	wkbpi	csps	cpups	cspq	cpupq	dbgb1	dbgb2	rss	maxop	p50	p99	tag
499	5519	16	0.1	1028.5	31.4	0.003	0.012	2.062	64.420	24792	13.7	4.492	199	3.8	44.3	4.5	0.016	5471	5305	20m.my5621_rel.cy10a_bee
498	5332	17	0.1	276.8	8.8	0.003	0.012	0.555	18.021	21637	13.5	4.058	203	3.8	44.3	4.5	0.016	5290	5114	20m.my5631_rel.cy10a_bee
498	5244	16	0.1	389.8	12.2	0.003	0.013	0.782	25.036	21675	13.5	4.133	206	3.8	44.3	4.5	0.010	5210	5034	20m.my5641_rel.cy10a_bee
498	5245	16	0.1	348.8	11.0	0.003	0.013	0.701	22.549	21719	13.6	4.141	207	3.8	44.3	4.5	0.016	5227	5018	20m.my5651_rel.cy10a_bee
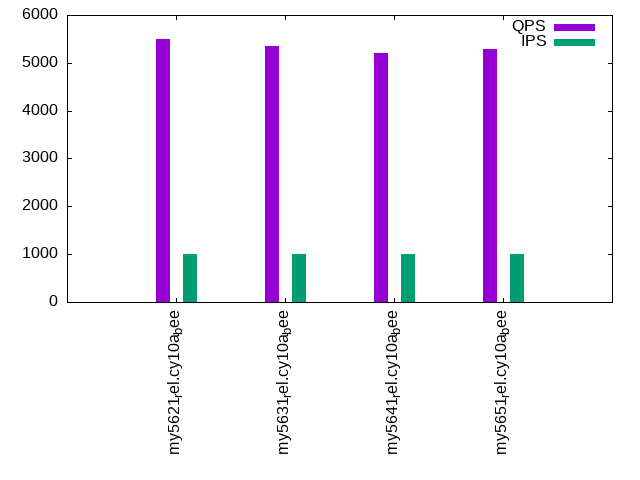
q1000.1
q1000.1: range queries with 1000 insert/s per client. Graphs for performance per 1-second interval are here.
Average throughput:
Query response time histogram: each cell has the percentage of responses that take <= the time in the header and max is the max response time in seconds. For max values in the top 25% of the range have a red background and in the bottom 25% of the range have a green background. The red background is not used when the min value is within 80% of the max value.
| dbms | 256us | 1ms | 4ms | 16ms | 64ms | 256ms | 1s | 4s | 16s | gt | max |
|---|---|---|---|---|---|---|---|---|---|---|---|
| my5621_rel.cy10a_bee | 95.561 | 4.431 | 0.005 | 0.002 | nonzero | 0.020 | |||||
| my5631_rel.cy10a_bee | 95.090 | 4.905 | 0.002 | 0.003 | 0.011 | ||||||
| my5641_rel.cy10a_bee | 94.280 | 5.715 | 0.002 | 0.003 | 0.010 | ||||||
| my5651_rel.cy10a_bee | 94.666 | 5.328 | 0.002 | 0.003 | 0.010 |
Insert response time histogram: each cell has the percentage of responses that take <= the time in the header and max is the max response time in seconds. For max values in the top 25% of the range have a red background and in the bottom 25% of the range have a green background. The red background is not used when the min value is within 80% of the max value.
| dbms | 256us | 1ms | 4ms | 16ms | 64ms | 256ms | 1s | 4s | 16s | gt | max |
|---|---|---|---|---|---|---|---|---|---|---|---|
| my5621_rel.cy10a_bee | 90.754 | 9.142 | 0.104 | 0.026 | |||||||
| my5631_rel.cy10a_bee | 94.758 | 5.183 | 0.058 | 0.023 | |||||||
| my5641_rel.cy10a_bee | 94.696 | 5.267 | 0.037 | 0.018 | |||||||
| my5651_rel.cy10a_bee | 94.871 | 5.079 | 0.050 | 0.018 |
Delete response time histogram: each cell has the percentage of responses that take <= the time in the header and max is the max response time in seconds. For max values in the top 25% of the range have a red background and in the bottom 25% of the range have a green background. The red background is not used when the min value is within 80% of the max value.
| dbms | 256us | 1ms | 4ms | 16ms | 64ms | 256ms | 1s | 4s | 16s | gt | max |
|---|---|---|---|---|---|---|---|---|---|---|---|
| my5621_rel.cy10a_bee | 92.050 | 7.888 | 0.062 | 0.025 | |||||||
| my5631_rel.cy10a_bee | 94.946 | 5.050 | 0.004 | 0.017 | |||||||
| my5641_rel.cy10a_bee | 94.975 | 5.004 | 0.021 | 0.022 | |||||||
| my5651_rel.cy10a_bee | 95.029 | 4.967 | 0.004 | 0.016 |
Performance metrics for the DBMS listed above. Some are normalized by throughput, others are not. Legend for results is here.
ips	qps	rps	rmbps	wps	wmbps	rpq	rkbpq	wpi	wkbpi	csps	cpups	cspq	cpupq	dbgb1	dbgb2	rss	maxop	p50	p99	tag
997	5505	33	0.1	1169.5	36.1	0.006	0.024	1.173	37.095	25390	14.8	4.612	215	3.8	44.3	4.5	0.020	5466	5273	20m.my5621_rel.cy10a_bee
998	5346	33	0.1	3.7	1.1	0.006	0.024	0.004	1.087	21017	14.5	3.931	217	3.8	44.3	4.5	0.011	5306	5129	20m.my5631_rel.cy10a_bee
997	5210	33	0.1	3.7	1.1	0.006	0.025	0.004	1.091	20511	14.5	3.937	223	3.8	44.3	4.5	0.010	5178	4986	20m.my5641_rel.cy10a_bee
997	5285	33	0.1	3.7	1.1	0.006	0.025	0.004	1.088	20967	14.6	3.967	221	3.8	44.3	4.5	0.010	5243	5052	20m.my5651_rel.cy10a_bee
l.i0
l.i0: load without secondary indexes
Performance metrics for all DBMS, not just the ones listed above. Some are normalized by throughput, others are not. Legend for results is here.
ips	qps	rps	rmbps	wps	wmbps	rpq	rkbpq	wpi	wkbpi	csps	cpups	cspq	cpupq	dbgb1	dbgb2	rss	maxop	p50	p99	tag
104712	0	921	3.6	55.0	23.9	0.009	0.035	0.001	0.234	11974	22.3	0.114	17	1.3	41.8	1.9	0.100	105919	90695	20m.my5621_rel.cy10a_bee
99010	0	873	3.4	52.4	22.7	0.009	0.035	0.001	0.234	11409	21.8	0.115	18	1.3	41.8	1.9	0.099	100089	87679	20m.my5631_rel.cy10a_bee
99010	0	869	3.4	52.6	22.6	0.009	0.035	0.001	0.234	11359	21.6	0.115	17	1.3	41.8	1.9	0.105	99781	86104	20m.my5641_rel.cy10a_bee
101010	0	884	3.5	53.0	23.0	0.009	0.035	0.001	0.233	11523	21.8	0.114	17	1.3	41.8	1.9	0.100	101591	88504	20m.my5651_rel.cy10a_bee
l.x
l.x: create secondary indexes
Performance metrics for all DBMS, not just the ones listed above. Some are normalized by throughput, others are not. Legend for results is here.
ips	qps	rps	rmbps	wps	wmbps	rpq	rkbpq	wpi	wkbpi	csps	cpups	cspq	cpupq	dbgb1	dbgb2	rss	maxop	p50	p99	tag
116860	0	17	0.1	1308.4	121.0	0.000	0.001	0.011	1.061	3863	11.8	0.033	8	2.7	43.2	3.1	0.010	NA	NA	20m.my5621_rel.cy10a_bee
113559	0	16	0.1	1263.7	117.4	0.000	0.001	0.011	1.059	3903	12.0	0.034	8	2.7	43.2	2.9	0.016	NA	NA	20m.my5631_rel.cy10a_bee
116185	0	17	0.1	1292.9	120.1	0.000	0.001	0.011	1.059	3958	11.8	0.034	8	2.7	43.2	3.0	0.008	NA	NA	20m.my5641_rel.cy10a_bee
111667	0	22	0.1	1307.8	117.5	0.000	0.001	0.012	1.078	3879	11.4	0.035	8	2.7	43.2	3.0	0.009	NA	NA	20m.my5651_rel.cy10a_bee
l.i1
l.i1: continue load after secondary indexes created
Performance metrics for all DBMS, not just the ones listed above. Some are normalized by throughput, others are not. Legend for results is here.
ips	qps	rps	rmbps	wps	wmbps	rpq	rkbpq	wpi	wkbpi	csps	cpups	cspq	cpupq	dbgb1	dbgb2	rss	maxop	p50	p99	tag
20137	0	680	2.7	992.5	55.3	0.034	0.135	0.049	2.812	14242	34.6	0.707	137	3.8	44.3	4.5	0.101	21486	5094	20m.my5621_rel.cy10a_bee
19577	0	657	2.6	957.3	53.6	0.034	0.134	0.049	2.802	13962	34.3	0.713	140	3.8	44.3	4.5	0.109	20934	4945	20m.my5631_rel.cy10a_bee
19448	0	650	2.5	964.1	53.6	0.033	0.134	0.050	2.824	13981	34.1	0.719	140	3.8	44.3	4.5	0.099	20787	4595	20m.my5641_rel.cy10a_bee
19881	0	667	2.6	972.7	54.4	0.034	0.134	0.049	2.803	14194	34.4	0.714	138	3.8	44.3	4.5	0.100	21227	4795	20m.my5651_rel.cy10a_bee
q100.1
q100.1: range queries with 100 insert/s per client
Performance metrics for all DBMS, not just the ones listed above. Some are normalized by throughput, others are not. Legend for results is here.
ips	qps	rps	rmbps	wps	wmbps	rpq	rkbpq	wpi	wkbpi	csps	cpups	cspq	cpupq	dbgb1	dbgb2	rss	maxop	p50	p99	tag
100	5533	4	0.0	716.9	21.5	0.001	0.003	7.183	220.870	23647	13.1	4.274	189	3.8	44.3	4.5	0.015	5482	5308	20m.my5621_rel.cy10a_bee
100	5305	4	0.0	745.9	22.4	0.001	0.003	7.481	230.100	22857	13.2	4.309	199	3.8	44.3	4.5	0.016	5275	5115	20m.my5631_rel.cy10a_bee
100	5223	4	0.0	744.0	22.3	0.001	0.003	7.477	229.929	22602	13.0	4.327	199	3.8	44.3	4.5	0.017	5194	5002	20m.my5641_rel.cy10a_bee
100	5296	4	0.0	696.0	20.9	0.001	0.003	6.988	215.051	22863	13.3	4.317	201	3.8	44.3	4.5	0.016	5258	5051	20m.my5651_rel.cy10a_bee
q500.1
q500.1: range queries with 500 insert/s per client
Performance metrics for all DBMS, not just the ones listed above. Some are normalized by throughput, others are not. Legend for results is here.
ips	qps	rps	rmbps	wps	wmbps	rpq	rkbpq	wpi	wkbpi	csps	cpups	cspq	cpupq	dbgb1	dbgb2	rss	maxop	p50	p99	tag
499	5519	16	0.1	1028.5	31.4	0.003	0.012	2.062	64.420	24792	13.7	4.492	199	3.8	44.3	4.5	0.016	5471	5305	20m.my5621_rel.cy10a_bee
498	5332	17	0.1	276.8	8.8	0.003	0.012	0.555	18.021	21637	13.5	4.058	203	3.8	44.3	4.5	0.016	5290	5114	20m.my5631_rel.cy10a_bee
498	5244	16	0.1	389.8	12.2	0.003	0.013	0.782	25.036	21675	13.5	4.133	206	3.8	44.3	4.5	0.010	5210	5034	20m.my5641_rel.cy10a_bee
498	5245	16	0.1	348.8	11.0	0.003	0.013	0.701	22.549	21719	13.6	4.141	207	3.8	44.3	4.5	0.016	5227	5018	20m.my5651_rel.cy10a_bee
q1000.1
q1000.1: range queries with 1000 insert/s per client
Performance metrics for all DBMS, not just the ones listed above. Some are normalized by throughput, others are not. Legend for results is here.
ips	qps	rps	rmbps	wps	wmbps	rpq	rkbpq	wpi	wkbpi	csps	cpups	cspq	cpupq	dbgb1	dbgb2	rss	maxop	p50	p99	tag
997	5505	33	0.1	1169.5	36.1	0.006	0.024	1.173	37.095	25390	14.8	4.612	215	3.8	44.3	4.5	0.020	5466	5273	20m.my5621_rel.cy10a_bee
998	5346	33	0.1	3.7	1.1	0.006	0.024	0.004	1.087	21017	14.5	3.931	217	3.8	44.3	4.5	0.011	5306	5129	20m.my5631_rel.cy10a_bee
997	5210	33	0.1	3.7	1.1	0.006	0.025	0.004	1.091	20511	14.5	3.937	223	3.8	44.3	4.5	0.010	5178	4986	20m.my5641_rel.cy10a_bee
997	5285	33	0.1	3.7	1.1	0.006	0.025	0.004	1.088	20967	14.6	3.967	221	3.8	44.3	4.5	0.010	5243	5052	20m.my5651_rel.cy10a_bee
l.i0
- l.i0: load without secondary indexes
- Legend for results is here.
- Each entry lists the percentage of responses that fit in that bucket (slower than max time for previous bucket, faster than min time for next bucket).
Insert response time histogram
256us	1ms	4ms	16ms	64ms	256ms	1s	4s	16s	gt	max	tag
0.000	95.609	4.290	0.097	0.000	0.003	0.000	0.000	0.000	0.000	0.100	my5621_rel.cy10a_bee
0.000	90.429	9.434	0.131	0.002	0.003	0.000	0.000	0.000	0.000	0.099	my5631_rel.cy10a_bee
0.000	90.340	9.554	0.103	0.001	0.003	0.000	0.000	0.000	0.000	0.105	my5641_rel.cy10a_bee
0.000	93.077	6.814	0.103	0.002	0.003	0.000	0.000	0.000	0.000	0.100	my5651_rel.cy10a_bee
l.x
- l.x: create secondary indexes
- Legend for results is here.
- Each entry lists the percentage of responses that fit in that bucket (slower than max time for previous bucket, faster than min time for next bucket).
TODO - determine whether there is data for create index response time
l.i1
- l.i1: continue load after secondary indexes created
- Legend for results is here.
- Each entry lists the percentage of responses that fit in that bucket (slower than max time for previous bucket, faster than min time for next bucket).
Insert response time histogram
256us	1ms	4ms	16ms	64ms	256ms	1s	4s	16s	gt	max	tag
0.000	0.000	96.483	3.355	0.159	0.003	0.000	0.000	0.000	0.000	0.101	my5621_rel.cy10a_bee
0.000	0.000	96.271	3.565	0.162	0.002	0.000	0.000	0.000	0.000	0.109	my5631_rel.cy10a_bee
0.000	0.000	96.180	3.656	0.161	0.002	0.000	0.000	0.000	0.000	0.099	my5641_rel.cy10a_bee
0.000	0.000	96.381	3.458	0.160	0.002	0.000	0.000	0.000	0.000	0.100	my5651_rel.cy10a_bee
Delete response time histogram
256us	1ms	4ms	16ms	64ms	256ms	1s	4s	16s	gt	max	tag
0.000	0.000	97.378	2.499	0.120	0.003	0.000	0.000	0.000	0.000	0.083	my5621_rel.cy10a_bee
0.000	0.000	97.279	2.607	0.113	0.002	0.000	0.000	0.000	0.000	0.087	my5631_rel.cy10a_bee
0.000	0.000	97.287	2.596	0.116	0.002	0.000	0.000	0.000	0.000	0.078	my5641_rel.cy10a_bee
0.000	0.000	97.456	2.426	0.117	0.001	0.000	0.000	0.000	0.000	0.078	my5651_rel.cy10a_bee
q100.1
- q100.1: range queries with 100 insert/s per client
- Legend for results is here.
- Each entry lists the percentage of responses that fit in that bucket (slower than max time for previous bucket, faster than min time for next bucket).
Query response time histogram
256us	1ms	4ms	16ms	64ms	256ms	1s	4s	16s	gt	max	tag
95.789	4.206	0.002	0.003	0.000	0.000	0.000	0.000	0.000	0.000	0.015	my5621_rel.cy10a_bee
95.169	4.826	0.002	0.003	0.000	0.000	0.000	0.000	0.000	0.000	0.016	my5631_rel.cy10a_bee
94.580	5.415	0.002	0.003	nonzero	0.000	0.000	0.000	0.000	0.000	0.017	my5641_rel.cy10a_bee
94.855	5.139	0.003	0.003	nonzero	0.000	0.000	0.000	0.000	0.000	0.016	my5651_rel.cy10a_bee
Insert response time histogram
256us	1ms	4ms	16ms	64ms	256ms	1s	4s	16s	gt	max	tag
0.000	0.000	50.500	48.417	1.083	0.000	0.000	0.000	0.000	0.000	0.025	my5621_rel.cy10a_bee
0.000	0.000	51.000	47.500	1.500	0.000	0.000	0.000	0.000	0.000	0.025	my5631_rel.cy10a_bee
0.000	0.000	49.583	49.125	1.292	0.000	0.000	0.000	0.000	0.000	0.033	my5641_rel.cy10a_bee
0.000	0.000	54.917	44.250	0.833	0.000	0.000	0.000	0.000	0.000	0.026	my5651_rel.cy10a_bee
Delete response time histogram
256us	1ms	4ms	16ms	64ms	256ms	1s	4s	16s	gt	max	tag
0.000	0.000	51.958	47.833	0.208	0.000	0.000	0.000	0.000	0.000	0.018	my5621_rel.cy10a_bee
0.000	0.000	52.542	46.458	1.000	0.000	0.000	0.000	0.000	0.000	0.030	my5631_rel.cy10a_bee
0.000	0.000	52.375	46.917	0.708	0.000	0.000	0.000	0.000	0.000	0.024	my5641_rel.cy10a_bee
0.000	0.000	58.083	41.375	0.542	0.000	0.000	0.000	0.000	0.000	0.027	my5651_rel.cy10a_bee
q500.1
- q500.1: range queries with 500 insert/s per client
- Legend for results is here.
- Each entry lists the percentage of responses that fit in that bucket (slower than max time for previous bucket, faster than min time for next bucket).
Query response time histogram
256us	1ms	4ms	16ms	64ms	256ms	1s	4s	16s	gt	max	tag
95.715	4.280	0.003	0.002	0.000	0.000	0.000	0.000	0.000	0.000	0.016	my5621_rel.cy10a_bee
95.008	4.987	0.002	0.003	0.000	0.000	0.000	0.000	0.000	0.000	0.016	my5631_rel.cy10a_bee
94.601	5.394	0.002	0.002	0.000	0.000	0.000	0.000	0.000	0.000	0.010	my5641_rel.cy10a_bee
94.373	5.622	0.003	0.003	nonzero	0.000	0.000	0.000	0.000	0.000	0.016	my5651_rel.cy10a_bee
Insert response time histogram
256us	1ms	4ms	16ms	64ms	256ms	1s	4s	16s	gt	max	tag
0.000	0.000	87.642	12.200	0.158	0.000	0.000	0.000	0.000	0.000	0.023	my5621_rel.cy10a_bee
0.000	0.000	89.542	10.325	0.133	0.000	0.000	0.000	0.000	0.000	0.022	my5631_rel.cy10a_bee
0.000	0.000	89.333	10.583	0.083	0.000	0.000	0.000	0.000	0.000	0.019	my5641_rel.cy10a_bee
0.000	0.000	89.375	10.500	0.125	0.000	0.000	0.000	0.000	0.000	0.019	my5651_rel.cy10a_bee
Delete response time histogram
256us	1ms	4ms	16ms	64ms	256ms	1s	4s	16s	gt	max	tag
0.000	0.000	89.933	9.958	0.108	0.000	0.000	0.000	0.000	0.000	0.024	my5621_rel.cy10a_bee
0.000	0.000	90.167	9.767	0.067	0.000	0.000	0.000	0.000	0.000	0.020	my5631_rel.cy10a_bee
0.000	0.000	90.875	9.092	0.033	0.000	0.000	0.000	0.000	0.000	0.017	my5641_rel.cy10a_bee
0.000	0.000	90.300	9.642	0.058	0.000	0.000	0.000	0.000	0.000	0.029	my5651_rel.cy10a_bee
q1000.1
- q1000.1: range queries with 1000 insert/s per client
- Legend for results is here.
- Each entry lists the percentage of responses that fit in that bucket (slower than max time for previous bucket, faster than min time for next bucket).
Query response time histogram
256us	1ms	4ms	16ms	64ms	256ms	1s	4s	16s	gt	max	tag
95.561	4.431	0.005	0.002	nonzero	0.000	0.000	0.000	0.000	0.000	0.020	my5621_rel.cy10a_bee
95.090	4.905	0.002	0.003	0.000	0.000	0.000	0.000	0.000	0.000	0.011	my5631_rel.cy10a_bee
94.280	5.715	0.002	0.003	0.000	0.000	0.000	0.000	0.000	0.000	0.010	my5641_rel.cy10a_bee
94.666	5.328	0.002	0.003	0.000	0.000	0.000	0.000	0.000	0.000	0.010	my5651_rel.cy10a_bee
Insert response time histogram
256us	1ms	4ms	16ms	64ms	256ms	1s	4s	16s	gt	max	tag
0.000	0.000	90.754	9.142	0.104	0.000	0.000	0.000	0.000	0.000	0.026	my5621_rel.cy10a_bee
0.000	0.000	94.758	5.183	0.058	0.000	0.000	0.000	0.000	0.000	0.023	my5631_rel.cy10a_bee
0.000	0.000	94.696	5.267	0.037	0.000	0.000	0.000	0.000	0.000	0.018	my5641_rel.cy10a_bee
0.000	0.000	94.871	5.079	0.050	0.000	0.000	0.000	0.000	0.000	0.018	my5651_rel.cy10a_bee
Delete response time histogram
256us	1ms	4ms	16ms	64ms	256ms	1s	4s	16s	gt	max	tag
0.000	0.000	92.050	7.888	0.062	0.000	0.000	0.000	0.000	0.000	0.025	my5621_rel.cy10a_bee
0.000	0.000	94.946	5.050	0.004	0.000	0.000	0.000	0.000	0.000	0.017	my5631_rel.cy10a_bee
0.000	0.000	94.975	5.004	0.021	0.000	0.000	0.000	0.000	0.000	0.022	my5641_rel.cy10a_bee
0.000	0.000	95.029	4.967	0.004	0.000	0.000	0.000	0.000	0.000	0.016	my5651_rel.cy10a_bee