Introduction
This is a report for the insert benchmark with 800M docs and 1 client(s). It is generated by scripts (bash, awk, sed) and Tufte might not be impressed. An overview of the insert benchmark is here and a short update is here. Below, by DBMS, I mean DBMS+version.config. An example is my8020.c10b40 where my means MySQL, 8020 is version 8.0.20 and c10b40 is the name for the configuration file.
The test server has 8 AMD cores, 16G RAM and an NVMe SSD. It is described here as the Beelink. The benchmark was run with 1 client and there were 1 or 3 connections per client (1 for queries or inserts without rate limits, 1+1 for rate limited inserts+deletes). It uses 1 table. It loads 20M rows per table without secondary indexes, creates secondary indexes, then inserts 200M rows per table with a delete per insert to avoid growing the table. It then does 3 read+write tests for 7200s each that do queries as fast as possible with 100, 500 and then 1000 inserts/second/client concurrent with the queries and 1000 deletes/second to avoid growing the table. The database is cached by Postgres. Clients and the DBMS share one server. The per-database configs are in the per-database subdirectories here.
The tested DBMS are:
- pg153_o2_nofp.cx9a2_bee - Postgres 15.3, o2_nofp build that used -O2 -no-omit-frame-pointer, a2 config
- pg154_o2_nofp.cx9a2_bee - Postgres 15.4, o2_nofp build that used -O2 -no-omit-frame-pointer, a2 config
- pg16beta1_o2_nofp.cx9a2_bee - Postgres 16 beta1, o2_nofp build that used -O2 -no-omit-frame-pointer, a2 config
- pg16beta2_o2_nofp.cx9a2_bee - Postgres 16 beta2, o2_nofp build that used -O2 -no-omit-frame-pointer, a2 config
- pg16beta3_o2_nofp.cx9a2_bee - Postgres 16 beta3, o2_nofp build that used -O2 -no-omit-frame-pointer, a2 config
Contents
- Summary
- l.i0: load without secondary indexes
- l.x: create secondary indexes
- l.i1: continue load after secondary indexes created
- q100.1: range queries with 100 insert/s per client
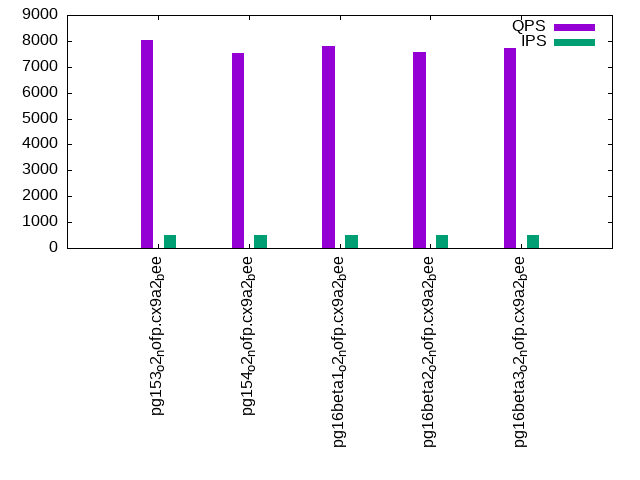
- q500.1: range queries with 500 insert/s per client
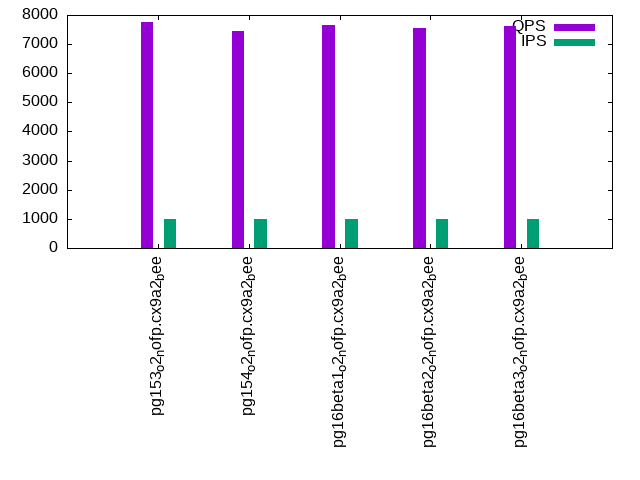
- q1000.1: range queries with 1000 insert/s per client
Summary
The numbers are inserts/s for l.i0 and l.i1, indexed docs (or rows) /s for l.x and queries/s for q*.2. The values are the average rate over the entire test for inserts (IPS) and queries (QPS). The range of values for IPS and QPS is split into 3 parts: bottom 25%, middle 50%, top 25%. Values in the bottom 25% have a red background, values in the top 25% have a green background and values in the middle have no color. A gray background is used for values that can be ignored because the DBMS did not sustain the target insert rate. Red backgrounds are not used when the minimum value is within 80% of the max value.
| dbms | l.i0 | l.x | l.i1 | q100.1 | q500.1 | q1000.1 |
|---|---|---|---|---|---|---|
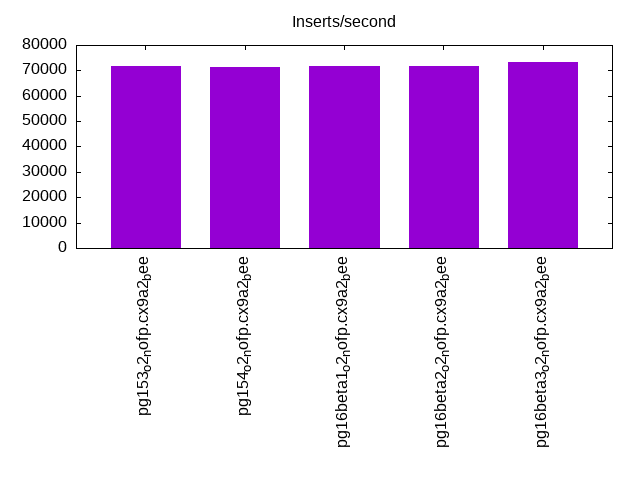
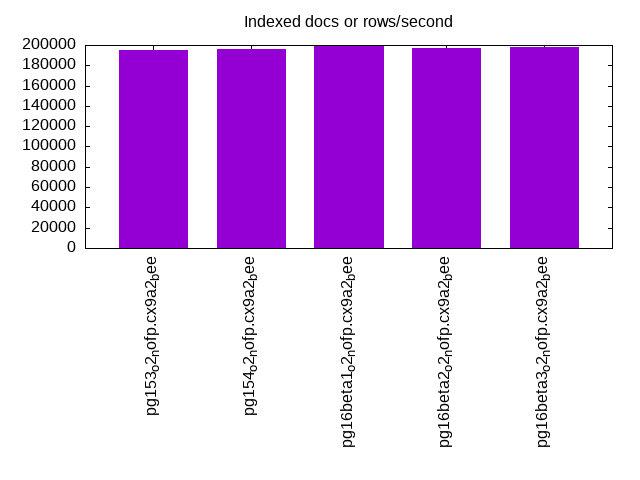
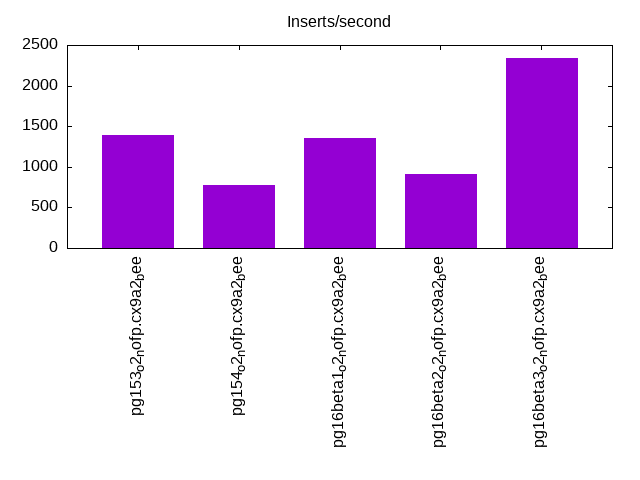
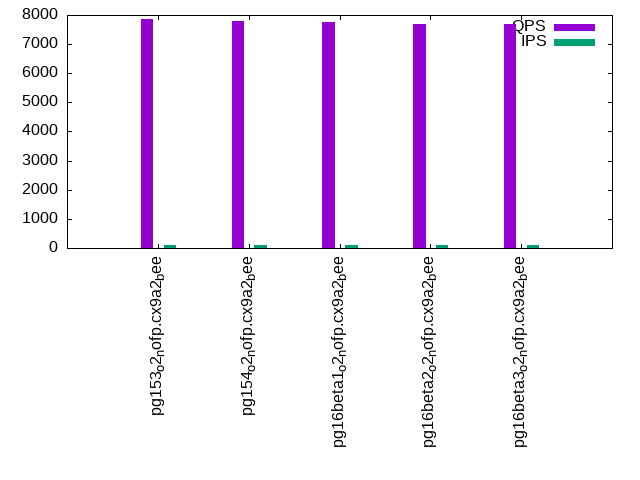
| pg153_o2_nofp.cx9a2_bee | 71723 | 195480 | 1396 | 7869 | 8044 | 7746 |
| pg154_o2_nofp.cx9a2_bee | 71422 | 195623 | 770 | 7777 | 7548 | 7465 |
| pg16beta1_o2_nofp.cx9a2_bee | 71627 | 199427 | 1349 | 7773 | 7784 | 7668 |
| pg16beta2_o2_nofp.cx9a2_bee | 71582 | 196972 | 915 | 7693 | 7582 | 7553 |
| pg16beta3_o2_nofp.cx9a2_bee | 73153 | 198094 | 2340 | 7703 | 7721 | 7627 |
This table has relative throughput, throughput for the DBMS relative to the DBMS in the first line, using the absolute throughput from the previous table. Values less than 0.95 have a yellow background. Values greater than 1.05 have a blue background.
| dbms | l.i0 | l.x | l.i1 | q100.1 | q500.1 | q1000.1 |
|---|---|---|---|---|---|---|
| pg153_o2_nofp.cx9a2_bee | 1.00 | 1.00 | 1.00 | 1.00 | 1.00 | 1.00 |
| pg154_o2_nofp.cx9a2_bee | 1.00 | 1.00 | 0.55 | 0.99 | 0.94 | 0.96 |
| pg16beta1_o2_nofp.cx9a2_bee | 1.00 | 1.02 | 0.97 | 0.99 | 0.97 | 0.99 |
| pg16beta2_o2_nofp.cx9a2_bee | 1.00 | 1.01 | 0.66 | 0.98 | 0.94 | 0.98 |
| pg16beta3_o2_nofp.cx9a2_bee | 1.02 | 1.01 | 1.68 | 0.98 | 0.96 | 0.98 |
This lists the average rate of inserts/s for the tests that do inserts concurrent with queries. For such tests the query rate is listed in the table above. The read+write tests are setup so that the insert rate should match the target rate every second. Cells that are not at least 95% of the target have a red background to indicate a failure to satisfy the target.
| dbms | q100.1 | q500.1 | q1000.1 |
|---|---|---|---|
| pg153_o2_nofp.cx9a2_bee | 100 | 499 | 998 |
| pg154_o2_nofp.cx9a2_bee | 100 | 499 | 997 |
| pg16beta1_o2_nofp.cx9a2_bee | 100 | 499 | 998 |
| pg16beta2_o2_nofp.cx9a2_bee | 100 | 499 | 998 |
| pg16beta3_o2_nofp.cx9a2_bee | 100 | 499 | 998 |
| target | 100 | 500 | 1000 |
l.i0
l.i0: load without secondary indexes. Graphs for performance per 1-second interval are here.
Average throughput:
Insert response time histogram: each cell has the percentage of responses that take <= the time in the header and max is the max response time in seconds. For the max column values in the top 25% of the range have a red background and in the bottom 25% of the range have a green background. The red background is not used when the min value is within 80% of the max value.
| dbms | 256us | 1ms | 4ms | 16ms | 64ms | 256ms | 1s | 4s | 16s | gt | max |
|---|---|---|---|---|---|---|---|---|---|---|---|
| pg153_o2_nofp.cx9a2_bee | 99.998 | 0.002 | 0.001 | 0.055 | |||||||
| pg154_o2_nofp.cx9a2_bee | 99.998 | 0.001 | nonzero | 0.058 | |||||||
| pg16beta1_o2_nofp.cx9a2_bee | 99.999 | 0.001 | nonzero | 0.056 | |||||||
| pg16beta2_o2_nofp.cx9a2_bee | 99.999 | 0.001 | nonzero | nonzero | 0.083 | ||||||
| pg16beta3_o2_nofp.cx9a2_bee | 99.998 | 0.001 | nonzero | 0.055 |
Performance metrics for the DBMS listed above. Some are normalized by throughput, others are not. Legend for results is here.
ips	qps	rps	rmbps	wps	wmbps	rpq	rkbpq	wpi	wkbpi	csps	cpups	cspq	cpupq	dbgb1	dbgb2	rss	maxop	p50	p99	tag
71723	0	30	0.2	104.5	29.6	0.000	0.003	0.001	0.423	8755	22.3	0.122	25	76.5	116.6	2.5	0.055	71921	69720	800m.pg153_o2_nofp.cx9a2_bee
71422	0	30	0.2	99.2	29.3	0.000	0.003	0.001	0.420	8719	22.3	0.122	25	76.5	116.6	3.5	0.058	71621	69568	800m.pg154_o2_nofp.cx9a2_bee
71627	0	30	0.2	104.8	29.6	0.000	0.003	0.001	0.423	8736	22.7	0.122	25	76.5	116.6	0.4	0.056	71853	69718	800m.pg16beta1_o2_nofp.cx9a2_bee
71582	0	30	0.2	104.3	29.6	0.000	0.003	0.001	0.423	8734	22.3	0.122	25	76.5	116.6	2.6	0.083	71821	69616	800m.pg16beta2_o2_nofp.cx9a2_bee
73153	0	32	0.3	105.6	30.2	0.000	0.004	0.001	0.423	8920	22.4	0.122	24	76.5	116.6	4.5	0.055	73419	71010	800m.pg16beta3_o2_nofp.cx9a2_bee
l.x
l.x: create secondary indexes.
Average throughput:
Performance metrics for the DBMS listed above. Some are normalized by throughput, others are not. Legend for results is here.
ips	qps	rps	rmbps	wps	wmbps	rpq	rkbpq	wpi	wkbpi	csps	cpups	cspq	cpupq	dbgb1	dbgb2	rss	maxop	p50	p99	tag
195480	0	570	70.6	185.2	66.6	0.003	0.370	0.001	0.349	406	12.5	0.002	5	147.0	187.1	10.2	0.005	NA	NA	800m.pg153_o2_nofp.cx9a2_bee
195623	0	570	70.6	183.6	66.8	0.003	0.370	0.001	0.350	428	12.4	0.002	5	147.0	187.1	10.2	0.005	NA	NA	800m.pg154_o2_nofp.cx9a2_bee
199427	0	579	71.9	184.2	67.8	0.003	0.369	0.001	0.348	423	12.5	0.002	5	147.0	187.1	10.2	0.006	NA	NA	800m.pg16beta1_o2_nofp.cx9a2_bee
196972	0	572	71.0	181.8	67.1	0.003	0.369	0.001	0.349	416	12.4	0.002	5	147.0	187.1	10.2	0.009	NA	NA	800m.pg16beta2_o2_nofp.cx9a2_bee
198094	0	576	71.5	184.3	67.4	0.003	0.370	0.001	0.349	415	12.4	0.002	5	147.0	187.1	10.2	0.007	NA	NA	800m.pg16beta3_o2_nofp.cx9a2_bee
l.i1
l.i1: continue load after secondary indexes created. Graphs for performance per 1-second interval are here.
Average throughput:
Insert response time histogram: each cell has the percentage of responses that take <= the time in the header and max is the max response time in seconds. For the max column values in the top 25% of the range have a red background and in the bottom 25% of the range have a green background. The red background is not used when the min value is within 80% of the max value.
| dbms | 256us | 1ms | 4ms | 16ms | 64ms | 256ms | 1s | 4s | 16s | gt | max |
|---|---|---|---|---|---|---|---|---|---|---|---|
| pg153_o2_nofp.cx9a2_bee | 82.806 | 17.148 | 0.046 | 0.169 | |||||||
| pg154_o2_nofp.cx9a2_bee | 88.801 | 11.198 | 0.001 | 0.069 | |||||||
| pg16beta1_o2_nofp.cx9a2_bee | 81.573 | 18.381 | 0.046 | 0.153 | |||||||
| pg16beta2_o2_nofp.cx9a2_bee | 86.638 | 13.358 | 0.004 | 0.208 | |||||||
| pg16beta3_o2_nofp.cx9a2_bee | 82.052 | 17.902 | 0.045 | 0.186 |
Delete response time histogram: each cell has the percentage of responses that take <= the time in the header and max is the max response time in seconds. For the max column values in the top 25% of the range have a red background and in the bottom 25% of the range have a green background. The red background is not used when the min value is within 80% of the max value.
| dbms | 256us | 1ms | 4ms | 16ms | 64ms | 256ms | 1s | 4s | 16s | gt | max |
|---|---|---|---|---|---|---|---|---|---|---|---|
| pg153_o2_nofp.cx9a2_bee | 48.766 | 1.837 | 6.635 | 24.201 | 18.561 | 0.123 | |||||
| pg154_o2_nofp.cx9a2_bee | 0.003 | 24.382 | 1.243 | 6.465 | 24.255 | 43.651 | nonzero | 0.306 | |||
| pg16beta1_o2_nofp.cx9a2_bee | 0.001 | 47.175 | 2.275 | 9.714 | 23.938 | 16.896 | 0.133 | ||||
| pg16beta2_o2_nofp.cx9a2_bee | 0.002 | 41.046 | 1.193 | 6.524 | 23.939 | 27.297 | nonzero | 0.332 | |||
| pg16beta3_o2_nofp.cx9a2_bee | 0.001 | 67.635 | 1.241 | 6.441 | 23.845 | 0.838 | 0.068 |
Performance metrics for the DBMS listed above. Some are normalized by throughput, others are not. Legend for results is here.
ips	qps	rps	rmbps	wps	wmbps	rpq	rkbpq	wpi	wkbpi	csps	cpups	cspq	cpupq	dbgb1	dbgb2	rss	maxop	p50	p99	tag
1396	0	2298	24.3	2715.7	41.5	1.646	17.807	1.946	30.446	5461	12.7	3.913	728	149.6	189.6	3.4	0.169	799	400	800m.pg153_o2_nofp.cx9a2_bee
770	0	1240	9.9	1431.0	20.8	1.610	13.100	1.858	27.683	3043	13.2	3.952	1371	150.5	179.4	9.8	0.069	449	300	800m.pg154_o2_nofp.cx9a2_bee
1349	0	2222	23.4	2632.4	40.1	1.647	17.793	1.951	30.435	5314	12.8	3.939	759	149.7	188.8	3.0	0.153	799	399	800m.pg16beta1_o2_nofp.cx9a2_bee
915	0	1472	11.8	1699.2	24.7	1.608	13.251	1.857	27.655	3567	12.6	3.897	1101	150.5	182.8	1.3	0.208	350	250	800m.pg16beta2_o2_nofp.cx9a2_bee
2340	0	3841	40.5	4537.5	68.4	1.641	17.716	1.939	29.911	9056	11.6	3.870	397	149.7	189.7	3.3	0.186	2447	749	800m.pg16beta3_o2_nofp.cx9a2_bee
q100.1
q100.1: range queries with 100 insert/s per client. Graphs for performance per 1-second interval are here.
Average throughput:
Query response time histogram: each cell has the percentage of responses that take <= the time in the header and max is the max response time in seconds. For max values in the top 25% of the range have a red background and in the bottom 25% of the range have a green background. The red background is not used when the min value is within 80% of the max value.
| dbms | 256us | 1ms | 4ms | 16ms | 64ms | 256ms | 1s | 4s | 16s | gt | max |
|---|---|---|---|---|---|---|---|---|---|---|---|
| pg153_o2_nofp.cx9a2_bee | 99.613 | 0.383 | 0.002 | 0.002 | nonzero | 0.028 | |||||
| pg154_o2_nofp.cx9a2_bee | 99.576 | 0.421 | 0.001 | 0.002 | nonzero | 0.019 | |||||
| pg16beta1_o2_nofp.cx9a2_bee | 99.564 | 0.432 | 0.002 | 0.002 | 0.016 | ||||||
| pg16beta2_o2_nofp.cx9a2_bee | 99.551 | 0.446 | 0.001 | 0.002 | nonzero | 0.024 | |||||
| pg16beta3_o2_nofp.cx9a2_bee | 99.583 | 0.412 | 0.003 | 0.002 | 0.010 |
Insert response time histogram: each cell has the percentage of responses that take <= the time in the header and max is the max response time in seconds. For max values in the top 25% of the range have a red background and in the bottom 25% of the range have a green background. The red background is not used when the min value is within 80% of the max value.
| dbms | 256us | 1ms | 4ms | 16ms | 64ms | 256ms | 1s | 4s | 16s | gt | max |
|---|---|---|---|---|---|---|---|---|---|---|---|
| pg153_o2_nofp.cx9a2_bee | 78.014 | 21.986 | 0.033 | ||||||||
| pg154_o2_nofp.cx9a2_bee | 76.250 | 23.750 | 0.032 | ||||||||
| pg16beta1_o2_nofp.cx9a2_bee | 68.806 | 31.194 | 0.052 | ||||||||
| pg16beta2_o2_nofp.cx9a2_bee | 78.583 | 21.417 | 0.031 | ||||||||
| pg16beta3_o2_nofp.cx9a2_bee | 67.014 | 32.986 | 0.056 |
Delete response time histogram: each cell has the percentage of responses that take <= the time in the header and max is the max response time in seconds. For max values in the top 25% of the range have a red background and in the bottom 25% of the range have a green background. The red background is not used when the min value is within 80% of the max value.
| dbms | 256us | 1ms | 4ms | 16ms | 64ms | 256ms | 1s | 4s | 16s | gt | max |
|---|---|---|---|---|---|---|---|---|---|---|---|
| pg153_o2_nofp.cx9a2_bee | 13.167 | 65.375 | 21.458 | 0.011 | |||||||
| pg154_o2_nofp.cx9a2_bee | 0.958 | 98.917 | 0.056 | 0.069 | 0.010 | ||||||
| pg16beta1_o2_nofp.cx9a2_bee | 12.583 | 66.208 | 21.208 | 0.011 | |||||||
| pg16beta2_o2_nofp.cx9a2_bee | 12.597 | 66.167 | 21.236 | 0.011 | |||||||
| pg16beta3_o2_nofp.cx9a2_bee | 0.514 | 99.111 | 0.069 | 0.306 | 0.010 |
Performance metrics for the DBMS listed above. Some are normalized by throughput, others are not. Legend for results is here.
ips	qps	rps	rmbps	wps	wmbps	rpq	rkbpq	wpi	wkbpi	csps	cpups	cspq	cpupq	dbgb1	dbgb2	rss	maxop	p50	p99	tag
100	7869	198	1.6	185.5	3.2	0.025	0.205	1.860	33.104	30742	12.6	3.907	128	149.6	189.6	10.1	0.028	7469	5819	800m.pg153_o2_nofp.cx9a2_bee
100	7777	198	1.6	156.9	3.0	0.026	0.208	1.574	31.246	30381	12.6	3.907	130	150.5	190.5	10.1	0.019	7399	5662	800m.pg154_o2_nofp.cx9a2_bee
100	7773	198	1.6	186.7	3.3	0.025	0.208	1.873	33.727	30359	12.7	3.906	131	149.7	189.8	10.1	0.016	7327	5784	800m.pg16beta1_o2_nofp.cx9a2_bee
100	7693	199	1.6	155.8	3.0	0.026	0.211	1.563	31.081	30060	12.5	3.908	130	150.5	190.5	10.1	0.024	7286	5614	800m.pg16beta2_o2_nofp.cx9a2_bee
100	7703	198	1.6	202.2	3.4	0.026	0.210	2.028	35.081	30101	12.6	3.908	131	149.7	189.7	10.1	0.010	7390	5690	800m.pg16beta3_o2_nofp.cx9a2_bee
q500.1
q500.1: range queries with 500 insert/s per client. Graphs for performance per 1-second interval are here.
Average throughput:
Query response time histogram: each cell has the percentage of responses that take <= the time in the header and max is the max response time in seconds. For max values in the top 25% of the range have a red background and in the bottom 25% of the range have a green background. The red background is not used when the min value is within 80% of the max value.
| dbms | 256us | 1ms | 4ms | 16ms | 64ms | 256ms | 1s | 4s | 16s | gt | max |
|---|---|---|---|---|---|---|---|---|---|---|---|
| pg153_o2_nofp.cx9a2_bee | 99.871 | 0.124 | 0.001 | 0.004 | 0.010 | ||||||
| pg154_o2_nofp.cx9a2_bee | 99.862 | 0.133 | 0.001 | 0.004 | 0.016 | ||||||
| pg16beta1_o2_nofp.cx9a2_bee | 99.841 | 0.153 | 0.001 | 0.004 | 0.010 | ||||||
| pg16beta2_o2_nofp.cx9a2_bee | 99.845 | 0.149 | 0.001 | 0.005 | 0.016 | ||||||
| pg16beta3_o2_nofp.cx9a2_bee | 99.870 | 0.125 | 0.001 | 0.005 | 0.016 |
Insert response time histogram: each cell has the percentage of responses that take <= the time in the header and max is the max response time in seconds. For max values in the top 25% of the range have a red background and in the bottom 25% of the range have a green background. The red background is not used when the min value is within 80% of the max value.
| dbms | 256us | 1ms | 4ms | 16ms | 64ms | 256ms | 1s | 4s | 16s | gt | max |
|---|---|---|---|---|---|---|---|---|---|---|---|
| pg153_o2_nofp.cx9a2_bee | 93.347 | 6.653 | 0.031 | ||||||||
| pg154_o2_nofp.cx9a2_bee | 94.156 | 5.844 | 0.031 | ||||||||
| pg16beta1_o2_nofp.cx9a2_bee | 92.453 | 7.547 | 0.030 | ||||||||
| pg16beta2_o2_nofp.cx9a2_bee | 92.817 | 7.183 | 0.034 | ||||||||
| pg16beta3_o2_nofp.cx9a2_bee | 93.208 | 6.792 | 0.029 |
Delete response time histogram: each cell has the percentage of responses that take <= the time in the header and max is the max response time in seconds. For max values in the top 25% of the range have a red background and in the bottom 25% of the range have a green background. The red background is not used when the min value is within 80% of the max value.
| dbms | 256us | 1ms | 4ms | 16ms | 64ms | 256ms | 1s | 4s | 16s | gt | max |
|---|---|---|---|---|---|---|---|---|---|---|---|
| pg153_o2_nofp.cx9a2_bee | 0.006 | 68.556 | 31.439 | 0.028 | |||||||
| pg154_o2_nofp.cx9a2_bee | 3.603 | 96.139 | 0.050 | 0.208 | 0.010 | ||||||
| pg16beta1_o2_nofp.cx9a2_bee | 66.311 | 33.689 | 0.027 | ||||||||
| pg16beta2_o2_nofp.cx9a2_bee | 0.006 | 67.381 | 32.614 | 0.027 | |||||||
| pg16beta3_o2_nofp.cx9a2_bee | 3.333 | 96.372 | 0.083 | 0.211 | 0.010 |
Performance metrics for the DBMS listed above. Some are normalized by throughput, others are not. Legend for results is here.
ips	qps	rps	rmbps	wps	wmbps	rpq	rkbpq	wpi	wkbpi	csps	cpups	cspq	cpupq	dbgb1	dbgb2	rss	maxop	p50	p99	tag
499	8044	804	6.4	951.2	14.6	0.100	0.816	1.907	30.001	32786	15.1	4.076	150	149.7	186.9	10.1	0.010	7639	7142	800m.pg153_o2_nofp.cx9a2_bee
499	7548	801	6.4	956.2	14.5	0.106	0.866	1.918	29.863	30899	13.6	4.094	144	150.5	187.8	10.1	0.016	7258	7016	800m.pg154_o2_nofp.cx9a2_bee
499	7784	804	6.4	958.4	14.6	0.103	0.843	1.922	30.044	31804	15.3	4.086	157	149.8	186.5	10.0	0.010	7381	7032	800m.pg16beta1_o2_nofp.cx9a2_bee
499	7582	804	6.4	951.9	14.5	0.106	0.866	1.909	29.779	31037	15.3	4.093	161	150.5	187.7	10.1	0.016	7256	6973	800m.pg16beta2_o2_nofp.cx9a2_bee
499	7721	802	6.4	965.6	14.7	0.104	0.848	1.935	30.128	31538	13.5	4.085	140	149.8	186.2	10.0	0.016	7332	7037	800m.pg16beta3_o2_nofp.cx9a2_bee
q1000.1
q1000.1: range queries with 1000 insert/s per client. Graphs for performance per 1-second interval are here.
Average throughput:
Query response time histogram: each cell has the percentage of responses that take <= the time in the header and max is the max response time in seconds. For max values in the top 25% of the range have a red background and in the bottom 25% of the range have a green background. The red background is not used when the min value is within 80% of the max value.
| dbms | 256us | 1ms | 4ms | 16ms | 64ms | 256ms | 1s | 4s | 16s | gt | max |
|---|---|---|---|---|---|---|---|---|---|---|---|
| pg153_o2_nofp.cx9a2_bee | 99.793 | 0.196 | 0.002 | 0.009 | 0.015 | ||||||
| pg154_o2_nofp.cx9a2_bee | 99.786 | 0.202 | 0.001 | 0.010 | 0.015 | ||||||
| pg16beta1_o2_nofp.cx9a2_bee | 99.779 | 0.211 | 0.002 | 0.008 | 0.015 | ||||||
| pg16beta2_o2_nofp.cx9a2_bee | 99.778 | 0.211 | 0.002 | 0.008 | 0.012 | ||||||
| pg16beta3_o2_nofp.cx9a2_bee | 99.804 | 0.184 | 0.001 | 0.010 | 0.016 |
Insert response time histogram: each cell has the percentage of responses that take <= the time in the header and max is the max response time in seconds. For max values in the top 25% of the range have a red background and in the bottom 25% of the range have a green background. The red background is not used when the min value is within 80% of the max value.
| dbms | 256us | 1ms | 4ms | 16ms | 64ms | 256ms | 1s | 4s | 16s | gt | max |
|---|---|---|---|---|---|---|---|---|---|---|---|
| pg153_o2_nofp.cx9a2_bee | 97.433 | 2.567 | 0.028 | ||||||||
| pg154_o2_nofp.cx9a2_bee | 97.549 | 2.451 | 0.027 | ||||||||
| pg16beta1_o2_nofp.cx9a2_bee | 97.597 | 2.403 | 0.029 | ||||||||
| pg16beta2_o2_nofp.cx9a2_bee | 97.932 | 2.068 | 0.033 | ||||||||
| pg16beta3_o2_nofp.cx9a2_bee | 97.258 | 2.742 | 0.029 |
Delete response time histogram: each cell has the percentage of responses that take <= the time in the header and max is the max response time in seconds. For max values in the top 25% of the range have a red background and in the bottom 25% of the range have a green background. The red background is not used when the min value is within 80% of the max value.
| dbms | 256us | 1ms | 4ms | 16ms | 64ms | 256ms | 1s | 4s | 16s | gt | max |
|---|---|---|---|---|---|---|---|---|---|---|---|
| pg153_o2_nofp.cx9a2_bee | 1.289 | 50.665 | 0.047 | 0.067 | 47.931 | 0.001 | 0.070 | ||||
| pg154_o2_nofp.cx9a2_bee | 2.671 | 97.210 | 0.068 | 0.051 | 0.009 | ||||||
| pg16beta1_o2_nofp.cx9a2_bee | 0.646 | 33.112 | 0.028 | 0.021 | 66.192 | 0.001 | 0.067 | ||||
| pg16beta2_o2_nofp.cx9a2_bee | 0.692 | 31.499 | 0.024 | 0.008 | 67.776 | 0.001 | 0.068 | ||||
| pg16beta3_o2_nofp.cx9a2_bee | 2.078 | 97.788 | 0.067 | 0.068 | 0.009 |
Performance metrics for the DBMS listed above. Some are normalized by throughput, others are not. Legend for results is here.
ips	qps	rps	rmbps	wps	wmbps	rpq	rkbpq	wpi	wkbpi	csps	cpups	cspq	cpupq	dbgb1	dbgb2	rss	maxop	p50	p99	tag
998	7746	1614	12.9	1912.7	26.9	0.208	1.703	1.916	27.555	33484	17.9	4.323	185	150.0	185.9	10.0	0.015	7401	7046	800m.pg153_o2_nofp.cx9a2_bee
997	7465	1610	12.9	1896.6	26.7	0.216	1.763	1.902	27.396	32474	14.6	4.350	156	150.7	186.7	10.0	0.015	7180	6874	800m.pg154_o2_nofp.cx9a2_bee
998	7668	1615	12.9	1917.6	27.2	0.211	1.721	1.921	27.861	33224	19.9	4.333	208	150.1	186.5	9.9	0.015	7337	6952	800m.pg16beta1_o2_nofp.cx9a2_bee
998	7553	1612	12.9	1907.5	26.8	0.213	1.744	1.911	27.484	32777	19.9	4.339	211	150.7	186.6	9.9	0.012	7240	6888	800m.pg16beta2_o2_nofp.cx9a2_bee
998	7627	1612	12.9	1908.4	27.1	0.211	1.728	1.913	27.863	33079	14.6	4.337	153	150.1	186.6	9.9	0.016	7290	6952	800m.pg16beta3_o2_nofp.cx9a2_bee
l.i0
l.i0: load without secondary indexes
Performance metrics for all DBMS, not just the ones listed above. Some are normalized by throughput, others are not. Legend for results is here.
ips	qps	rps	rmbps	wps	wmbps	rpq	rkbpq	wpi	wkbpi	csps	cpups	cspq	cpupq	dbgb1	dbgb2	rss	maxop	p50	p99	tag
71723	0	30	0.2	104.5	29.6	0.000	0.003	0.001	0.423	8755	22.3	0.122	25	76.5	116.6	2.5	0.055	71921	69720	800m.pg153_o2_nofp.cx9a2_bee
71422	0	30	0.2	99.2	29.3	0.000	0.003	0.001	0.420	8719	22.3	0.122	25	76.5	116.6	3.5	0.058	71621	69568	800m.pg154_o2_nofp.cx9a2_bee
71627	0	30	0.2	104.8	29.6	0.000	0.003	0.001	0.423	8736	22.7	0.122	25	76.5	116.6	0.4	0.056	71853	69718	800m.pg16beta1_o2_nofp.cx9a2_bee
71582	0	30	0.2	104.3	29.6	0.000	0.003	0.001	0.423	8734	22.3	0.122	25	76.5	116.6	2.6	0.083	71821	69616	800m.pg16beta2_o2_nofp.cx9a2_bee
73153	0	32	0.3	105.6	30.2	0.000	0.004	0.001	0.423	8920	22.4	0.122	24	76.5	116.6	4.5	0.055	73419	71010	800m.pg16beta3_o2_nofp.cx9a2_bee
l.x
l.x: create secondary indexes
Performance metrics for all DBMS, not just the ones listed above. Some are normalized by throughput, others are not. Legend for results is here.
ips	qps	rps	rmbps	wps	wmbps	rpq	rkbpq	wpi	wkbpi	csps	cpups	cspq	cpupq	dbgb1	dbgb2	rss	maxop	p50	p99	tag
195480	0	570	70.6	185.2	66.6	0.003	0.370	0.001	0.349	406	12.5	0.002	5	147.0	187.1	10.2	0.005	NA	NA	800m.pg153_o2_nofp.cx9a2_bee
195623	0	570	70.6	183.6	66.8	0.003	0.370	0.001	0.350	428	12.4	0.002	5	147.0	187.1	10.2	0.005	NA	NA	800m.pg154_o2_nofp.cx9a2_bee
199427	0	579	71.9	184.2	67.8	0.003	0.369	0.001	0.348	423	12.5	0.002	5	147.0	187.1	10.2	0.006	NA	NA	800m.pg16beta1_o2_nofp.cx9a2_bee
196972	0	572	71.0	181.8	67.1	0.003	0.369	0.001	0.349	416	12.4	0.002	5	147.0	187.1	10.2	0.009	NA	NA	800m.pg16beta2_o2_nofp.cx9a2_bee
198094	0	576	71.5	184.3	67.4	0.003	0.370	0.001	0.349	415	12.4	0.002	5	147.0	187.1	10.2	0.007	NA	NA	800m.pg16beta3_o2_nofp.cx9a2_bee
l.i1
l.i1: continue load after secondary indexes created
Performance metrics for all DBMS, not just the ones listed above. Some are normalized by throughput, others are not. Legend for results is here.
ips	qps	rps	rmbps	wps	wmbps	rpq	rkbpq	wpi	wkbpi	csps	cpups	cspq	cpupq	dbgb1	dbgb2	rss	maxop	p50	p99	tag
1396	0	2298	24.3	2715.7	41.5	1.646	17.807	1.946	30.446	5461	12.7	3.913	728	149.6	189.6	3.4	0.169	799	400	800m.pg153_o2_nofp.cx9a2_bee
770	0	1240	9.9	1431.0	20.8	1.610	13.100	1.858	27.683	3043	13.2	3.952	1371	150.5	179.4	9.8	0.069	449	300	800m.pg154_o2_nofp.cx9a2_bee
1349	0	2222	23.4	2632.4	40.1	1.647	17.793	1.951	30.435	5314	12.8	3.939	759	149.7	188.8	3.0	0.153	799	399	800m.pg16beta1_o2_nofp.cx9a2_bee
915	0	1472	11.8	1699.2	24.7	1.608	13.251	1.857	27.655	3567	12.6	3.897	1101	150.5	182.8	1.3	0.208	350	250	800m.pg16beta2_o2_nofp.cx9a2_bee
2340	0	3841	40.5	4537.5	68.4	1.641	17.716	1.939	29.911	9056	11.6	3.870	397	149.7	189.7	3.3	0.186	2447	749	800m.pg16beta3_o2_nofp.cx9a2_bee
q100.1
q100.1: range queries with 100 insert/s per client
Performance metrics for all DBMS, not just the ones listed above. Some are normalized by throughput, others are not. Legend for results is here.
ips	qps	rps	rmbps	wps	wmbps	rpq	rkbpq	wpi	wkbpi	csps	cpups	cspq	cpupq	dbgb1	dbgb2	rss	maxop	p50	p99	tag
100	7869	198	1.6	185.5	3.2	0.025	0.205	1.860	33.104	30742	12.6	3.907	128	149.6	189.6	10.1	0.028	7469	5819	800m.pg153_o2_nofp.cx9a2_bee
100	7777	198	1.6	156.9	3.0	0.026	0.208	1.574	31.246	30381	12.6	3.907	130	150.5	190.5	10.1	0.019	7399	5662	800m.pg154_o2_nofp.cx9a2_bee
100	7773	198	1.6	186.7	3.3	0.025	0.208	1.873	33.727	30359	12.7	3.906	131	149.7	189.8	10.1	0.016	7327	5784	800m.pg16beta1_o2_nofp.cx9a2_bee
100	7693	199	1.6	155.8	3.0	0.026	0.211	1.563	31.081	30060	12.5	3.908	130	150.5	190.5	10.1	0.024	7286	5614	800m.pg16beta2_o2_nofp.cx9a2_bee
100	7703	198	1.6	202.2	3.4	0.026	0.210	2.028	35.081	30101	12.6	3.908	131	149.7	189.7	10.1	0.010	7390	5690	800m.pg16beta3_o2_nofp.cx9a2_bee
q500.1
q500.1: range queries with 500 insert/s per client
Performance metrics for all DBMS, not just the ones listed above. Some are normalized by throughput, others are not. Legend for results is here.
ips	qps	rps	rmbps	wps	wmbps	rpq	rkbpq	wpi	wkbpi	csps	cpups	cspq	cpupq	dbgb1	dbgb2	rss	maxop	p50	p99	tag
499	8044	804	6.4	951.2	14.6	0.100	0.816	1.907	30.001	32786	15.1	4.076	150	149.7	186.9	10.1	0.010	7639	7142	800m.pg153_o2_nofp.cx9a2_bee
499	7548	801	6.4	956.2	14.5	0.106	0.866	1.918	29.863	30899	13.6	4.094	144	150.5	187.8	10.1	0.016	7258	7016	800m.pg154_o2_nofp.cx9a2_bee
499	7784	804	6.4	958.4	14.6	0.103	0.843	1.922	30.044	31804	15.3	4.086	157	149.8	186.5	10.0	0.010	7381	7032	800m.pg16beta1_o2_nofp.cx9a2_bee
499	7582	804	6.4	951.9	14.5	0.106	0.866	1.909	29.779	31037	15.3	4.093	161	150.5	187.7	10.1	0.016	7256	6973	800m.pg16beta2_o2_nofp.cx9a2_bee
499	7721	802	6.4	965.6	14.7	0.104	0.848	1.935	30.128	31538	13.5	4.085	140	149.8	186.2	10.0	0.016	7332	7037	800m.pg16beta3_o2_nofp.cx9a2_bee
q1000.1
q1000.1: range queries with 1000 insert/s per client
Performance metrics for all DBMS, not just the ones listed above. Some are normalized by throughput, others are not. Legend for results is here.
ips	qps	rps	rmbps	wps	wmbps	rpq	rkbpq	wpi	wkbpi	csps	cpups	cspq	cpupq	dbgb1	dbgb2	rss	maxop	p50	p99	tag
998	7746	1614	12.9	1912.7	26.9	0.208	1.703	1.916	27.555	33484	17.9	4.323	185	150.0	185.9	10.0	0.015	7401	7046	800m.pg153_o2_nofp.cx9a2_bee
997	7465	1610	12.9	1896.6	26.7	0.216	1.763	1.902	27.396	32474	14.6	4.350	156	150.7	186.7	10.0	0.015	7180	6874	800m.pg154_o2_nofp.cx9a2_bee
998	7668	1615	12.9	1917.6	27.2	0.211	1.721	1.921	27.861	33224	19.9	4.333	208	150.1	186.5	9.9	0.015	7337	6952	800m.pg16beta1_o2_nofp.cx9a2_bee
998	7553	1612	12.9	1907.5	26.8	0.213	1.744	1.911	27.484	32777	19.9	4.339	211	150.7	186.6	9.9	0.012	7240	6888	800m.pg16beta2_o2_nofp.cx9a2_bee
998	7627	1612	12.9	1908.4	27.1	0.211	1.728	1.913	27.863	33079	14.6	4.337	153	150.1	186.6	9.9	0.016	7290	6952	800m.pg16beta3_o2_nofp.cx9a2_bee
l.i0
- l.i0: load without secondary indexes
- Legend for results is here.
- Each entry lists the percentage of responses that fit in that bucket (slower than max time for previous bucket, faster than min time for next bucket).
Insert response time histogram
256us	1ms	4ms	16ms	64ms	256ms	1s	4s	16s	gt	max	tag
0.000	0.000	99.998	0.002	0.001	0.000	0.000	0.000	0.000	0.000	0.055	pg153_o2_nofp.cx9a2_bee
0.000	0.000	99.998	0.001	nonzero	0.000	0.000	0.000	0.000	0.000	0.058	pg154_o2_nofp.cx9a2_bee
0.000	0.000	99.999	0.001	nonzero	0.000	0.000	0.000	0.000	0.000	0.056	pg16beta1_o2_nofp.cx9a2_bee
0.000	0.000	99.999	0.001	nonzero	nonzero	0.000	0.000	0.000	0.000	0.083	pg16beta2_o2_nofp.cx9a2_bee
0.000	0.000	99.998	0.001	nonzero	0.000	0.000	0.000	0.000	0.000	0.055	pg16beta3_o2_nofp.cx9a2_bee
l.x
- l.x: create secondary indexes
- Legend for results is here.
- Each entry lists the percentage of responses that fit in that bucket (slower than max time for previous bucket, faster than min time for next bucket).
TODO - determine whether there is data for create index response time
l.i1
- l.i1: continue load after secondary indexes created
- Legend for results is here.
- Each entry lists the percentage of responses that fit in that bucket (slower than max time for previous bucket, faster than min time for next bucket).
Insert response time histogram
256us	1ms	4ms	16ms	64ms	256ms	1s	4s	16s	gt	max	tag
0.000	0.000	0.000	82.806	17.148	0.046	0.000	0.000	0.000	0.000	0.169	pg153_o2_nofp.cx9a2_bee
0.000	0.000	0.000	88.801	11.198	0.001	0.000	0.000	0.000	0.000	0.069	pg154_o2_nofp.cx9a2_bee
0.000	0.000	0.000	81.573	18.381	0.046	0.000	0.000	0.000	0.000	0.153	pg16beta1_o2_nofp.cx9a2_bee
0.000	0.000	0.000	86.638	13.358	0.004	0.000	0.000	0.000	0.000	0.208	pg16beta2_o2_nofp.cx9a2_bee
0.000	0.000	0.000	82.052	17.902	0.045	0.000	0.000	0.000	0.000	0.186	pg16beta3_o2_nofp.cx9a2_bee
Delete response time histogram
256us	1ms	4ms	16ms	64ms	256ms	1s	4s	16s	gt	max	tag
0.000	48.766	1.837	6.635	24.201	18.561	0.000	0.000	0.000	0.000	0.123	pg153_o2_nofp.cx9a2_bee
0.003	24.382	1.243	6.465	24.255	43.651	nonzero	0.000	0.000	0.000	0.306	pg154_o2_nofp.cx9a2_bee
0.001	47.175	2.275	9.714	23.938	16.896	0.000	0.000	0.000	0.000	0.133	pg16beta1_o2_nofp.cx9a2_bee
0.002	41.046	1.193	6.524	23.939	27.297	nonzero	0.000	0.000	0.000	0.332	pg16beta2_o2_nofp.cx9a2_bee
0.001	67.635	1.241	6.441	23.845	0.838	0.000	0.000	0.000	0.000	0.068	pg16beta3_o2_nofp.cx9a2_bee
q100.1
- q100.1: range queries with 100 insert/s per client
- Legend for results is here.
- Each entry lists the percentage of responses that fit in that bucket (slower than max time for previous bucket, faster than min time for next bucket).
Query response time histogram
256us	1ms	4ms	16ms	64ms	256ms	1s	4s	16s	gt	max	tag
99.613	0.383	0.002	0.002	nonzero	0.000	0.000	0.000	0.000	0.000	0.028	pg153_o2_nofp.cx9a2_bee
99.576	0.421	0.001	0.002	nonzero	0.000	0.000	0.000	0.000	0.000	0.019	pg154_o2_nofp.cx9a2_bee
99.564	0.432	0.002	0.002	0.000	0.000	0.000	0.000	0.000	0.000	0.016	pg16beta1_o2_nofp.cx9a2_bee
99.551	0.446	0.001	0.002	nonzero	0.000	0.000	0.000	0.000	0.000	0.024	pg16beta2_o2_nofp.cx9a2_bee
99.583	0.412	0.003	0.002	0.000	0.000	0.000	0.000	0.000	0.000	0.010	pg16beta3_o2_nofp.cx9a2_bee
Insert response time histogram
256us	1ms	4ms	16ms	64ms	256ms	1s	4s	16s	gt	max	tag
0.000	0.000	0.000	78.014	21.986	0.000	0.000	0.000	0.000	0.000	0.033	pg153_o2_nofp.cx9a2_bee
0.000	0.000	0.000	76.250	23.750	0.000	0.000	0.000	0.000	0.000	0.032	pg154_o2_nofp.cx9a2_bee
0.000	0.000	0.000	68.806	31.194	0.000	0.000	0.000	0.000	0.000	0.052	pg16beta1_o2_nofp.cx9a2_bee
0.000	0.000	0.000	78.583	21.417	0.000	0.000	0.000	0.000	0.000	0.031	pg16beta2_o2_nofp.cx9a2_bee
0.000	0.000	0.000	67.014	32.986	0.000	0.000	0.000	0.000	0.000	0.056	pg16beta3_o2_nofp.cx9a2_bee
Delete response time histogram
256us	1ms	4ms	16ms	64ms	256ms	1s	4s	16s	gt	max	tag
0.000	13.167	65.375	21.458	0.000	0.000	0.000	0.000	0.000	0.000	0.011	pg153_o2_nofp.cx9a2_bee
0.958	98.917	0.056	0.069	0.000	0.000	0.000	0.000	0.000	0.000	0.010	pg154_o2_nofp.cx9a2_bee
0.000	12.583	66.208	21.208	0.000	0.000	0.000	0.000	0.000	0.000	0.011	pg16beta1_o2_nofp.cx9a2_bee
0.000	12.597	66.167	21.236	0.000	0.000	0.000	0.000	0.000	0.000	0.011	pg16beta2_o2_nofp.cx9a2_bee
0.514	99.111	0.069	0.306	0.000	0.000	0.000	0.000	0.000	0.000	0.010	pg16beta3_o2_nofp.cx9a2_bee
q500.1
- q500.1: range queries with 500 insert/s per client
- Legend for results is here.
- Each entry lists the percentage of responses that fit in that bucket (slower than max time for previous bucket, faster than min time for next bucket).
Query response time histogram
256us	1ms	4ms	16ms	64ms	256ms	1s	4s	16s	gt	max	tag
99.871	0.124	0.001	0.004	0.000	0.000	0.000	0.000	0.000	0.000	0.010	pg153_o2_nofp.cx9a2_bee
99.862	0.133	0.001	0.004	0.000	0.000	0.000	0.000	0.000	0.000	0.016	pg154_o2_nofp.cx9a2_bee
99.841	0.153	0.001	0.004	0.000	0.000	0.000	0.000	0.000	0.000	0.010	pg16beta1_o2_nofp.cx9a2_bee
99.845	0.149	0.001	0.005	0.000	0.000	0.000	0.000	0.000	0.000	0.016	pg16beta2_o2_nofp.cx9a2_bee
99.870	0.125	0.001	0.005	0.000	0.000	0.000	0.000	0.000	0.000	0.016	pg16beta3_o2_nofp.cx9a2_bee
Insert response time histogram
256us	1ms	4ms	16ms	64ms	256ms	1s	4s	16s	gt	max	tag
0.000	0.000	0.000	93.347	6.653	0.000	0.000	0.000	0.000	0.000	0.031	pg153_o2_nofp.cx9a2_bee
0.000	0.000	0.000	94.156	5.844	0.000	0.000	0.000	0.000	0.000	0.031	pg154_o2_nofp.cx9a2_bee
0.000	0.000	0.000	92.453	7.547	0.000	0.000	0.000	0.000	0.000	0.030	pg16beta1_o2_nofp.cx9a2_bee
0.000	0.000	0.000	92.817	7.183	0.000	0.000	0.000	0.000	0.000	0.034	pg16beta2_o2_nofp.cx9a2_bee
0.000	0.000	0.000	93.208	6.792	0.000	0.000	0.000	0.000	0.000	0.029	pg16beta3_o2_nofp.cx9a2_bee
Delete response time histogram
256us	1ms	4ms	16ms	64ms	256ms	1s	4s	16s	gt	max	tag
0.000	0.000	0.006	68.556	31.439	0.000	0.000	0.000	0.000	0.000	0.028	pg153_o2_nofp.cx9a2_bee
3.603	96.139	0.050	0.208	0.000	0.000	0.000	0.000	0.000	0.000	0.010	pg154_o2_nofp.cx9a2_bee
0.000	0.000	0.000	66.311	33.689	0.000	0.000	0.000	0.000	0.000	0.027	pg16beta1_o2_nofp.cx9a2_bee
0.000	0.000	0.006	67.381	32.614	0.000	0.000	0.000	0.000	0.000	0.027	pg16beta2_o2_nofp.cx9a2_bee
3.333	96.372	0.083	0.211	0.000	0.000	0.000	0.000	0.000	0.000	0.010	pg16beta3_o2_nofp.cx9a2_bee
q1000.1
- q1000.1: range queries with 1000 insert/s per client
- Legend for results is here.
- Each entry lists the percentage of responses that fit in that bucket (slower than max time for previous bucket, faster than min time for next bucket).
Query response time histogram
256us	1ms	4ms	16ms	64ms	256ms	1s	4s	16s	gt	max	tag
99.793	0.196	0.002	0.009	0.000	0.000	0.000	0.000	0.000	0.000	0.015	pg153_o2_nofp.cx9a2_bee
99.786	0.202	0.001	0.010	0.000	0.000	0.000	0.000	0.000	0.000	0.015	pg154_o2_nofp.cx9a2_bee
99.779	0.211	0.002	0.008	0.000	0.000	0.000	0.000	0.000	0.000	0.015	pg16beta1_o2_nofp.cx9a2_bee
99.778	0.211	0.002	0.008	0.000	0.000	0.000	0.000	0.000	0.000	0.012	pg16beta2_o2_nofp.cx9a2_bee
99.804	0.184	0.001	0.010	0.000	0.000	0.000	0.000	0.000	0.000	0.016	pg16beta3_o2_nofp.cx9a2_bee
Insert response time histogram
256us	1ms	4ms	16ms	64ms	256ms	1s	4s	16s	gt	max	tag
0.000	0.000	0.000	97.433	2.567	0.000	0.000	0.000	0.000	0.000	0.028	pg153_o2_nofp.cx9a2_bee
0.000	0.000	0.000	97.549	2.451	0.000	0.000	0.000	0.000	0.000	0.027	pg154_o2_nofp.cx9a2_bee
0.000	0.000	0.000	97.597	2.403	0.000	0.000	0.000	0.000	0.000	0.029	pg16beta1_o2_nofp.cx9a2_bee
0.000	0.000	0.000	97.932	2.068	0.000	0.000	0.000	0.000	0.000	0.033	pg16beta2_o2_nofp.cx9a2_bee
0.000	0.000	0.000	97.258	2.742	0.000	0.000	0.000	0.000	0.000	0.029	pg16beta3_o2_nofp.cx9a2_bee
Delete response time histogram
256us	1ms	4ms	16ms	64ms	256ms	1s	4s	16s	gt	max	tag
1.289	50.665	0.047	0.067	47.931	0.001	0.000	0.000	0.000	0.000	0.070	pg153_o2_nofp.cx9a2_bee
2.671	97.210	0.068	0.051	0.000	0.000	0.000	0.000	0.000	0.000	0.009	pg154_o2_nofp.cx9a2_bee
0.646	33.112	0.028	0.021	66.192	0.001	0.000	0.000	0.000	0.000	0.067	pg16beta1_o2_nofp.cx9a2_bee
0.692	31.499	0.024	0.008	67.776	0.001	0.000	0.000	0.000	0.000	0.068	pg16beta2_o2_nofp.cx9a2_bee
2.078	97.788	0.067	0.068	0.000	0.000	0.000	0.000	0.000	0.000	0.009	pg16beta3_o2_nofp.cx9a2_bee