Introduction
This is a report for the insert benchmark with 20M docs and 1 client(s). It is generated by scripts (bash, awk, sed) and Tufte might not be impressed. An overview of the insert benchmark is here and a short update is here. Below, by DBMS, I mean DBMS+version.config. An example is my8020.c10b40 where my means MySQL, 8020 is version 8.0.20 and c10b40 is the name for the configuration file.
The test server has 8 AMD cores, 16G RAM and an NVMe SSD. It is described here as the Beelink. The benchmark was run with 1 client and there were 1 or 3 connections per client (1 for queries or inserts without rate limits, 1+1 for rate limited inserts+deletes). It uses 1 table. It loads 20M rows per table without secondary indexes, creates secondary indexes, then inserts 200M rows per table with a delete per insert to avoid growing the table. It then does 3 read+write tests for 7200s each that do queries as fast as possible with 100, 500 and then 1000 inserts/second/client concurrent with the queries and 1000 deletes/second to avoid growing the table. The database is cached by Postgres. Clients and the DBMS share one server. The per-database configs are in the per-database subdirectories here.
The tested DBMS are:
- pg153_o2_nofp.cx9a1_bee - Postgres 15.3, o2_nofp build that used -O2 -no-omit-frame-pointer, a1 config
- pg154_o2_nofp.cx9a1_bee - Postgres 15.4, o2_nofp build that used -O2 -no-omit-frame-pointer, a1 config
- pg16beta1_o2_nofp.cx9a1_bee - Postgres 16 beta1, o2_nofp build that used -O2 -no-omit-frame-pointer, a1 config
- pg16beta2_o2_nofp.cx9a1_bee - Postgres 16 beta2, o2_nofp build that used -O2 -no-omit-frame-pointer, a1 config
- pg16beta3_o2_nofp.cx9a1_bee - Postgres 16 beta3, o2_nofp build that used -O2 -no-omit-frame-pointer, a1 config
Contents
- Summary
- l.i0: load without secondary indexes
- l.x: create secondary indexes
- l.i1: continue load after secondary indexes created
- q100.1: range queries with 100 insert/s per client
- q500.1: range queries with 500 insert/s per client
- q1000.1: range queries with 1000 insert/s per client
Summary
The numbers are inserts/s for l.i0 and l.i1, indexed docs (or rows) /s for l.x and queries/s for q*.2. The values are the average rate over the entire test for inserts (IPS) and queries (QPS). The range of values for IPS and QPS is split into 3 parts: bottom 25%, middle 50%, top 25%. Values in the bottom 25% have a red background, values in the top 25% have a green background and values in the middle have no color. A gray background is used for values that can be ignored because the DBMS did not sustain the target insert rate. Red backgrounds are not used when the minimum value is within 80% of the max value.
| dbms | l.i0 | l.x | l.i1 | q100.1 | q500.1 | q1000.1 |
|---|---|---|---|---|---|---|
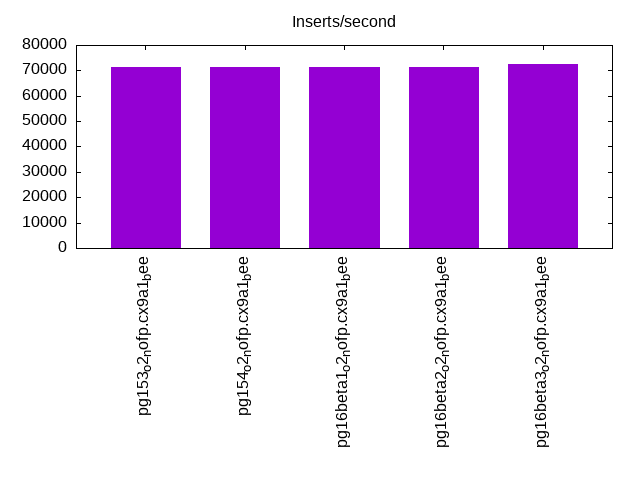
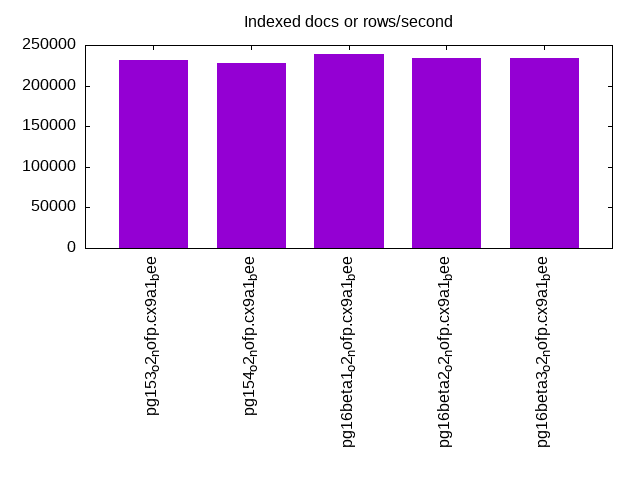
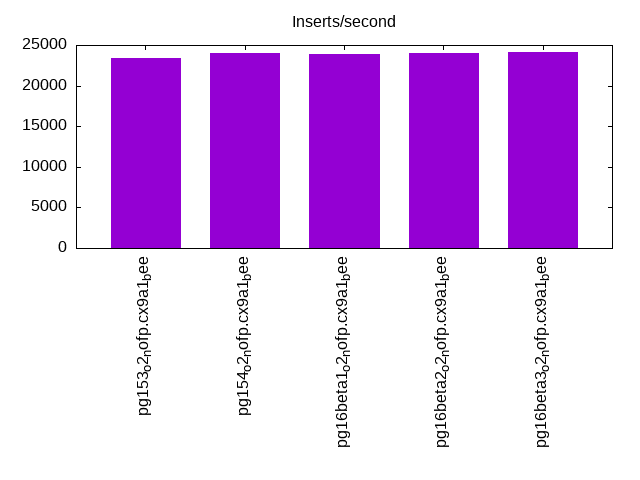
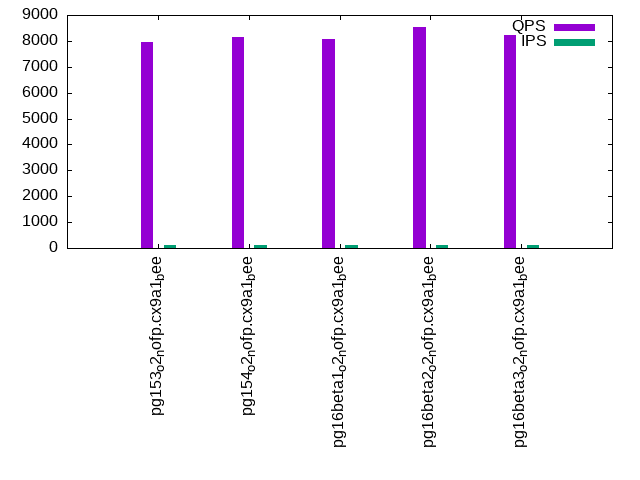
| pg153_o2_nofp.cx9a1_bee | 71174 | 231034 | 23343 | 7973 | 7830 | 8179 |
| pg154_o2_nofp.cx9a1_bee | 71174 | 228409 | 23958 | 8134 | 7936 | 8052 |
| pg16beta1_o2_nofp.cx9a1_bee | 71174 | 239286 | 23880 | 8087 | 8154 | 7890 |
| pg16beta2_o2_nofp.cx9a1_bee | 71174 | 233721 | 24007 | 8540 | 8147 | 8176 |
| pg16beta3_o2_nofp.cx9a1_bee | 72464 | 233721 | 24166 | 8219 | 8383 | 8284 |
This table has relative throughput, throughput for the DBMS relative to the DBMS in the first line, using the absolute throughput from the previous table. Values less than 0.95 have a yellow background. Values greater than 1.05 have a blue background.
| dbms | l.i0 | l.x | l.i1 | q100.1 | q500.1 | q1000.1 |
|---|---|---|---|---|---|---|
| pg153_o2_nofp.cx9a1_bee | 1.00 | 1.00 | 1.00 | 1.00 | 1.00 | 1.00 |
| pg154_o2_nofp.cx9a1_bee | 1.00 | 0.99 | 1.03 | 1.02 | 1.01 | 0.98 |
| pg16beta1_o2_nofp.cx9a1_bee | 1.00 | 1.04 | 1.02 | 1.01 | 1.04 | 0.96 |
| pg16beta2_o2_nofp.cx9a1_bee | 1.00 | 1.01 | 1.03 | 1.07 | 1.04 | 1.00 |
| pg16beta3_o2_nofp.cx9a1_bee | 1.02 | 1.01 | 1.04 | 1.03 | 1.07 | 1.01 |
This lists the average rate of inserts/s for the tests that do inserts concurrent with queries. For such tests the query rate is listed in the table above. The read+write tests are setup so that the insert rate should match the target rate every second. Cells that are not at least 95% of the target have a red background to indicate a failure to satisfy the target.
| dbms | q100.1 | q500.1 | q1000.1 |
|---|---|---|---|
| pg153_o2_nofp.cx9a1_bee | 100 | 499 | 998 |
| pg154_o2_nofp.cx9a1_bee | 100 | 499 | 998 |
| pg16beta1_o2_nofp.cx9a1_bee | 100 | 499 | 997 |
| pg16beta2_o2_nofp.cx9a1_bee | 100 | 499 | 998 |
| pg16beta3_o2_nofp.cx9a1_bee | 100 | 499 | 998 |
| target | 100 | 500 | 1000 |
l.i0
l.i0: load without secondary indexes. Graphs for performance per 1-second interval are here.
Average throughput:
Insert response time histogram: each cell has the percentage of responses that take <= the time in the header and max is the max response time in seconds. For the max column values in the top 25% of the range have a red background and in the bottom 25% of the range have a green background. The red background is not used when the min value is within 80% of the max value.
| dbms | 256us | 1ms | 4ms | 16ms | 64ms | 256ms | 1s | 4s | 16s | gt | max |
|---|---|---|---|---|---|---|---|---|---|---|---|
| pg153_o2_nofp.cx9a1_bee | 100.000 | 0.003 | |||||||||
| pg154_o2_nofp.cx9a1_bee | 100.000 | 0.004 | |||||||||
| pg16beta1_o2_nofp.cx9a1_bee | 100.000 | 0.003 | |||||||||
| pg16beta2_o2_nofp.cx9a1_bee | 100.000 | 0.003 | |||||||||
| pg16beta3_o2_nofp.cx9a1_bee | 99.999 | 0.001 | 0.005 |
Performance metrics for the DBMS listed above. Some are normalized by throughput, others are not. Legend for results is here.
ips	qps	rps	rmbps	wps	wmbps	rpq	rkbpq	wpi	wkbpi	csps	cpups	cspq	cpupq	dbgb1	dbgb2	rss	maxop	p50	p99	tag
71174	0	0	0.0	82.0	30.2	0.000	0.000	0.001	0.435	8807	22.2	0.124	25	1.9	5.2	1.5	0.003	71747	64330	20m.pg153_o2_nofp.cx9a1_bee
71174	0	0	0.0	85.0	30.8	0.000	0.000	0.001	0.443	8764	22.7	0.123	26	1.9	5.2	1.9	0.004	71520	69650	20m.pg154_o2_nofp.cx9a1_bee
71174	0	0	0.0	82.9	29.9	0.000	0.000	0.001	0.430	8745	22.3	0.123	25	1.9	5.2	1.5	0.003	71322	69583	20m.pg16beta1_o2_nofp.cx9a1_bee
71174	0	0	0.0	83.0	30.0	0.000	0.000	0.001	0.431	8771	22.5	0.123	25	1.9	5.2	0.2	0.003	71630	69186	20m.pg16beta2_o2_nofp.cx9a1_bee
72464	0	0	0.0	84.9	30.7	0.000	0.000	0.001	0.434	8953	22.5	0.124	25	1.9	5.2	0.2	0.005	73020	71214	20m.pg16beta3_o2_nofp.cx9a1_bee
l.x
l.x: create secondary indexes.
Average throughput:
Performance metrics for the DBMS listed above. Some are normalized by throughput, others are not. Legend for results is here.
ips	qps	rps	rmbps	wps	wmbps	rpq	rkbpq	wpi	wkbpi	csps	cpups	cspq	cpupq	dbgb1	dbgb2	rss	maxop	p50	p99	tag
231034	0	0	0.0	88.0	35.0	0.000	0.000	0.000	0.155	700	11.7	0.003	4	3.7	8.0	2.1	0.003	NA	NA	20m.pg153_o2_nofp.cx9a1_bee
228409	0	0	0.0	70.7	32.9	0.000	0.000	0.000	0.147	633	11.8	0.003	4	3.7	8.0	2.1	0.003	NA	NA	20m.pg154_o2_nofp.cx9a1_bee
239286	0	0	0.0	73.1	33.8	0.000	0.000	0.000	0.145	669	12.2	0.003	4	3.7	8.0	2.1	0.003	NA	NA	20m.pg16beta1_o2_nofp.cx9a1_bee
233721	0	0	0.0	82.9	38.3	0.000	0.000	0.000	0.168	648	12.2	0.003	4	3.7	8.0	2.1	0.003	NA	NA	20m.pg16beta2_o2_nofp.cx9a1_bee
233721	0	0	0.0	89.8	41.8	0.000	0.000	0.000	0.183	714	12.0	0.003	4	3.7	8.0	2.1	0.003	NA	NA	20m.pg16beta3_o2_nofp.cx9a1_bee
l.i1
l.i1: continue load after secondary indexes created. Graphs for performance per 1-second interval are here.
Average throughput:
Insert response time histogram: each cell has the percentage of responses that take <= the time in the header and max is the max response time in seconds. For the max column values in the top 25% of the range have a red background and in the bottom 25% of the range have a green background. The red background is not used when the min value is within 80% of the max value.
| dbms | 256us | 1ms | 4ms | 16ms | 64ms | 256ms | 1s | 4s | 16s | gt | max |
|---|---|---|---|---|---|---|---|---|---|---|---|
| pg153_o2_nofp.cx9a1_bee | 99.990 | 0.010 | nonzero | 0.023 | |||||||
| pg154_o2_nofp.cx9a1_bee | 99.989 | 0.011 | nonzero | 0.021 | |||||||
| pg16beta1_o2_nofp.cx9a1_bee | 99.990 | 0.010 | nonzero | 0.043 | |||||||
| pg16beta2_o2_nofp.cx9a1_bee | 99.986 | 0.014 | nonzero | 0.020 | |||||||
| pg16beta3_o2_nofp.cx9a1_bee | 99.990 | 0.010 | nonzero | 0.038 |
Delete response time histogram: each cell has the percentage of responses that take <= the time in the header and max is the max response time in seconds. For the max column values in the top 25% of the range have a red background and in the bottom 25% of the range have a green background. The red background is not used when the min value is within 80% of the max value.
| dbms | 256us | 1ms | 4ms | 16ms | 64ms | 256ms | 1s | 4s | 16s | gt | max |
|---|---|---|---|---|---|---|---|---|---|---|---|
| pg153_o2_nofp.cx9a1_bee | 0.103 | 84.197 | 7.350 | 8.351 | nonzero | 0.020 | |||||
| pg154_o2_nofp.cx9a1_bee | 0.094 | 84.107 | 9.155 | 6.644 | nonzero | 0.018 | |||||
| pg16beta1_o2_nofp.cx9a1_bee | 0.092 | 83.761 | 8.652 | 7.495 | nonzero | 0.042 | |||||
| pg16beta2_o2_nofp.cx9a1_bee | 0.090 | 83.903 | 8.805 | 7.202 | nonzero | 0.018 | |||||
| pg16beta3_o2_nofp.cx9a1_bee | 0.109 | 84.186 | 8.183 | 7.522 | nonzero | 0.019 |
Performance metrics for the DBMS listed above. Some are normalized by throughput, others are not. Legend for results is here.
ips	qps	rps	rmbps	wps	wmbps	rpq	rkbpq	wpi	wkbpi	csps	cpups	cspq	cpupq	dbgb1	dbgb2	rss	maxop	p50	p99	tag
23343	0	0	0.0	69.0	19.0	0.000	0.000	0.003	0.833	11165	23.4	0.478	80	5.1	45.1	5.1	0.023	29267	5796	20m.pg153_o2_nofp.cx9a1_bee
23958	0	0	0.0	68.9	19.5	0.000	0.000	0.003	0.832	11459	23.6	0.478	79	5.1	45.1	5.1	0.021	29017	5943	20m.pg154_o2_nofp.cx9a1_bee
23880	0	0	0.0	68.6	19.4	0.000	0.000	0.003	0.833	11498	23.6	0.481	79	5.1	45.1	5.0	0.043	29219	5893	20m.pg16beta1_o2_nofp.cx9a1_bee
24007	0	0	0.0	68.2	19.3	0.000	0.000	0.003	0.825	11545	23.6	0.481	79	5.1	45.1	4.9	0.020	29127	9889	20m.pg16beta2_o2_nofp.cx9a1_bee
24166	0	0	0.0	68.5	19.5	0.000	0.000	0.003	0.824	11611	23.7	0.480	78	5.1	45.1	5.2	0.038	29379	9939	20m.pg16beta3_o2_nofp.cx9a1_bee
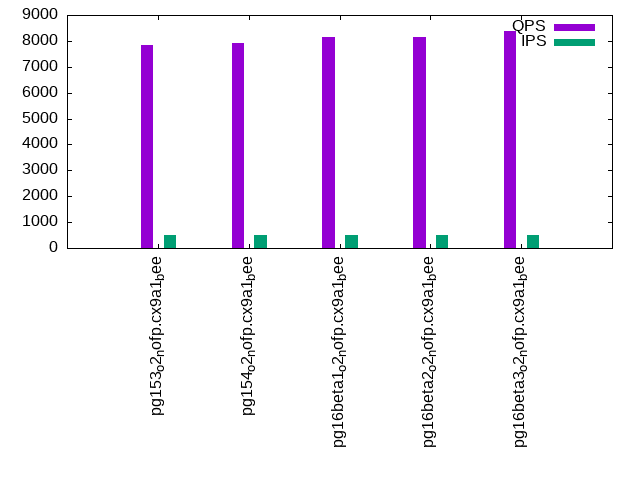
q100.1
q100.1: range queries with 100 insert/s per client. Graphs for performance per 1-second interval are here.
Average throughput:
Query response time histogram: each cell has the percentage of responses that take <= the time in the header and max is the max response time in seconds. For max values in the top 25% of the range have a red background and in the bottom 25% of the range have a green background. The red background is not used when the min value is within 80% of the max value.
| dbms | 256us | 1ms | 4ms | 16ms | 64ms | 256ms | 1s | 4s | 16s | gt | max |
|---|---|---|---|---|---|---|---|---|---|---|---|
| pg153_o2_nofp.cx9a1_bee | 99.901 | 0.098 | nonzero | nonzero | 0.004 | ||||||
| pg154_o2_nofp.cx9a1_bee | 99.919 | 0.081 | nonzero | 0.004 | |||||||
| pg16beta1_o2_nofp.cx9a1_bee | 99.917 | 0.083 | nonzero | nonzero | 0.004 | ||||||
| pg16beta2_o2_nofp.cx9a1_bee | 99.947 | 0.052 | nonzero | 0.004 | |||||||
| pg16beta3_o2_nofp.cx9a1_bee | 99.920 | 0.080 | nonzero | nonzero | 0.004 |
Insert response time histogram: each cell has the percentage of responses that take <= the time in the header and max is the max response time in seconds. For max values in the top 25% of the range have a red background and in the bottom 25% of the range have a green background. The red background is not used when the min value is within 80% of the max value.
| dbms | 256us | 1ms | 4ms | 16ms | 64ms | 256ms | 1s | 4s | 16s | gt | max |
|---|---|---|---|---|---|---|---|---|---|---|---|
| pg153_o2_nofp.cx9a1_bee | 80.528 | 19.472 | 0.006 | ||||||||
| pg154_o2_nofp.cx9a1_bee | 82.597 | 17.403 | 0.006 | ||||||||
| pg16beta1_o2_nofp.cx9a1_bee | 82.194 | 17.806 | 0.006 | ||||||||
| pg16beta2_o2_nofp.cx9a1_bee | 65.306 | 34.694 | 0.006 | ||||||||
| pg16beta3_o2_nofp.cx9a1_bee | 68.333 | 31.667 | 0.007 |
Delete response time histogram: each cell has the percentage of responses that take <= the time in the header and max is the max response time in seconds. For max values in the top 25% of the range have a red background and in the bottom 25% of the range have a green background. The red background is not used when the min value is within 80% of the max value.
| dbms | 256us | 1ms | 4ms | 16ms | 64ms | 256ms | 1s | 4s | 16s | gt | max |
|---|---|---|---|---|---|---|---|---|---|---|---|
| pg153_o2_nofp.cx9a1_bee | 2.278 | 58.472 | 33.792 | 5.458 | 0.009 | ||||||
| pg154_o2_nofp.cx9a1_bee | 0.722 | 99.236 | 0.042 | 0.004 | |||||||
| pg16beta1_o2_nofp.cx9a1_bee | 1.250 | 98.722 | 0.028 | 0.002 | |||||||
| pg16beta2_o2_nofp.cx9a1_bee | 0.042 | 44.819 | 55.125 | 0.014 | 0.005 | ||||||
| pg16beta3_o2_nofp.cx9a1_bee | 0.917 | 53.708 | 39.097 | 6.278 | 0.009 |
Performance metrics for the DBMS listed above. Some are normalized by throughput, others are not. Legend for results is here.
ips	qps	rps	rmbps	wps	wmbps	rpq	rkbpq	wpi	wkbpi	csps	cpups	cspq	cpupq	dbgb1	dbgb2	rss	maxop	p50	p99	tag
100	7973	0	0.0	41.3	2.1	0.000	0.000	0.415	21.380	30710	12.8	3.852	128	5.1	45.1	3.3	0.004	7592	7431	20m.pg153_o2_nofp.cx9a1_bee
100	8134	0	0.0	39.8	2.0	0.000	0.000	0.399	20.923	31318	12.7	3.850	125	5.1	45.1	3.3	0.004	7616	7445	20m.pg154_o2_nofp.cx9a1_bee
100	8087	0	0.0	40.0	2.1	0.000	0.000	0.401	21.167	31130	12.6	3.849	125	5.1	45.1	3.3	0.004	7655	7480	20m.pg16beta1_o2_nofp.cx9a1_bee
100	8540	0	0.0	40.6	2.3	0.000	0.000	0.408	23.920	32910	12.6	3.854	118	5.1	44.9	2.9	0.004	8276	7462	20m.pg16beta2_o2_nofp.cx9a1_bee
100	8219	0	0.0	40.7	2.3	0.000	0.000	0.408	23.931	31626	12.6	3.848	123	5.1	44.9	3.2	0.004	7702	7510	20m.pg16beta3_o2_nofp.cx9a1_bee
q500.1
q500.1: range queries with 500 insert/s per client. Graphs for performance per 1-second interval are here.
Average throughput:
Query response time histogram: each cell has the percentage of responses that take <= the time in the header and max is the max response time in seconds. For max values in the top 25% of the range have a red background and in the bottom 25% of the range have a green background. The red background is not used when the min value is within 80% of the max value.
| dbms | 256us | 1ms | 4ms | 16ms | 64ms | 256ms | 1s | 4s | 16s | gt | max |
|---|---|---|---|---|---|---|---|---|---|---|---|
| pg153_o2_nofp.cx9a1_bee | 99.929 | 0.071 | nonzero | nonzero | 0.012 | ||||||
| pg154_o2_nofp.cx9a1_bee | 99.928 | 0.072 | nonzero | 0.003 | |||||||
| pg16beta1_o2_nofp.cx9a1_bee | 99.931 | 0.069 | nonzero | 0.003 | |||||||
| pg16beta2_o2_nofp.cx9a1_bee | 99.933 | 0.067 | nonzero | nonzero | 0.005 | ||||||
| pg16beta3_o2_nofp.cx9a1_bee | 99.938 | 0.062 | nonzero | 0.003 |
Insert response time histogram: each cell has the percentage of responses that take <= the time in the header and max is the max response time in seconds. For max values in the top 25% of the range have a red background and in the bottom 25% of the range have a green background. The red background is not used when the min value is within 80% of the max value.
| dbms | 256us | 1ms | 4ms | 16ms | 64ms | 256ms | 1s | 4s | 16s | gt | max |
|---|---|---|---|---|---|---|---|---|---|---|---|
| pg153_o2_nofp.cx9a1_bee | 91.106 | 8.894 | 0.008 | ||||||||
| pg154_o2_nofp.cx9a1_bee | 91.353 | 8.647 | 0.011 | ||||||||
| pg16beta1_o2_nofp.cx9a1_bee | 91.081 | 8.919 | 0.008 | ||||||||
| pg16beta2_o2_nofp.cx9a1_bee | 93.072 | 6.928 | 0.012 | ||||||||
| pg16beta3_o2_nofp.cx9a1_bee | 93.331 | 6.669 | 0.008 |
Delete response time histogram: each cell has the percentage of responses that take <= the time in the header and max is the max response time in seconds. For max values in the top 25% of the range have a red background and in the bottom 25% of the range have a green background. The red background is not used when the min value is within 80% of the max value.
| dbms | 256us | 1ms | 4ms | 16ms | 64ms | 256ms | 1s | 4s | 16s | gt | max |
|---|---|---|---|---|---|---|---|---|---|---|---|
| pg153_o2_nofp.cx9a1_bee | 4.133 | 83.497 | 8.439 | 3.919 | 0.011 | 0.018 | |||||
| pg154_o2_nofp.cx9a1_bee | 3.528 | 76.100 | 0.139 | 20.233 | 0.015 | ||||||
| pg16beta1_o2_nofp.cx9a1_bee | 2.514 | 75.017 | 0.100 | 22.369 | 0.014 | ||||||
| pg16beta2_o2_nofp.cx9a1_bee | 2.639 | 74.378 | 0.081 | 22.903 | 0.012 | ||||||
| pg16beta3_o2_nofp.cx9a1_bee | 3.722 | 88.036 | 6.603 | 1.633 | 0.006 | 0.018 |
Performance metrics for the DBMS listed above. Some are normalized by throughput, others are not. Legend for results is here.
ips	qps	rps	rmbps	wps	wmbps	rpq	rkbpq	wpi	wkbpi	csps	cpups	cspq	cpupq	dbgb1	dbgb2	rss	maxop	p50	p99	tag
499	7830	0	0.0	42.4	2.4	0.000	0.000	0.085	4.977	30263	13.1	3.865	134	5.1	42.8	2.0	0.012	7526	7383	20m.pg153_o2_nofp.cx9a1_bee
499	7936	0	0.0	41.2	2.4	0.000	0.000	0.083	4.878	30661	13.2	3.864	133	5.1	42.7	2.0	0.003	7544	7383	20m.pg154_o2_nofp.cx9a1_bee
499	8154	0	0.0	41.1	2.4	0.000	0.000	0.082	4.912	31512	13.0	3.865	128	5.1	42.7	1.9	0.003	7571	7336	20m.pg16beta1_o2_nofp.cx9a1_bee
499	8147	0	0.0	26.3	2.5	0.000	0.000	0.053	5.156	31488	13.0	3.865	128	5.1	42.4	0.2	0.005	7576	7368	20m.pg16beta2_o2_nofp.cx9a1_bee
499	8383	0	0.0	38.7	2.4	0.000	0.000	0.077	4.877	32394	12.8	3.864	122	5.1	42.5	5.2	0.003	7766	7544	20m.pg16beta3_o2_nofp.cx9a1_bee
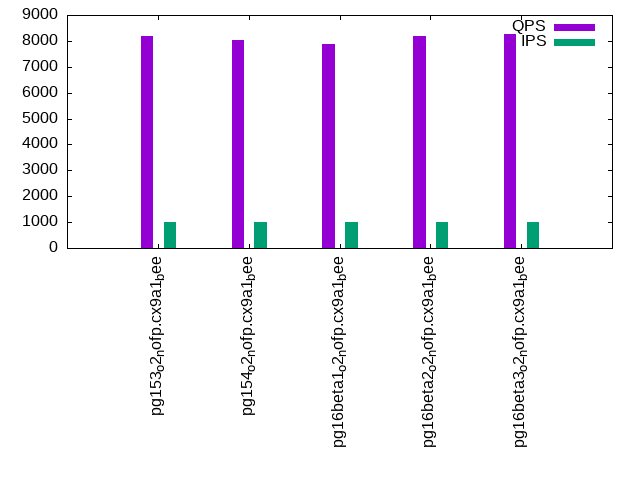
q1000.1
q1000.1: range queries with 1000 insert/s per client. Graphs for performance per 1-second interval are here.
Average throughput:
Query response time histogram: each cell has the percentage of responses that take <= the time in the header and max is the max response time in seconds. For max values in the top 25% of the range have a red background and in the bottom 25% of the range have a green background. The red background is not used when the min value is within 80% of the max value.
| dbms | 256us | 1ms | 4ms | 16ms | 64ms | 256ms | 1s | 4s | 16s | gt | max |
|---|---|---|---|---|---|---|---|---|---|---|---|
| pg153_o2_nofp.cx9a1_bee | 99.937 | 0.062 | nonzero | 0.003 | |||||||
| pg154_o2_nofp.cx9a1_bee | 99.933 | 0.066 | nonzero | nonzero | nonzero | 0.020 | |||||
| pg16beta1_o2_nofp.cx9a1_bee | 99.926 | 0.074 | nonzero | 0.004 | |||||||
| pg16beta2_o2_nofp.cx9a1_bee | 99.938 | 0.062 | nonzero | nonzero | 0.005 | ||||||
| pg16beta3_o2_nofp.cx9a1_bee | 99.945 | 0.055 | nonzero | nonzero | 0.004 |
Insert response time histogram: each cell has the percentage of responses that take <= the time in the header and max is the max response time in seconds. For max values in the top 25% of the range have a red background and in the bottom 25% of the range have a green background. The red background is not used when the min value is within 80% of the max value.
| dbms | 256us | 1ms | 4ms | 16ms | 64ms | 256ms | 1s | 4s | 16s | gt | max |
|---|---|---|---|---|---|---|---|---|---|---|---|
| pg153_o2_nofp.cx9a1_bee | 96.622 | 3.378 | 0.007 | ||||||||
| pg154_o2_nofp.cx9a1_bee | 96.128 | 3.867 | 0.006 | 0.024 | |||||||
| pg16beta1_o2_nofp.cx9a1_bee | 95.837 | 4.163 | 0.009 | ||||||||
| pg16beta2_o2_nofp.cx9a1_bee | 96.692 | 3.308 | 0.006 | ||||||||
| pg16beta3_o2_nofp.cx9a1_bee | 96.414 | 3.586 | 0.006 |
Delete response time histogram: each cell has the percentage of responses that take <= the time in the header and max is the max response time in seconds. For max values in the top 25% of the range have a red background and in the bottom 25% of the range have a green background. The red background is not used when the min value is within 80% of the max value.
| dbms | 256us | 1ms | 4ms | 16ms | 64ms | 256ms | 1s | 4s | 16s | gt | max |
|---|---|---|---|---|---|---|---|---|---|---|---|
| pg153_o2_nofp.cx9a1_bee | 2.175 | 79.757 | 18.057 | 0.011 | 0.005 | ||||||
| pg154_o2_nofp.cx9a1_bee | 2.306 | 76.794 | 0.144 | 20.750 | 0.006 | 0.021 | |||||
| pg16beta1_o2_nofp.cx9a1_bee | 1.565 | 75.749 | 2.113 | 20.574 | 0.010 | ||||||
| pg16beta2_o2_nofp.cx9a1_bee | 1.942 | 80.885 | 0.124 | 17.050 | 0.013 | ||||||
| pg16beta3_o2_nofp.cx9a1_bee | 2.060 | 80.892 | 7.604 | 9.444 | 0.014 |
Performance metrics for the DBMS listed above. Some are normalized by throughput, others are not. Legend for results is here.
ips	qps	rps	rmbps	wps	wmbps	rpq	rkbpq	wpi	wkbpi	csps	cpups	cspq	cpupq	dbgb1	dbgb2	rss	maxop	p50	p99	tag
998	8179	0	0.0	26.5	2.8	0.000	0.000	0.027	2.919	31804	13.7	3.889	134	5.1	39.3	5.1	0.003	7605	7368	20m.pg153_o2_nofp.cx9a1_bee
998	8052	0	0.0	24.8	2.9	0.000	0.000	0.025	3.025	31329	14.0	3.891	139	5.1	39.3	1.5	0.020	7525	7308	20m.pg154_o2_nofp.cx9a1_bee
997	7890	0	0.0	24.4	3.0	0.000	0.000	0.024	3.041	30734	13.9	3.895	141	5.1	39.4	3.6	0.004	7550	7401	20m.pg16beta1_o2_nofp.cx9a1_bee
998	8176	0	0.0	23.6	2.9	0.000	0.000	0.024	2.985	31820	13.9	3.892	136	5.1	38.9	4.9	0.005	7591	7368	20m.pg16beta2_o2_nofp.cx9a1_bee
998	8284	0	0.0	24.3	2.9	0.000	0.000	0.024	2.939	32205	13.7	3.888	132	5.1	39.1	2.5	0.004	7706	7496	20m.pg16beta3_o2_nofp.cx9a1_bee
l.i0
l.i0: load without secondary indexes
Performance metrics for all DBMS, not just the ones listed above. Some are normalized by throughput, others are not. Legend for results is here.
ips	qps	rps	rmbps	wps	wmbps	rpq	rkbpq	wpi	wkbpi	csps	cpups	cspq	cpupq	dbgb1	dbgb2	rss	maxop	p50	p99	tag
71174	0	0	0.0	82.0	30.2	0.000	0.000	0.001	0.435	8807	22.2	0.124	25	1.9	5.2	1.5	0.003	71747	64330	20m.pg153_o2_nofp.cx9a1_bee
71174	0	0	0.0	85.0	30.8	0.000	0.000	0.001	0.443	8764	22.7	0.123	26	1.9	5.2	1.9	0.004	71520	69650	20m.pg154_o2_nofp.cx9a1_bee
71174	0	0	0.0	82.9	29.9	0.000	0.000	0.001	0.430	8745	22.3	0.123	25	1.9	5.2	1.5	0.003	71322	69583	20m.pg16beta1_o2_nofp.cx9a1_bee
71174	0	0	0.0	83.0	30.0	0.000	0.000	0.001	0.431	8771	22.5	0.123	25	1.9	5.2	0.2	0.003	71630	69186	20m.pg16beta2_o2_nofp.cx9a1_bee
72464	0	0	0.0	84.9	30.7	0.000	0.000	0.001	0.434	8953	22.5	0.124	25	1.9	5.2	0.2	0.005	73020	71214	20m.pg16beta3_o2_nofp.cx9a1_bee
l.x
l.x: create secondary indexes
Performance metrics for all DBMS, not just the ones listed above. Some are normalized by throughput, others are not. Legend for results is here.
ips	qps	rps	rmbps	wps	wmbps	rpq	rkbpq	wpi	wkbpi	csps	cpups	cspq	cpupq	dbgb1	dbgb2	rss	maxop	p50	p99	tag
231034	0	0	0.0	88.0	35.0	0.000	0.000	0.000	0.155	700	11.7	0.003	4	3.7	8.0	2.1	0.003	NA	NA	20m.pg153_o2_nofp.cx9a1_bee
228409	0	0	0.0	70.7	32.9	0.000	0.000	0.000	0.147	633	11.8	0.003	4	3.7	8.0	2.1	0.003	NA	NA	20m.pg154_o2_nofp.cx9a1_bee
239286	0	0	0.0	73.1	33.8	0.000	0.000	0.000	0.145	669	12.2	0.003	4	3.7	8.0	2.1	0.003	NA	NA	20m.pg16beta1_o2_nofp.cx9a1_bee
233721	0	0	0.0	82.9	38.3	0.000	0.000	0.000	0.168	648	12.2	0.003	4	3.7	8.0	2.1	0.003	NA	NA	20m.pg16beta2_o2_nofp.cx9a1_bee
233721	0	0	0.0	89.8	41.8	0.000	0.000	0.000	0.183	714	12.0	0.003	4	3.7	8.0	2.1	0.003	NA	NA	20m.pg16beta3_o2_nofp.cx9a1_bee
l.i1
l.i1: continue load after secondary indexes created
Performance metrics for all DBMS, not just the ones listed above. Some are normalized by throughput, others are not. Legend for results is here.
ips	qps	rps	rmbps	wps	wmbps	rpq	rkbpq	wpi	wkbpi	csps	cpups	cspq	cpupq	dbgb1	dbgb2	rss	maxop	p50	p99	tag
23343	0	0	0.0	69.0	19.0	0.000	0.000	0.003	0.833	11165	23.4	0.478	80	5.1	45.1	5.1	0.023	29267	5796	20m.pg153_o2_nofp.cx9a1_bee
23958	0	0	0.0	68.9	19.5	0.000	0.000	0.003	0.832	11459	23.6	0.478	79	5.1	45.1	5.1	0.021	29017	5943	20m.pg154_o2_nofp.cx9a1_bee
23880	0	0	0.0	68.6	19.4	0.000	0.000	0.003	0.833	11498	23.6	0.481	79	5.1	45.1	5.0	0.043	29219	5893	20m.pg16beta1_o2_nofp.cx9a1_bee
24007	0	0	0.0	68.2	19.3	0.000	0.000	0.003	0.825	11545	23.6	0.481	79	5.1	45.1	4.9	0.020	29127	9889	20m.pg16beta2_o2_nofp.cx9a1_bee
24166	0	0	0.0	68.5	19.5	0.000	0.000	0.003	0.824	11611	23.7	0.480	78	5.1	45.1	5.2	0.038	29379	9939	20m.pg16beta3_o2_nofp.cx9a1_bee
q100.1
q100.1: range queries with 100 insert/s per client
Performance metrics for all DBMS, not just the ones listed above. Some are normalized by throughput, others are not. Legend for results is here.
ips	qps	rps	rmbps	wps	wmbps	rpq	rkbpq	wpi	wkbpi	csps	cpups	cspq	cpupq	dbgb1	dbgb2	rss	maxop	p50	p99	tag
100	7973	0	0.0	41.3	2.1	0.000	0.000	0.415	21.380	30710	12.8	3.852	128	5.1	45.1	3.3	0.004	7592	7431	20m.pg153_o2_nofp.cx9a1_bee
100	8134	0	0.0	39.8	2.0	0.000	0.000	0.399	20.923	31318	12.7	3.850	125	5.1	45.1	3.3	0.004	7616	7445	20m.pg154_o2_nofp.cx9a1_bee
100	8087	0	0.0	40.0	2.1	0.000	0.000	0.401	21.167	31130	12.6	3.849	125	5.1	45.1	3.3	0.004	7655	7480	20m.pg16beta1_o2_nofp.cx9a1_bee
100	8540	0	0.0	40.6	2.3	0.000	0.000	0.408	23.920	32910	12.6	3.854	118	5.1	44.9	2.9	0.004	8276	7462	20m.pg16beta2_o2_nofp.cx9a1_bee
100	8219	0	0.0	40.7	2.3	0.000	0.000	0.408	23.931	31626	12.6	3.848	123	5.1	44.9	3.2	0.004	7702	7510	20m.pg16beta3_o2_nofp.cx9a1_bee
q500.1
q500.1: range queries with 500 insert/s per client
Performance metrics for all DBMS, not just the ones listed above. Some are normalized by throughput, others are not. Legend for results is here.
ips	qps	rps	rmbps	wps	wmbps	rpq	rkbpq	wpi	wkbpi	csps	cpups	cspq	cpupq	dbgb1	dbgb2	rss	maxop	p50	p99	tag
499	7830	0	0.0	42.4	2.4	0.000	0.000	0.085	4.977	30263	13.1	3.865	134	5.1	42.8	2.0	0.012	7526	7383	20m.pg153_o2_nofp.cx9a1_bee
499	7936	0	0.0	41.2	2.4	0.000	0.000	0.083	4.878	30661	13.2	3.864	133	5.1	42.7	2.0	0.003	7544	7383	20m.pg154_o2_nofp.cx9a1_bee
499	8154	0	0.0	41.1	2.4	0.000	0.000	0.082	4.912	31512	13.0	3.865	128	5.1	42.7	1.9	0.003	7571	7336	20m.pg16beta1_o2_nofp.cx9a1_bee
499	8147	0	0.0	26.3	2.5	0.000	0.000	0.053	5.156	31488	13.0	3.865	128	5.1	42.4	0.2	0.005	7576	7368	20m.pg16beta2_o2_nofp.cx9a1_bee
499	8383	0	0.0	38.7	2.4	0.000	0.000	0.077	4.877	32394	12.8	3.864	122	5.1	42.5	5.2	0.003	7766	7544	20m.pg16beta3_o2_nofp.cx9a1_bee
q1000.1
q1000.1: range queries with 1000 insert/s per client
Performance metrics for all DBMS, not just the ones listed above. Some are normalized by throughput, others are not. Legend for results is here.
ips	qps	rps	rmbps	wps	wmbps	rpq	rkbpq	wpi	wkbpi	csps	cpups	cspq	cpupq	dbgb1	dbgb2	rss	maxop	p50	p99	tag
998	8179	0	0.0	26.5	2.8	0.000	0.000	0.027	2.919	31804	13.7	3.889	134	5.1	39.3	5.1	0.003	7605	7368	20m.pg153_o2_nofp.cx9a1_bee
998	8052	0	0.0	24.8	2.9	0.000	0.000	0.025	3.025	31329	14.0	3.891	139	5.1	39.3	1.5	0.020	7525	7308	20m.pg154_o2_nofp.cx9a1_bee
997	7890	0	0.0	24.4	3.0	0.000	0.000	0.024	3.041	30734	13.9	3.895	141	5.1	39.4	3.6	0.004	7550	7401	20m.pg16beta1_o2_nofp.cx9a1_bee
998	8176	0	0.0	23.6	2.9	0.000	0.000	0.024	2.985	31820	13.9	3.892	136	5.1	38.9	4.9	0.005	7591	7368	20m.pg16beta2_o2_nofp.cx9a1_bee
998	8284	0	0.0	24.3	2.9	0.000	0.000	0.024	2.939	32205	13.7	3.888	132	5.1	39.1	2.5	0.004	7706	7496	20m.pg16beta3_o2_nofp.cx9a1_bee
l.i0
- l.i0: load without secondary indexes
- Legend for results is here.
- Each entry lists the percentage of responses that fit in that bucket (slower than max time for previous bucket, faster than min time for next bucket).
Insert response time histogram
256us	1ms	4ms	16ms	64ms	256ms	1s	4s	16s	gt	max	tag
0.000	0.000	100.000	0.000	0.000	0.000	0.000	0.000	0.000	0.000	0.003	pg153_o2_nofp.cx9a1_bee
0.000	0.000	100.000	0.000	0.000	0.000	0.000	0.000	0.000	0.000	0.004	pg154_o2_nofp.cx9a1_bee
0.000	0.000	100.000	0.000	0.000	0.000	0.000	0.000	0.000	0.000	0.003	pg16beta1_o2_nofp.cx9a1_bee
0.000	0.000	100.000	0.000	0.000	0.000	0.000	0.000	0.000	0.000	0.003	pg16beta2_o2_nofp.cx9a1_bee
0.000	0.000	99.999	0.001	0.000	0.000	0.000	0.000	0.000	0.000	0.005	pg16beta3_o2_nofp.cx9a1_bee
l.x
- l.x: create secondary indexes
- Legend for results is here.
- Each entry lists the percentage of responses that fit in that bucket (slower than max time for previous bucket, faster than min time for next bucket).
TODO - determine whether there is data for create index response time
l.i1
- l.i1: continue load after secondary indexes created
- Legend for results is here.
- Each entry lists the percentage of responses that fit in that bucket (slower than max time for previous bucket, faster than min time for next bucket).
Insert response time histogram
256us	1ms	4ms	16ms	64ms	256ms	1s	4s	16s	gt	max	tag
0.000	0.000	99.990	0.010	nonzero	0.000	0.000	0.000	0.000	0.000	0.023	pg153_o2_nofp.cx9a1_bee
0.000	0.000	99.989	0.011	nonzero	0.000	0.000	0.000	0.000	0.000	0.021	pg154_o2_nofp.cx9a1_bee
0.000	0.000	99.990	0.010	nonzero	0.000	0.000	0.000	0.000	0.000	0.043	pg16beta1_o2_nofp.cx9a1_bee
0.000	0.000	99.986	0.014	nonzero	0.000	0.000	0.000	0.000	0.000	0.020	pg16beta2_o2_nofp.cx9a1_bee
0.000	0.000	99.990	0.010	nonzero	0.000	0.000	0.000	0.000	0.000	0.038	pg16beta3_o2_nofp.cx9a1_bee
Delete response time histogram
256us	1ms	4ms	16ms	64ms	256ms	1s	4s	16s	gt	max	tag
0.103	84.197	7.350	8.351	nonzero	0.000	0.000	0.000	0.000	0.000	0.020	pg153_o2_nofp.cx9a1_bee
0.094	84.107	9.155	6.644	nonzero	0.000	0.000	0.000	0.000	0.000	0.018	pg154_o2_nofp.cx9a1_bee
0.092	83.761	8.652	7.495	nonzero	0.000	0.000	0.000	0.000	0.000	0.042	pg16beta1_o2_nofp.cx9a1_bee
0.090	83.903	8.805	7.202	nonzero	0.000	0.000	0.000	0.000	0.000	0.018	pg16beta2_o2_nofp.cx9a1_bee
0.109	84.186	8.183	7.522	nonzero	0.000	0.000	0.000	0.000	0.000	0.019	pg16beta3_o2_nofp.cx9a1_bee
q100.1
- q100.1: range queries with 100 insert/s per client
- Legend for results is here.
- Each entry lists the percentage of responses that fit in that bucket (slower than max time for previous bucket, faster than min time for next bucket).
Query response time histogram
256us	1ms	4ms	16ms	64ms	256ms	1s	4s	16s	gt	max	tag
99.901	0.098	nonzero	nonzero	0.000	0.000	0.000	0.000	0.000	0.000	0.004	pg153_o2_nofp.cx9a1_bee
99.919	0.081	nonzero	0.000	0.000	0.000	0.000	0.000	0.000	0.000	0.004	pg154_o2_nofp.cx9a1_bee
99.917	0.083	nonzero	nonzero	0.000	0.000	0.000	0.000	0.000	0.000	0.004	pg16beta1_o2_nofp.cx9a1_bee
99.947	0.052	nonzero	0.000	0.000	0.000	0.000	0.000	0.000	0.000	0.004	pg16beta2_o2_nofp.cx9a1_bee
99.920	0.080	nonzero	nonzero	0.000	0.000	0.000	0.000	0.000	0.000	0.004	pg16beta3_o2_nofp.cx9a1_bee
Insert response time histogram
256us	1ms	4ms	16ms	64ms	256ms	1s	4s	16s	gt	max	tag
0.000	0.000	80.528	19.472	0.000	0.000	0.000	0.000	0.000	0.000	0.006	pg153_o2_nofp.cx9a1_bee
0.000	0.000	82.597	17.403	0.000	0.000	0.000	0.000	0.000	0.000	0.006	pg154_o2_nofp.cx9a1_bee
0.000	0.000	82.194	17.806	0.000	0.000	0.000	0.000	0.000	0.000	0.006	pg16beta1_o2_nofp.cx9a1_bee
0.000	0.000	65.306	34.694	0.000	0.000	0.000	0.000	0.000	0.000	0.006	pg16beta2_o2_nofp.cx9a1_bee
0.000	0.000	68.333	31.667	0.000	0.000	0.000	0.000	0.000	0.000	0.007	pg16beta3_o2_nofp.cx9a1_bee
Delete response time histogram
256us	1ms	4ms	16ms	64ms	256ms	1s	4s	16s	gt	max	tag
2.278	58.472	33.792	5.458	0.000	0.000	0.000	0.000	0.000	0.000	0.009	pg153_o2_nofp.cx9a1_bee
0.722	99.236	0.042	0.000	0.000	0.000	0.000	0.000	0.000	0.000	0.004	pg154_o2_nofp.cx9a1_bee
1.250	98.722	0.028	0.000	0.000	0.000	0.000	0.000	0.000	0.000	0.002	pg16beta1_o2_nofp.cx9a1_bee
0.042	44.819	55.125	0.014	0.000	0.000	0.000	0.000	0.000	0.000	0.005	pg16beta2_o2_nofp.cx9a1_bee
0.917	53.708	39.097	6.278	0.000	0.000	0.000	0.000	0.000	0.000	0.009	pg16beta3_o2_nofp.cx9a1_bee
q500.1
- q500.1: range queries with 500 insert/s per client
- Legend for results is here.
- Each entry lists the percentage of responses that fit in that bucket (slower than max time for previous bucket, faster than min time for next bucket).
Query response time histogram
256us	1ms	4ms	16ms	64ms	256ms	1s	4s	16s	gt	max	tag
99.929	0.071	nonzero	nonzero	0.000	0.000	0.000	0.000	0.000	0.000	0.012	pg153_o2_nofp.cx9a1_bee
99.928	0.072	nonzero	0.000	0.000	0.000	0.000	0.000	0.000	0.000	0.003	pg154_o2_nofp.cx9a1_bee
99.931	0.069	nonzero	0.000	0.000	0.000	0.000	0.000	0.000	0.000	0.003	pg16beta1_o2_nofp.cx9a1_bee
99.933	0.067	nonzero	nonzero	0.000	0.000	0.000	0.000	0.000	0.000	0.005	pg16beta2_o2_nofp.cx9a1_bee
99.938	0.062	nonzero	0.000	0.000	0.000	0.000	0.000	0.000	0.000	0.003	pg16beta3_o2_nofp.cx9a1_bee
Insert response time histogram
256us	1ms	4ms	16ms	64ms	256ms	1s	4s	16s	gt	max	tag
0.000	0.000	91.106	8.894	0.000	0.000	0.000	0.000	0.000	0.000	0.008	pg153_o2_nofp.cx9a1_bee
0.000	0.000	91.353	8.647	0.000	0.000	0.000	0.000	0.000	0.000	0.011	pg154_o2_nofp.cx9a1_bee
0.000	0.000	91.081	8.919	0.000	0.000	0.000	0.000	0.000	0.000	0.008	pg16beta1_o2_nofp.cx9a1_bee
0.000	0.000	93.072	6.928	0.000	0.000	0.000	0.000	0.000	0.000	0.012	pg16beta2_o2_nofp.cx9a1_bee
0.000	0.000	93.331	6.669	0.000	0.000	0.000	0.000	0.000	0.000	0.008	pg16beta3_o2_nofp.cx9a1_bee
Delete response time histogram
256us	1ms	4ms	16ms	64ms	256ms	1s	4s	16s	gt	max	tag
4.133	83.497	8.439	3.919	0.011	0.000	0.000	0.000	0.000	0.000	0.018	pg153_o2_nofp.cx9a1_bee
3.528	76.100	0.139	20.233	0.000	0.000	0.000	0.000	0.000	0.000	0.015	pg154_o2_nofp.cx9a1_bee
2.514	75.017	0.100	22.369	0.000	0.000	0.000	0.000	0.000	0.000	0.014	pg16beta1_o2_nofp.cx9a1_bee
2.639	74.378	0.081	22.903	0.000	0.000	0.000	0.000	0.000	0.000	0.012	pg16beta2_o2_nofp.cx9a1_bee
3.722	88.036	6.603	1.633	0.006	0.000	0.000	0.000	0.000	0.000	0.018	pg16beta3_o2_nofp.cx9a1_bee
q1000.1
- q1000.1: range queries with 1000 insert/s per client
- Legend for results is here.
- Each entry lists the percentage of responses that fit in that bucket (slower than max time for previous bucket, faster than min time for next bucket).
Query response time histogram
256us	1ms	4ms	16ms	64ms	256ms	1s	4s	16s	gt	max	tag
99.937	0.062	nonzero	0.000	0.000	0.000	0.000	0.000	0.000	0.000	0.003	pg153_o2_nofp.cx9a1_bee
99.933	0.066	nonzero	nonzero	nonzero	0.000	0.000	0.000	0.000	0.000	0.020	pg154_o2_nofp.cx9a1_bee
99.926	0.074	nonzero	0.000	0.000	0.000	0.000	0.000	0.000	0.000	0.004	pg16beta1_o2_nofp.cx9a1_bee
99.938	0.062	nonzero	nonzero	0.000	0.000	0.000	0.000	0.000	0.000	0.005	pg16beta2_o2_nofp.cx9a1_bee
99.945	0.055	nonzero	nonzero	0.000	0.000	0.000	0.000	0.000	0.000	0.004	pg16beta3_o2_nofp.cx9a1_bee
Insert response time histogram
256us	1ms	4ms	16ms	64ms	256ms	1s	4s	16s	gt	max	tag
0.000	0.000	96.622	3.378	0.000	0.000	0.000	0.000	0.000	0.000	0.007	pg153_o2_nofp.cx9a1_bee
0.000	0.000	96.128	3.867	0.006	0.000	0.000	0.000	0.000	0.000	0.024	pg154_o2_nofp.cx9a1_bee
0.000	0.000	95.837	4.163	0.000	0.000	0.000	0.000	0.000	0.000	0.009	pg16beta1_o2_nofp.cx9a1_bee
0.000	0.000	96.692	3.308	0.000	0.000	0.000	0.000	0.000	0.000	0.006	pg16beta2_o2_nofp.cx9a1_bee
0.000	0.000	96.414	3.586	0.000	0.000	0.000	0.000	0.000	0.000	0.006	pg16beta3_o2_nofp.cx9a1_bee
Delete response time histogram
256us	1ms	4ms	16ms	64ms	256ms	1s	4s	16s	gt	max	tag
2.175	79.757	18.057	0.011	0.000	0.000	0.000	0.000	0.000	0.000	0.005	pg153_o2_nofp.cx9a1_bee
2.306	76.794	0.144	20.750	0.006	0.000	0.000	0.000	0.000	0.000	0.021	pg154_o2_nofp.cx9a1_bee
1.565	75.749	2.113	20.574	0.000	0.000	0.000	0.000	0.000	0.000	0.010	pg16beta1_o2_nofp.cx9a1_bee
1.942	80.885	0.124	17.050	0.000	0.000	0.000	0.000	0.000	0.000	0.013	pg16beta2_o2_nofp.cx9a1_bee
2.060	80.892	7.604	9.444	0.000	0.000	0.000	0.000	0.000	0.000	0.014	pg16beta3_o2_nofp.cx9a1_bee