Introduction
This is a report for the insert benchmark with 12000M docs and 24 client(s). It is generated by scripts (bash, awk, sed) and Tufte might not be impressed. An overview of the insert benchmark is here and a short update is here. Below, by DBMS, I mean DBMS+version.config. An example is my8020.c10b40 where my means MySQL, 8020 is version 8.0.20 and c10b40 is the name for the configuration file.
The test server has 80 cores, hyperthreads enabled, 256G RAM and fast NVMe with XFS. The benchmark was run with 24 clients and there were 1 or 3 connections per client (1 for queries or inserts without rate limits, 1+1 for rate limited inserts+deletes). There are 24 tables, with a client per table. It loads 500M rows per-table without secondary indexes, creates secondary indexes, then inserts 50M rows per-table with a delete per insert to avoid growing the table. It then does 3 read+write tests for 3600s each that do queries as fast as possible with 100, 500 and then 1000 inserts/second/client concurrent with the queries and 1000 deletes/second to avoid growing the table. The database is larger than memory.
The tested DBMS are:
- fbmy5635_202203072101.cy9c_u - FB MySQL 5.6.35 compiled at git hash e7d976ee (7 Mar 2022 tag) with RocksDB 6.28.2, cy9c_u (base) config
- fbmy5635_202205192101.cy9c_u - FB MySQL 5.6.35 compiled at git hash d503bd77 (19 May 2022 tag) with RocksDB 7.2.2, cy9c_u (base) config
- fbmy5635_202208092101.cy9c_u - FB MySQL 5.6.35 compiled at git hash 877a0e58 (9 Aug 2022 tag) with RocksDB 7.3.1, cy9c_u (base) config
- fbmy5635_202210112144.cy9c_u - FB MySQL 5.6.35 compiled at git hash c691c716 (11 Oct 2022 tag) with RocksDB 7.3.1, cy9c_u (base) config
- fbmy5635_202302162102.cy9c_u - FB MySQL 5.6.35 compiled at git hash 21a2b0aa (16 Feb 2023 tag) with RocksDB 7.10.0, cy9c_u (base) config
- fbmy5635_202304122154.cy9c_u - FB MySQL 5.6.35 compiled at git hash 205c31dd (12 Apr 2023 tag) with RocksDB 7.10.2, cy9c_u (base) config
- fbmy5635_202305292102.cy9c_u - FB MySQL 5.6.35 compiled at git hash b739eac1 (29 May 2023 tag) with RocksDB 8.2.1, cy9c_u (base) config
- fbmy5635_20230529_832.cy9c_u - FB MySQL 5.6.35 compiled at git hash b739eac1 (29 May 2023 tag) with RocksDB 8.3.2, cy9c_u (base) config
- fbmy5635_20230529_843.cy9c_u - FB MySQL 5.6.35 compiled at git hash b739eac1 (29 May 2023 tag) with RocksDB 8.4.3, cy9c_u (base) config
- fbmy5635_20230529_850.cy9c_u - FB MySQL 5.6.35 compiled at git hash b739eac1 (29 May 2023 tag) with RocksDB 8.5.0, cy9c_u (base) config
Contents
- Summary
- l.i0: load without secondary indexes
- l.x: create secondary indexes
- l.i1: continue load after secondary indexes created
- q100.1: range queries with 100 insert/s per client
- q500.1: range queries with 500 insert/s per client
- q1000.1: range queries with 1000 insert/s per client
Summary
The numbers are inserts/s for l.i0 and l.i1, indexed docs (or rows) /s for l.x and queries/s for q100, q500, q1000. The values are the average rate over the entire test for inserts (IPS) and queries (QPS). The range of values for IPS and QPS is split into 3 parts: bottom 25%, middle 50%, top 25%. Values in the bottom 25% have a red background, values in the top 25% have a green background and values in the middle have no color. A gray background is used for values that can be ignored because the DBMS did not sustain the target insert rate. Red backgrounds are not used when the minimum value is within 80% of the max value.
| dbms | l.i0 | l.x | l.i1 | q100.1 | q500.1 | q1000.1 |
|---|---|---|---|---|---|---|
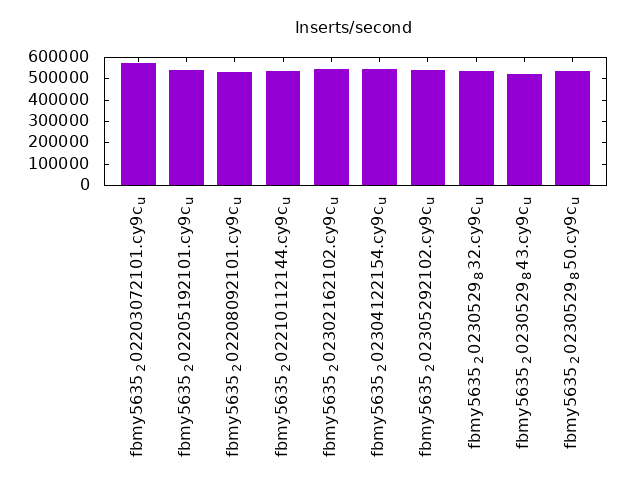
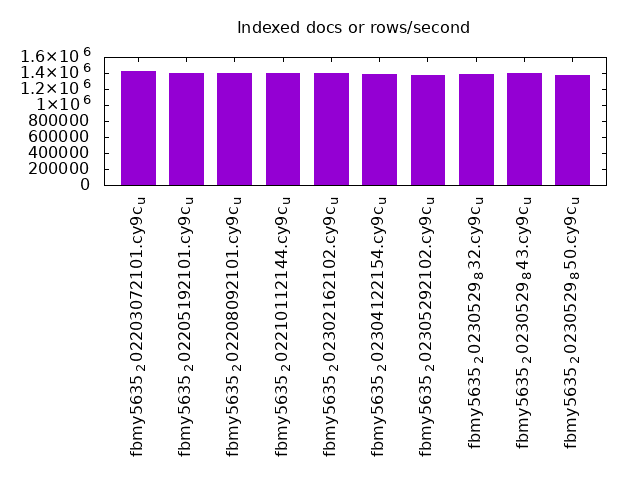
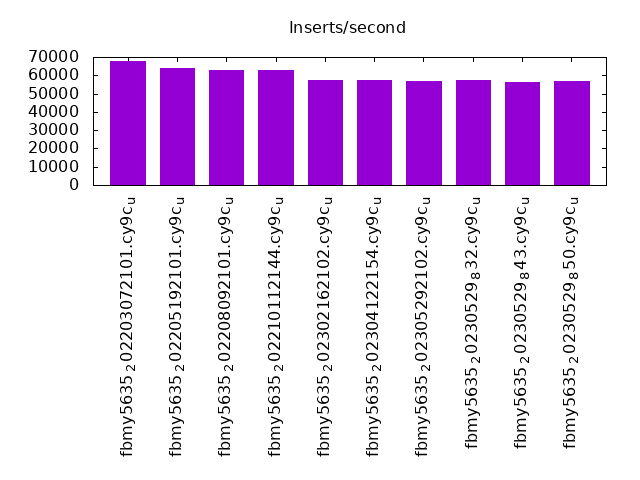
| fbmy5635_202203072101.cy9c_u | 569828 | 1422150 | 68070 | 86457 | 80965 | 72082 |
| fbmy5635_202205192101.cy9c_u | 538648 | 1399918 | 64109 | 82368 | 77176 | 68488 |
| fbmy5635_202208092101.cy9c_u | 531608 | 1402372 | 62995 | 81628 | 76219 | 68239 |
| fbmy5635_202210112144.cy9c_u | 535260 | 1399755 | 63022 | 82039 | 76585 | 68444 |
| fbmy5635_202302162102.cy9c_u | 543897 | 1396985 | 57301 | 78541 | 73232 | 64503 |
| fbmy5635_202304122154.cy9c_u | 541418 | 1384254 | 57463 | 81085 | 75253 | 63556 |
| fbmy5635_202305292102.cy9c_u | 538116 | 1380591 | 56775 | 77529 | 72450 | 64168 |
| fbmy5635_20230529_832.cy9c_u | 534736 | 1388258 | 57214 | 73815 | 69228 | 61450 |
| fbmy5635_20230529_843.cy9c_u | 521218 | 1393902 | 56325 | 71605 | 67261 | 58499 |
| fbmy5635_20230529_850.cy9c_u | 534712 | 1380115 | 56840 | 72391 | 67695 | 58978 |
This table has relative throughput, throughput for the DBMS relative to the DBMS in the first line, using the absolute throughput from the previous table. Values less than 0.95 have a yellow background. Values greater than 1.05 have a blue background.
| dbms | l.i0 | l.x | l.i1 | q100.1 | q500.1 | q1000.1 |
|---|---|---|---|---|---|---|
| fbmy5635_202203072101.cy9c_u | 1.00 | 1.00 | 1.00 | 1.00 | 1.00 | 1.00 |
| fbmy5635_202205192101.cy9c_u | 0.95 | 0.98 | 0.94 | 0.95 | 0.95 | 0.95 |
| fbmy5635_202208092101.cy9c_u | 0.93 | 0.99 | 0.93 | 0.94 | 0.94 | 0.95 |
| fbmy5635_202210112144.cy9c_u | 0.94 | 0.98 | 0.93 | 0.95 | 0.95 | 0.95 |
| fbmy5635_202302162102.cy9c_u | 0.95 | 0.98 | 0.84 | 0.91 | 0.90 | 0.89 |
| fbmy5635_202304122154.cy9c_u | 0.95 | 0.97 | 0.84 | 0.94 | 0.93 | 0.88 |
| fbmy5635_202305292102.cy9c_u | 0.94 | 0.97 | 0.83 | 0.90 | 0.89 | 0.89 |
| fbmy5635_20230529_832.cy9c_u | 0.94 | 0.98 | 0.84 | 0.85 | 0.86 | 0.85 |
| fbmy5635_20230529_843.cy9c_u | 0.91 | 0.98 | 0.83 | 0.83 | 0.83 | 0.81 |
| fbmy5635_20230529_850.cy9c_u | 0.94 | 0.97 | 0.84 | 0.84 | 0.84 | 0.82 |
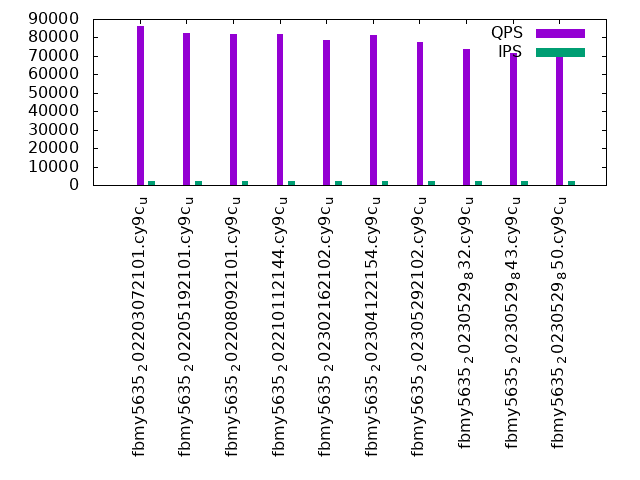
This lists the average rate of inserts/s for the tests that do inserts concurrent with queries. For such tests the query rate is listed in the table above. The read+write tests are setup so that the insert rate should match the target rate every second. Cells that are not at least 95% of the target have a red background to indicate a failure to satisfy the target.
| dbms | q100.1 | q500.1 | q1000.1 |
|---|---|---|---|
| fbmy5635_202203072101.cy9c_u | 2381 | 11904 | 23828 |
| fbmy5635_202205192101.cy9c_u | 2381 | 11904 | 23834 |
| fbmy5635_202208092101.cy9c_u | 2381 | 11907 | 23828 |
| fbmy5635_202210112144.cy9c_u | 2381 | 11904 | 23821 |
| fbmy5635_202302162102.cy9c_u | 2381 | 11901 | 23788 |
| fbmy5635_202304122154.cy9c_u | 2380 | 11894 | 23775 |
| fbmy5635_202305292102.cy9c_u | 2381 | 11904 | 23788 |
| fbmy5635_20230529_832.cy9c_u | 2381 | 11907 | 23828 |
| fbmy5635_20230529_843.cy9c_u | 2381 | 11907 | 23828 |
| fbmy5635_20230529_850.cy9c_u | 2381 | 11907 | 23828 |
| target | 2400 | 12000 | 24000 |
l.i0
l.i0: load without secondary indexes. Graphs for performance per 1-second interval are here.
Average throughput:
Insert response time histogram: each cell has the percentage of responses that take <= the time in the header and max is the max response time in seconds. For the max column values in the top 25% of the range have a red background and in the bottom 25% of the range have a green background. The red background is not used when the min value is within 80% of the max value.
| dbms | 256us | 1ms | 4ms | 16ms | 64ms | 256ms | 1s | 4s | 16s | gt | max |
|---|---|---|---|---|---|---|---|---|---|---|---|
| fbmy5635_202203072101.cy9c_u | 0.027 | 53.251 | 46.677 | 0.004 | 0.039 | nonzero | 0.447 | ||||
| fbmy5635_202205192101.cy9c_u | 0.011 | 41.007 | 58.940 | 0.004 | 0.039 | 0.249 | |||||
| fbmy5635_202208092101.cy9c_u | 0.013 | 38.243 | 61.701 | 0.004 | 0.039 | nonzero | 0.314 | ||||
| fbmy5635_202210112144.cy9c_u | 0.012 | 39.643 | 60.302 | 0.004 | 0.039 | nonzero | 0.359 | ||||
| fbmy5635_202302162102.cy9c_u | 0.007 | 43.090 | 56.861 | 0.003 | 0.039 | 0.137 | |||||
| fbmy5635_202304122154.cy9c_u | 0.008 | 43.040 | 56.911 | 0.003 | 0.039 | 0.241 | |||||
| fbmy5635_202305292102.cy9c_u | 0.007 | 42.306 | 57.645 | 0.003 | 0.039 | 0.172 | |||||
| fbmy5635_20230529_832.cy9c_u | 0.006 | 40.790 | 59.162 | 0.003 | 0.039 | 0.253 | |||||
| fbmy5635_20230529_843.cy9c_u | 0.005 | 36.317 | 63.636 | 0.003 | 0.039 | 0.247 | |||||
| fbmy5635_20230529_850.cy9c_u | 0.005 | 40.053 | 59.898 | 0.006 | 0.038 | 0.237 |
Performance metrics for the DBMS listed above. Some are normalized by throughput, others are not. Legend for results is here.
ips	qps	rps	rmbps	wps	wmbps	rpq	rkbpq	wpi	wkbpi	csps	cpups	cspq	cpupq	dbgb1	dbgb2	rss	maxop	p50	p99	tag
569828	0	12	0.2	2936.4	323.8	0.000	0.000	0.005	0.582	677948	41.4	1.190	58	376.4	377.9	164.6	0.447	23876	14486	12000m.fbmy5635_202203072101.cy9c_u
538648	0	10	0.2	2811.8	311.9	0.000	0.000	0.005	0.593	684984	41.9	1.272	62	376.6	376.7	167.4	0.249	22577	13586	12000m.fbmy5635_202205192101.cy9c_u
531608	0	11	0.2	2775.4	308.1	0.000	0.000	0.005	0.593	670472	42.3	1.261	64	376.6	376.7	167.5	0.314	22178	13888	12000m.fbmy5635_202208092101.cy9c_u
535260	0	15	0.3	2783.3	309.8	0.000	0.001	0.005	0.593	675193	42.2	1.261	63	376.4	376.4	165.9	0.359	22378	13987	12000m.fbmy5635_202210112144.cy9c_u
543897	0	28	0.4	1717.7	188.3	0.000	0.001	0.003	0.354	666759	40.1	1.226	59	376.1	377.8	88.7	0.137	23277	14386	12000m.fbmy5635_202302162102.cy9c_u
541418	0	37	0.4	1727.2	187.6	0.000	0.001	0.003	0.355	668247	40.1	1.234	59	376.3	378.0	90.0	0.241	23077	14086	12000m.fbmy5635_202304122154.cy9c_u
538116	0	36	0.5	1710.2	186.7	0.000	0.001	0.003	0.355	660124	40.2	1.227	60	375.1	375.2	89.4	0.172	23077	13986	12000m.fbmy5635_202305292102.cy9c_u
534736	0	25	0.3	1712.6	183.1	0.000	0.001	0.003	0.351	659688	40.3	1.234	60	375.8	375.9	90.1	0.253	22977	13786	12000m.fbmy5635_20230529_832.cy9c_u
521218	0	26	0.2	1685.1	180.5	0.000	0.000	0.003	0.355	650527	40.2	1.248	62	376.3	376.4	91.7	0.247	22275	13586	12000m.fbmy5635_20230529_843.cy9c_u
534712	0	158	1.0	1700.1	183.1	0.000	0.002	0.003	0.351	635112	40.4	1.188	60	376.1	376.1	89.3	0.237	22977	13986	12000m.fbmy5635_20230529_850.cy9c_u
l.x
l.x: create secondary indexes.
Average throughput:
Performance metrics for the DBMS listed above. Some are normalized by throughput, others are not. Legend for results is here.
ips	qps	rps	rmbps	wps	wmbps	rpq	rkbpq	wpi	wkbpi	csps	cpups	cspq	cpupq	dbgb1	dbgb2	rss	maxop	p50	p99	tag
1422150	0	7164	208.2	1732.8	178.5	0.005	0.150	0.001	0.129	38155	29.6	0.027	17	772.0	773.5	206.2	0.002	NA	NA	12000m.fbmy5635_202203072101.cy9c_u
1399918	0	8143	204.3	1709.7	165.4	0.006	0.149	0.001	0.121	47729	30.9	0.034	18	771.9	772.0	206.1	0.003	NA	NA	12000m.fbmy5635_202205192101.cy9c_u
1402372	0	8757	206.6	1713.8	167.8	0.006	0.151	0.001	0.123	47950	30.9	0.034	18	772.0	772.1	206.2	0.003	NA	NA	12000m.fbmy5635_202208092101.cy9c_u
1399755	0	9272	203.5	1709.1	171.6	0.007	0.149	0.001	0.126	47613	30.9	0.034	18	772.0	772.0	206.1	0.003	NA	NA	12000m.fbmy5635_202210112144.cy9c_u
1396985	0	5315	210.9	1704.5	167.9	0.004	0.155	0.001	0.123	47989	31.1	0.034	18	771.7	773.4	206.7	0.002	NA	NA	12000m.fbmy5635_202302162102.cy9c_u
1384254	0	5779	207.6	1692.0	164.4	0.004	0.154	0.001	0.122	47963	31.0	0.035	18	771.8	773.6	206.6	0.003	NA	NA	12000m.fbmy5635_202304122154.cy9c_u
1380591	0	5193	205.8	1687.9	163.3	0.004	0.153	0.001	0.121	49939	30.8	0.036	18	770.7	770.7	206.6	0.006	NA	NA	12000m.fbmy5635_202305292102.cy9c_u
1388258	0	7104	201.4	1693.1	166.6	0.005	0.149	0.001	0.123	45251	30.7	0.033	18	771.4	771.4	206.6	0.003	NA	NA	12000m.fbmy5635_20230529_832.cy9c_u
1393902	0	8578	205.9	1699.7	167.6	0.006	0.151	0.001	0.123	44943	30.8	0.032	18	771.9	772.0	206.4	0.003	NA	NA	12000m.fbmy5635_20230529_843.cy9c_u
1380115	0	7392	203.3	1683.9	166.8	0.005	0.151	0.001	0.124	46052	30.8	0.033	18	771.7	771.7	206.7	0.005	NA	NA	12000m.fbmy5635_20230529_850.cy9c_u
l.i1
l.i1: continue load after secondary indexes created. Graphs for performance per 1-second interval are here.
Average throughput:
Insert response time histogram: each cell has the percentage of responses that take <= the time in the header and max is the max response time in seconds. For the max column values in the top 25% of the range have a red background and in the bottom 25% of the range have a green background. The red background is not used when the min value is within 80% of the max value.
| dbms | 256us | 1ms | 4ms | 16ms | 64ms | 256ms | 1s | 4s | 16s | gt | max |
|---|---|---|---|---|---|---|---|---|---|---|---|
| fbmy5635_202203072101.cy9c_u | nonzero | 0.047 | 28.330 | 71.616 | 0.006 | 0.142 | |||||
| fbmy5635_202205192101.cy9c_u | 0.039 | 21.479 | 78.465 | 0.016 | 0.001 | nonzero | nonzero | nonzero | 17.501 | ||
| fbmy5635_202208092101.cy9c_u | 0.034 | 19.894 | 80.051 | 0.019 | 0.001 | nonzero | nonzero | nonzero | 17.404 | ||
| fbmy5635_202210112144.cy9c_u | 0.046 | 20.047 | 79.869 | 0.035 | 0.003 | nonzero | nonzero | nonzero | 17.537 | ||
| fbmy5635_202302162102.cy9c_u | 0.028 | 11.689 | 88.241 | 0.024 | 0.013 | 0.005 | 1.156 | ||||
| fbmy5635_202304122154.cy9c_u | 0.032 | 11.522 | 88.437 | 0.010 | 0.169 | ||||||
| fbmy5635_202305292102.cy9c_u | 0.035 | 12.206 | 87.599 | 0.107 | 0.051 | 0.001 | 1.300 | ||||
| fbmy5635_20230529_832.cy9c_u | 0.028 | 13.710 | 85.909 | 0.283 | 0.070 | nonzero | 1.015 | ||||
| fbmy5635_20230529_843.cy9c_u | 0.044 | 13.335 | 86.246 | 0.281 | 0.085 | 0.008 | 2.177 | ||||
| fbmy5635_20230529_850.cy9c_u | 0.034 | 13.276 | 86.404 | 0.211 | 0.073 | 0.002 | 1.788 |
Delete response time histogram: each cell has the percentage of responses that take <= the time in the header and max is the max response time in seconds. For the max column values in the top 25% of the range have a red background and in the bottom 25% of the range have a green background. The red background is not used when the min value is within 80% of the max value.
| dbms | 256us | 1ms | 4ms | 16ms | 64ms | 256ms | 1s | 4s | 16s | gt | max |
|---|---|---|---|---|---|---|---|---|---|---|---|
| fbmy5635_202203072101.cy9c_u | 0.002 | 0.048 | 30.924 | 69.020 | 0.007 | 0.227 | |||||
| fbmy5635_202205192101.cy9c_u | nonzero | 0.040 | 22.861 | 77.081 | 0.016 | 0.001 | nonzero | nonzero | nonzero | 17.615 | |
| fbmy5635_202208092101.cy9c_u | 0.001 | 0.035 | 21.304 | 78.640 | 0.019 | 0.001 | nonzero | nonzero | nonzero | 17.404 | |
| fbmy5635_202210112144.cy9c_u | nonzero | 0.046 | 21.260 | 78.655 | 0.036 | 0.003 | nonzero | nonzero | nonzero | 17.537 | |
| fbmy5635_202302162102.cy9c_u | 0.029 | 11.517 | 88.411 | 0.026 | 0.013 | 0.005 | 1.156 | ||||
| fbmy5635_202304122154.cy9c_u | nonzero | 0.033 | 11.379 | 88.577 | 0.011 | nonzero | 0.286 | ||||
| fbmy5635_202305292102.cy9c_u | nonzero | 0.035 | 11.700 | 88.101 | 0.111 | 0.051 | 0.001 | 1.300 | |||
| fbmy5635_20230529_832.cy9c_u | 0.029 | 14.012 | 85.603 | 0.286 | 0.070 | nonzero | 1.014 | ||||
| fbmy5635_20230529_843.cy9c_u | nonzero | 0.045 | 13.294 | 86.284 | 0.284 | 0.086 | 0.008 | 2.177 | |||
| fbmy5635_20230529_850.cy9c_u | nonzero | 0.034 | 12.852 | 86.826 | 0.213 | 0.073 | 0.002 | 1.788 |
Performance metrics for the DBMS listed above. Some are normalized by throughput, others are not. Legend for results is here.
ips	qps	rps	rmbps	wps	wmbps	rpq	rkbpq	wpi	wkbpi	csps	cpups	cspq	cpupq	dbgb1	dbgb2	rss	maxop	p50	p99	tag
68070	0	1094	22.9	2467.6	282.6	0.016	0.344	0.036	4.251	200046	18.4	2.939	216	834.6	835.2	179.5	0.142	2847	2498	12000m.fbmy5635_202203072101.cy9c_u
64109	0	2009	25.1	2288.1	257.3	0.031	0.401	0.036	4.110	195851	19.4	3.055	242	835.2	836.0	179.5	17.501	2697	2198	12000m.fbmy5635_202205192101.cy9c_u
62995	0	2107	25.0	2235.6	250.2	0.033	0.407	0.035	4.067	185004	19.2	2.937	244	836.5	837.4	179.5	17.404	2647	1798	12000m.fbmy5635_202208092101.cy9c_u
63022	0	2036	24.8	2224.4	249.1	0.032	0.403	0.035	4.047	187315	19.1	2.972	242	833.6	834.4	179.4	17.537	2647	1648	12000m.fbmy5635_202210112144.cy9c_u
57301	0	901	14.4	1552.8	177.1	0.016	0.257	0.027	3.165	168569	17.0	2.942	237	842.5	843.0	180.1	1.156	2398	1948	12000m.fbmy5635_202302162102.cy9c_u
57463	0	1351	16.2	1548.1	173.5	0.024	0.289	0.027	3.093	162735	16.9	2.832	235	848.2	849.0	179.9	0.169	2398	1949	12000m.fbmy5635_202304122154.cy9c_u
56775	0	1364	15.9	1500.3	168.4	0.024	0.287	0.026	3.037	172592	17.2	3.040	242	847.0	847.9	180.0	1.300	2398	150	12000m.fbmy5635_202305292102.cy9c_u
57214	0	1713	17.4	1511.8	169.9	0.030	0.311	0.026	3.040	191388	17.9	3.345	250	849.9	850.7	180.0	1.015	2448	150	12000m.fbmy5635_20230529_832.cy9c_u
56325	0	1739	17.6	1468.8	165.1	0.031	0.320	0.026	3.001	193266	18.2	3.431	259	845.3	846.2	179.9	2.177	2448	100	12000m.fbmy5635_20230529_843.cy9c_u
56840	0	8284	47.4	1491.6	167.7	0.146	0.855	0.026	3.021	194294	18.1	3.418	255	849.7	850.5	180.0	1.788	2448	150	12000m.fbmy5635_20230529_850.cy9c_u
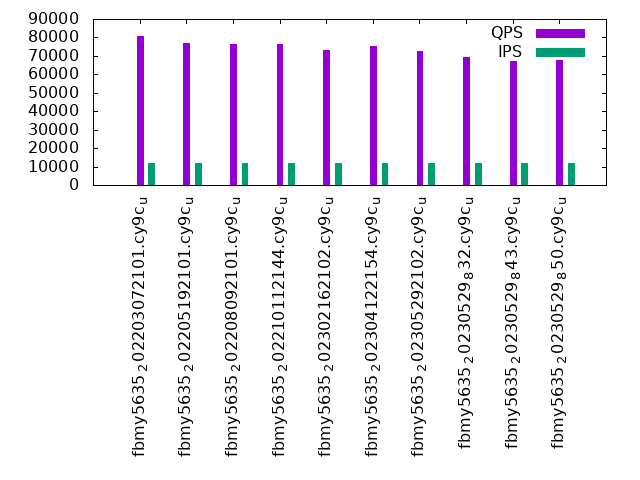
q100.1
q100.1: range queries with 100 insert/s per client. Graphs for performance per 1-second interval are here.
Average throughput:
Query response time histogram: each cell has the percentage of responses that take <= the time in the header and max is the max response time in seconds. For max values in the top 25% of the range have a red background and in the bottom 25% of the range have a green background. The red background is not used when the min value is within 80% of the max value.
| dbms | 256us | 1ms | 4ms | 16ms | 64ms | 256ms | 1s | 4s | 16s | gt | max |
|---|---|---|---|---|---|---|---|---|---|---|---|
| fbmy5635_202203072101.cy9c_u | 56.980 | 42.951 | 0.066 | 0.003 | nonzero | nonzero | 0.076 | ||||
| fbmy5635_202205192101.cy9c_u | 49.769 | 50.142 | 0.086 | 0.003 | nonzero | nonzero | 0.075 | ||||
| fbmy5635_202208092101.cy9c_u | 48.044 | 51.868 | 0.086 | 0.003 | nonzero | nonzero | 0.069 | ||||
| fbmy5635_202210112144.cy9c_u | 49.142 | 50.770 | 0.085 | 0.003 | nonzero | nonzero | 0.084 | ||||
| fbmy5635_202302162102.cy9c_u | 49.300 | 50.449 | 0.246 | 0.004 | nonzero | 0.001 | 0.106 | ||||
| fbmy5635_202304122154.cy9c_u | 46.952 | 52.939 | 0.103 | 0.006 | nonzero | 0.001 | 0.120 | ||||
| fbmy5635_202305292102.cy9c_u | 49.446 | 50.243 | 0.307 | 0.004 | nonzero | 0.001 | 0.109 | ||||
| fbmy5635_20230529_832.cy9c_u | 49.159 | 50.343 | 0.494 | 0.004 | nonzero | 0.001 | 0.083 | ||||
| fbmy5635_20230529_843.cy9c_u | 44.814 | 54.600 | 0.580 | 0.005 | nonzero | 0.001 | 0.084 | ||||
| fbmy5635_20230529_850.cy9c_u | 44.140 | 55.361 | 0.494 | 0.004 | nonzero | 0.001 | 0.090 |
Insert response time histogram: each cell has the percentage of responses that take <= the time in the header and max is the max response time in seconds. For max values in the top 25% of the range have a red background and in the bottom 25% of the range have a green background. The red background is not used when the min value is within 80% of the max value.
| dbms | 256us | 1ms | 4ms | 16ms | 64ms | 256ms | 1s | 4s | 16s | gt | max |
|---|---|---|---|---|---|---|---|---|---|---|---|
| fbmy5635_202203072101.cy9c_u | 0.001 | 99.951 | 0.048 | 0.014 | |||||||
| fbmy5635_202205192101.cy9c_u | 99.954 | 0.046 | 0.011 | ||||||||
| fbmy5635_202208092101.cy9c_u | 99.960 | 0.040 | 0.013 | ||||||||
| fbmy5635_202210112144.cy9c_u | 99.952 | 0.048 | 0.012 | ||||||||
| fbmy5635_202302162102.cy9c_u | 0.005 | 99.898 | 0.090 | 0.005 | 0.002 | 0.078 | |||||
| fbmy5635_202304122154.cy9c_u | 0.009 | 99.828 | 0.151 | 0.011 | 0.002 | 0.079 | |||||
| fbmy5635_202305292102.cy9c_u | 0.002 | 99.726 | 0.263 | 0.008 | 0.001 | 0.071 | |||||
| fbmy5635_20230529_832.cy9c_u | 0.001 | 99.939 | 0.052 | 0.006 | 0.003 | 0.084 | |||||
| fbmy5635_20230529_843.cy9c_u | 0.001 | 99.939 | 0.056 | 0.003 | 0.054 | ||||||
| fbmy5635_20230529_850.cy9c_u | 99.933 | 0.062 | 0.002 | 0.002 | 0.093 |
Delete response time histogram: each cell has the percentage of responses that take <= the time in the header and max is the max response time in seconds. For max values in the top 25% of the range have a red background and in the bottom 25% of the range have a green background. The red background is not used when the min value is within 80% of the max value.
| dbms | 256us | 1ms | 4ms | 16ms | 64ms | 256ms | 1s | 4s | 16s | gt | max |
|---|---|---|---|---|---|---|---|---|---|---|---|
| fbmy5635_202203072101.cy9c_u | 0.049 | 99.896 | 0.052 | 0.002 | 0.001 | 0.103 | |||||
| fbmy5635_202205192101.cy9c_u | 0.002 | 99.943 | 0.051 | 0.004 | 0.054 | ||||||
| fbmy5635_202208092101.cy9c_u | 0.001 | 99.951 | 0.045 | 0.002 | 0.001 | 0.104 | |||||
| fbmy5635_202210112144.cy9c_u | 0.005 | 99.944 | 0.049 | 0.002 | 0.049 | ||||||
| fbmy5635_202302162102.cy9c_u | 99.891 | 0.095 | 0.008 | 0.006 | 0.081 | ||||||
| fbmy5635_202304122154.cy9c_u | 99.812 | 0.163 | 0.022 | 0.003 | 0.120 | ||||||
| fbmy5635_202305292102.cy9c_u | 99.722 | 0.263 | 0.012 | 0.003 | 0.078 | ||||||
| fbmy5635_20230529_832.cy9c_u | 99.925 | 0.057 | 0.014 | 0.004 | 0.085 | ||||||
| fbmy5635_20230529_843.cy9c_u | 99.930 | 0.058 | 0.009 | 0.003 | 0.084 | ||||||
| fbmy5635_20230529_850.cy9c_u | 99.906 | 0.074 | 0.015 | 0.005 | 0.095 |
Performance metrics for the DBMS listed above. Some are normalized by throughput, others are not. Legend for results is here.
ips	qps	rps	rmbps	wps	wmbps	rpq	rkbpq	wpi	wkbpi	csps	cpups	cspq	cpupq	dbgb1	dbgb2	rss	maxop	p50	p99	tag
2381	86457	3396	26.7	124.5	13.1	0.039	0.317	0.052	5.633	418660	30.9	4.842	286	833.6	834.0	182.0	0.076	3709	2462	12000m.fbmy5635_202203072101.cy9c_u
2381	82368	3447	27.6	129.5	14.0	0.042	0.343	0.054	6.008	403482	31.8	4.899	309	833.2	833.9	182.0	0.075	3469	2334	12000m.fbmy5635_202205192101.cy9c_u
2381	81628	3492	26.9	128.8	13.6	0.043	0.338	0.054	5.848	397454	31.9	4.869	313	832.8	833.5	181.9	0.069	3437	2301	12000m.fbmy5635_202208092101.cy9c_u
2381	82039	3407	26.9	126.4	13.4	0.042	0.336	0.053	5.784	397317	31.7	4.843	309	832.4	833.1	181.9	0.084	3453	2302	12000m.fbmy5635_202210112144.cy9c_u
2381	78541	3958	33.2	112.0	11.8	0.050	0.433	0.047	5.079	370479	31.7	4.717	323	841.3	841.9	183.4	0.106	3420	2254	12000m.fbmy5635_202302162102.cy9c_u
2380	81085	3193	27.4	103.8	11.0	0.039	0.346	0.044	4.740	383540	31.7	4.730	313	840.3	840.9	183.0	0.120	3309	2062	12000m.fbmy5635_202304122154.cy9c_u
2381	77529	4525	35.6	102.5	10.8	0.058	0.470	0.043	4.626	369800	31.6	4.770	326	841.6	842.2	183.6	0.109	3484	2190	12000m.fbmy5635_202305292102.cy9c_u
2381	73815	6152	47.3	131.6	13.5	0.083	0.656	0.055	5.788	350658	31.8	4.751	345	842.2	842.8	184.5	0.083	3229	1966	12000m.fbmy5635_20230529_832.cy9c_u
2381	71605	6355	49.4	140.6	14.2	0.089	0.707	0.059	6.105	340710	31.8	4.758	355	841.7	842.5	184.7	0.084	3325	1934	12000m.fbmy5635_20230529_843.cy9c_u
2381	72391	6832	50.8	137.0	14.1	0.094	0.719	0.058	6.058	347033	31.9	4.794	353	841.6	842.4	184.5	0.090	3229	1966	12000m.fbmy5635_20230529_850.cy9c_u
q500.1
q500.1: range queries with 500 insert/s per client. Graphs for performance per 1-second interval are here.
Average throughput:
Query response time histogram: each cell has the percentage of responses that take <= the time in the header and max is the max response time in seconds. For max values in the top 25% of the range have a red background and in the bottom 25% of the range have a green background. The red background is not used when the min value is within 80% of the max value.
| dbms | 256us | 1ms | 4ms | 16ms | 64ms | 256ms | 1s | 4s | 16s | gt | max |
|---|---|---|---|---|---|---|---|---|---|---|---|
| fbmy5635_202203072101.cy9c_u | 44.511 | 55.465 | 0.013 | 0.011 | nonzero | 0.001 | 0.081 | ||||
| fbmy5635_202205192101.cy9c_u | 37.520 | 62.453 | 0.015 | 0.011 | nonzero | 0.001 | 0.080 | ||||
| fbmy5635_202208092101.cy9c_u | 35.001 | 64.969 | 0.018 | 0.011 | nonzero | 0.001 | 0.081 | ||||
| fbmy5635_202210112144.cy9c_u | 35.974 | 63.997 | 0.017 | 0.011 | nonzero | 0.001 | 0.082 | ||||
| fbmy5635_202302162102.cy9c_u | 33.397 | 66.561 | 0.026 | 0.016 | nonzero | 0.053 | |||||
| fbmy5635_202304122154.cy9c_u | 32.472 | 67.481 | 0.024 | 0.021 | 0.002 | 0.039 | |||||
| fbmy5635_202305292102.cy9c_u | 33.577 | 66.384 | 0.024 | 0.016 | nonzero | 0.061 | |||||
| fbmy5635_20230529_832.cy9c_u | 33.492 | 66.473 | 0.021 | 0.014 | nonzero | 0.039 | |||||
| fbmy5635_20230529_843.cy9c_u | 28.396 | 71.567 | 0.022 | 0.015 | nonzero | 0.056 | |||||
| fbmy5635_20230529_850.cy9c_u | 27.565 | 72.397 | 0.024 | 0.015 | nonzero | nonzero | 0.071 |
Insert response time histogram: each cell has the percentage of responses that take <= the time in the header and max is the max response time in seconds. For max values in the top 25% of the range have a red background and in the bottom 25% of the range have a green background. The red background is not used when the min value is within 80% of the max value.
| dbms | 256us | 1ms | 4ms | 16ms | 64ms | 256ms | 1s | 4s | 16s | gt | max |
|---|---|---|---|---|---|---|---|---|---|---|---|
| fbmy5635_202203072101.cy9c_u | nonzero | 99.510 | 0.488 | 0.001 | 0.001 | 0.078 | |||||
| fbmy5635_202205192101.cy9c_u | 98.104 | 1.891 | 0.004 | 0.001 | 0.078 | ||||||
| fbmy5635_202208092101.cy9c_u | 99.844 | 0.152 | 0.003 | 0.001 | 0.080 | ||||||
| fbmy5635_202210112144.cy9c_u | 99.881 | 0.116 | 0.002 | 0.001 | 0.081 | ||||||
| fbmy5635_202302162102.cy9c_u | 0.001 | 63.658 | 36.250 | 0.090 | nonzero | 0.080 | |||||
| fbmy5635_202304122154.cy9c_u | 95.600 | 4.333 | 0.067 | nonzero | 0.082 | ||||||
| fbmy5635_202305292102.cy9c_u | 46.374 | 53.459 | 0.167 | 0.033 | |||||||
| fbmy5635_20230529_832.cy9c_u | 61.406 | 38.574 | 0.020 | nonzero | 0.071 | ||||||
| fbmy5635_20230529_843.cy9c_u | 82.706 | 17.293 | 0.002 | 0.027 | |||||||
| fbmy5635_20230529_850.cy9c_u | 28.494 | 68.785 | 2.721 | 0.064 |
Delete response time histogram: each cell has the percentage of responses that take <= the time in the header and max is the max response time in seconds. For max values in the top 25% of the range have a red background and in the bottom 25% of the range have a green background. The red background is not used when the min value is within 80% of the max value.
| dbms | 256us | 1ms | 4ms | 16ms | 64ms | 256ms | 1s | 4s | 16s | gt | max |
|---|---|---|---|---|---|---|---|---|---|---|---|
| fbmy5635_202203072101.cy9c_u | 0.008 | 99.609 | 0.368 | 0.010 | 0.005 | 0.101 | |||||
| fbmy5635_202205192101.cy9c_u | 0.001 | 98.547 | 1.436 | 0.013 | 0.004 | 0.103 | |||||
| fbmy5635_202208092101.cy9c_u | nonzero | 99.840 | 0.145 | 0.012 | 0.003 | 0.100 | |||||
| fbmy5635_202210112144.cy9c_u | 99.870 | 0.116 | 0.010 | 0.004 | 0.115 | ||||||
| fbmy5635_202302162102.cy9c_u | 65.989 | 33.919 | 0.091 | nonzero | 0.080 | ||||||
| fbmy5635_202304122154.cy9c_u | 96.381 | 3.543 | 0.076 | nonzero | 0.082 | ||||||
| fbmy5635_202305292102.cy9c_u | 47.722 | 52.106 | 0.172 | nonzero | 0.083 | ||||||
| fbmy5635_20230529_832.cy9c_u | 64.682 | 35.296 | 0.022 | nonzero | 0.069 | ||||||
| fbmy5635_20230529_843.cy9c_u | 85.312 | 14.679 | 0.008 | nonzero | 0.080 | ||||||
| fbmy5635_20230529_850.cy9c_u | 29.806 | 67.769 | 2.426 | nonzero | 0.079 |
Performance metrics for the DBMS listed above. Some are normalized by throughput, others are not. Legend for results is here.
ips	qps	rps	rmbps	wps	wmbps	rpq	rkbpq	wpi	wkbpi	csps	cpups	cspq	cpupq	dbgb1	dbgb2	rss	maxop	p50	p99	tag
11904	80965	949	7.8	472.6	52.8	0.012	0.099	0.040	4.543	410701	32.9	5.073	325	835.2	836.8	185.5	0.081	3405	2941	12000m.fbmy5635_202203072101.cy9c_u
11904	77176	1058	8.3	478.0	54.5	0.014	0.111	0.040	4.691	396561	34.1	5.138	353	835.3	837.2	185.9	0.080	3213	2797	12000m.fbmy5635_202205192101.cy9c_u
11907	76219	1222	9.1	473.0	52.7	0.016	0.122	0.040	4.536	389006	34.3	5.104	360	834.3	836.3	185.7	0.081	3181	2669	12000m.fbmy5635_202208092101.cy9c_u
11904	76585	857	7.2	471.8	53.3	0.011	0.096	0.040	4.589	388438	34.0	5.072	355	833.9	835.8	185.7	0.082	3180	2733	12000m.fbmy5635_202210112144.cy9c_u
11901	73232	1454	12.5	397.1	44.8	0.020	0.175	0.033	3.852	361193	34.1	4.932	373	843.2	845.0	186.0	0.053	3117	2749	12000m.fbmy5635_202302162102.cy9c_u
11894	75253	664	7.8	372.1	41.3	0.009	0.106	0.031	3.556	369560	33.9	4.911	360	844.7	846.6	185.7	0.039	3069	2606	12000m.fbmy5635_202304122154.cy9c_u
11904	72450	2317	14.9	398.3	43.9	0.032	0.210	0.033	3.778	362371	34.2	5.002	378	843.3	845.3	186.2	0.061	3197	2781	12000m.fbmy5635_202305292102.cy9c_u
11907	69228	4257	24.8	414.1	45.5	0.061	0.367	0.035	3.911	343292	34.3	4.959	396	843.1	845.0	186.5	0.039	3037	2637	12000m.fbmy5635_20230529_832.cy9c_u
11907	67261	4386	26.5	412.2	44.8	0.065	0.403	0.035	3.855	332791	34.3	4.948	408	843.3	843.3	186.7	0.056	3053	2621	12000m.fbmy5635_20230529_843.cy9c_u
11907	67695	5906	32.2	396.0	43.3	0.087	0.488	0.033	3.725	340317	34.4	5.027	407	843.6	845.6	186.6	0.071	2925	2557	12000m.fbmy5635_20230529_850.cy9c_u
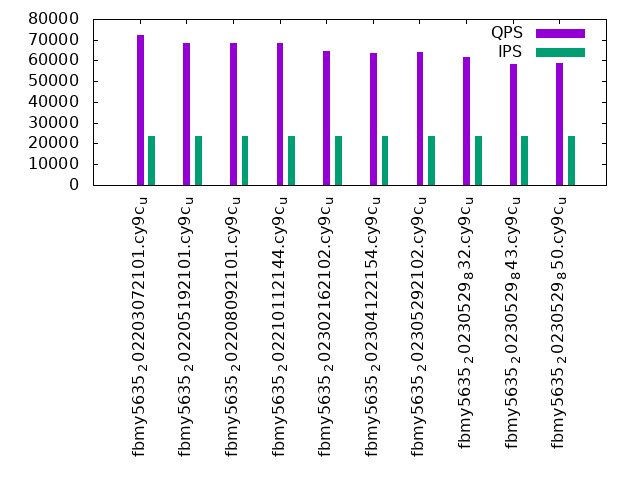
q1000.1
q1000.1: range queries with 1000 insert/s per client. Graphs for performance per 1-second interval are here.
Average throughput:
Query response time histogram: each cell has the percentage of responses that take <= the time in the header and max is the max response time in seconds. For max values in the top 25% of the range have a red background and in the bottom 25% of the range have a green background. The red background is not used when the min value is within 80% of the max value.
| dbms | 256us | 1ms | 4ms | 16ms | 64ms | 256ms | 1s | 4s | 16s | gt | max |
|---|---|---|---|---|---|---|---|---|---|---|---|
| fbmy5635_202203072101.cy9c_u | 25.073 | 74.859 | 0.043 | 0.025 | nonzero | nonzero | 0.077 | ||||
| fbmy5635_202205192101.cy9c_u | 19.229 | 80.694 | 0.052 | 0.026 | nonzero | nonzero | 0.071 | ||||
| fbmy5635_202208092101.cy9c_u | 18.472 | 81.453 | 0.049 | 0.025 | nonzero | nonzero | 0.066 | ||||
| fbmy5635_202210112144.cy9c_u | 18.927 | 80.999 | 0.048 | 0.026 | nonzero | 0.059 | |||||
| fbmy5635_202302162102.cy9c_u | 13.727 | 86.167 | 0.065 | 0.038 | 0.002 | nonzero | 0.114 | ||||
| fbmy5635_202304122154.cy9c_u | 11.212 | 88.683 | 0.055 | 0.033 | 0.017 | nonzero | 0.100 | ||||
| fbmy5635_202305292102.cy9c_u | 14.305 | 85.590 | 0.068 | 0.035 | 0.001 | nonzero | 0.068 | ||||
| fbmy5635_20230529_832.cy9c_u | 13.403 | 86.466 | 0.097 | 0.033 | nonzero | nonzero | 0.093 | ||||
| fbmy5635_20230529_843.cy9c_u | 7.632 | 92.175 | 0.155 | 0.037 | nonzero | nonzero | 0.113 | ||||
| fbmy5635_20230529_850.cy9c_u | 7.393 | 92.438 | 0.134 | 0.034 | nonzero | nonzero | 0.082 |
Insert response time histogram: each cell has the percentage of responses that take <= the time in the header and max is the max response time in seconds. For max values in the top 25% of the range have a red background and in the bottom 25% of the range have a green background. The red background is not used when the min value is within 80% of the max value.
| dbms | 256us | 1ms | 4ms | 16ms | 64ms | 256ms | 1s | 4s | 16s | gt | max |
|---|---|---|---|---|---|---|---|---|---|---|---|
| fbmy5635_202203072101.cy9c_u | 7.319 | 41.733 | 50.947 | 0.001 | 0.106 | ||||||
| fbmy5635_202205192101.cy9c_u | 12.658 | 37.672 | 49.667 | 0.003 | 0.104 | ||||||
| fbmy5635_202208092101.cy9c_u | 20.069 | 70.235 | 9.696 | nonzero | 0.084 | ||||||
| fbmy5635_202210112144.cy9c_u | 18.298 | 62.323 | 19.379 | 0.001 | 0.094 | ||||||
| fbmy5635_202302162102.cy9c_u | 9.862 | 29.330 | 60.807 | 0.002 | 0.110 | ||||||
| fbmy5635_202304122154.cy9c_u | 15.815 | 26.041 | 58.134 | 0.009 | 0.106 | ||||||
| fbmy5635_202305292102.cy9c_u | 8.738 | 27.352 | 63.907 | 0.004 | 0.110 | ||||||
| fbmy5635_20230529_832.cy9c_u | 5.291 | 56.883 | 37.824 | 0.001 | 0.084 | ||||||
| fbmy5635_20230529_843.cy9c_u | 4.319 | 33.945 | 61.735 | 0.001 | 0.099 | ||||||
| fbmy5635_20230529_850.cy9c_u | 11.437 | 24.738 | 63.825 | 0.001 | 0.066 |
Delete response time histogram: each cell has the percentage of responses that take <= the time in the header and max is the max response time in seconds. For max values in the top 25% of the range have a red background and in the bottom 25% of the range have a green background. The red background is not used when the min value is within 80% of the max value.
| dbms | 256us | 1ms | 4ms | 16ms | 64ms | 256ms | 1s | 4s | 16s | gt | max |
|---|---|---|---|---|---|---|---|---|---|---|---|
| fbmy5635_202203072101.cy9c_u | 0.002 | 7.628 | 42.630 | 49.739 | 0.002 | 0.106 | |||||
| fbmy5635_202205192101.cy9c_u | 0.001 | 12.902 | 38.433 | 48.661 | 0.004 | 0.117 | |||||
| fbmy5635_202208092101.cy9c_u | 21.263 | 69.370 | 9.366 | 0.001 | 0.094 | ||||||
| fbmy5635_202210112144.cy9c_u | 18.806 | 62.298 | 18.895 | 0.001 | 0.094 | ||||||
| fbmy5635_202302162102.cy9c_u | 9.795 | 29.261 | 60.941 | 0.002 | 0.135 | ||||||
| fbmy5635_202304122154.cy9c_u | 15.693 | 25.385 | 58.913 | 0.010 | 0.106 | ||||||
| fbmy5635_202305292102.cy9c_u | 9.015 | 27.666 | 63.315 | 0.004 | 0.155 | ||||||
| fbmy5635_20230529_832.cy9c_u | 5.306 | 57.843 | 36.849 | 0.002 | 0.098 | ||||||
| fbmy5635_20230529_843.cy9c_u | 4.365 | 35.074 | 60.559 | 0.002 | 0.163 | ||||||
| fbmy5635_20230529_850.cy9c_u | 11.435 | 25.974 | 62.590 | 0.001 | 0.167 |
Performance metrics for the DBMS listed above. Some are normalized by throughput, others are not. Legend for results is here.
ips	qps	rps	rmbps	wps	wmbps	rpq	rkbpq	wpi	wkbpi	csps	cpups	cspq	cpupq	dbgb1	dbgb2	rss	maxop	p50	p99	tag
23828	72082	2323	18.1	980.2	110.7	0.032	0.257	0.041	4.759	417036	36.6	5.786	406	834.9	835.0	186.9	0.077	3005	2621	12000m.fbmy5635_202203072101.cy9c_u
23834	68488	2074	18.9	965.9	109.6	0.030	0.283	0.041	4.708	402699	38.2	5.880	446	834.5	834.9	187.1	0.071	2861	2493	12000m.fbmy5635_202205192101.cy9c_u
23828	68239	2034	17.6	953.4	107.8	0.030	0.264	0.040	4.631	392791	38.0	5.756	445	834.0	834.5	187.1	0.066	2846	2478	12000m.fbmy5635_202208092101.cy9c_u
23821	68444	2019	18.0	947.1	107.5	0.029	0.269	0.040	4.620	395777	38.0	5.782	444	833.8	834.2	186.9	0.059	2829	2478	12000m.fbmy5635_202210112144.cy9c_u
23788	64503	2356	21.2	785.6	88.5	0.037	0.337	0.033	3.811	373827	38.0	5.796	471	842.6	842.9	186.9	0.114	2621	2094	12000m.fbmy5635_202302162102.cy9c_u
23775	63556	1421	17.3	802.2	90.6	0.022	0.279	0.034	3.901	371835	38.4	5.851	483	841.4	841.8	187.0	0.100	2606	1886	12000m.fbmy5635_202304122154.cy9c_u
23788	64168	3340	25.7	793.6	89.4	0.052	0.411	0.033	3.849	377691	38.2	5.886	476	842.6	843.0	187.0	0.068	2781	2334	12000m.fbmy5635_202305292102.cy9c_u
23828	61450	5912	43.5	810.6	90.4	0.096	0.725	0.034	3.885	361525	38.4	5.883	500	842.6	843.1	187.0	0.093	2685	2302	12000m.fbmy5635_20230529_832.cy9c_u
23828	58499	5880	45.3	795.9	88.5	0.101	0.793	0.033	3.802	351195	38.7	6.003	529	845.2	845.8	187.3	0.113	2573	2174	12000m.fbmy5635_20230529_843.cy9c_u
23828	58978	10156	60.1	804.7	89.9	0.172	1.044	0.034	3.865	356903	38.7	6.052	525	844.0	844.5	187.3	0.082	2541	2174	12000m.fbmy5635_20230529_850.cy9c_u
l.i0
l.i0: load without secondary indexes
Performance metrics for all DBMS, not just the ones listed above. Some are normalized by throughput, others are not. Legend for results is here.
ips	qps	rps	rmbps	wps	wmbps	rpq	rkbpq	wpi	wkbpi	csps	cpups	cspq	cpupq	dbgb1	dbgb2	rss	maxop	p50	p99	tag
569828	0	12	0.2	2936.4	323.8	0.000	0.000	0.005	0.582	677948	41.4	1.190	58	376.4	377.9	164.6	0.447	23876	14486	12000m.fbmy5635_202203072101.cy9c_u
538648	0	10	0.2	2811.8	311.9	0.000	0.000	0.005	0.593	684984	41.9	1.272	62	376.6	376.7	167.4	0.249	22577	13586	12000m.fbmy5635_202205192101.cy9c_u
531608	0	11	0.2	2775.4	308.1	0.000	0.000	0.005	0.593	670472	42.3	1.261	64	376.6	376.7	167.5	0.314	22178	13888	12000m.fbmy5635_202208092101.cy9c_u
535260	0	15	0.3	2783.3	309.8	0.000	0.001	0.005	0.593	675193	42.2	1.261	63	376.4	376.4	165.9	0.359	22378	13987	12000m.fbmy5635_202210112144.cy9c_u
543897	0	28	0.4	1717.7	188.3	0.000	0.001	0.003	0.354	666759	40.1	1.226	59	376.1	377.8	88.7	0.137	23277	14386	12000m.fbmy5635_202302162102.cy9c_u
541418	0	37	0.4	1727.2	187.6	0.000	0.001	0.003	0.355	668247	40.1	1.234	59	376.3	378.0	90.0	0.241	23077	14086	12000m.fbmy5635_202304122154.cy9c_u
538116	0	36	0.5	1710.2	186.7	0.000	0.001	0.003	0.355	660124	40.2	1.227	60	375.1	375.2	89.4	0.172	23077	13986	12000m.fbmy5635_202305292102.cy9c_u
534736	0	25	0.3	1712.6	183.1	0.000	0.001	0.003	0.351	659688	40.3	1.234	60	375.8	375.9	90.1	0.253	22977	13786	12000m.fbmy5635_20230529_832.cy9c_u
521218	0	26	0.2	1685.1	180.5	0.000	0.000	0.003	0.355	650527	40.2	1.248	62	376.3	376.4	91.7	0.247	22275	13586	12000m.fbmy5635_20230529_843.cy9c_u
534712	0	158	1.0	1700.1	183.1	0.000	0.002	0.003	0.351	635112	40.4	1.188	60	376.1	376.1	89.3	0.237	22977	13986	12000m.fbmy5635_20230529_850.cy9c_u
l.x
l.x: create secondary indexes
Performance metrics for all DBMS, not just the ones listed above. Some are normalized by throughput, others are not. Legend for results is here.
ips	qps	rps	rmbps	wps	wmbps	rpq	rkbpq	wpi	wkbpi	csps	cpups	cspq	cpupq	dbgb1	dbgb2	rss	maxop	p50	p99	tag
1422150	0	7164	208.2	1732.8	178.5	0.005	0.150	0.001	0.129	38155	29.6	0.027	17	772.0	773.5	206.2	0.002	NA	NA	12000m.fbmy5635_202203072101.cy9c_u
1399918	0	8143	204.3	1709.7	165.4	0.006	0.149	0.001	0.121	47729	30.9	0.034	18	771.9	772.0	206.1	0.003	NA	NA	12000m.fbmy5635_202205192101.cy9c_u
1402372	0	8757	206.6	1713.8	167.8	0.006	0.151	0.001	0.123	47950	30.9	0.034	18	772.0	772.1	206.2	0.003	NA	NA	12000m.fbmy5635_202208092101.cy9c_u
1399755	0	9272	203.5	1709.1	171.6	0.007	0.149	0.001	0.126	47613	30.9	0.034	18	772.0	772.0	206.1	0.003	NA	NA	12000m.fbmy5635_202210112144.cy9c_u
1396985	0	5315	210.9	1704.5	167.9	0.004	0.155	0.001	0.123	47989	31.1	0.034	18	771.7	773.4	206.7	0.002	NA	NA	12000m.fbmy5635_202302162102.cy9c_u
1384254	0	5779	207.6	1692.0	164.4	0.004	0.154	0.001	0.122	47963	31.0	0.035	18	771.8	773.6	206.6	0.003	NA	NA	12000m.fbmy5635_202304122154.cy9c_u
1380591	0	5193	205.8	1687.9	163.3	0.004	0.153	0.001	0.121	49939	30.8	0.036	18	770.7	770.7	206.6	0.006	NA	NA	12000m.fbmy5635_202305292102.cy9c_u
1388258	0	7104	201.4	1693.1	166.6	0.005	0.149	0.001	0.123	45251	30.7	0.033	18	771.4	771.4	206.6	0.003	NA	NA	12000m.fbmy5635_20230529_832.cy9c_u
1393902	0	8578	205.9	1699.7	167.6	0.006	0.151	0.001	0.123	44943	30.8	0.032	18	771.9	772.0	206.4	0.003	NA	NA	12000m.fbmy5635_20230529_843.cy9c_u
1380115	0	7392	203.3	1683.9	166.8	0.005	0.151	0.001	0.124	46052	30.8	0.033	18	771.7	771.7	206.7	0.005	NA	NA	12000m.fbmy5635_20230529_850.cy9c_u
l.i1
l.i1: continue load after secondary indexes created
Performance metrics for all DBMS, not just the ones listed above. Some are normalized by throughput, others are not. Legend for results is here.
ips	qps	rps	rmbps	wps	wmbps	rpq	rkbpq	wpi	wkbpi	csps	cpups	cspq	cpupq	dbgb1	dbgb2	rss	maxop	p50	p99	tag
68070	0	1094	22.9	2467.6	282.6	0.016	0.344	0.036	4.251	200046	18.4	2.939	216	834.6	835.2	179.5	0.142	2847	2498	12000m.fbmy5635_202203072101.cy9c_u
64109	0	2009	25.1	2288.1	257.3	0.031	0.401	0.036	4.110	195851	19.4	3.055	242	835.2	836.0	179.5	17.501	2697	2198	12000m.fbmy5635_202205192101.cy9c_u
62995	0	2107	25.0	2235.6	250.2	0.033	0.407	0.035	4.067	185004	19.2	2.937	244	836.5	837.4	179.5	17.404	2647	1798	12000m.fbmy5635_202208092101.cy9c_u
63022	0	2036	24.8	2224.4	249.1	0.032	0.403	0.035	4.047	187315	19.1	2.972	242	833.6	834.4	179.4	17.537	2647	1648	12000m.fbmy5635_202210112144.cy9c_u
57301	0	901	14.4	1552.8	177.1	0.016	0.257	0.027	3.165	168569	17.0	2.942	237	842.5	843.0	180.1	1.156	2398	1948	12000m.fbmy5635_202302162102.cy9c_u
57463	0	1351	16.2	1548.1	173.5	0.024	0.289	0.027	3.093	162735	16.9	2.832	235	848.2	849.0	179.9	0.169	2398	1949	12000m.fbmy5635_202304122154.cy9c_u
56775	0	1364	15.9	1500.3	168.4	0.024	0.287	0.026	3.037	172592	17.2	3.040	242	847.0	847.9	180.0	1.300	2398	150	12000m.fbmy5635_202305292102.cy9c_u
57214	0	1713	17.4	1511.8	169.9	0.030	0.311	0.026	3.040	191388	17.9	3.345	250	849.9	850.7	180.0	1.015	2448	150	12000m.fbmy5635_20230529_832.cy9c_u
56325	0	1739	17.6	1468.8	165.1	0.031	0.320	0.026	3.001	193266	18.2	3.431	259	845.3	846.2	179.9	2.177	2448	100	12000m.fbmy5635_20230529_843.cy9c_u
56840	0	8284	47.4	1491.6	167.7	0.146	0.855	0.026	3.021	194294	18.1	3.418	255	849.7	850.5	180.0	1.788	2448	150	12000m.fbmy5635_20230529_850.cy9c_u
q100.1
q100.1: range queries with 100 insert/s per client
Performance metrics for all DBMS, not just the ones listed above. Some are normalized by throughput, others are not. Legend for results is here.
ips	qps	rps	rmbps	wps	wmbps	rpq	rkbpq	wpi	wkbpi	csps	cpups	cspq	cpupq	dbgb1	dbgb2	rss	maxop	p50	p99	tag
2381	86457	3396	26.7	124.5	13.1	0.039	0.317	0.052	5.633	418660	30.9	4.842	286	833.6	834.0	182.0	0.076	3709	2462	12000m.fbmy5635_202203072101.cy9c_u
2381	82368	3447	27.6	129.5	14.0	0.042	0.343	0.054	6.008	403482	31.8	4.899	309	833.2	833.9	182.0	0.075	3469	2334	12000m.fbmy5635_202205192101.cy9c_u
2381	81628	3492	26.9	128.8	13.6	0.043	0.338	0.054	5.848	397454	31.9	4.869	313	832.8	833.5	181.9	0.069	3437	2301	12000m.fbmy5635_202208092101.cy9c_u
2381	82039	3407	26.9	126.4	13.4	0.042	0.336	0.053	5.784	397317	31.7	4.843	309	832.4	833.1	181.9	0.084	3453	2302	12000m.fbmy5635_202210112144.cy9c_u
2381	78541	3958	33.2	112.0	11.8	0.050	0.433	0.047	5.079	370479	31.7	4.717	323	841.3	841.9	183.4	0.106	3420	2254	12000m.fbmy5635_202302162102.cy9c_u
2380	81085	3193	27.4	103.8	11.0	0.039	0.346	0.044	4.740	383540	31.7	4.730	313	840.3	840.9	183.0	0.120	3309	2062	12000m.fbmy5635_202304122154.cy9c_u
2381	77529	4525	35.6	102.5	10.8	0.058	0.470	0.043	4.626	369800	31.6	4.770	326	841.6	842.2	183.6	0.109	3484	2190	12000m.fbmy5635_202305292102.cy9c_u
2381	73815	6152	47.3	131.6	13.5	0.083	0.656	0.055	5.788	350658	31.8	4.751	345	842.2	842.8	184.5	0.083	3229	1966	12000m.fbmy5635_20230529_832.cy9c_u
2381	71605	6355	49.4	140.6	14.2	0.089	0.707	0.059	6.105	340710	31.8	4.758	355	841.7	842.5	184.7	0.084	3325	1934	12000m.fbmy5635_20230529_843.cy9c_u
2381	72391	6832	50.8	137.0	14.1	0.094	0.719	0.058	6.058	347033	31.9	4.794	353	841.6	842.4	184.5	0.090	3229	1966	12000m.fbmy5635_20230529_850.cy9c_u
q500.1
q500.1: range queries with 500 insert/s per client
Performance metrics for all DBMS, not just the ones listed above. Some are normalized by throughput, others are not. Legend for results is here.
ips	qps	rps	rmbps	wps	wmbps	rpq	rkbpq	wpi	wkbpi	csps	cpups	cspq	cpupq	dbgb1	dbgb2	rss	maxop	p50	p99	tag
11904	80965	949	7.8	472.6	52.8	0.012	0.099	0.040	4.543	410701	32.9	5.073	325	835.2	836.8	185.5	0.081	3405	2941	12000m.fbmy5635_202203072101.cy9c_u
11904	77176	1058	8.3	478.0	54.5	0.014	0.111	0.040	4.691	396561	34.1	5.138	353	835.3	837.2	185.9	0.080	3213	2797	12000m.fbmy5635_202205192101.cy9c_u
11907	76219	1222	9.1	473.0	52.7	0.016	0.122	0.040	4.536	389006	34.3	5.104	360	834.3	836.3	185.7	0.081	3181	2669	12000m.fbmy5635_202208092101.cy9c_u
11904	76585	857	7.2	471.8	53.3	0.011	0.096	0.040	4.589	388438	34.0	5.072	355	833.9	835.8	185.7	0.082	3180	2733	12000m.fbmy5635_202210112144.cy9c_u
11901	73232	1454	12.5	397.1	44.8	0.020	0.175	0.033	3.852	361193	34.1	4.932	373	843.2	845.0	186.0	0.053	3117	2749	12000m.fbmy5635_202302162102.cy9c_u
11894	75253	664	7.8	372.1	41.3	0.009	0.106	0.031	3.556	369560	33.9	4.911	360	844.7	846.6	185.7	0.039	3069	2606	12000m.fbmy5635_202304122154.cy9c_u
11904	72450	2317	14.9	398.3	43.9	0.032	0.210	0.033	3.778	362371	34.2	5.002	378	843.3	845.3	186.2	0.061	3197	2781	12000m.fbmy5635_202305292102.cy9c_u
11907	69228	4257	24.8	414.1	45.5	0.061	0.367	0.035	3.911	343292	34.3	4.959	396	843.1	845.0	186.5	0.039	3037	2637	12000m.fbmy5635_20230529_832.cy9c_u
11907	67261	4386	26.5	412.2	44.8	0.065	0.403	0.035	3.855	332791	34.3	4.948	408	843.3	843.3	186.7	0.056	3053	2621	12000m.fbmy5635_20230529_843.cy9c_u
11907	67695	5906	32.2	396.0	43.3	0.087	0.488	0.033	3.725	340317	34.4	5.027	407	843.6	845.6	186.6	0.071	2925	2557	12000m.fbmy5635_20230529_850.cy9c_u
q1000.1
q1000.1: range queries with 1000 insert/s per client
Performance metrics for all DBMS, not just the ones listed above. Some are normalized by throughput, others are not. Legend for results is here.
ips	qps	rps	rmbps	wps	wmbps	rpq	rkbpq	wpi	wkbpi	csps	cpups	cspq	cpupq	dbgb1	dbgb2	rss	maxop	p50	p99	tag
23828	72082	2323	18.1	980.2	110.7	0.032	0.257	0.041	4.759	417036	36.6	5.786	406	834.9	835.0	186.9	0.077	3005	2621	12000m.fbmy5635_202203072101.cy9c_u
23834	68488	2074	18.9	965.9	109.6	0.030	0.283	0.041	4.708	402699	38.2	5.880	446	834.5	834.9	187.1	0.071	2861	2493	12000m.fbmy5635_202205192101.cy9c_u
23828	68239	2034	17.6	953.4	107.8	0.030	0.264	0.040	4.631	392791	38.0	5.756	445	834.0	834.5	187.1	0.066	2846	2478	12000m.fbmy5635_202208092101.cy9c_u
23821	68444	2019	18.0	947.1	107.5	0.029	0.269	0.040	4.620	395777	38.0	5.782	444	833.8	834.2	186.9	0.059	2829	2478	12000m.fbmy5635_202210112144.cy9c_u
23788	64503	2356	21.2	785.6	88.5	0.037	0.337	0.033	3.811	373827	38.0	5.796	471	842.6	842.9	186.9	0.114	2621	2094	12000m.fbmy5635_202302162102.cy9c_u
23775	63556	1421	17.3	802.2	90.6	0.022	0.279	0.034	3.901	371835	38.4	5.851	483	841.4	841.8	187.0	0.100	2606	1886	12000m.fbmy5635_202304122154.cy9c_u
23788	64168	3340	25.7	793.6	89.4	0.052	0.411	0.033	3.849	377691	38.2	5.886	476	842.6	843.0	187.0	0.068	2781	2334	12000m.fbmy5635_202305292102.cy9c_u
23828	61450	5912	43.5	810.6	90.4	0.096	0.725	0.034	3.885	361525	38.4	5.883	500	842.6	843.1	187.0	0.093	2685	2302	12000m.fbmy5635_20230529_832.cy9c_u
23828	58499	5880	45.3	795.9	88.5	0.101	0.793	0.033	3.802	351195	38.7	6.003	529	845.2	845.8	187.3	0.113	2573	2174	12000m.fbmy5635_20230529_843.cy9c_u
23828	58978	10156	60.1	804.7	89.9	0.172	1.044	0.034	3.865	356903	38.7	6.052	525	844.0	844.5	187.3	0.082	2541	2174	12000m.fbmy5635_20230529_850.cy9c_u
l.i0
- l.i0: load without secondary indexes
- Legend for results is here.
- Each entry lists the percentage of responses that fit in that bucket (slower than max time for previous bucket, faster than min time for next bucket).
Insert response time histogram
256us	1ms	4ms	16ms	64ms	256ms	1s	4s	16s	gt	max	tag
0.000	0.027	53.251	46.677	0.004	0.039	nonzero	0.000	0.000	0.000	0.447	fbmy5635_202203072101.cy9c_u
0.000	0.011	41.007	58.940	0.004	0.039	0.000	0.000	0.000	0.000	0.249	fbmy5635_202205192101.cy9c_u
0.000	0.013	38.243	61.701	0.004	0.039	nonzero	0.000	0.000	0.000	0.314	fbmy5635_202208092101.cy9c_u
0.000	0.012	39.643	60.302	0.004	0.039	nonzero	0.000	0.000	0.000	0.359	fbmy5635_202210112144.cy9c_u
0.000	0.007	43.090	56.861	0.003	0.039	0.000	0.000	0.000	0.000	0.137	fbmy5635_202302162102.cy9c_u
0.000	0.008	43.040	56.911	0.003	0.039	0.000	0.000	0.000	0.000	0.241	fbmy5635_202304122154.cy9c_u
0.000	0.007	42.306	57.645	0.003	0.039	0.000	0.000	0.000	0.000	0.172	fbmy5635_202305292102.cy9c_u
0.000	0.006	40.790	59.162	0.003	0.039	0.000	0.000	0.000	0.000	0.253	fbmy5635_20230529_832.cy9c_u
0.000	0.005	36.317	63.636	0.003	0.039	0.000	0.000	0.000	0.000	0.247	fbmy5635_20230529_843.cy9c_u
0.000	0.005	40.053	59.898	0.006	0.038	0.000	0.000	0.000	0.000	0.237	fbmy5635_20230529_850.cy9c_u
l.x
- l.x: create secondary indexes
- Legend for results is here.
- Each entry lists the percentage of responses that fit in that bucket (slower than max time for previous bucket, faster than min time for next bucket).
TODO - determine whether there is data for create index response time
l.i1
- l.i1: continue load after secondary indexes created
- Legend for results is here.
- Each entry lists the percentage of responses that fit in that bucket (slower than max time for previous bucket, faster than min time for next bucket).
Insert response time histogram
256us	1ms	4ms	16ms	64ms	256ms	1s	4s	16s	gt	max	tag
0.000	nonzero	0.047	28.330	71.616	0.006	0.000	0.000	0.000	0.000	0.142	fbmy5635_202203072101.cy9c_u
0.000	0.000	0.039	21.479	78.465	0.016	0.001	nonzero	nonzero	nonzero	17.501	fbmy5635_202205192101.cy9c_u
0.000	0.000	0.034	19.894	80.051	0.019	0.001	nonzero	nonzero	nonzero	17.404	fbmy5635_202208092101.cy9c_u
0.000	0.000	0.046	20.047	79.869	0.035	0.003	nonzero	nonzero	nonzero	17.537	fbmy5635_202210112144.cy9c_u
0.000	0.000	0.028	11.689	88.241	0.024	0.013	0.005	0.000	0.000	1.156	fbmy5635_202302162102.cy9c_u
0.000	0.000	0.032	11.522	88.437	0.010	0.000	0.000	0.000	0.000	0.169	fbmy5635_202304122154.cy9c_u
0.000	0.000	0.035	12.206	87.599	0.107	0.051	0.001	0.000	0.000	1.300	fbmy5635_202305292102.cy9c_u
0.000	0.000	0.028	13.710	85.909	0.283	0.070	nonzero	0.000	0.000	1.015	fbmy5635_20230529_832.cy9c_u
0.000	0.000	0.044	13.335	86.246	0.281	0.085	0.008	0.000	0.000	2.177	fbmy5635_20230529_843.cy9c_u
0.000	0.000	0.034	13.276	86.404	0.211	0.073	0.002	0.000	0.000	1.788	fbmy5635_20230529_850.cy9c_u
Delete response time histogram
256us	1ms	4ms	16ms	64ms	256ms	1s	4s	16s	gt	max	tag
0.000	0.002	0.048	30.924	69.020	0.007	0.000	0.000	0.000	0.000	0.227	fbmy5635_202203072101.cy9c_u
0.000	nonzero	0.040	22.861	77.081	0.016	0.001	nonzero	nonzero	nonzero	17.615	fbmy5635_202205192101.cy9c_u
0.000	0.001	0.035	21.304	78.640	0.019	0.001	nonzero	nonzero	nonzero	17.404	fbmy5635_202208092101.cy9c_u
0.000	nonzero	0.046	21.260	78.655	0.036	0.003	nonzero	nonzero	nonzero	17.537	fbmy5635_202210112144.cy9c_u
0.000	0.000	0.029	11.517	88.411	0.026	0.013	0.005	0.000	0.000	1.156	fbmy5635_202302162102.cy9c_u
0.000	nonzero	0.033	11.379	88.577	0.011	nonzero	0.000	0.000	0.000	0.286	fbmy5635_202304122154.cy9c_u
0.000	nonzero	0.035	11.700	88.101	0.111	0.051	0.001	0.000	0.000	1.300	fbmy5635_202305292102.cy9c_u
0.000	0.000	0.029	14.012	85.603	0.286	0.070	nonzero	0.000	0.000	1.014	fbmy5635_20230529_832.cy9c_u
0.000	nonzero	0.045	13.294	86.284	0.284	0.086	0.008	0.000	0.000	2.177	fbmy5635_20230529_843.cy9c_u
0.000	nonzero	0.034	12.852	86.826	0.213	0.073	0.002	0.000	0.000	1.788	fbmy5635_20230529_850.cy9c_u
q100.1
- q100.1: range queries with 100 insert/s per client
- Legend for results is here.
- Each entry lists the percentage of responses that fit in that bucket (slower than max time for previous bucket, faster than min time for next bucket).
Query response time histogram
256us	1ms	4ms	16ms	64ms	256ms	1s	4s	16s	gt	max	tag
56.980	42.951	0.066	0.003	nonzero	nonzero	0.000	0.000	0.000	0.000	0.076	fbmy5635_202203072101.cy9c_u
49.769	50.142	0.086	0.003	nonzero	nonzero	0.000	0.000	0.000	0.000	0.075	fbmy5635_202205192101.cy9c_u
48.044	51.868	0.086	0.003	nonzero	nonzero	0.000	0.000	0.000	0.000	0.069	fbmy5635_202208092101.cy9c_u
49.142	50.770	0.085	0.003	nonzero	nonzero	0.000	0.000	0.000	0.000	0.084	fbmy5635_202210112144.cy9c_u
49.300	50.449	0.246	0.004	nonzero	0.001	0.000	0.000	0.000	0.000	0.106	fbmy5635_202302162102.cy9c_u
46.952	52.939	0.103	0.006	nonzero	0.001	0.000	0.000	0.000	0.000	0.120	fbmy5635_202304122154.cy9c_u
49.446	50.243	0.307	0.004	nonzero	0.001	0.000	0.000	0.000	0.000	0.109	fbmy5635_202305292102.cy9c_u
49.159	50.343	0.494	0.004	nonzero	0.001	0.000	0.000	0.000	0.000	0.083	fbmy5635_20230529_832.cy9c_u
44.814	54.600	0.580	0.005	nonzero	0.001	0.000	0.000	0.000	0.000	0.084	fbmy5635_20230529_843.cy9c_u
44.140	55.361	0.494	0.004	nonzero	0.001	0.000	0.000	0.000	0.000	0.090	fbmy5635_20230529_850.cy9c_u
Insert response time histogram
256us	1ms	4ms	16ms	64ms	256ms	1s	4s	16s	gt	max	tag
0.000	0.001	99.951	0.048	0.000	0.000	0.000	0.000	0.000	0.000	0.014	fbmy5635_202203072101.cy9c_u
0.000	0.000	99.954	0.046	0.000	0.000	0.000	0.000	0.000	0.000	0.011	fbmy5635_202205192101.cy9c_u
0.000	0.000	99.960	0.040	0.000	0.000	0.000	0.000	0.000	0.000	0.013	fbmy5635_202208092101.cy9c_u
0.000	0.000	99.952	0.048	0.000	0.000	0.000	0.000	0.000	0.000	0.012	fbmy5635_202210112144.cy9c_u
0.000	0.005	99.898	0.090	0.005	0.002	0.000	0.000	0.000	0.000	0.078	fbmy5635_202302162102.cy9c_u
0.000	0.009	99.828	0.151	0.011	0.002	0.000	0.000	0.000	0.000	0.079	fbmy5635_202304122154.cy9c_u
0.000	0.002	99.726	0.263	0.008	0.001	0.000	0.000	0.000	0.000	0.071	fbmy5635_202305292102.cy9c_u
0.000	0.001	99.939	0.052	0.006	0.003	0.000	0.000	0.000	0.000	0.084	fbmy5635_20230529_832.cy9c_u
0.000	0.001	99.939	0.056	0.003	0.000	0.000	0.000	0.000	0.000	0.054	fbmy5635_20230529_843.cy9c_u
0.000	0.000	99.933	0.062	0.002	0.002	0.000	0.000	0.000	0.000	0.093	fbmy5635_20230529_850.cy9c_u
Delete response time histogram
256us	1ms	4ms	16ms	64ms	256ms	1s	4s	16s	gt	max	tag
0.000	0.049	99.896	0.052	0.002	0.001	0.000	0.000	0.000	0.000	0.103	fbmy5635_202203072101.cy9c_u
0.000	0.002	99.943	0.051	0.004	0.000	0.000	0.000	0.000	0.000	0.054	fbmy5635_202205192101.cy9c_u
0.000	0.001	99.951	0.045	0.002	0.001	0.000	0.000	0.000	0.000	0.104	fbmy5635_202208092101.cy9c_u
0.000	0.005	99.944	0.049	0.002	0.000	0.000	0.000	0.000	0.000	0.049	fbmy5635_202210112144.cy9c_u
0.000	0.000	99.891	0.095	0.008	0.006	0.000	0.000	0.000	0.000	0.081	fbmy5635_202302162102.cy9c_u
0.000	0.000	99.812	0.163	0.022	0.003	0.000	0.000	0.000	0.000	0.120	fbmy5635_202304122154.cy9c_u
0.000	0.000	99.722	0.263	0.012	0.003	0.000	0.000	0.000	0.000	0.078	fbmy5635_202305292102.cy9c_u
0.000	0.000	99.925	0.057	0.014	0.004	0.000	0.000	0.000	0.000	0.085	fbmy5635_20230529_832.cy9c_u
0.000	0.000	99.930	0.058	0.009	0.003	0.000	0.000	0.000	0.000	0.084	fbmy5635_20230529_843.cy9c_u
0.000	0.000	99.906	0.074	0.015	0.005	0.000	0.000	0.000	0.000	0.095	fbmy5635_20230529_850.cy9c_u
q500.1
- q500.1: range queries with 500 insert/s per client
- Legend for results is here.
- Each entry lists the percentage of responses that fit in that bucket (slower than max time for previous bucket, faster than min time for next bucket).
Query response time histogram
256us	1ms	4ms	16ms	64ms	256ms	1s	4s	16s	gt	max	tag
44.511	55.465	0.013	0.011	nonzero	0.001	0.000	0.000	0.000	0.000	0.081	fbmy5635_202203072101.cy9c_u
37.520	62.453	0.015	0.011	nonzero	0.001	0.000	0.000	0.000	0.000	0.080	fbmy5635_202205192101.cy9c_u
35.001	64.969	0.018	0.011	nonzero	0.001	0.000	0.000	0.000	0.000	0.081	fbmy5635_202208092101.cy9c_u
35.974	63.997	0.017	0.011	nonzero	0.001	0.000	0.000	0.000	0.000	0.082	fbmy5635_202210112144.cy9c_u
33.397	66.561	0.026	0.016	nonzero	0.000	0.000	0.000	0.000	0.000	0.053	fbmy5635_202302162102.cy9c_u
32.472	67.481	0.024	0.021	0.002	0.000	0.000	0.000	0.000	0.000	0.039	fbmy5635_202304122154.cy9c_u
33.577	66.384	0.024	0.016	nonzero	0.000	0.000	0.000	0.000	0.000	0.061	fbmy5635_202305292102.cy9c_u
33.492	66.473	0.021	0.014	nonzero	0.000	0.000	0.000	0.000	0.000	0.039	fbmy5635_20230529_832.cy9c_u
28.396	71.567	0.022	0.015	nonzero	0.000	0.000	0.000	0.000	0.000	0.056	fbmy5635_20230529_843.cy9c_u
27.565	72.397	0.024	0.015	nonzero	nonzero	0.000	0.000	0.000	0.000	0.071	fbmy5635_20230529_850.cy9c_u
Insert response time histogram
256us	1ms	4ms	16ms	64ms	256ms	1s	4s	16s	gt	max	tag
0.000	nonzero	99.510	0.488	0.001	0.001	0.000	0.000	0.000	0.000	0.078	fbmy5635_202203072101.cy9c_u
0.000	0.000	98.104	1.891	0.004	0.001	0.000	0.000	0.000	0.000	0.078	fbmy5635_202205192101.cy9c_u
0.000	0.000	99.844	0.152	0.003	0.001	0.000	0.000	0.000	0.000	0.080	fbmy5635_202208092101.cy9c_u
0.000	0.000	99.881	0.116	0.002	0.001	0.000	0.000	0.000	0.000	0.081	fbmy5635_202210112144.cy9c_u
0.000	0.001	63.658	36.250	0.090	nonzero	0.000	0.000	0.000	0.000	0.080	fbmy5635_202302162102.cy9c_u
0.000	0.000	95.600	4.333	0.067	nonzero	0.000	0.000	0.000	0.000	0.082	fbmy5635_202304122154.cy9c_u
0.000	0.000	46.374	53.459	0.167	0.000	0.000	0.000	0.000	0.000	0.033	fbmy5635_202305292102.cy9c_u
0.000	0.000	61.406	38.574	0.020	nonzero	0.000	0.000	0.000	0.000	0.071	fbmy5635_20230529_832.cy9c_u
0.000	0.000	82.706	17.293	0.002	0.000	0.000	0.000	0.000	0.000	0.027	fbmy5635_20230529_843.cy9c_u
0.000	0.000	28.494	68.785	2.721	0.000	0.000	0.000	0.000	0.000	0.064	fbmy5635_20230529_850.cy9c_u
Delete response time histogram
256us	1ms	4ms	16ms	64ms	256ms	1s	4s	16s	gt	max	tag
0.000	0.008	99.609	0.368	0.010	0.005	0.000	0.000	0.000	0.000	0.101	fbmy5635_202203072101.cy9c_u
0.000	0.001	98.547	1.436	0.013	0.004	0.000	0.000	0.000	0.000	0.103	fbmy5635_202205192101.cy9c_u
0.000	nonzero	99.840	0.145	0.012	0.003	0.000	0.000	0.000	0.000	0.100	fbmy5635_202208092101.cy9c_u
0.000	0.000	99.870	0.116	0.010	0.004	0.000	0.000	0.000	0.000	0.115	fbmy5635_202210112144.cy9c_u
0.000	0.000	65.989	33.919	0.091	nonzero	0.000	0.000	0.000	0.000	0.080	fbmy5635_202302162102.cy9c_u
0.000	0.000	96.381	3.543	0.076	nonzero	0.000	0.000	0.000	0.000	0.082	fbmy5635_202304122154.cy9c_u
0.000	0.000	47.722	52.106	0.172	nonzero	0.000	0.000	0.000	0.000	0.083	fbmy5635_202305292102.cy9c_u
0.000	0.000	64.682	35.296	0.022	nonzero	0.000	0.000	0.000	0.000	0.069	fbmy5635_20230529_832.cy9c_u
0.000	0.000	85.312	14.679	0.008	nonzero	0.000	0.000	0.000	0.000	0.080	fbmy5635_20230529_843.cy9c_u
0.000	0.000	29.806	67.769	2.426	nonzero	0.000	0.000	0.000	0.000	0.079	fbmy5635_20230529_850.cy9c_u
q1000.1
- q1000.1: range queries with 1000 insert/s per client
- Legend for results is here.
- Each entry lists the percentage of responses that fit in that bucket (slower than max time for previous bucket, faster than min time for next bucket).
Query response time histogram
256us	1ms	4ms	16ms	64ms	256ms	1s	4s	16s	gt	max	tag
25.073	74.859	0.043	0.025	nonzero	nonzero	0.000	0.000	0.000	0.000	0.077	fbmy5635_202203072101.cy9c_u
19.229	80.694	0.052	0.026	nonzero	nonzero	0.000	0.000	0.000	0.000	0.071	fbmy5635_202205192101.cy9c_u
18.472	81.453	0.049	0.025	nonzero	nonzero	0.000	0.000	0.000	0.000	0.066	fbmy5635_202208092101.cy9c_u
18.927	80.999	0.048	0.026	nonzero	0.000	0.000	0.000	0.000	0.000	0.059	fbmy5635_202210112144.cy9c_u
13.727	86.167	0.065	0.038	0.002	nonzero	0.000	0.000	0.000	0.000	0.114	fbmy5635_202302162102.cy9c_u
11.212	88.683	0.055	0.033	0.017	nonzero	0.000	0.000	0.000	0.000	0.100	fbmy5635_202304122154.cy9c_u
14.305	85.590	0.068	0.035	0.001	nonzero	0.000	0.000	0.000	0.000	0.068	fbmy5635_202305292102.cy9c_u
13.403	86.466	0.097	0.033	nonzero	nonzero	0.000	0.000	0.000	0.000	0.093	fbmy5635_20230529_832.cy9c_u
7.632	92.175	0.155	0.037	nonzero	nonzero	0.000	0.000	0.000	0.000	0.113	fbmy5635_20230529_843.cy9c_u
7.393	92.438	0.134	0.034	nonzero	nonzero	0.000	0.000	0.000	0.000	0.082	fbmy5635_20230529_850.cy9c_u
Insert response time histogram
256us	1ms	4ms	16ms	64ms	256ms	1s	4s	16s	gt	max	tag
0.000	0.000	7.319	41.733	50.947	0.001	0.000	0.000	0.000	0.000	0.106	fbmy5635_202203072101.cy9c_u
0.000	0.000	12.658	37.672	49.667	0.003	0.000	0.000	0.000	0.000	0.104	fbmy5635_202205192101.cy9c_u
0.000	0.000	20.069	70.235	9.696	nonzero	0.000	0.000	0.000	0.000	0.084	fbmy5635_202208092101.cy9c_u
0.000	0.000	18.298	62.323	19.379	0.001	0.000	0.000	0.000	0.000	0.094	fbmy5635_202210112144.cy9c_u
0.000	0.000	9.862	29.330	60.807	0.002	0.000	0.000	0.000	0.000	0.110	fbmy5635_202302162102.cy9c_u
0.000	0.000	15.815	26.041	58.134	0.009	0.000	0.000	0.000	0.000	0.106	fbmy5635_202304122154.cy9c_u
0.000	0.000	8.738	27.352	63.907	0.004	0.000	0.000	0.000	0.000	0.110	fbmy5635_202305292102.cy9c_u
0.000	0.000	5.291	56.883	37.824	0.001	0.000	0.000	0.000	0.000	0.084	fbmy5635_20230529_832.cy9c_u
0.000	0.000	4.319	33.945	61.735	0.001	0.000	0.000	0.000	0.000	0.099	fbmy5635_20230529_843.cy9c_u
0.000	0.000	11.437	24.738	63.825	0.001	0.000	0.000	0.000	0.000	0.066	fbmy5635_20230529_850.cy9c_u
Delete response time histogram
256us	1ms	4ms	16ms	64ms	256ms	1s	4s	16s	gt	max	tag
0.000	0.002	7.628	42.630	49.739	0.002	0.000	0.000	0.000	0.000	0.106	fbmy5635_202203072101.cy9c_u
0.000	0.001	12.902	38.433	48.661	0.004	0.000	0.000	0.000	0.000	0.117	fbmy5635_202205192101.cy9c_u
0.000	0.000	21.263	69.370	9.366	0.001	0.000	0.000	0.000	0.000	0.094	fbmy5635_202208092101.cy9c_u
0.000	0.000	18.806	62.298	18.895	0.001	0.000	0.000	0.000	0.000	0.094	fbmy5635_202210112144.cy9c_u
0.000	0.000	9.795	29.261	60.941	0.002	0.000	0.000	0.000	0.000	0.135	fbmy5635_202302162102.cy9c_u
0.000	0.000	15.693	25.385	58.913	0.010	0.000	0.000	0.000	0.000	0.106	fbmy5635_202304122154.cy9c_u
0.000	0.000	9.015	27.666	63.315	0.004	0.000	0.000	0.000	0.000	0.155	fbmy5635_202305292102.cy9c_u
0.000	0.000	5.306	57.843	36.849	0.002	0.000	0.000	0.000	0.000	0.098	fbmy5635_20230529_832.cy9c_u
0.000	0.000	4.365	35.074	60.559	0.002	0.000	0.000	0.000	0.000	0.163	fbmy5635_20230529_843.cy9c_u
0.000	0.000	11.435	25.974	62.590	0.001	0.000	0.000	0.000	0.000	0.167	fbmy5635_20230529_850.cy9c_u