Introduction
This is a report for the insert benchmark with 480M docs and 24 client(s). It is generated by scripts (bash, awk, sed) and Tufte might not be impressed. An overview of the insert benchmark is here and a short update is here. Below, by DBMS, I mean DBMS+version.config. An example is my8020.c10b40 where my means MySQL, 8020 is version 8.0.20 and c10b40 is the name for the configuration file.
The test server has 80 cores, hyperthreads enabled, 256G RAM and fast NVMe with XFS. The benchmark was run with 24 clients and there were 1 or 3 connections per client (1 for queries or inserts without rate limits, 1+1 for rate limited inserts+deletes). There are 24 tables, with a client per table. It loads 20M rows per-table without secondary indexes, creates secondary indexes, then inserts 50M rows per-table with a delete per insert to avoid growing the table. It then does 3 read+write tests for 3600s each that do queries as fast as possible with 100, 500 and then 1000 inserts/second/client concurrent with the queries and 1000 deletes/second to avoid growing the table. The database is cached by RocksDB.
The tested DBMS are:
- fbmy5635_202203072101.cy9c5_u - FB MySQL 5.6.35 compiled at git hash e7d976ee (7 Mar 2022 tag) with RocksDB 6.28.2, cy9c5_u config adds rocksdb_max_subcompactions=4
- fbmy5635_202205192101.cy9c5_u - FB MySQL 5.6.35 compiled at git hash d503bd77 (19 May 2022 tag) with RocksDB 7.2.2, cy9c5_u config adds rocksdb_max_subcompactions=4
- fbmy5635_202208092101.cy9c5_u - FB MySQL 5.6.35 compiled at git hash 877a0e58 (9 Aug 2022 tag) with RocksDB 7.3.1, cy9c5_u config adds rocksdb_max_subcompactions=4
- fbmy5635_202210112144.cy9c5_u - FB MySQL 5.6.35 compiled at git hash c691c716 (11 Oct 2022 tag) with RocksDB 7.3.1, cy9c5_u config adds rocksdb_max_subcompactions=4
- fbmy5635_202302162102.cy9c5_u - FB MySQL 5.6.35 compiled at git hash 21a2b0aa (16 Feb 2023 tag) with RocksDB 7.10.0, cy9c5_u config adds rocksdb_max_subcompactions=4
- fbmy5635_202304122154.cy9c5_u - FB MySQL 5.6.35 compiled at git hash 205c31dd (12 Apr 2023 tag) with RocksDB 7.10.2, cy9c5_u config adds rocksdb_max_subcompactions=4
- fbmy5635_202305292102.cy9c5_u - FB MySQL 5.6.35 compiled at git hash b739eac1 (29 May 2023 tag) with RocksDB 8.2.1, cy9c5_u config adds rocksdb_max_subcompactions=4
- fbmy5635_20230529_832.cy9c5_u - FB MySQL 5.6.35 compiled at git hash b739eac1 (29 May 2023 tag) with RocksDB 8.3.2, cy9c5_u config adds rocksdb_max_subcompactions=4
- fbmy5635_20230529_843.cy9c5_u - FB MySQL 5.6.35 compiled at git hash b739eac1 (29 May 2023 tag) with RocksDB 8.4.3, cy9c5_u config adds rocksdb_max_subcompactions=4
- fbmy5635_20230529_850.cy9c5_u - FB MySQL 5.6.35 compiled at git hash b739eac1 (29 May 2023 tag) with RocksDB 8.5.0, cy9c5_u config adds rocksdb_max_subcompactions=4
Contents
- Summary
- l.i0: load without secondary indexes
- l.x: create secondary indexes
- l.i1: continue load after secondary indexes created
- q100.1: range queries with 100 insert/s per client
- q500.1: range queries with 500 insert/s per client
- q1000.1: range queries with 1000 insert/s per client
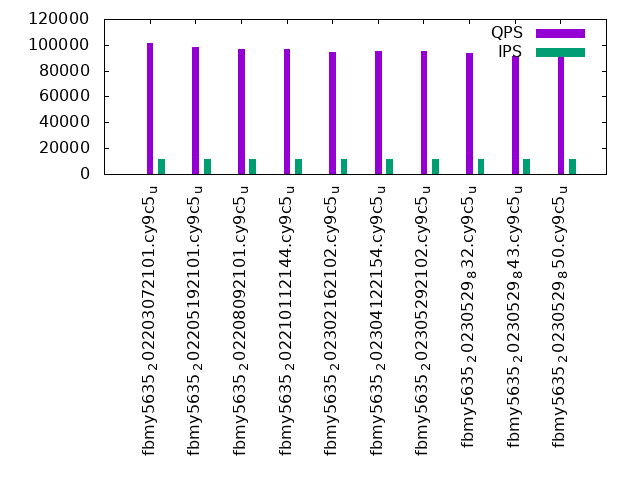
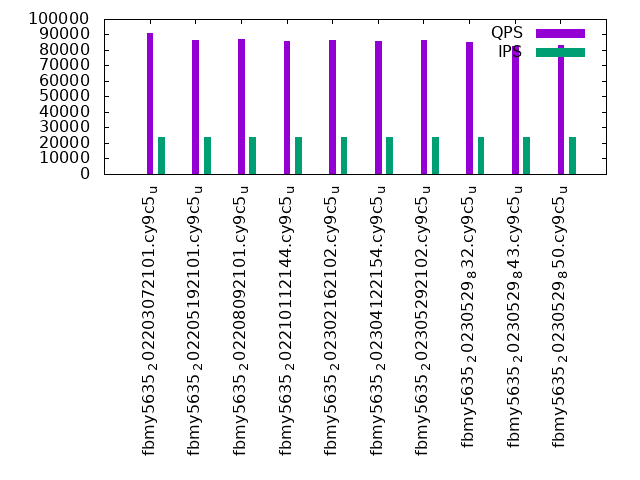
Summary
The numbers are inserts/s for l.i0 and l.i1, indexed docs (or rows) /s for l.x and queries/s for q100, q500, q1000. The values are the average rate over the entire test for inserts (IPS) and queries (QPS). The range of values for IPS and QPS is split into 3 parts: bottom 25%, middle 50%, top 25%. Values in the bottom 25% have a red background, values in the top 25% have a green background and values in the middle have no color. A gray background is used for values that can be ignored because the DBMS did not sustain the target insert rate. Red backgrounds are not used when the minimum value is within 80% of the max value.
| dbms | l.i0 | l.x | l.i1 | q100.1 | q500.1 | q1000.1 |
|---|---|---|---|---|---|---|
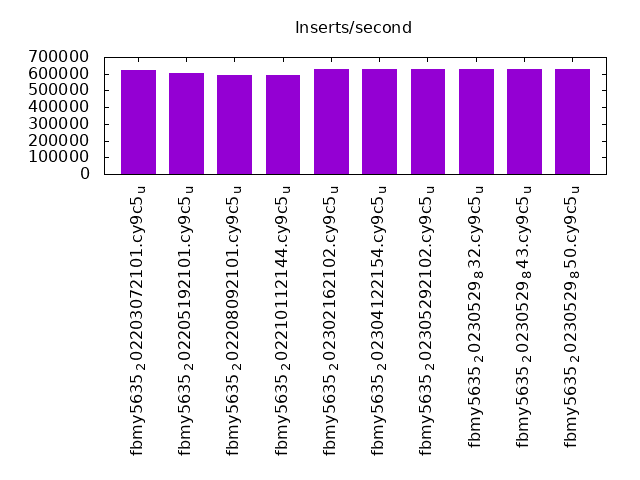
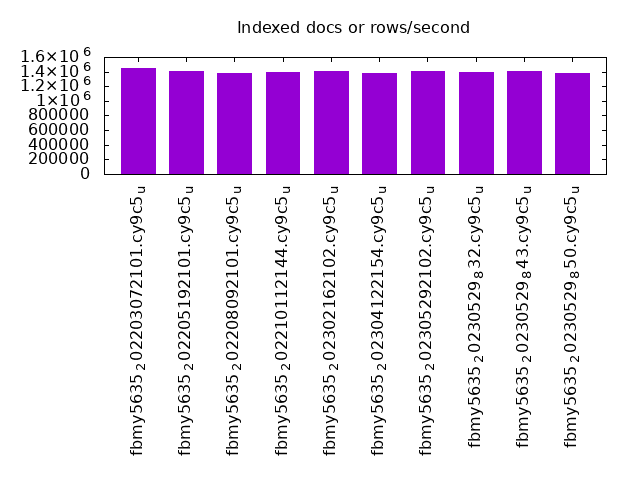
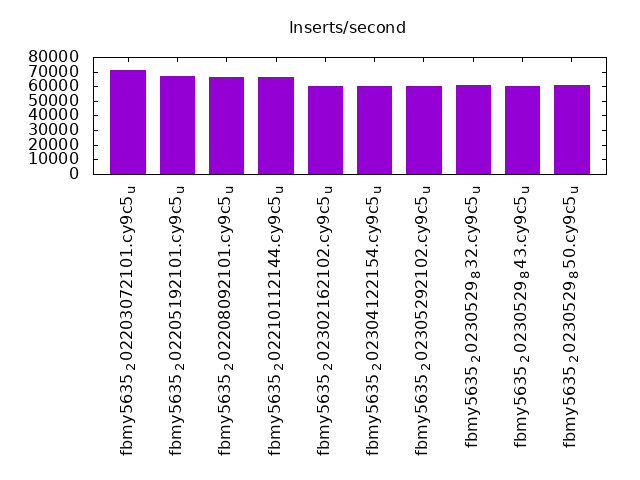
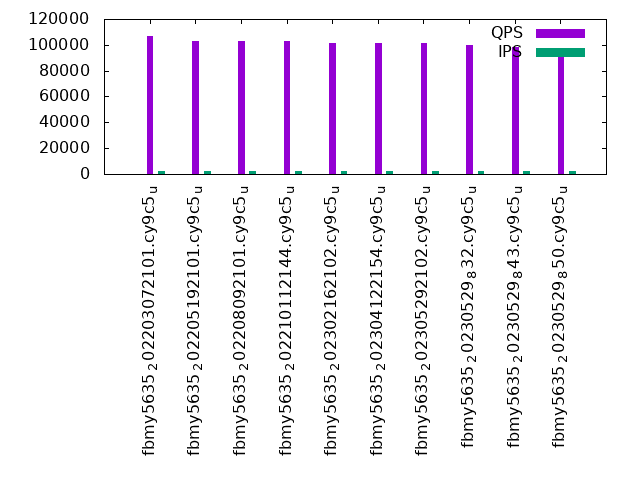
| fbmy5635_202203072101.cy9c5_u | 625000 | 1446084 | 70926 | 106633 | 101783 | 90959 |
| fbmy5635_202205192101.cy9c5_u | 602258 | 1407918 | 67306 | 103226 | 98110 | 86404 |
| fbmy5635_202208092101.cy9c5_u | 594059 | 1383573 | 66611 | 102833 | 96652 | 86802 |
| fbmy5635_202210112144.cy9c5_u | 594796 | 1395640 | 66552 | 102800 | 96915 | 85967 |
| fbmy5635_202302162102.cy9c5_u | 627451 | 1407918 | 60259 | 101254 | 94654 | 86211 |
| fbmy5635_202304122154.cy9c5_u | 629921 | 1387572 | 60150 | 101065 | 95201 | 86087 |
| fbmy5635_202305292102.cy9c5_u | 629096 | 1407918 | 60347 | 101429 | 95174 | 86522 |
| fbmy5635_20230529_832.cy9c5_u | 629096 | 1399708 | 60676 | 99794 | 93432 | 84983 |
| fbmy5635_20230529_843.cy9c5_u | 625815 | 1403801 | 60356 | 98072 | 91130 | 82572 |
| fbmy5635_20230529_850.cy9c5_u | 629096 | 1383573 | 60548 | 97813 | 91815 | 82995 |
This table has relative throughput, throughput for the DBMS relative to the DBMS in the first line, using the absolute throughput from the previous table. Values less than 0.95 have a yellow background. Values greater than 1.05 have a blue background.
| dbms | l.i0 | l.x | l.i1 | q100.1 | q500.1 | q1000.1 |
|---|---|---|---|---|---|---|
| fbmy5635_202203072101.cy9c5_u | 1.00 | 1.00 | 1.00 | 1.00 | 1.00 | 1.00 |
| fbmy5635_202205192101.cy9c5_u | 0.96 | 0.97 | 0.95 | 0.97 | 0.96 | 0.95 |
| fbmy5635_202208092101.cy9c5_u | 0.95 | 0.96 | 0.94 | 0.96 | 0.95 | 0.95 |
| fbmy5635_202210112144.cy9c5_u | 0.95 | 0.97 | 0.94 | 0.96 | 0.95 | 0.95 |
| fbmy5635_202302162102.cy9c5_u | 1.00 | 0.97 | 0.85 | 0.95 | 0.93 | 0.95 |
| fbmy5635_202304122154.cy9c5_u | 1.01 | 0.96 | 0.85 | 0.95 | 0.94 | 0.95 |
| fbmy5635_202305292102.cy9c5_u | 1.01 | 0.97 | 0.85 | 0.95 | 0.94 | 0.95 |
| fbmy5635_20230529_832.cy9c5_u | 1.01 | 0.97 | 0.86 | 0.94 | 0.92 | 0.93 |
| fbmy5635_20230529_843.cy9c5_u | 1.00 | 0.97 | 0.85 | 0.92 | 0.90 | 0.91 |
| fbmy5635_20230529_850.cy9c5_u | 1.01 | 0.96 | 0.85 | 0.92 | 0.90 | 0.91 |
This lists the average rate of inserts/s for the tests that do inserts concurrent with queries. For such tests the query rate is listed in the table above. The read+write tests are setup so that the insert rate should match the target rate every second. Cells that are not at least 95% of the target have a red background to indicate a failure to satisfy the target.
| dbms | q100.1 | q500.1 | q1000.1 |
|---|---|---|---|
| fbmy5635_202203072101.cy9c5_u | 2381 | 11907 | 23834 |
| fbmy5635_202205192101.cy9c5_u | 2381 | 11907 | 23828 |
| fbmy5635_202208092101.cy9c5_u | 2381 | 11907 | 23828 |
| fbmy5635_202210112144.cy9c5_u | 2381 | 11907 | 23821 |
| fbmy5635_202302162102.cy9c5_u | 2381 | 11911 | 23828 |
| fbmy5635_202304122154.cy9c5_u | 2381 | 11907 | 23828 |
| fbmy5635_202305292102.cy9c5_u | 2381 | 11907 | 23828 |
| fbmy5635_20230529_832.cy9c5_u | 2381 | 11907 | 23828 |
| fbmy5635_20230529_843.cy9c5_u | 2381 | 11907 | 23828 |
| fbmy5635_20230529_850.cy9c5_u | 2381 | 11911 | 23828 |
| target | 2400 | 12000 | 24000 |
l.i0
l.i0: load without secondary indexes. Graphs for performance per 1-second interval are here.
Average throughput:
Insert response time histogram: each cell has the percentage of responses that take <= the time in the header and max is the max response time in seconds. For the max column values in the top 25% of the range have a red background and in the bottom 25% of the range have a green background. The red background is not used when the min value is within 80% of the max value.
| dbms | 256us | 1ms | 4ms | 16ms | 64ms | 256ms | 1s | 4s | 16s | gt | max |
|---|---|---|---|---|---|---|---|---|---|---|---|
| fbmy5635_202203072101.cy9c5_u | 0.279 | 76.342 | 23.337 | nonzero | 0.042 | 0.095 | |||||
| fbmy5635_202205192101.cy9c5_u | 0.228 | 67.543 | 32.187 | nonzero | 0.041 | 0.101 | |||||
| fbmy5635_202208092101.cy9c5_u | 0.256 | 65.290 | 34.411 | 0.001 | 0.041 | 0.118 | |||||
| fbmy5635_202210112144.cy9c5_u | 0.232 | 65.459 | 34.268 | nonzero | 0.041 | 0.097 | |||||
| fbmy5635_202302162102.cy9c5_u | 0.182 | 77.188 | 22.589 | 0.042 | 0.107 | ||||||
| fbmy5635_202304122154.cy9c5_u | 0.197 | 76.798 | 22.962 | nonzero | 0.042 | 0.100 | |||||
| fbmy5635_202305292102.cy9c5_u | 0.159 | 78.167 | 21.632 | 0.042 | 0.097 | ||||||
| fbmy5635_20230529_832.cy9c5_u | 0.147 | 77.442 | 22.369 | 0.042 | 0.093 | ||||||
| fbmy5635_20230529_843.cy9c5_u | 0.131 | 76.359 | 23.468 | nonzero | 0.042 | 0.093 | |||||
| fbmy5635_20230529_850.cy9c5_u | 0.116 | 78.095 | 21.747 | nonzero | 0.042 | 0.105 |
Performance metrics for the DBMS listed above. Some are normalized by throughput, others are not. Legend for results is here.
ips	qps	rps	rmbps	wps	wmbps	rpq	rkbpq	wpi	wkbpi	csps	cpups	cspq	cpupq	dbgb1	dbgb2	rss	maxop	p50	p99	tag
625000	0	0	0.0	2581.0	308.5	0.000	0.000	0.004	0.505	520990	40.6	0.834	52	15.4	16.6	5.0	0.095	26773	17882	480m.fbmy5635_202203072101.cy9c5_u
602258	0	0	0.0	2462.1	295.3	0.000	0.000	0.004	0.502	551306	40.9	0.915	54	15.5	16.7	5.0	0.101	25474	18981	480m.fbmy5635_202205192101.cy9c5_u
594059	0	0	0.0	2440.1	293.6	0.000	0.000	0.004	0.506	542619	40.4	0.913	54	15.5	16.7	5.1	0.118	25375	18182	480m.fbmy5635_202208092101.cy9c5_u
594796	0	0	0.0	2445.1	294.0	0.000	0.000	0.004	0.506	538647	40.8	0.906	55	15.5	16.6	5.1	0.097	25674	15795	480m.fbmy5635_202210112144.cy9c5_u
627451	0	0	0.0	2166.0	260.5	0.000	0.000	0.003	0.425	304374	36.7	0.485	47	15.1	16.2	4.1	0.107	26973	20979	480m.fbmy5635_202302162102.cy9c5_u
629921	0	0	0.0	2134.4	256.8	0.000	0.000	0.003	0.418	273976	36.0	0.435	46	15.1	16.2	4.0	0.100	26773	21578	480m.fbmy5635_202304122154.cy9c5_u
629096	0	0	0.0	2100.9	252.8	0.000	0.000	0.003	0.412	272469	35.9	0.433	46	15.1	16.3	4.0	0.097	26970	19081	480m.fbmy5635_202305292102.cy9c5_u
629096	0	0	0.0	2146.3	257.8	0.000	0.000	0.003	0.420	320495	38.7	0.509	49	15.2	16.4	4.0	0.093	26973	21678	480m.fbmy5635_20230529_832.cy9c5_u
625815	0	0	0.0	2120.7	254.4	0.000	0.000	0.003	0.416	309669	39.0	0.495	50	15.3	16.4	4.0	0.093	26873	20380	480m.fbmy5635_20230529_843.cy9c5_u
629096	0	0	0.0	2173.5	261.2	0.000	0.000	0.003	0.425	297238	38.5	0.472	49	15.1	16.3	4.1	0.105	27173	21878	480m.fbmy5635_20230529_850.cy9c5_u
l.x
l.x: create secondary indexes.
Average throughput:
Performance metrics for the DBMS listed above. Some are normalized by throughput, others are not. Legend for results is here.
ips	qps	rps	rmbps	wps	wmbps	rpq	rkbpq	wpi	wkbpi	csps	cpups	cspq	cpupq	dbgb1	dbgb2	rss	maxop	p50	p99	tag
1446084	0	30	0.2	1915.0	209.8	0.000	0.000	0.001	0.149	35049	29.3	0.024	16	32.4	33.5	44.8	0.002	NA	NA	480m.fbmy5635_202203072101.cy9c5_u
1407918	0	29	0.2	1882.2	205.7	0.000	0.000	0.001	0.150	33551	28.9	0.024	16	32.4	33.5	42.4	0.003	NA	NA	480m.fbmy5635_202205192101.cy9c5_u
1383573	0	29	0.2	1866.3	203.9	0.000	0.000	0.001	0.151	34248	28.7	0.025	17	32.4	33.5	44.2	0.002	NA	NA	480m.fbmy5635_202208092101.cy9c5_u
1395640	0	29	0.2	1864.7	204.6	0.000	0.000	0.001	0.150	32308	27.7	0.023	16	32.4	33.5	44.3	0.003	NA	NA	480m.fbmy5635_202210112144.cy9c5_u
1407918	0	29	0.2	1780.7	194.2	0.000	0.000	0.001	0.141	32061	27.9	0.023	16	32.4	33.5	40.3	0.003	NA	NA	480m.fbmy5635_202302162102.cy9c5_u
1387572	0	29	0.2	1754.9	191.4	0.000	0.000	0.001	0.141	33748	28.5	0.024	16	32.4	33.5	40.1	0.002	NA	NA	480m.fbmy5635_202304122154.cy9c5_u
1407918	0	29	0.2	1782.2	194.3	0.000	0.000	0.001	0.141	32810	28.1	0.023	16	32.4	33.5	39.8	0.003	NA	NA	480m.fbmy5635_202305292102.cy9c5_u
1399708	0	29	0.2	1757.5	191.6	0.000	0.000	0.001	0.140	35248	29.0	0.025	17	32.4	33.5	40.1	0.003	NA	NA	480m.fbmy5635_20230529_832.cy9c5_u
1403801	0	29	0.2	1799.5	196.6	0.000	0.000	0.001	0.143	33235	28.8	0.024	16	32.3	33.4	41.3	0.002	NA	NA	480m.fbmy5635_20230529_843.cy9c5_u
1383573	0	29	0.2	1757.0	191.4	0.000	0.000	0.001	0.142	33042	29.4	0.024	17	32.3	33.5	38.6	0.003	NA	NA	480m.fbmy5635_20230529_850.cy9c5_u
l.i1
l.i1: continue load after secondary indexes created. Graphs for performance per 1-second interval are here.
Average throughput:
Insert response time histogram: each cell has the percentage of responses that take <= the time in the header and max is the max response time in seconds. For the max column values in the top 25% of the range have a red background and in the bottom 25% of the range have a green background. The red background is not used when the min value is within 80% of the max value.
| dbms | 256us | 1ms | 4ms | 16ms | 64ms | 256ms | 1s | 4s | 16s | gt | max |
|---|---|---|---|---|---|---|---|---|---|---|---|
| fbmy5635_202203072101.cy9c5_u | nonzero | 0.048 | 32.060 | 67.891 | 0.001 | 0.104 | |||||
| fbmy5635_202205192101.cy9c5_u | nonzero | 0.040 | 24.119 | 75.836 | 0.004 | 0.139 | |||||
| fbmy5635_202208092101.cy9c5_u | 0.036 | 22.820 | 77.140 | 0.004 | 0.144 | ||||||
| fbmy5635_202210112144.cy9c5_u | 0.040 | 22.756 | 77.202 | 0.003 | 0.177 | ||||||
| fbmy5635_202302162102.cy9c5_u | 0.030 | 12.275 | 87.693 | 0.003 | 0.163 | ||||||
| fbmy5635_202304122154.cy9c5_u | 0.025 | 12.047 | 87.924 | 0.003 | 0.152 | ||||||
| fbmy5635_202305292102.cy9c5_u | 0.029 | 12.452 | 87.515 | 0.004 | 0.171 | ||||||
| fbmy5635_20230529_832.cy9c5_u | 0.032 | 13.465 | 86.498 | 0.005 | 0.198 | ||||||
| fbmy5635_20230529_843.cy9c5_u | 0.029 | 12.799 | 87.168 | 0.005 | 0.171 | ||||||
| fbmy5635_20230529_850.cy9c5_u | 0.028 | 13.054 | 86.915 | 0.004 | 0.147 |
Delete response time histogram: each cell has the percentage of responses that take <= the time in the header and max is the max response time in seconds. For the max column values in the top 25% of the range have a red background and in the bottom 25% of the range have a green background. The red background is not used when the min value is within 80% of the max value.
| dbms | 256us | 1ms | 4ms | 16ms | 64ms | 256ms | 1s | 4s | 16s | gt | max |
|---|---|---|---|---|---|---|---|---|---|---|---|
| fbmy5635_202203072101.cy9c5_u | 0.001 | 0.048 | 37.092 | 62.858 | 0.002 | nonzero | 0.288 | ||||
| fbmy5635_202205192101.cy9c5_u | nonzero | 0.040 | 27.384 | 72.570 | 0.005 | 0.163 | |||||
| fbmy5635_202208092101.cy9c5_u | 0.002 | 0.036 | 25.701 | 74.257 | 0.004 | nonzero | 0.271 | ||||
| fbmy5635_202210112144.cy9c5_u | nonzero | 0.040 | 25.760 | 74.196 | 0.003 | nonzero | 0.305 | ||||
| fbmy5635_202302162102.cy9c5_u | nonzero | 0.030 | 13.847 | 86.121 | 0.003 | 0.191 | |||||
| fbmy5635_202304122154.cy9c5_u | nonzero | 0.026 | 13.549 | 86.421 | 0.004 | 0.184 | |||||
| fbmy5635_202305292102.cy9c5_u | nonzero | 0.029 | 14.001 | 85.965 | 0.004 | 0.187 | |||||
| fbmy5635_20230529_832.cy9c5_u | nonzero | 0.033 | 15.184 | 84.777 | 0.006 | nonzero | 0.283 | ||||
| fbmy5635_20230529_843.cy9c5_u | nonzero | 0.029 | 14.428 | 85.537 | 0.005 | 0.197 | |||||
| fbmy5635_20230529_850.cy9c5_u | nonzero | 0.029 | 14.662 | 85.305 | 0.004 | 0.206 |
Performance metrics for the DBMS listed above. Some are normalized by throughput, others are not. Legend for results is here.
ips	qps	rps	rmbps	wps	wmbps	rpq	rkbpq	wpi	wkbpi	csps	cpups	cspq	cpupq	dbgb1	dbgb2	rss	maxop	p50	p99	tag
70926	0	111	1.3	1941.7	232.5	0.002	0.019	0.027	3.357	144995	16.4	2.044	185	37.6	37.7	177.0	0.104	2947	2647	480m.fbmy5635_202203072101.cy9c5_u
67306	0	78	1.0	1840.4	220.8	0.001	0.016	0.027	3.359	138867	16.6	2.063	197	40.2	40.2	176.9	0.139	2797	2498	480m.fbmy5635_202205192101.cy9c5_u
66611	0	85	1.1	1833.1	219.3	0.001	0.016	0.028	3.372	137389	16.6	2.063	199	39.7	39.8	177.0	0.144	2797	2497	480m.fbmy5635_202208092101.cy9c5_u
66552	0	87	1.1	1822.9	217.6	0.001	0.017	0.027	3.348	137200	16.5	2.062	198	37.5	37.6	177.1	0.177	2797	2497	480m.fbmy5635_202210112144.cy9c5_u
60259	0	47	0.9	1479.3	174.8	0.001	0.015	0.025	2.971	120418	15.4	1.998	204	39.8	39.9	177.2	0.163	2547	2248	480m.fbmy5635_202302162102.cy9c5_u
60150	0	49	0.9	1478.4	173.8	0.001	0.015	0.025	2.959	119609	15.4	1.989	205	38.1	38.2	177.3	0.152	2498	2247	480m.fbmy5635_202304122154.cy9c5_u
60347	0	49	0.9	1476.6	174.3	0.001	0.015	0.024	2.958	120209	15.7	1.992	208	40.1	40.2	177.2	0.171	2547	2248	480m.fbmy5635_202305292102.cy9c5_u
60676	0	51	0.9	1479.6	175.9	0.001	0.015	0.024	2.969	121536	16.5	2.003	218	37.9	38.1	177.2	0.198	2547	2248	480m.fbmy5635_20230529_832.cy9c5_u
60356	0	59	0.9	1460.0	171.7	0.001	0.016	0.024	2.913	117643	16.7	1.949	221	37.9	38.0	177.2	0.171	2547	2247	480m.fbmy5635_20230529_843.cy9c5_u
60548	0	61	0.9	1474.2	174.8	0.001	0.016	0.024	2.956	113997	16.5	1.883	218	40.3	40.4	177.3	0.147	2547	2248	480m.fbmy5635_20230529_850.cy9c5_u
q100.1
q100.1: range queries with 100 insert/s per client. Graphs for performance per 1-second interval are here.
Average throughput:
Query response time histogram: each cell has the percentage of responses that take <= the time in the header and max is the max response time in seconds. For max values in the top 25% of the range have a red background and in the bottom 25% of the range have a green background. The red background is not used when the min value is within 80% of the max value.
| dbms | 256us | 1ms | 4ms | 16ms | 64ms | 256ms | 1s | 4s | 16s | gt | max |
|---|---|---|---|---|---|---|---|---|---|---|---|
| fbmy5635_202203072101.cy9c5_u | 84.258 | 15.741 | 0.001 | nonzero | nonzero | 0.026 | |||||
| fbmy5635_202205192101.cy9c5_u | 79.305 | 20.694 | 0.001 | nonzero | nonzero | 0.057 | |||||
| fbmy5635_202208092101.cy9c5_u | 79.004 | 20.995 | 0.001 | nonzero | nonzero | 0.060 | |||||
| fbmy5635_202210112144.cy9c5_u | 78.872 | 21.127 | 0.001 | nonzero | 0.010 | ||||||
| fbmy5635_202302162102.cy9c5_u | 76.073 | 23.926 | 0.001 | nonzero | nonzero | 0.060 | |||||
| fbmy5635_202304122154.cy9c5_u | 75.822 | 24.177 | 0.001 | nonzero | 0.009 | ||||||
| fbmy5635_202305292102.cy9c5_u | 76.491 | 23.508 | 0.001 | nonzero | nonzero | 0.054 | |||||
| fbmy5635_20230529_832.cy9c5_u | 73.948 | 26.051 | 0.001 | nonzero | nonzero | 0.025 | |||||
| fbmy5635_20230529_843.cy9c5_u | 71.108 | 28.890 | 0.001 | nonzero | nonzero | nonzero | 0.086 | ||||
| fbmy5635_20230529_850.cy9c5_u | 70.633 | 29.366 | 0.001 | nonzero | nonzero | nonzero | 0.065 |
Insert response time histogram: each cell has the percentage of responses that take <= the time in the header and max is the max response time in seconds. For max values in the top 25% of the range have a red background and in the bottom 25% of the range have a green background. The red background is not used when the min value is within 80% of the max value.
| dbms | 256us | 1ms | 4ms | 16ms | 64ms | 256ms | 1s | 4s | 16s | gt | max |
|---|---|---|---|---|---|---|---|---|---|---|---|
| fbmy5635_202203072101.cy9c5_u | 99.997 | 0.003 | 0.006 | ||||||||
| fbmy5635_202205192101.cy9c5_u | 99.992 | 0.008 | 0.009 | ||||||||
| fbmy5635_202208092101.cy9c5_u | 99.996 | 0.004 | 0.006 | ||||||||
| fbmy5635_202210112144.cy9c5_u | 99.997 | 0.003 | 0.008 | ||||||||
| fbmy5635_202302162102.cy9c5_u | 99.862 | 0.138 | 0.006 | ||||||||
| fbmy5635_202304122154.cy9c5_u | 99.175 | 0.825 | 0.008 | ||||||||
| fbmy5635_202305292102.cy9c5_u | 99.970 | 0.027 | 0.003 | 0.060 | |||||||
| fbmy5635_20230529_832.cy9c5_u | 99.988 | 0.012 | 0.007 | ||||||||
| fbmy5635_20230529_843.cy9c5_u | 95.807 | 4.193 | 0.009 | ||||||||
| fbmy5635_20230529_850.cy9c5_u | 99.885 | 0.115 | 0.008 |
Delete response time histogram: each cell has the percentage of responses that take <= the time in the header and max is the max response time in seconds. For max values in the top 25% of the range have a red background and in the bottom 25% of the range have a green background. The red background is not used when the min value is within 80% of the max value.
| dbms | 256us | 1ms | 4ms | 16ms | 64ms | 256ms | 1s | 4s | 16s | gt | max |
|---|---|---|---|---|---|---|---|---|---|---|---|
| fbmy5635_202203072101.cy9c5_u | 0.126 | 99.867 | 0.004 | 0.003 | 0.001 | 0.066 | |||||
| fbmy5635_202205192101.cy9c5_u | 0.005 | 99.986 | 0.006 | 0.003 | 0.058 | ||||||
| fbmy5635_202208092101.cy9c5_u | 0.002 | 99.990 | 0.004 | 0.004 | 0.042 | ||||||
| fbmy5635_202210112144.cy9c5_u | 0.003 | 99.992 | 0.003 | 0.001 | 0.001 | 0.066 | |||||
| fbmy5635_202302162102.cy9c5_u | 0.002 | 99.945 | 0.051 | 0.002 | 0.056 | ||||||
| fbmy5635_202304122154.cy9c5_u | 0.002 | 99.482 | 0.514 | 0.002 | 0.001 | 0.073 | |||||
| fbmy5635_202305292102.cy9c5_u | 99.973 | 0.021 | 0.006 | 0.061 | |||||||
| fbmy5635_20230529_832.cy9c5_u | 99.994 | 0.006 | 0.001 | 0.047 | |||||||
| fbmy5635_20230529_843.cy9c5_u | 0.001 | 97.117 | 2.879 | 0.002 | 0.054 | ||||||
| fbmy5635_20230529_850.cy9c5_u | 99.956 | 0.042 | 0.002 | 0.058 |
Performance metrics for the DBMS listed above. Some are normalized by throughput, others are not. Legend for results is here.
ips	qps	rps	rmbps	wps	wmbps	rpq	rkbpq	wpi	wkbpi	csps	cpups	cspq	cpupq	dbgb1	dbgb2	rss	maxop	p50	p99	tag
2381	106633	8	0.1	98.7	11.2	0.000	0.001	0.041	4.831	485280	31.7	4.551	238	35.9	37.8	178.3	0.026	4444	3900	480m.fbmy5635_202203072101.cy9c5_u
2381	103226	7	0.1	100.0	11.4	0.000	0.001	0.042	4.903	473926	31.7	4.591	246	35.9	37.8	178.3	0.057	4332	3773	480m.fbmy5635_202205192101.cy9c5_u
2381	102833	5	0.1	97.5	10.9	0.000	0.001	0.041	4.669	465531	31.7	4.527	247	36.0	37.9	178.3	0.060	4332	3788	480m.fbmy5635_202208092101.cy9c5_u
2381	102800	5	0.1	97.1	10.8	0.000	0.001	0.041	4.640	465340	31.7	4.527	247	36.0	37.9	178.2	0.010	4284	3788	480m.fbmy5635_202210112144.cy9c5_u
2381	101254	16	0.4	78.3	8.7	0.000	0.004	0.033	3.728	450915	31.7	4.453	250	37.1	39.0	178.6	0.060	4252	3756	480m.fbmy5635_202302162102.cy9c5_u
2381	101065	15	0.3	80.5	9.0	0.000	0.003	0.034	3.851	450095	31.8	4.454	252	37.2	39.1	178.7	0.009	4236	3756	480m.fbmy5635_202304122154.cy9c5_u
2381	101429	12	0.3	81.0	9.0	0.000	0.003	0.034	3.873	454795	31.7	4.484	250	37.1	39.1	178.6	0.054	4268	3757	480m.fbmy5635_202305292102.cy9c5_u
2381	99794	12	0.3	79.7	8.9	0.000	0.003	0.033	3.807	446468	32.3	4.474	259	37.1	39.1	178.6	0.025	4172	3708	480m.fbmy5635_20230529_832.cy9c5_u
2381	98072	15	0.4	80.2	8.9	0.000	0.004	0.034	3.833	436893	32.2	4.455	263	37.1	39.0	178.7	0.086	4123	3628	480m.fbmy5635_20230529_843.cy9c5_u
2381	97813	41	0.4	76.7	8.5	0.000	0.004	0.032	3.641	435657	32.2	4.454	263	37.1	39.1	178.7	0.065	4092	3612	480m.fbmy5635_20230529_850.cy9c5_u
q500.1
q500.1: range queries with 500 insert/s per client. Graphs for performance per 1-second interval are here.
Average throughput:
Query response time histogram: each cell has the percentage of responses that take <= the time in the header and max is the max response time in seconds. For max values in the top 25% of the range have a red background and in the bottom 25% of the range have a green background. The red background is not used when the min value is within 80% of the max value.
| dbms | 256us | 1ms | 4ms | 16ms | 64ms | 256ms | 1s | 4s | 16s | gt | max |
|---|---|---|---|---|---|---|---|---|---|---|---|
| fbmy5635_202203072101.cy9c5_u | 77.742 | 22.256 | 0.001 | nonzero | nonzero | nonzero | 0.080 | ||||
| fbmy5635_202205192101.cy9c5_u | 71.078 | 28.920 | 0.002 | nonzero | nonzero | nonzero | 0.082 | ||||
| fbmy5635_202208092101.cy9c5_u | 68.751 | 31.247 | 0.001 | nonzero | nonzero | nonzero | 0.084 | ||||
| fbmy5635_202210112144.cy9c5_u | 69.110 | 30.888 | 0.001 | nonzero | nonzero | nonzero | 0.083 | ||||
| fbmy5635_202302162102.cy9c5_u | 64.436 | 35.561 | 0.002 | nonzero | nonzero | nonzero | 0.097 | ||||
| fbmy5635_202304122154.cy9c5_u | 65.732 | 34.266 | 0.002 | nonzero | nonzero | nonzero | 0.079 | ||||
| fbmy5635_202305292102.cy9c5_u | 65.628 | 34.369 | 0.002 | nonzero | nonzero | nonzero | 0.083 | ||||
| fbmy5635_20230529_832.cy9c5_u | 62.240 | 37.757 | 0.002 | nonzero | nonzero | nonzero | 0.084 | ||||
| fbmy5635_20230529_843.cy9c5_u | 57.558 | 42.438 | 0.003 | nonzero | nonzero | nonzero | 0.086 | ||||
| fbmy5635_20230529_850.cy9c5_u | 58.980 | 41.018 | 0.002 | nonzero | nonzero | nonzero | 0.089 |
Insert response time histogram: each cell has the percentage of responses that take <= the time in the header and max is the max response time in seconds. For max values in the top 25% of the range have a red background and in the bottom 25% of the range have a green background. The red background is not used when the min value is within 80% of the max value.
| dbms | 256us | 1ms | 4ms | 16ms | 64ms | 256ms | 1s | 4s | 16s | gt | max |
|---|---|---|---|---|---|---|---|---|---|---|---|
| fbmy5635_202203072101.cy9c5_u | 99.519 | 0.478 | 0.002 | 0.001 | 0.079 | ||||||
| fbmy5635_202205192101.cy9c5_u | 99.915 | 0.082 | 0.002 | 0.001 | 0.079 | ||||||
| fbmy5635_202208092101.cy9c5_u | 99.501 | 0.494 | 0.004 | 0.001 | 0.083 | ||||||
| fbmy5635_202210112144.cy9c5_u | 99.103 | 0.894 | 0.001 | 0.001 | 0.082 | ||||||
| fbmy5635_202302162102.cy9c5_u | 17.532 | 49.696 | 32.769 | 0.004 | 0.099 | ||||||
| fbmy5635_202304122154.cy9c5_u | 29.388 | 69.977 | 0.634 | 0.001 | 0.083 | ||||||
| fbmy5635_202305292102.cy9c5_u | 25.919 | 62.280 | 11.800 | 0.002 | 0.092 | ||||||
| fbmy5635_20230529_832.cy9c5_u | 23.429 | 72.725 | 3.846 | 0.001 | 0.093 | ||||||
| fbmy5635_20230529_843.cy9c5_u | 20.928 | 49.853 | 29.217 | 0.002 | 0.093 | ||||||
| fbmy5635_20230529_850.cy9c5_u | 52.711 | 47.268 | 0.020 | 0.002 | 0.091 |
Delete response time histogram: each cell has the percentage of responses that take <= the time in the header and max is the max response time in seconds. For max values in the top 25% of the range have a red background and in the bottom 25% of the range have a green background. The red background is not used when the min value is within 80% of the max value.
| dbms | 256us | 1ms | 4ms | 16ms | 64ms | 256ms | 1s | 4s | 16s | gt | max |
|---|---|---|---|---|---|---|---|---|---|---|---|
| fbmy5635_202203072101.cy9c5_u | 0.064 | 99.676 | 0.249 | 0.009 | 0.002 | 0.089 | |||||
| fbmy5635_202205192101.cy9c5_u | 0.002 | 99.930 | 0.055 | 0.010 | 0.003 | 0.100 | |||||
| fbmy5635_202208092101.cy9c5_u | 0.001 | 99.658 | 0.327 | 0.012 | 0.002 | 0.089 | |||||
| fbmy5635_202210112144.cy9c5_u | 0.001 | 99.332 | 0.655 | 0.010 | 0.003 | 0.096 | |||||
| fbmy5635_202302162102.cy9c5_u | nonzero | 18.561 | 50.815 | 30.616 | 0.007 | 0.099 | |||||
| fbmy5635_202304122154.cy9c5_u | 33.314 | 66.131 | 0.552 | 0.003 | 0.094 | ||||||
| fbmy5635_202305292102.cy9c5_u | 27.526 | 61.794 | 10.677 | 0.003 | 0.089 | ||||||
| fbmy5635_20230529_832.cy9c5_u | 25.632 | 70.974 | 3.392 | 0.003 | 0.095 | ||||||
| fbmy5635_20230529_843.cy9c5_u | 21.880 | 50.977 | 27.138 | 0.005 | 0.101 | ||||||
| fbmy5635_20230529_850.cy9c5_u | 57.657 | 42.313 | 0.028 | 0.002 | 0.091 |
Performance metrics for the DBMS listed above. Some are normalized by throughput, others are not. Legend for results is here.
ips	qps	rps	rmbps	wps	wmbps	rpq	rkbpq	wpi	wkbpi	csps	cpups	cspq	cpupq	dbgb1	dbgb2	rss	maxop	p50	p99	tag
11907	101783	32	0.3	380.4	44.7	0.000	0.003	0.032	3.844	476828	33.3	4.685	262	36.1	37.2	183.5	0.080	4268	3692	480m.fbmy5635_202203072101.cy9c5_u
11907	98110	26	0.3	376.1	44.2	0.000	0.003	0.032	3.803	464842	33.4	4.738	272	36.2	37.4	183.3	0.082	4108	3534	480m.fbmy5635_202205192101.cy9c5_u
11907	96652	24	0.3	374.4	43.6	0.000	0.003	0.031	3.751	452705	33.5	4.684	277	36.5	37.6	183.4	0.084	3996	3421	480m.fbmy5635_202208092101.cy9c5_u
11907	96915	25	0.3	381.6	44.6	0.000	0.003	0.032	3.835	454727	33.6	4.692	277	36.3	37.4	183.4	0.083	4060	3532	480m.fbmy5635_202210112144.cy9c5_u
11911	94654	15	0.2	330.9	38.5	0.000	0.002	0.028	3.311	440685	33.9	4.656	287	37.3	38.4	183.1	0.097	3951	3389	480m.fbmy5635_202302162102.cy9c5_u
11907	95201	13	0.2	328.5	38.2	0.000	0.002	0.028	3.286	440034	33.7	4.622	283	37.6	38.8	183.1	0.079	3996	3421	480m.fbmy5635_202304122154.cy9c5_u
11907	95174	15	0.2	329.6	38.4	0.000	0.002	0.028	3.298	444161	33.9	4.667	285	37.5	38.7	183.2	0.083	3996	3453	480m.fbmy5635_202305292102.cy9c5_u
11907	93432	16	0.3	324.1	37.6	0.000	0.003	0.027	3.235	435582	34.5	4.662	295	37.2	38.5	183.1	0.084	3916	3357	480m.fbmy5635_20230529_832.cy9c5_u
11907	91130	12	0.2	327.4	37.9	0.000	0.002	0.027	3.259	424299	34.5	4.656	303	37.5	38.7	183.0	0.086	3820	3229	480m.fbmy5635_20230529_843.cy9c5_u
11911	91815	58	0.3	322.0	37.3	0.001	0.003	0.027	3.211	423559	34.2	4.613	298	37.4	38.6	183.0	0.089	3836	3277	480m.fbmy5635_20230529_850.cy9c5_u
q1000.1
q1000.1: range queries with 1000 insert/s per client. Graphs for performance per 1-second interval are here.
Average throughput:
Query response time histogram: each cell has the percentage of responses that take <= the time in the header and max is the max response time in seconds. For max values in the top 25% of the range have a red background and in the bottom 25% of the range have a green background. The red background is not used when the min value is within 80% of the max value.
| dbms | 256us | 1ms | 4ms | 16ms | 64ms | 256ms | 1s | 4s | 16s | gt | max |
|---|---|---|---|---|---|---|---|---|---|---|---|
| fbmy5635_202203072101.cy9c5_u | 56.838 | 43.157 | 0.005 | nonzero | nonzero | nonzero | 0.079 | ||||
| fbmy5635_202205192101.cy9c5_u | 46.547 | 53.444 | 0.009 | nonzero | nonzero | nonzero | 0.129 | ||||
| fbmy5635_202208092101.cy9c5_u | 47.489 | 52.507 | 0.005 | nonzero | nonzero | nonzero | 0.083 | ||||
| fbmy5635_202210112144.cy9c5_u | 45.682 | 54.311 | 0.007 | nonzero | nonzero | nonzero | 0.077 | ||||
| fbmy5635_202302162102.cy9c5_u | 46.086 | 53.903 | 0.011 | nonzero | nonzero | nonzero | 0.106 | ||||
| fbmy5635_202304122154.cy9c5_u | 45.895 | 54.095 | 0.010 | nonzero | nonzero | nonzero | 0.094 | ||||
| fbmy5635_202305292102.cy9c5_u | 46.818 | 53.170 | 0.011 | nonzero | nonzero | nonzero | 0.105 | ||||
| fbmy5635_20230529_832.cy9c5_u | 43.415 | 56.574 | 0.012 | nonzero | nonzero | nonzero | 0.076 | ||||
| fbmy5635_20230529_843.cy9c5_u | 37.737 | 62.248 | 0.014 | nonzero | nonzero | nonzero | 0.080 | ||||
| fbmy5635_20230529_850.cy9c5_u | 38.585 | 61.402 | 0.013 | nonzero | nonzero | nonzero | 0.136 |
Insert response time histogram: each cell has the percentage of responses that take <= the time in the header and max is the max response time in seconds. For max values in the top 25% of the range have a red background and in the bottom 25% of the range have a green background. The red background is not used when the min value is within 80% of the max value.
| dbms | 256us | 1ms | 4ms | 16ms | 64ms | 256ms | 1s | 4s | 16s | gt | max |
|---|---|---|---|---|---|---|---|---|---|---|---|
| fbmy5635_202203072101.cy9c5_u | 20.888 | 77.942 | 1.169 | 0.001 | 0.092 | ||||||
| fbmy5635_202205192101.cy9c5_u | 18.497 | 40.120 | 41.383 | 0.059 | |||||||
| fbmy5635_202208092101.cy9c5_u | 16.732 | 83.238 | 0.031 | 0.035 | |||||||
| fbmy5635_202210112144.cy9c5_u | 19.120 | 40.549 | 40.330 | nonzero | 0.087 | ||||||
| fbmy5635_202302162102.cy9c5_u | 2.066 | 12.503 | 85.428 | 0.002 | 0.106 | ||||||
| fbmy5635_202304122154.cy9c5_u | 2.053 | 16.031 | 81.910 | 0.005 | 0.128 | ||||||
| fbmy5635_202305292102.cy9c5_u | 1.392 | 9.775 | 88.827 | 0.005 | 0.111 | ||||||
| fbmy5635_20230529_832.cy9c5_u | 3.074 | 16.331 | 80.591 | 0.003 | 0.100 | ||||||
| fbmy5635_20230529_843.cy9c5_u | 1.960 | 13.596 | 84.441 | 0.003 | 0.106 | ||||||
| fbmy5635_20230529_850.cy9c5_u | 2.836 | 12.900 | 84.259 | 0.005 | 0.102 |
Delete response time histogram: each cell has the percentage of responses that take <= the time in the header and max is the max response time in seconds. For max values in the top 25% of the range have a red background and in the bottom 25% of the range have a green background. The red background is not used when the min value is within 80% of the max value.
| dbms | 256us | 1ms | 4ms | 16ms | 64ms | 256ms | 1s | 4s | 16s | gt | max |
|---|---|---|---|---|---|---|---|---|---|---|---|
| fbmy5635_202203072101.cy9c5_u | 0.003 | 23.010 | 75.890 | 1.095 | 0.002 | 0.143 | |||||
| fbmy5635_202205192101.cy9c5_u | nonzero | 18.695 | 40.642 | 40.661 | 0.001 | 0.100 | |||||
| fbmy5635_202208092101.cy9c5_u | 17.597 | 82.367 | 0.034 | 0.002 | 0.097 | ||||||
| fbmy5635_202210112144.cy9c5_u | 19.619 | 40.805 | 39.575 | 0.001 | 0.105 | ||||||
| fbmy5635_202302162102.cy9c5_u | 2.084 | 13.622 | 84.290 | 0.004 | 0.106 | ||||||
| fbmy5635_202304122154.cy9c5_u | 2.061 | 17.225 | 80.708 | 0.006 | nonzero | 0.281 | |||||
| fbmy5635_202305292102.cy9c5_u | 1.370 | 10.751 | 87.872 | 0.006 | 0.111 | ||||||
| fbmy5635_20230529_832.cy9c5_u | 3.040 | 17.556 | 79.400 | 0.004 | 0.110 | ||||||
| fbmy5635_20230529_843.cy9c5_u | 1.965 | 14.838 | 83.193 | 0.004 | 0.132 | ||||||
| fbmy5635_20230529_850.cy9c5_u | 2.783 | 14.134 | 83.077 | 0.006 | nonzero | 0.275 |
Performance metrics for the DBMS listed above. Some are normalized by throughput, others are not. Legend for results is here.
ips	qps	rps	rmbps	wps	wmbps	rpq	rkbpq	wpi	wkbpi	csps	cpups	cspq	cpupq	dbgb1	dbgb2	rss	maxop	p50	p99	tag
23834	90959	59	0.6	688.0	80.1	0.001	0.006	0.029	3.443	464525	35.9	5.107	316	37.5	39.1	185.1	0.079	3804	3229	480m.fbmy5635_202203072101.cy9c5_u
23828	86404	54	0.4	676.8	78.8	0.001	0.005	0.028	3.388	452604	36.5	5.238	338	37.9	39.6	185.2	0.129	3596	3053	480m.fbmy5635_202205192101.cy9c5_u
23828	86802	94	0.7	687.2	80.2	0.001	0.008	0.029	3.447	442854	36.2	5.102	334	37.9	39.5	185.2	0.083	3612	3069	480m.fbmy5635_202208092101.cy9c5_u
23821	85967	61	0.5	677.3	78.8	0.001	0.006	0.028	3.388	443432	36.5	5.158	340	38.2	39.9	185.2	0.077	3596	3037	480m.fbmy5635_202210112144.cy9c5_u
23828	86211	33	0.4	603.5	70.1	0.000	0.005	0.025	3.014	430150	37.0	4.990	343	38.9	40.6	185.0	0.106	3580	2973	480m.fbmy5635_202302162102.cy9c5_u
23828	86087	38	0.5	609.2	71.3	0.000	0.006	0.026	3.065	428360	37.1	4.976	345	38.3	39.9	185.2	0.094	3580	2941	480m.fbmy5635_202304122154.cy9c5_u
23828	86522	36	0.4	602.9	70.4	0.000	0.005	0.025	3.025	435161	37.2	5.029	344	38.3	39.9	185.3	0.105	3612	2989	480m.fbmy5635_202305292102.cy9c5_u
23828	84983	45	0.4	601.4	69.9	0.001	0.005	0.025	3.002	425597	37.6	5.008	354	39.1	40.8	185.3	0.076	3580	2957	480m.fbmy5635_20230529_832.cy9c5_u
23828	82572	62	0.6	612.6	71.2	0.001	0.007	0.026	3.058	413900	38.0	5.013	368	38.1	39.8	185.4	0.080	3453	2861	480m.fbmy5635_20230529_843.cy9c5_u
23828	82995	78	0.6	602.8	70.3	0.001	0.007	0.025	3.020	414509	37.7	4.994	363	39.1	40.8	185.4	0.136	3469	2861	480m.fbmy5635_20230529_850.cy9c5_u
l.i0
l.i0: load without secondary indexes
Performance metrics for all DBMS, not just the ones listed above. Some are normalized by throughput, others are not. Legend for results is here.
ips	qps	rps	rmbps	wps	wmbps	rpq	rkbpq	wpi	wkbpi	csps	cpups	cspq	cpupq	dbgb1	dbgb2	rss	maxop	p50	p99	tag
625000	0	0	0.0	2581.0	308.5	0.000	0.000	0.004	0.505	520990	40.6	0.834	52	15.4	16.6	5.0	0.095	26773	17882	480m.fbmy5635_202203072101.cy9c5_u
602258	0	0	0.0	2462.1	295.3	0.000	0.000	0.004	0.502	551306	40.9	0.915	54	15.5	16.7	5.0	0.101	25474	18981	480m.fbmy5635_202205192101.cy9c5_u
594059	0	0	0.0	2440.1	293.6	0.000	0.000	0.004	0.506	542619	40.4	0.913	54	15.5	16.7	5.1	0.118	25375	18182	480m.fbmy5635_202208092101.cy9c5_u
594796	0	0	0.0	2445.1	294.0	0.000	0.000	0.004	0.506	538647	40.8	0.906	55	15.5	16.6	5.1	0.097	25674	15795	480m.fbmy5635_202210112144.cy9c5_u
627451	0	0	0.0	2166.0	260.5	0.000	0.000	0.003	0.425	304374	36.7	0.485	47	15.1	16.2	4.1	0.107	26973	20979	480m.fbmy5635_202302162102.cy9c5_u
629921	0	0	0.0	2134.4	256.8	0.000	0.000	0.003	0.418	273976	36.0	0.435	46	15.1	16.2	4.0	0.100	26773	21578	480m.fbmy5635_202304122154.cy9c5_u
629096	0	0	0.0	2100.9	252.8	0.000	0.000	0.003	0.412	272469	35.9	0.433	46	15.1	16.3	4.0	0.097	26970	19081	480m.fbmy5635_202305292102.cy9c5_u
629096	0	0	0.0	2146.3	257.8	0.000	0.000	0.003	0.420	320495	38.7	0.509	49	15.2	16.4	4.0	0.093	26973	21678	480m.fbmy5635_20230529_832.cy9c5_u
625815	0	0	0.0	2120.7	254.4	0.000	0.000	0.003	0.416	309669	39.0	0.495	50	15.3	16.4	4.0	0.093	26873	20380	480m.fbmy5635_20230529_843.cy9c5_u
629096	0	0	0.0	2173.5	261.2	0.000	0.000	0.003	0.425	297238	38.5	0.472	49	15.1	16.3	4.1	0.105	27173	21878	480m.fbmy5635_20230529_850.cy9c5_u
l.x
l.x: create secondary indexes
Performance metrics for all DBMS, not just the ones listed above. Some are normalized by throughput, others are not. Legend for results is here.
ips	qps	rps	rmbps	wps	wmbps	rpq	rkbpq	wpi	wkbpi	csps	cpups	cspq	cpupq	dbgb1	dbgb2	rss	maxop	p50	p99	tag
1446084	0	30	0.2	1915.0	209.8	0.000	0.000	0.001	0.149	35049	29.3	0.024	16	32.4	33.5	44.8	0.002	NA	NA	480m.fbmy5635_202203072101.cy9c5_u
1407918	0	29	0.2	1882.2	205.7	0.000	0.000	0.001	0.150	33551	28.9	0.024	16	32.4	33.5	42.4	0.003	NA	NA	480m.fbmy5635_202205192101.cy9c5_u
1383573	0	29	0.2	1866.3	203.9	0.000	0.000	0.001	0.151	34248	28.7	0.025	17	32.4	33.5	44.2	0.002	NA	NA	480m.fbmy5635_202208092101.cy9c5_u
1395640	0	29	0.2	1864.7	204.6	0.000	0.000	0.001	0.150	32308	27.7	0.023	16	32.4	33.5	44.3	0.003	NA	NA	480m.fbmy5635_202210112144.cy9c5_u
1407918	0	29	0.2	1780.7	194.2	0.000	0.000	0.001	0.141	32061	27.9	0.023	16	32.4	33.5	40.3	0.003	NA	NA	480m.fbmy5635_202302162102.cy9c5_u
1387572	0	29	0.2	1754.9	191.4	0.000	0.000	0.001	0.141	33748	28.5	0.024	16	32.4	33.5	40.1	0.002	NA	NA	480m.fbmy5635_202304122154.cy9c5_u
1407918	0	29	0.2	1782.2	194.3	0.000	0.000	0.001	0.141	32810	28.1	0.023	16	32.4	33.5	39.8	0.003	NA	NA	480m.fbmy5635_202305292102.cy9c5_u
1399708	0	29	0.2	1757.5	191.6	0.000	0.000	0.001	0.140	35248	29.0	0.025	17	32.4	33.5	40.1	0.003	NA	NA	480m.fbmy5635_20230529_832.cy9c5_u
1403801	0	29	0.2	1799.5	196.6	0.000	0.000	0.001	0.143	33235	28.8	0.024	16	32.3	33.4	41.3	0.002	NA	NA	480m.fbmy5635_20230529_843.cy9c5_u
1383573	0	29	0.2	1757.0	191.4	0.000	0.000	0.001	0.142	33042	29.4	0.024	17	32.3	33.5	38.6	0.003	NA	NA	480m.fbmy5635_20230529_850.cy9c5_u
l.i1
l.i1: continue load after secondary indexes created
Performance metrics for all DBMS, not just the ones listed above. Some are normalized by throughput, others are not. Legend for results is here.
ips	qps	rps	rmbps	wps	wmbps	rpq	rkbpq	wpi	wkbpi	csps	cpups	cspq	cpupq	dbgb1	dbgb2	rss	maxop	p50	p99	tag
70926	0	111	1.3	1941.7	232.5	0.002	0.019	0.027	3.357	144995	16.4	2.044	185	37.6	37.7	177.0	0.104	2947	2647	480m.fbmy5635_202203072101.cy9c5_u
67306	0	78	1.0	1840.4	220.8	0.001	0.016	0.027	3.359	138867	16.6	2.063	197	40.2	40.2	176.9	0.139	2797	2498	480m.fbmy5635_202205192101.cy9c5_u
66611	0	85	1.1	1833.1	219.3	0.001	0.016	0.028	3.372	137389	16.6	2.063	199	39.7	39.8	177.0	0.144	2797	2497	480m.fbmy5635_202208092101.cy9c5_u
66552	0	87	1.1	1822.9	217.6	0.001	0.017	0.027	3.348	137200	16.5	2.062	198	37.5	37.6	177.1	0.177	2797	2497	480m.fbmy5635_202210112144.cy9c5_u
60259	0	47	0.9	1479.3	174.8	0.001	0.015	0.025	2.971	120418	15.4	1.998	204	39.8	39.9	177.2	0.163	2547	2248	480m.fbmy5635_202302162102.cy9c5_u
60150	0	49	0.9	1478.4	173.8	0.001	0.015	0.025	2.959	119609	15.4	1.989	205	38.1	38.2	177.3	0.152	2498	2247	480m.fbmy5635_202304122154.cy9c5_u
60347	0	49	0.9	1476.6	174.3	0.001	0.015	0.024	2.958	120209	15.7	1.992	208	40.1	40.2	177.2	0.171	2547	2248	480m.fbmy5635_202305292102.cy9c5_u
60676	0	51	0.9	1479.6	175.9	0.001	0.015	0.024	2.969	121536	16.5	2.003	218	37.9	38.1	177.2	0.198	2547	2248	480m.fbmy5635_20230529_832.cy9c5_u
60356	0	59	0.9	1460.0	171.7	0.001	0.016	0.024	2.913	117643	16.7	1.949	221	37.9	38.0	177.2	0.171	2547	2247	480m.fbmy5635_20230529_843.cy9c5_u
60548	0	61	0.9	1474.2	174.8	0.001	0.016	0.024	2.956	113997	16.5	1.883	218	40.3	40.4	177.3	0.147	2547	2248	480m.fbmy5635_20230529_850.cy9c5_u
q100.1
q100.1: range queries with 100 insert/s per client
Performance metrics for all DBMS, not just the ones listed above. Some are normalized by throughput, others are not. Legend for results is here.
ips	qps	rps	rmbps	wps	wmbps	rpq	rkbpq	wpi	wkbpi	csps	cpups	cspq	cpupq	dbgb1	dbgb2	rss	maxop	p50	p99	tag
2381	106633	8	0.1	98.7	11.2	0.000	0.001	0.041	4.831	485280	31.7	4.551	238	35.9	37.8	178.3	0.026	4444	3900	480m.fbmy5635_202203072101.cy9c5_u
2381	103226	7	0.1	100.0	11.4	0.000	0.001	0.042	4.903	473926	31.7	4.591	246	35.9	37.8	178.3	0.057	4332	3773	480m.fbmy5635_202205192101.cy9c5_u
2381	102833	5	0.1	97.5	10.9	0.000	0.001	0.041	4.669	465531	31.7	4.527	247	36.0	37.9	178.3	0.060	4332	3788	480m.fbmy5635_202208092101.cy9c5_u
2381	102800	5	0.1	97.1	10.8	0.000	0.001	0.041	4.640	465340	31.7	4.527	247	36.0	37.9	178.2	0.010	4284	3788	480m.fbmy5635_202210112144.cy9c5_u
2381	101254	16	0.4	78.3	8.7	0.000	0.004	0.033	3.728	450915	31.7	4.453	250	37.1	39.0	178.6	0.060	4252	3756	480m.fbmy5635_202302162102.cy9c5_u
2381	101065	15	0.3	80.5	9.0	0.000	0.003	0.034	3.851	450095	31.8	4.454	252	37.2	39.1	178.7	0.009	4236	3756	480m.fbmy5635_202304122154.cy9c5_u
2381	101429	12	0.3	81.0	9.0	0.000	0.003	0.034	3.873	454795	31.7	4.484	250	37.1	39.1	178.6	0.054	4268	3757	480m.fbmy5635_202305292102.cy9c5_u
2381	99794	12	0.3	79.7	8.9	0.000	0.003	0.033	3.807	446468	32.3	4.474	259	37.1	39.1	178.6	0.025	4172	3708	480m.fbmy5635_20230529_832.cy9c5_u
2381	98072	15	0.4	80.2	8.9	0.000	0.004	0.034	3.833	436893	32.2	4.455	263	37.1	39.0	178.7	0.086	4123	3628	480m.fbmy5635_20230529_843.cy9c5_u
2381	97813	41	0.4	76.7	8.5	0.000	0.004	0.032	3.641	435657	32.2	4.454	263	37.1	39.1	178.7	0.065	4092	3612	480m.fbmy5635_20230529_850.cy9c5_u
q500.1
q500.1: range queries with 500 insert/s per client
Performance metrics for all DBMS, not just the ones listed above. Some are normalized by throughput, others are not. Legend for results is here.
ips	qps	rps	rmbps	wps	wmbps	rpq	rkbpq	wpi	wkbpi	csps	cpups	cspq	cpupq	dbgb1	dbgb2	rss	maxop	p50	p99	tag
11907	101783	32	0.3	380.4	44.7	0.000	0.003	0.032	3.844	476828	33.3	4.685	262	36.1	37.2	183.5	0.080	4268	3692	480m.fbmy5635_202203072101.cy9c5_u
11907	98110	26	0.3	376.1	44.2	0.000	0.003	0.032	3.803	464842	33.4	4.738	272	36.2	37.4	183.3	0.082	4108	3534	480m.fbmy5635_202205192101.cy9c5_u
11907	96652	24	0.3	374.4	43.6	0.000	0.003	0.031	3.751	452705	33.5	4.684	277	36.5	37.6	183.4	0.084	3996	3421	480m.fbmy5635_202208092101.cy9c5_u
11907	96915	25	0.3	381.6	44.6	0.000	0.003	0.032	3.835	454727	33.6	4.692	277	36.3	37.4	183.4	0.083	4060	3532	480m.fbmy5635_202210112144.cy9c5_u
11911	94654	15	0.2	330.9	38.5	0.000	0.002	0.028	3.311	440685	33.9	4.656	287	37.3	38.4	183.1	0.097	3951	3389	480m.fbmy5635_202302162102.cy9c5_u
11907	95201	13	0.2	328.5	38.2	0.000	0.002	0.028	3.286	440034	33.7	4.622	283	37.6	38.8	183.1	0.079	3996	3421	480m.fbmy5635_202304122154.cy9c5_u
11907	95174	15	0.2	329.6	38.4	0.000	0.002	0.028	3.298	444161	33.9	4.667	285	37.5	38.7	183.2	0.083	3996	3453	480m.fbmy5635_202305292102.cy9c5_u
11907	93432	16	0.3	324.1	37.6	0.000	0.003	0.027	3.235	435582	34.5	4.662	295	37.2	38.5	183.1	0.084	3916	3357	480m.fbmy5635_20230529_832.cy9c5_u
11907	91130	12	0.2	327.4	37.9	0.000	0.002	0.027	3.259	424299	34.5	4.656	303	37.5	38.7	183.0	0.086	3820	3229	480m.fbmy5635_20230529_843.cy9c5_u
11911	91815	58	0.3	322.0	37.3	0.001	0.003	0.027	3.211	423559	34.2	4.613	298	37.4	38.6	183.0	0.089	3836	3277	480m.fbmy5635_20230529_850.cy9c5_u
q1000.1
q1000.1: range queries with 1000 insert/s per client
Performance metrics for all DBMS, not just the ones listed above. Some are normalized by throughput, others are not. Legend for results is here.
ips	qps	rps	rmbps	wps	wmbps	rpq	rkbpq	wpi	wkbpi	csps	cpups	cspq	cpupq	dbgb1	dbgb2	rss	maxop	p50	p99	tag
23834	90959	59	0.6	688.0	80.1	0.001	0.006	0.029	3.443	464525	35.9	5.107	316	37.5	39.1	185.1	0.079	3804	3229	480m.fbmy5635_202203072101.cy9c5_u
23828	86404	54	0.4	676.8	78.8	0.001	0.005	0.028	3.388	452604	36.5	5.238	338	37.9	39.6	185.2	0.129	3596	3053	480m.fbmy5635_202205192101.cy9c5_u
23828	86802	94	0.7	687.2	80.2	0.001	0.008	0.029	3.447	442854	36.2	5.102	334	37.9	39.5	185.2	0.083	3612	3069	480m.fbmy5635_202208092101.cy9c5_u
23821	85967	61	0.5	677.3	78.8	0.001	0.006	0.028	3.388	443432	36.5	5.158	340	38.2	39.9	185.2	0.077	3596	3037	480m.fbmy5635_202210112144.cy9c5_u
23828	86211	33	0.4	603.5	70.1	0.000	0.005	0.025	3.014	430150	37.0	4.990	343	38.9	40.6	185.0	0.106	3580	2973	480m.fbmy5635_202302162102.cy9c5_u
23828	86087	38	0.5	609.2	71.3	0.000	0.006	0.026	3.065	428360	37.1	4.976	345	38.3	39.9	185.2	0.094	3580	2941	480m.fbmy5635_202304122154.cy9c5_u
23828	86522	36	0.4	602.9	70.4	0.000	0.005	0.025	3.025	435161	37.2	5.029	344	38.3	39.9	185.3	0.105	3612	2989	480m.fbmy5635_202305292102.cy9c5_u
23828	84983	45	0.4	601.4	69.9	0.001	0.005	0.025	3.002	425597	37.6	5.008	354	39.1	40.8	185.3	0.076	3580	2957	480m.fbmy5635_20230529_832.cy9c5_u
23828	82572	62	0.6	612.6	71.2	0.001	0.007	0.026	3.058	413900	38.0	5.013	368	38.1	39.8	185.4	0.080	3453	2861	480m.fbmy5635_20230529_843.cy9c5_u
23828	82995	78	0.6	602.8	70.3	0.001	0.007	0.025	3.020	414509	37.7	4.994	363	39.1	40.8	185.4	0.136	3469	2861	480m.fbmy5635_20230529_850.cy9c5_u
l.i0
- l.i0: load without secondary indexes
- Legend for results is here.
- Each entry lists the percentage of responses that fit in that bucket (slower than max time for previous bucket, faster than min time for next bucket).
Insert response time histogram
256us	1ms	4ms	16ms	64ms	256ms	1s	4s	16s	gt	max	tag
0.000	0.279	76.342	23.337	nonzero	0.042	0.000	0.000	0.000	0.000	0.095	fbmy5635_202203072101.cy9c5_u
0.000	0.228	67.543	32.187	nonzero	0.041	0.000	0.000	0.000	0.000	0.101	fbmy5635_202205192101.cy9c5_u
0.000	0.256	65.290	34.411	0.001	0.041	0.000	0.000	0.000	0.000	0.118	fbmy5635_202208092101.cy9c5_u
0.000	0.232	65.459	34.268	nonzero	0.041	0.000	0.000	0.000	0.000	0.097	fbmy5635_202210112144.cy9c5_u
0.000	0.182	77.188	22.589	0.000	0.042	0.000	0.000	0.000	0.000	0.107	fbmy5635_202302162102.cy9c5_u
0.000	0.197	76.798	22.962	nonzero	0.042	0.000	0.000	0.000	0.000	0.100	fbmy5635_202304122154.cy9c5_u
0.000	0.159	78.167	21.632	0.000	0.042	0.000	0.000	0.000	0.000	0.097	fbmy5635_202305292102.cy9c5_u
0.000	0.147	77.442	22.369	0.000	0.042	0.000	0.000	0.000	0.000	0.093	fbmy5635_20230529_832.cy9c5_u
0.000	0.131	76.359	23.468	nonzero	0.042	0.000	0.000	0.000	0.000	0.093	fbmy5635_20230529_843.cy9c5_u
0.000	0.116	78.095	21.747	nonzero	0.042	0.000	0.000	0.000	0.000	0.105	fbmy5635_20230529_850.cy9c5_u
l.x
- l.x: create secondary indexes
- Legend for results is here.
- Each entry lists the percentage of responses that fit in that bucket (slower than max time for previous bucket, faster than min time for next bucket).
TODO - determine whether there is data for create index response time
l.i1
- l.i1: continue load after secondary indexes created
- Legend for results is here.
- Each entry lists the percentage of responses that fit in that bucket (slower than max time for previous bucket, faster than min time for next bucket).
Insert response time histogram
256us	1ms	4ms	16ms	64ms	256ms	1s	4s	16s	gt	max	tag
0.000	nonzero	0.048	32.060	67.891	0.001	0.000	0.000	0.000	0.000	0.104	fbmy5635_202203072101.cy9c5_u
0.000	nonzero	0.040	24.119	75.836	0.004	0.000	0.000	0.000	0.000	0.139	fbmy5635_202205192101.cy9c5_u
0.000	0.000	0.036	22.820	77.140	0.004	0.000	0.000	0.000	0.000	0.144	fbmy5635_202208092101.cy9c5_u
0.000	0.000	0.040	22.756	77.202	0.003	0.000	0.000	0.000	0.000	0.177	fbmy5635_202210112144.cy9c5_u
0.000	0.000	0.030	12.275	87.693	0.003	0.000	0.000	0.000	0.000	0.163	fbmy5635_202302162102.cy9c5_u
0.000	0.000	0.025	12.047	87.924	0.003	0.000	0.000	0.000	0.000	0.152	fbmy5635_202304122154.cy9c5_u
0.000	0.000	0.029	12.452	87.515	0.004	0.000	0.000	0.000	0.000	0.171	fbmy5635_202305292102.cy9c5_u
0.000	0.000	0.032	13.465	86.498	0.005	0.000	0.000	0.000	0.000	0.198	fbmy5635_20230529_832.cy9c5_u
0.000	0.000	0.029	12.799	87.168	0.005	0.000	0.000	0.000	0.000	0.171	fbmy5635_20230529_843.cy9c5_u
0.000	0.000	0.028	13.054	86.915	0.004	0.000	0.000	0.000	0.000	0.147	fbmy5635_20230529_850.cy9c5_u
Delete response time histogram
256us	1ms	4ms	16ms	64ms	256ms	1s	4s	16s	gt	max	tag
0.000	0.001	0.048	37.092	62.858	0.002	nonzero	0.000	0.000	0.000	0.288	fbmy5635_202203072101.cy9c5_u
0.000	nonzero	0.040	27.384	72.570	0.005	0.000	0.000	0.000	0.000	0.163	fbmy5635_202205192101.cy9c5_u
0.000	0.002	0.036	25.701	74.257	0.004	nonzero	0.000	0.000	0.000	0.271	fbmy5635_202208092101.cy9c5_u
0.000	nonzero	0.040	25.760	74.196	0.003	nonzero	0.000	0.000	0.000	0.305	fbmy5635_202210112144.cy9c5_u
0.000	nonzero	0.030	13.847	86.121	0.003	0.000	0.000	0.000	0.000	0.191	fbmy5635_202302162102.cy9c5_u
0.000	nonzero	0.026	13.549	86.421	0.004	0.000	0.000	0.000	0.000	0.184	fbmy5635_202304122154.cy9c5_u
0.000	nonzero	0.029	14.001	85.965	0.004	0.000	0.000	0.000	0.000	0.187	fbmy5635_202305292102.cy9c5_u
0.000	nonzero	0.033	15.184	84.777	0.006	nonzero	0.000	0.000	0.000	0.283	fbmy5635_20230529_832.cy9c5_u
0.000	nonzero	0.029	14.428	85.537	0.005	0.000	0.000	0.000	0.000	0.197	fbmy5635_20230529_843.cy9c5_u
0.000	nonzero	0.029	14.662	85.305	0.004	0.000	0.000	0.000	0.000	0.206	fbmy5635_20230529_850.cy9c5_u
q100.1
- q100.1: range queries with 100 insert/s per client
- Legend for results is here.
- Each entry lists the percentage of responses that fit in that bucket (slower than max time for previous bucket, faster than min time for next bucket).
Query response time histogram
256us	1ms	4ms	16ms	64ms	256ms	1s	4s	16s	gt	max	tag
84.258	15.741	0.001	nonzero	nonzero	0.000	0.000	0.000	0.000	0.000	0.026	fbmy5635_202203072101.cy9c5_u
79.305	20.694	0.001	nonzero	nonzero	0.000	0.000	0.000	0.000	0.000	0.057	fbmy5635_202205192101.cy9c5_u
79.004	20.995	0.001	nonzero	nonzero	0.000	0.000	0.000	0.000	0.000	0.060	fbmy5635_202208092101.cy9c5_u
78.872	21.127	0.001	nonzero	0.000	0.000	0.000	0.000	0.000	0.000	0.010	fbmy5635_202210112144.cy9c5_u
76.073	23.926	0.001	nonzero	nonzero	0.000	0.000	0.000	0.000	0.000	0.060	fbmy5635_202302162102.cy9c5_u
75.822	24.177	0.001	nonzero	0.000	0.000	0.000	0.000	0.000	0.000	0.009	fbmy5635_202304122154.cy9c5_u
76.491	23.508	0.001	nonzero	nonzero	0.000	0.000	0.000	0.000	0.000	0.054	fbmy5635_202305292102.cy9c5_u
73.948	26.051	0.001	nonzero	nonzero	0.000	0.000	0.000	0.000	0.000	0.025	fbmy5635_20230529_832.cy9c5_u
71.108	28.890	0.001	nonzero	nonzero	nonzero	0.000	0.000	0.000	0.000	0.086	fbmy5635_20230529_843.cy9c5_u
70.633	29.366	0.001	nonzero	nonzero	nonzero	0.000	0.000	0.000	0.000	0.065	fbmy5635_20230529_850.cy9c5_u
Insert response time histogram
256us	1ms	4ms	16ms	64ms	256ms	1s	4s	16s	gt	max	tag
0.000	0.000	99.997	0.003	0.000	0.000	0.000	0.000	0.000	0.000	0.006	fbmy5635_202203072101.cy9c5_u
0.000	0.000	99.992	0.008	0.000	0.000	0.000	0.000	0.000	0.000	0.009	fbmy5635_202205192101.cy9c5_u
0.000	0.000	99.996	0.004	0.000	0.000	0.000	0.000	0.000	0.000	0.006	fbmy5635_202208092101.cy9c5_u
0.000	0.000	99.997	0.003	0.000	0.000	0.000	0.000	0.000	0.000	0.008	fbmy5635_202210112144.cy9c5_u
0.000	0.000	99.862	0.138	0.000	0.000	0.000	0.000	0.000	0.000	0.006	fbmy5635_202302162102.cy9c5_u
0.000	0.000	99.175	0.825	0.000	0.000	0.000	0.000	0.000	0.000	0.008	fbmy5635_202304122154.cy9c5_u
0.000	0.000	99.970	0.027	0.003	0.000	0.000	0.000	0.000	0.000	0.060	fbmy5635_202305292102.cy9c5_u
0.000	0.000	99.988	0.012	0.000	0.000	0.000	0.000	0.000	0.000	0.007	fbmy5635_20230529_832.cy9c5_u
0.000	0.000	95.807	4.193	0.000	0.000	0.000	0.000	0.000	0.000	0.009	fbmy5635_20230529_843.cy9c5_u
0.000	0.000	99.885	0.115	0.000	0.000	0.000	0.000	0.000	0.000	0.008	fbmy5635_20230529_850.cy9c5_u
Delete response time histogram
256us	1ms	4ms	16ms	64ms	256ms	1s	4s	16s	gt	max	tag
0.000	0.126	99.867	0.004	0.003	0.001	0.000	0.000	0.000	0.000	0.066	fbmy5635_202203072101.cy9c5_u
0.000	0.005	99.986	0.006	0.003	0.000	0.000	0.000	0.000	0.000	0.058	fbmy5635_202205192101.cy9c5_u
0.000	0.002	99.990	0.004	0.004	0.000	0.000	0.000	0.000	0.000	0.042	fbmy5635_202208092101.cy9c5_u
0.000	0.003	99.992	0.003	0.001	0.001	0.000	0.000	0.000	0.000	0.066	fbmy5635_202210112144.cy9c5_u
0.000	0.002	99.945	0.051	0.002	0.000	0.000	0.000	0.000	0.000	0.056	fbmy5635_202302162102.cy9c5_u
0.000	0.002	99.482	0.514	0.002	0.001	0.000	0.000	0.000	0.000	0.073	fbmy5635_202304122154.cy9c5_u
0.000	0.000	99.973	0.021	0.006	0.000	0.000	0.000	0.000	0.000	0.061	fbmy5635_202305292102.cy9c5_u
0.000	0.000	99.994	0.006	0.001	0.000	0.000	0.000	0.000	0.000	0.047	fbmy5635_20230529_832.cy9c5_u
0.000	0.001	97.117	2.879	0.002	0.000	0.000	0.000	0.000	0.000	0.054	fbmy5635_20230529_843.cy9c5_u
0.000	0.000	99.956	0.042	0.002	0.000	0.000	0.000	0.000	0.000	0.058	fbmy5635_20230529_850.cy9c5_u
q500.1
- q500.1: range queries with 500 insert/s per client
- Legend for results is here.
- Each entry lists the percentage of responses that fit in that bucket (slower than max time for previous bucket, faster than min time for next bucket).
Query response time histogram
256us	1ms	4ms	16ms	64ms	256ms	1s	4s	16s	gt	max	tag
77.742	22.256	0.001	nonzero	nonzero	nonzero	0.000	0.000	0.000	0.000	0.080	fbmy5635_202203072101.cy9c5_u
71.078	28.920	0.002	nonzero	nonzero	nonzero	0.000	0.000	0.000	0.000	0.082	fbmy5635_202205192101.cy9c5_u
68.751	31.247	0.001	nonzero	nonzero	nonzero	0.000	0.000	0.000	0.000	0.084	fbmy5635_202208092101.cy9c5_u
69.110	30.888	0.001	nonzero	nonzero	nonzero	0.000	0.000	0.000	0.000	0.083	fbmy5635_202210112144.cy9c5_u
64.436	35.561	0.002	nonzero	nonzero	nonzero	0.000	0.000	0.000	0.000	0.097	fbmy5635_202302162102.cy9c5_u
65.732	34.266	0.002	nonzero	nonzero	nonzero	0.000	0.000	0.000	0.000	0.079	fbmy5635_202304122154.cy9c5_u
65.628	34.369	0.002	nonzero	nonzero	nonzero	0.000	0.000	0.000	0.000	0.083	fbmy5635_202305292102.cy9c5_u
62.240	37.757	0.002	nonzero	nonzero	nonzero	0.000	0.000	0.000	0.000	0.084	fbmy5635_20230529_832.cy9c5_u
57.558	42.438	0.003	nonzero	nonzero	nonzero	0.000	0.000	0.000	0.000	0.086	fbmy5635_20230529_843.cy9c5_u
58.980	41.018	0.002	nonzero	nonzero	nonzero	0.000	0.000	0.000	0.000	0.089	fbmy5635_20230529_850.cy9c5_u
Insert response time histogram
256us	1ms	4ms	16ms	64ms	256ms	1s	4s	16s	gt	max	tag
0.000	0.000	99.519	0.478	0.002	0.001	0.000	0.000	0.000	0.000	0.079	fbmy5635_202203072101.cy9c5_u
0.000	0.000	99.915	0.082	0.002	0.001	0.000	0.000	0.000	0.000	0.079	fbmy5635_202205192101.cy9c5_u
0.000	0.000	99.501	0.494	0.004	0.001	0.000	0.000	0.000	0.000	0.083	fbmy5635_202208092101.cy9c5_u
0.000	0.000	99.103	0.894	0.001	0.001	0.000	0.000	0.000	0.000	0.082	fbmy5635_202210112144.cy9c5_u
0.000	0.000	17.532	49.696	32.769	0.004	0.000	0.000	0.000	0.000	0.099	fbmy5635_202302162102.cy9c5_u
0.000	0.000	29.388	69.977	0.634	0.001	0.000	0.000	0.000	0.000	0.083	fbmy5635_202304122154.cy9c5_u
0.000	0.000	25.919	62.280	11.800	0.002	0.000	0.000	0.000	0.000	0.092	fbmy5635_202305292102.cy9c5_u
0.000	0.000	23.429	72.725	3.846	0.001	0.000	0.000	0.000	0.000	0.093	fbmy5635_20230529_832.cy9c5_u
0.000	0.000	20.928	49.853	29.217	0.002	0.000	0.000	0.000	0.000	0.093	fbmy5635_20230529_843.cy9c5_u
0.000	0.000	52.711	47.268	0.020	0.002	0.000	0.000	0.000	0.000	0.091	fbmy5635_20230529_850.cy9c5_u
Delete response time histogram
256us	1ms	4ms	16ms	64ms	256ms	1s	4s	16s	gt	max	tag
0.000	0.064	99.676	0.249	0.009	0.002	0.000	0.000	0.000	0.000	0.089	fbmy5635_202203072101.cy9c5_u
0.000	0.002	99.930	0.055	0.010	0.003	0.000	0.000	0.000	0.000	0.100	fbmy5635_202205192101.cy9c5_u
0.000	0.001	99.658	0.327	0.012	0.002	0.000	0.000	0.000	0.000	0.089	fbmy5635_202208092101.cy9c5_u
0.000	0.001	99.332	0.655	0.010	0.003	0.000	0.000	0.000	0.000	0.096	fbmy5635_202210112144.cy9c5_u
0.000	nonzero	18.561	50.815	30.616	0.007	0.000	0.000	0.000	0.000	0.099	fbmy5635_202302162102.cy9c5_u
0.000	0.000	33.314	66.131	0.552	0.003	0.000	0.000	0.000	0.000	0.094	fbmy5635_202304122154.cy9c5_u
0.000	0.000	27.526	61.794	10.677	0.003	0.000	0.000	0.000	0.000	0.089	fbmy5635_202305292102.cy9c5_u
0.000	0.000	25.632	70.974	3.392	0.003	0.000	0.000	0.000	0.000	0.095	fbmy5635_20230529_832.cy9c5_u
0.000	0.000	21.880	50.977	27.138	0.005	0.000	0.000	0.000	0.000	0.101	fbmy5635_20230529_843.cy9c5_u
0.000	0.000	57.657	42.313	0.028	0.002	0.000	0.000	0.000	0.000	0.091	fbmy5635_20230529_850.cy9c5_u
q1000.1
- q1000.1: range queries with 1000 insert/s per client
- Legend for results is here.
- Each entry lists the percentage of responses that fit in that bucket (slower than max time for previous bucket, faster than min time for next bucket).
Query response time histogram
256us	1ms	4ms	16ms	64ms	256ms	1s	4s	16s	gt	max	tag
56.838	43.157	0.005	nonzero	nonzero	nonzero	0.000	0.000	0.000	0.000	0.079	fbmy5635_202203072101.cy9c5_u
46.547	53.444	0.009	nonzero	nonzero	nonzero	0.000	0.000	0.000	0.000	0.129	fbmy5635_202205192101.cy9c5_u
47.489	52.507	0.005	nonzero	nonzero	nonzero	0.000	0.000	0.000	0.000	0.083	fbmy5635_202208092101.cy9c5_u
45.682	54.311	0.007	nonzero	nonzero	nonzero	0.000	0.000	0.000	0.000	0.077	fbmy5635_202210112144.cy9c5_u
46.086	53.903	0.011	nonzero	nonzero	nonzero	0.000	0.000	0.000	0.000	0.106	fbmy5635_202302162102.cy9c5_u
45.895	54.095	0.010	nonzero	nonzero	nonzero	0.000	0.000	0.000	0.000	0.094	fbmy5635_202304122154.cy9c5_u
46.818	53.170	0.011	nonzero	nonzero	nonzero	0.000	0.000	0.000	0.000	0.105	fbmy5635_202305292102.cy9c5_u
43.415	56.574	0.012	nonzero	nonzero	nonzero	0.000	0.000	0.000	0.000	0.076	fbmy5635_20230529_832.cy9c5_u
37.737	62.248	0.014	nonzero	nonzero	nonzero	0.000	0.000	0.000	0.000	0.080	fbmy5635_20230529_843.cy9c5_u
38.585	61.402	0.013	nonzero	nonzero	nonzero	0.000	0.000	0.000	0.000	0.136	fbmy5635_20230529_850.cy9c5_u
Insert response time histogram
256us	1ms	4ms	16ms	64ms	256ms	1s	4s	16s	gt	max	tag
0.000	0.000	20.888	77.942	1.169	0.001	0.000	0.000	0.000	0.000	0.092	fbmy5635_202203072101.cy9c5_u
0.000	0.000	18.497	40.120	41.383	0.000	0.000	0.000	0.000	0.000	0.059	fbmy5635_202205192101.cy9c5_u
0.000	0.000	16.732	83.238	0.031	0.000	0.000	0.000	0.000	0.000	0.035	fbmy5635_202208092101.cy9c5_u
0.000	0.000	19.120	40.549	40.330	nonzero	0.000	0.000	0.000	0.000	0.087	fbmy5635_202210112144.cy9c5_u
0.000	0.000	2.066	12.503	85.428	0.002	0.000	0.000	0.000	0.000	0.106	fbmy5635_202302162102.cy9c5_u
0.000	0.000	2.053	16.031	81.910	0.005	0.000	0.000	0.000	0.000	0.128	fbmy5635_202304122154.cy9c5_u
0.000	0.000	1.392	9.775	88.827	0.005	0.000	0.000	0.000	0.000	0.111	fbmy5635_202305292102.cy9c5_u
0.000	0.000	3.074	16.331	80.591	0.003	0.000	0.000	0.000	0.000	0.100	fbmy5635_20230529_832.cy9c5_u
0.000	0.000	1.960	13.596	84.441	0.003	0.000	0.000	0.000	0.000	0.106	fbmy5635_20230529_843.cy9c5_u
0.000	0.000	2.836	12.900	84.259	0.005	0.000	0.000	0.000	0.000	0.102	fbmy5635_20230529_850.cy9c5_u
Delete response time histogram
256us	1ms	4ms	16ms	64ms	256ms	1s	4s	16s	gt	max	tag
0.000	0.003	23.010	75.890	1.095	0.002	0.000	0.000	0.000	0.000	0.143	fbmy5635_202203072101.cy9c5_u
0.000	nonzero	18.695	40.642	40.661	0.001	0.000	0.000	0.000	0.000	0.100	fbmy5635_202205192101.cy9c5_u
0.000	0.000	17.597	82.367	0.034	0.002	0.000	0.000	0.000	0.000	0.097	fbmy5635_202208092101.cy9c5_u
0.000	0.000	19.619	40.805	39.575	0.001	0.000	0.000	0.000	0.000	0.105	fbmy5635_202210112144.cy9c5_u
0.000	0.000	2.084	13.622	84.290	0.004	0.000	0.000	0.000	0.000	0.106	fbmy5635_202302162102.cy9c5_u
0.000	0.000	2.061	17.225	80.708	0.006	nonzero	0.000	0.000	0.000	0.281	fbmy5635_202304122154.cy9c5_u
0.000	0.000	1.370	10.751	87.872	0.006	0.000	0.000	0.000	0.000	0.111	fbmy5635_202305292102.cy9c5_u
0.000	0.000	3.040	17.556	79.400	0.004	0.000	0.000	0.000	0.000	0.110	fbmy5635_20230529_832.cy9c5_u
0.000	0.000	1.965	14.838	83.193	0.004	0.000	0.000	0.000	0.000	0.132	fbmy5635_20230529_843.cy9c5_u
0.000	0.000	2.783	14.134	83.077	0.006	nonzero	0.000	0.000	0.000	0.275	fbmy5635_20230529_850.cy9c5_u