Introduction
This is a report for the insert benchmark with 20M docs and 1 client(s). It is generated by scripts (bash, awk, sed) and Tufte might not be impressed. An overview of the insert benchmark is here and a short update is here. Below, by DBMS, I mean DBMS+version.config. An example is my8020.c10b40 where my means MySQL, 8020 is version 8.0.20 and c10b40 is the name for the configuration file.
The test server has 8 AMD cores, 16G RAM and an NVMe SSD. It is described here as the Beelink. The benchmark was run with 1 client and there were 1 or 3 connections per client (1 for queries or inserts without rate limits, 1+1 for rate limited inserts+deletes). It uses 1 table. It loads 20M rows per table without secondary indexes, creates secondary indexes, then inserts 100M rows per table with a delete per insert to avoid growing the table. It then does 3 read+write tests for 3600s each that do queries as fast as possible with 100, 500 and then 1000 inserts/second/client concurrent with the queries and 1000 deletes/second to avoid growing the table. The database is cached by the storage engine. Clients and the DBMS share one server. The per-database configs are in the per-database subdirectories here.
The tested DBMS are:
- fbmy5635_rel_202104072149.cy10a_bee - MyRocks 5.6.35 from 20210407 at git hash (f896415fa0 MySQL, 0f8c041ea RocksDB), RocksDB 6.19, cy10a_bee config
- fbmy5635_rel_202203072101.cy10a_bee - MyRocks 5.6.35 from 20220307 at git hash (e7d976ee MySQL, df4d3cf6fd RocksDB), RocksDB 6.28.2, cy10a_bee config
- fbmy5635_rel_202205192101.cy10a_bee - MyRocks 5.6.35 from 20220519 at git hash (d503bd77 MySQL, f2f26b15 RocksDB), RocksDB 7.2.2, cy10a_bee config
- fbmy5635_rel_202208092101.cy10a_bee - MyRocks 5.6.35 from 20220809 at git hash (877a0e585 MySQL, 8e0f4952 RocksDB), RocksDB 7.3.1, cy10a_bee config
- fbmy5635_rel_202210112144.cy10a_bee - MyRocks 5.6.35 from 20221011 at git hash (c691c7160 MySQL, 8e0f4952 RocksDB), RocksDB 7.3.1, cy10a_bee config
- fbmy5635_rel_202302162102.cy10a_bee - MyRocks 5.6.35 from 20230216 at git hash (21a2b0aa MySQL, e5dcebf7 RocksDB), RocksDB 7.10.0, cy10a_bee config
- fbmy5635_rel_202304122154.cy10a_bee - MyRocks 5.6.35 from 20230412 at git hash (205c31dd MySQL, 3258b5c3 RocksDB), RocksDB 7.10.2, cy10a_bee config
- fbmy5635_rel_202305292102.cy10a_bee - MyRocks 5.6.35 from 20230529 at git hash (b739eac1 MySQL, 03057204 RocksDB), RocksDB 8.2.1, cy10a_bee config
- fbmy5635_rel_20230529_832.cy10a_bee - MyRocks 5.6.35 from 20230529 at git hash (b739eac1 MySQL), but with RocksDB 8.3.2, cy10a_bee config
- fbmy5635_rel_20230529_843.cy10a_bee - MyRocks 5.6.35 from 20230529 at git hash (b739eac1 MySQL), but with RocksDB 8.3.2, cy10a_bee config
- fbmy5635_rel_20230529_850.cy10a_bee - MyRocks 5.6.35 from 20230529 at git hash (b739eac1 MySQL), but with RocksDB 8.3.2, cy10a_bee config
Contents
- Summary
- l.i0: load without secondary indexes
- l.x: create secondary indexes
- l.i1: continue load after secondary indexes created
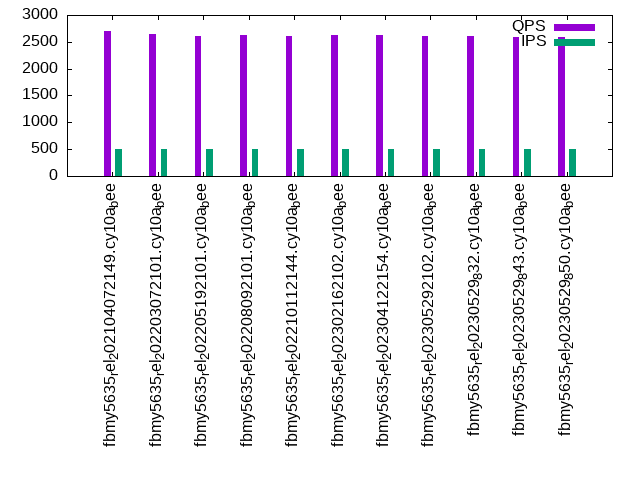
- q100.1: range queries with 100 insert/s per client
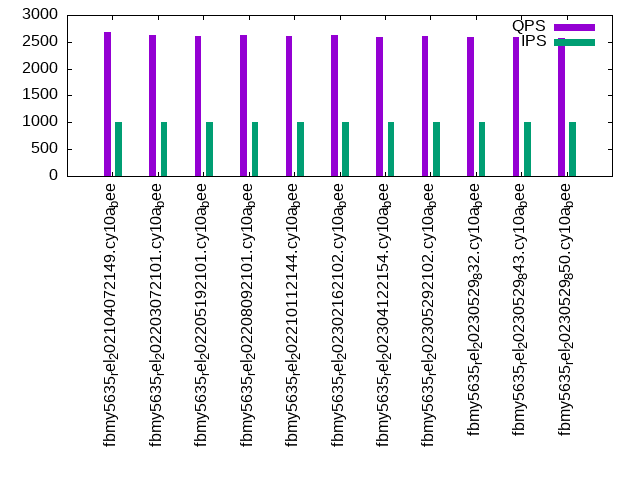
- q500.1: range queries with 500 insert/s per client
- q1000.1: range queries with 1000 insert/s per client
Summary
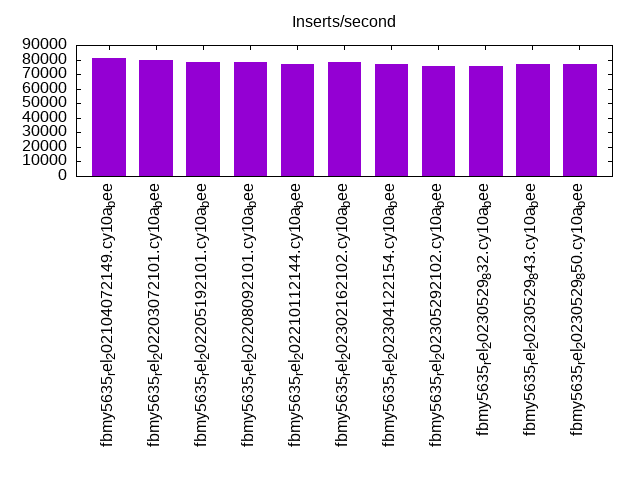
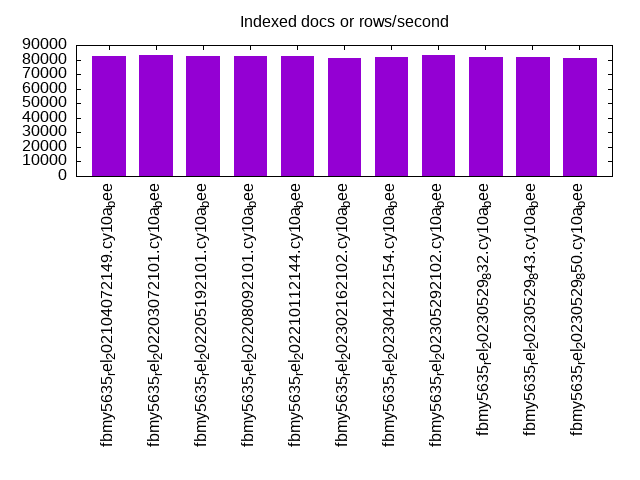
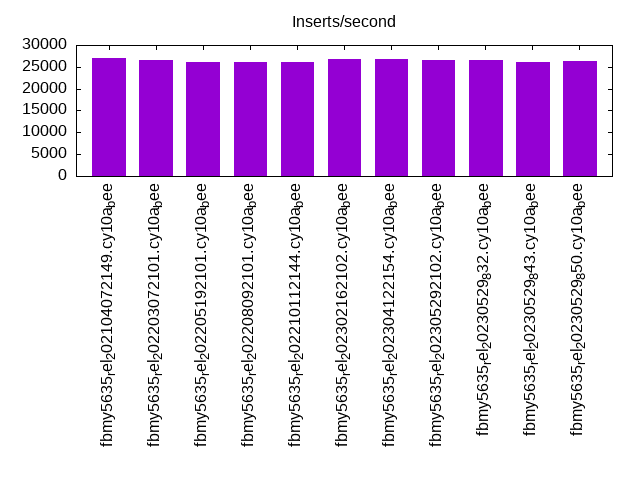
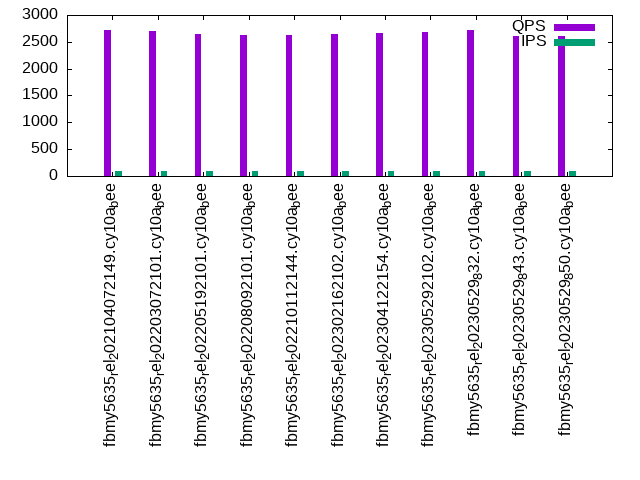
The numbers are inserts/s for l.i0 and l.i1, indexed docs (or rows) /s for l.x and queries/s for q*.2. The values are the average rate over the entire test for inserts (IPS) and queries (QPS). The range of values for IPS and QPS is split into 3 parts: bottom 25%, middle 50%, top 25%. Values in the bottom 25% have a red background, values in the top 25% have a green background and values in the middle have no color. A gray background is used for values that can be ignored because the DBMS did not sustain the target insert rate. Red backgrounds are not used when the minimum value is within 80% of the max value.
| dbms | l.i0 | l.x | l.i1 | q100.1 | q500.1 | q1000.1 |
|---|---|---|---|---|---|---|
| fbmy5635_rel_202104072149.cy10a_bee | 81301 | 82377 | 27012 | 2719 | 2694 | 2686 |
| fbmy5635_rel_202203072101.cy10a_bee | 79681 | 83402 | 26490 | 2697 | 2649 | 2626 |
| fbmy5635_rel_202205192101.cy10a_bee | 78431 | 82377 | 26014 | 2643 | 2604 | 2606 |
| fbmy5635_rel_202208092101.cy10a_bee | 78125 | 82377 | 26110 | 2631 | 2629 | 2621 |
| fbmy5635_rel_202210112144.cy10a_bee | 77220 | 82377 | 26035 | 2628 | 2608 | 2605 |
| fbmy5635_rel_202302162102.cy10a_bee | 78125 | 81376 | 26774 | 2638 | 2621 | 2623 |
| fbmy5635_rel_202304122154.cy10a_bee | 77220 | 82041 | 26716 | 2670 | 2624 | 2594 |
| fbmy5635_rel_202305292102.cy10a_bee | 75758 | 83058 | 26511 | 2674 | 2615 | 2612 |
| fbmy5635_rel_20230529_832.cy10a_bee | 75758 | 81707 | 26469 | 2718 | 2601 | 2599 |
| fbmy5635_rel_20230529_843.cy10a_bee | 77220 | 82041 | 26151 | 2609 | 2597 | 2589 |
| fbmy5635_rel_20230529_850.cy10a_bee | 76628 | 81376 | 26427 | 2606 | 2584 | 2575 |
This table has relative throughput, throughput for the DBMS relative to the DBMS in the first line, using the absolute throughput from the previous table. Values less than 0.95 have a yellow background. Values greater than 1.05 have a blue background.
| dbms | l.i0 | l.x | l.i1 | q100.1 | q500.1 | q1000.1 |
|---|---|---|---|---|---|---|
| fbmy5635_rel_202104072149.cy10a_bee | 1.00 | 1.00 | 1.00 | 1.00 | 1.00 | 1.00 |
| fbmy5635_rel_202203072101.cy10a_bee | 0.98 | 1.01 | 0.98 | 0.99 | 0.98 | 0.98 |
| fbmy5635_rel_202205192101.cy10a_bee | 0.96 | 1.00 | 0.96 | 0.97 | 0.97 | 0.97 |
| fbmy5635_rel_202208092101.cy10a_bee | 0.96 | 1.00 | 0.97 | 0.97 | 0.98 | 0.98 |
| fbmy5635_rel_202210112144.cy10a_bee | 0.95 | 1.00 | 0.96 | 0.97 | 0.97 | 0.97 |
| fbmy5635_rel_202302162102.cy10a_bee | 0.96 | 0.99 | 0.99 | 0.97 | 0.97 | 0.98 |
| fbmy5635_rel_202304122154.cy10a_bee | 0.95 | 1.00 | 0.99 | 0.98 | 0.97 | 0.97 |
| fbmy5635_rel_202305292102.cy10a_bee | 0.93 | 1.01 | 0.98 | 0.98 | 0.97 | 0.97 |
| fbmy5635_rel_20230529_832.cy10a_bee | 0.93 | 0.99 | 0.98 | 1.00 | 0.97 | 0.97 |
| fbmy5635_rel_20230529_843.cy10a_bee | 0.95 | 1.00 | 0.97 | 0.96 | 0.96 | 0.96 |
| fbmy5635_rel_20230529_850.cy10a_bee | 0.94 | 0.99 | 0.98 | 0.96 | 0.96 | 0.96 |
This lists the average rate of inserts/s for the tests that do inserts concurrent with queries. For such tests the query rate is listed in the table above. The read+write tests are setup so that the insert rate should match the target rate every second. Cells that are not at least 95% of the target have a red background to indicate a failure to satisfy the target.
| dbms | q100.1 | q500.1 | q1000.1 |
|---|---|---|---|
| fbmy5635_rel_202104072149.cy10a_bee | 100 | 499 | 998 |
| fbmy5635_rel_202203072101.cy10a_bee | 100 | 499 | 998 |
| fbmy5635_rel_202205192101.cy10a_bee | 100 | 499 | 998 |
| fbmy5635_rel_202208092101.cy10a_bee | 100 | 499 | 998 |
| fbmy5635_rel_202210112144.cy10a_bee | 100 | 499 | 999 |
| fbmy5635_rel_202302162102.cy10a_bee | 100 | 499 | 998 |
| fbmy5635_rel_202304122154.cy10a_bee | 100 | 499 | 998 |
| fbmy5635_rel_202305292102.cy10a_bee | 100 | 499 | 998 |
| fbmy5635_rel_20230529_832.cy10a_bee | 100 | 499 | 998 |
| fbmy5635_rel_20230529_843.cy10a_bee | 100 | 499 | 998 |
| fbmy5635_rel_20230529_850.cy10a_bee | 100 | 499 | 998 |
| target | 100 | 500 | 1000 |
l.i0
l.i0: load without secondary indexes. Graphs for performance per 1-second interval are here.
Average throughput:
Insert response time histogram: each cell has the percentage of responses that take <= the time in the header and max is the max response time in seconds. For the max column values in the top 25% of the range have a red background and in the bottom 25% of the range have a green background. The red background is not used when the min value is within 80% of the max value.
| dbms | 256us | 1ms | 4ms | 16ms | 64ms | 256ms | 1s | 4s | 16s | gt | max |
|---|---|---|---|---|---|---|---|---|---|---|---|
| fbmy5635_rel_202104072149.cy10a_bee | 0.001 | 99.873 | 0.122 | 0.002 | 0.002 | 0.112 | |||||
| fbmy5635_rel_202203072101.cy10a_bee | 99.870 | 0.125 | 0.003 | 0.002 | 0.109 | ||||||
| fbmy5635_rel_202205192101.cy10a_bee | 99.870 | 0.126 | 0.004 | 0.001 | 0.071 | ||||||
| fbmy5635_rel_202208092101.cy10a_bee | 99.868 | 0.129 | 0.003 | 0.001 | 0.070 | ||||||
| fbmy5635_rel_202210112144.cy10a_bee | 99.868 | 0.128 | 0.003 | 0.002 | 0.072 | ||||||
| fbmy5635_rel_202302162102.cy10a_bee | 99.869 | 0.127 | 0.003 | 0.002 | 0.098 | ||||||
| fbmy5635_rel_202304122154.cy10a_bee | 99.867 | 0.128 | 0.004 | 0.001 | 0.071 | ||||||
| fbmy5635_rel_202305292102.cy10a_bee | 99.865 | 0.131 | 0.004 | 0.001 | 0.065 | ||||||
| fbmy5635_rel_20230529_832.cy10a_bee | 99.865 | 0.131 | 0.003 | 0.002 | 0.066 | ||||||
| fbmy5635_rel_20230529_843.cy10a_bee | 99.867 | 0.128 | 0.005 | 0.001 | 0.069 | ||||||
| fbmy5635_rel_20230529_850.cy10a_bee | 99.866 | 0.131 | 0.002 | 0.002 | 0.073 |
Performance metrics for the DBMS listed above. Some are normalized by throughput, others are not. Legend for results is here.
ips	qps	rps	rmbps	wps	wmbps	rpq	rkbpq	wpi	wkbpi	csps	cpups	cspq	cpupq	dbgb1	dbgb2	rss	maxop	p50	p99	tag
81301	0	0	0.0	36.9	13.8	0.000	0.000	0.000	0.174	7991	23.2	0.098	23	0.7	1.8	0.2	0.112	82006	73618	20m.fbmy5635_rel_202104072149.cy10a_bee
79681	0	0	0.0	35.9	13.5	0.000	0.000	0.000	0.174	7829	23.1	0.098	23	0.7	1.8	0.2	0.109	80408	72917	20m.fbmy5635_rel_202203072101.cy10a_bee
78431	0	0	0.0	35.5	13.2	0.000	0.000	0.000	0.173	7673	22.7	0.098	23	0.7	1.8	0.2	0.071	78809	72116	20m.fbmy5635_rel_202205192101.cy10a_bee
78125	0	0	0.0	37.7	13.2	0.000	0.000	0.000	0.174	7662	22.7	0.098	23	0.7	1.8	0.2	0.070	78713	70920	20m.fbmy5635_rel_202208092101.cy10a_bee
77220	0	0	0.0	37.2	13.1	0.000	0.000	0.000	0.173	7613	22.6	0.099	23	0.7	1.8	0.2	0.072	78251	70719	20m.fbmy5635_rel_202210112144.cy10a_bee
78125	0	0	0.0	35.4	13.2	0.000	0.000	0.000	0.173	7671	22.6	0.098	23	0.7	1.8	0.2	0.098	78810	70520	20m.fbmy5635_rel_202302162102.cy10a_bee
77220	0	0	0.0	35.0	13.0	0.000	0.000	0.000	0.173	7553	22.4	0.098	23	0.7	1.8	0.2	0.071	77613	70919	20m.fbmy5635_rel_202304122154.cy10a_bee
75758	0	0	0.0	34.7	12.8	0.000	0.000	0.000	0.173	7472	21.8	0.099	23	0.7	1.8	0.2	0.065	76715	69920	20m.fbmy5635_rel_202305292102.cy10a_bee
75758	0	0	0.0	35.3	12.8	0.000	0.000	0.000	0.173	7475	21.7	0.099	23	0.7	1.8	0.2	0.066	76415	69954	20m.fbmy5635_rel_20230529_832.cy10a_bee
77220	0	0	0.0	35.2	13.1	0.000	0.000	0.000	0.173	7573	22.7	0.098	24	0.7	1.8	0.2	0.069	78010	70420	20m.fbmy5635_rel_20230529_843.cy10a_bee
76628	0	0	0.0	34.7	12.9	0.000	0.000	0.000	0.173	7511	22.4	0.098	23	0.7	1.8	0.2	0.073	77212	69420	20m.fbmy5635_rel_20230529_850.cy10a_bee
l.x
l.x: create secondary indexes.
Average throughput:
Performance metrics for the DBMS listed above. Some are normalized by throughput, others are not. Legend for results is here.
ips	qps	rps	rmbps	wps	wmbps	rpq	rkbpq	wpi	wkbpi	csps	cpups	cspq	cpupq	dbgb1	dbgb2	rss	maxop	p50	p99	tag
82377	0	0	0.0	29.7	12.5	0.000	0.000	0.000	0.155	244	11.8	0.003	11	1.4	2.5	1.5	0.008	NA	NA	20m.fbmy5635_rel_202104072149.cy10a_bee
83402	0	0	0.0	32.8	12.7	0.000	0.000	0.000	0.155	286	11.9	0.003	11	1.5	2.5	1.5	0.013	NA	NA	20m.fbmy5635_rel_202203072101.cy10a_bee
82377	0	0	0.0	32.2	12.5	0.000	0.000	0.000	0.155	261	11.8	0.003	11	1.5	2.5	1.5	0.007	NA	NA	20m.fbmy5635_rel_202205192101.cy10a_bee
82377	0	0	0.0	33.7	12.5	0.000	0.000	0.000	0.155	348	11.8	0.004	11	1.5	2.5	1.5	0.007	NA	NA	20m.fbmy5635_rel_202208092101.cy10a_bee
82377	0	0	0.0	33.6	12.5	0.000	0.000	0.000	0.155	325	11.9	0.004	12	1.5	2.5	1.5	0.008	NA	NA	20m.fbmy5635_rel_202210112144.cy10a_bee
81376	0	0	0.0	31.7	12.4	0.000	0.000	0.000	0.156	243	11.8	0.003	12	1.5	2.5	1.5	0.008	NA	NA	20m.fbmy5635_rel_202302162102.cy10a_bee
82041	0	0	0.0	31.8	12.5	0.000	0.000	0.000	0.156	273	11.8	0.003	12	1.5	2.5	1.5	0.008	NA	NA	20m.fbmy5635_rel_202304122154.cy10a_bee
83058	0	0	0.0	32.2	12.6	0.000	0.000	0.000	0.155	237	11.9	0.003	11	1.5	2.5	1.5	0.007	NA	NA	20m.fbmy5635_rel_202305292102.cy10a_bee
81707	0	0	0.0	31.8	12.4	0.000	0.000	0.000	0.156	276	11.8	0.003	12	1.5	2.5	1.5	0.009	NA	NA	20m.fbmy5635_rel_20230529_832.cy10a_bee
82041	0	0	0.0	32.0	12.5	0.000	0.000	0.000	0.155	259	11.8	0.003	12	1.5	2.5	1.5	0.007	NA	NA	20m.fbmy5635_rel_20230529_843.cy10a_bee
81376	0	0	0.0	31.9	12.4	0.000	0.000	0.000	0.156	265	11.8	0.003	12	1.5	2.5	1.5	0.008	NA	NA	20m.fbmy5635_rel_20230529_850.cy10a_bee
l.i1
l.i1: continue load after secondary indexes created. Graphs for performance per 1-second interval are here.
Average throughput:
Insert response time histogram: each cell has the percentage of responses that take <= the time in the header and max is the max response time in seconds. For the max column values in the top 25% of the range have a red background and in the bottom 25% of the range have a green background. The red background is not used when the min value is within 80% of the max value.
| dbms | 256us | 1ms | 4ms | 16ms | 64ms | 256ms | 1s | 4s | 16s | gt | max |
|---|---|---|---|---|---|---|---|---|---|---|---|
| fbmy5635_rel_202104072149.cy10a_bee | 99.808 | 0.186 | 0.003 | 0.002 | 0.090 | ||||||
| fbmy5635_rel_202203072101.cy10a_bee | 99.804 | 0.186 | 0.008 | 0.002 | 0.151 | ||||||
| fbmy5635_rel_202205192101.cy10a_bee | 99.803 | 0.192 | 0.003 | 0.002 | 0.081 | ||||||
| fbmy5635_rel_202208092101.cy10a_bee | 99.801 | 0.194 | 0.002 | 0.003 | 0.117 | ||||||
| fbmy5635_rel_202210112144.cy10a_bee | 99.803 | 0.188 | 0.006 | 0.003 | 0.180 | ||||||
| fbmy5635_rel_202302162102.cy10a_bee | 99.809 | 0.186 | 0.004 | 0.001 | 0.080 | ||||||
| fbmy5635_rel_202304122154.cy10a_bee | 99.808 | 0.188 | 0.003 | 0.002 | 0.102 | ||||||
| fbmy5635_rel_202305292102.cy10a_bee | 99.807 | 0.188 | 0.004 | 0.001 | 0.092 | ||||||
| fbmy5635_rel_20230529_832.cy10a_bee | 99.804 | 0.191 | 0.003 | 0.001 | 0.081 | ||||||
| fbmy5635_rel_20230529_843.cy10a_bee | 99.802 | 0.187 | 0.009 | 0.002 | 0.216 | ||||||
| fbmy5635_rel_20230529_850.cy10a_bee | 99.803 | 0.192 | 0.003 | 0.002 | 0.093 |
Delete response time histogram: each cell has the percentage of responses that take <= the time in the header and max is the max response time in seconds. For the max column values in the top 25% of the range have a red background and in the bottom 25% of the range have a green background. The red background is not used when the min value is within 80% of the max value.
| dbms | 256us | 1ms | 4ms | 16ms | 64ms | 256ms | 1s | 4s | 16s | gt | max |
|---|---|---|---|---|---|---|---|---|---|---|---|
| fbmy5635_rel_202104072149.cy10a_bee | 99.801 | 0.189 | 0.008 | 0.002 | 0.090 | ||||||
| fbmy5635_rel_202203072101.cy10a_bee | 99.791 | 0.193 | 0.014 | 0.002 | 0.150 | ||||||
| fbmy5635_rel_202205192101.cy10a_bee | 99.793 | 0.196 | 0.009 | 0.002 | 0.082 | ||||||
| fbmy5635_rel_202208092101.cy10a_bee | 99.795 | 0.195 | 0.007 | 0.003 | 0.117 | ||||||
| fbmy5635_rel_202210112144.cy10a_bee | 99.795 | 0.191 | 0.011 | 0.003 | 0.180 | ||||||
| fbmy5635_rel_202302162102.cy10a_bee | 99.800 | 0.191 | 0.008 | 0.001 | 0.080 | ||||||
| fbmy5635_rel_202304122154.cy10a_bee | 99.798 | 0.195 | 0.006 | 0.002 | 0.102 | ||||||
| fbmy5635_rel_202305292102.cy10a_bee | 99.796 | 0.194 | 0.008 | 0.001 | 0.092 | ||||||
| fbmy5635_rel_20230529_832.cy10a_bee | 99.794 | 0.197 | 0.007 | 0.001 | 0.081 | ||||||
| fbmy5635_rel_20230529_843.cy10a_bee | 99.796 | 0.190 | 0.013 | 0.002 | 0.216 | ||||||
| fbmy5635_rel_20230529_850.cy10a_bee | 99.794 | 0.197 | 0.007 | 0.001 | 0.093 |
Performance metrics for the DBMS listed above. Some are normalized by throughput, others are not. Legend for results is here.
ips	qps	rps	rmbps	wps	wmbps	rpq	rkbpq	wpi	wkbpi	csps	cpups	cspq	cpupq	dbgb1	dbgb2	rss	maxop	p50	p99	tag
27012	0	63	1.7	118.3	44.5	0.002	0.064	0.004	1.687	11540	45.6	0.427	135	2.4	3.0	8.3	0.090	26970	24423	20m.fbmy5635_rel_202104072149.cy10a_bee
26490	0	68	1.2	115.1	43.8	0.003	0.048	0.004	1.693	11380	45.1	0.430	136	2.1	2.6	8.4	0.151	26471	23785	20m.fbmy5635_rel_202203072101.cy10a_bee
26014	0	64	0.8	113.3	43.3	0.002	0.033	0.004	1.705	11163	45.0	0.429	138	1.9	2.4	8.4	0.081	26021	23285	20m.fbmy5635_rel_202205192101.cy10a_bee
26110	0	55	0.9	115.4	43.2	0.002	0.037	0.004	1.695	11192	44.8	0.429	137	2.4	2.9	8.3	0.117	26087	23473	20m.fbmy5635_rel_202208092101.cy10a_bee
26035	0	49	0.9	115.1	43.3	0.002	0.036	0.004	1.704	11155	45.1	0.428	139	2.3	2.8	8.4	0.180	26070	23273	20m.fbmy5635_rel_202210112144.cy10a_bee
26774	0	88	0.9	104.5	39.5	0.003	0.036	0.004	1.512	11346	44.6	0.424	133	2.8	3.4	8.4	0.080	26769	24284	20m.fbmy5635_rel_202302162102.cy10a_bee
26716	0	82	0.9	104.0	39.3	0.003	0.033	0.004	1.507	11300	44.3	0.423	133	2.4	2.9	8.4	0.102	26671	24123	20m.fbmy5635_rel_202304122154.cy10a_bee
26511	0	82	0.8	103.8	39.3	0.003	0.031	0.004	1.519	11254	44.8	0.425	135	2.4	2.9	8.4	0.092	26471	23783	20m.fbmy5635_rel_202305292102.cy10a_bee
26469	0	130	1.2	104.5	38.8	0.005	0.047	0.004	1.501	11326	44.5	0.428	134	2.4	2.9	8.4	0.081	26421	23973	20m.fbmy5635_rel_20230529_832.cy10a_bee
26151	0	86	0.9	101.5	38.3	0.003	0.036	0.004	1.502	11114	44.7	0.425	137	2.5	3.0	8.4	0.216	26121	23423	20m.fbmy5635_rel_20230529_843.cy10a_bee
26427	0	141	0.9	103.6	38.8	0.005	0.034	0.004	1.505	11265	44.6	0.426	135	2.7	3.2	8.4	0.093	26384	23774	20m.fbmy5635_rel_20230529_850.cy10a_bee
q100.1
q100.1: range queries with 100 insert/s per client. Graphs for performance per 1-second interval are here.
Average throughput:
Query response time histogram: each cell has the percentage of responses that take <= the time in the header and max is the max response time in seconds. For max values in the top 25% of the range have a red background and in the bottom 25% of the range have a green background. The red background is not used when the min value is within 80% of the max value.
| dbms | 256us | 1ms | 4ms | 16ms | 64ms | 256ms | 1s | 4s | 16s | gt | max |
|---|---|---|---|---|---|---|---|---|---|---|---|
| fbmy5635_rel_202104072149.cy10a_bee | 3.040 | 96.958 | 0.001 | 0.002 | 0.010 | ||||||
| fbmy5635_rel_202203072101.cy10a_bee | 2.315 | 97.684 | 0.001 | nonzero | 0.009 | ||||||
| fbmy5635_rel_202205192101.cy10a_bee | 1.291 | 98.708 | 0.001 | 0.003 | |||||||
| fbmy5635_rel_202208092101.cy10a_bee | 1.874 | 98.125 | 0.001 | nonzero | 0.005 | ||||||
| fbmy5635_rel_202210112144.cy10a_bee | 1.851 | 98.148 | 0.001 | nonzero | 0.007 | ||||||
| fbmy5635_rel_202302162102.cy10a_bee | 2.065 | 97.934 | 0.001 | nonzero | 0.006 | ||||||
| fbmy5635_rel_202304122154.cy10a_bee | 2.021 | 97.978 | 0.001 | nonzero | nonzero | 0.033 | |||||
| fbmy5635_rel_202305292102.cy10a_bee | 1.953 | 98.046 | 0.001 | nonzero | 0.009 | ||||||
| fbmy5635_rel_20230529_832.cy10a_bee | 1.781 | 98.219 | 0.001 | nonzero | 0.010 | ||||||
| fbmy5635_rel_20230529_843.cy10a_bee | 1.574 | 98.426 | 0.001 | nonzero | 0.009 | ||||||
| fbmy5635_rel_20230529_850.cy10a_bee | 1.535 | 98.464 | 0.001 | 0.003 |
Insert response time histogram: each cell has the percentage of responses that take <= the time in the header and max is the max response time in seconds. For max values in the top 25% of the range have a red background and in the bottom 25% of the range have a green background. The red background is not used when the min value is within 80% of the max value.
| dbms | 256us | 1ms | 4ms | 16ms | 64ms | 256ms | 1s | 4s | 16s | gt | max |
|---|---|---|---|---|---|---|---|---|---|---|---|
| fbmy5635_rel_202104072149.cy10a_bee | 99.444 | 0.556 | 0.014 | ||||||||
| fbmy5635_rel_202203072101.cy10a_bee | 99.597 | 0.403 | 0.008 | ||||||||
| fbmy5635_rel_202205192101.cy10a_bee | 99.472 | 0.528 | 0.013 | ||||||||
| fbmy5635_rel_202208092101.cy10a_bee | 99.500 | 0.500 | 0.014 | ||||||||
| fbmy5635_rel_202210112144.cy10a_bee | 99.431 | 0.569 | 0.015 | ||||||||
| fbmy5635_rel_202302162102.cy10a_bee | 99.542 | 0.458 | 0.009 | ||||||||
| fbmy5635_rel_202304122154.cy10a_bee | 99.514 | 0.486 | 0.009 | ||||||||
| fbmy5635_rel_202305292102.cy10a_bee | 99.528 | 0.472 | 0.009 | ||||||||
| fbmy5635_rel_20230529_832.cy10a_bee | 99.319 | 0.681 | 0.015 | ||||||||
| fbmy5635_rel_20230529_843.cy10a_bee | 99.250 | 0.750 | 0.014 | ||||||||
| fbmy5635_rel_20230529_850.cy10a_bee | 99.444 | 0.556 | 0.015 |
Delete response time histogram: each cell has the percentage of responses that take <= the time in the header and max is the max response time in seconds. For max values in the top 25% of the range have a red background and in the bottom 25% of the range have a green background. The red background is not used when the min value is within 80% of the max value.
| dbms | 256us | 1ms | 4ms | 16ms | 64ms | 256ms | 1s | 4s | 16s | gt | max |
|---|---|---|---|---|---|---|---|---|---|---|---|
| fbmy5635_rel_202104072149.cy10a_bee | 99.403 | 0.597 | 0.015 | ||||||||
| fbmy5635_rel_202203072101.cy10a_bee | 99.542 | 0.458 | 0.009 | ||||||||
| fbmy5635_rel_202205192101.cy10a_bee | 99.417 | 0.583 | 0.012 | ||||||||
| fbmy5635_rel_202208092101.cy10a_bee | 72.083 | 27.583 | 0.333 | 0.021 | |||||||
| fbmy5635_rel_202210112144.cy10a_bee | 99.486 | 0.514 | 0.014 | ||||||||
| fbmy5635_rel_202302162102.cy10a_bee | 86.542 | 13.319 | 0.139 | 0.017 | |||||||
| fbmy5635_rel_202304122154.cy10a_bee | 86.722 | 13.097 | 0.181 | 0.017 | |||||||
| fbmy5635_rel_202305292102.cy10a_bee | 71.889 | 27.819 | 0.292 | 0.023 | |||||||
| fbmy5635_rel_20230529_832.cy10a_bee | 72.014 | 27.597 | 0.389 | 0.021 | |||||||
| fbmy5635_rel_20230529_843.cy10a_bee | 72.611 | 27.083 | 0.306 | 0.018 | |||||||
| fbmy5635_rel_20230529_850.cy10a_bee | 85.139 | 14.708 | 0.153 | 0.017 |
Performance metrics for the DBMS listed above. Some are normalized by throughput, others are not. Legend for results is here.
ips	qps	rps	rmbps	wps	wmbps	rpq	rkbpq	wpi	wkbpi	csps	cpups	cspq	cpupq	dbgb1	dbgb2	rss	maxop	p50	p99	tag
100	2719	1	0.1	4.6	0.6	0.000	0.037	0.046	6.092	10559	13.0	3.883	382	1.5	2.1	8.7	0.010	2733	2381	20m.fbmy5635_rel_202104072149.cy10a_bee
100	2697	0	0.1	4.6	0.6	0.000	0.026	0.046	6.080	10487	12.9	3.888	383	1.5	2.1	8.9	0.009	2703	2445	20m.fbmy5635_rel_202203072101.cy10a_bee
100	2643	1	0.1	4.4	0.5	0.000	0.024	0.044	5.323	10265	12.8	3.884	387	1.5	2.1	8.8	0.003	2653	2413	20m.fbmy5635_rel_202205192101.cy10a_bee
100	2631	1	0.0	6.2	0.4	0.000	0.001	0.062	4.283	10234	12.7	3.890	386	1.7	2.3	8.8	0.005	2637	2397	20m.fbmy5635_rel_202208092101.cy10a_bee
100	2628	0	0.0	6.6	0.6	0.000	0.014	0.066	6.146	10221	12.8	3.890	390	1.5	2.1	8.7	0.007	2637	2349	20m.fbmy5635_rel_202210112144.cy10a_bee
100	2638	1	0.1	4.0	0.3	0.000	0.039	0.041	3.590	10252	12.7	3.886	385	1.7	2.3	8.8	0.006	2652	2429	20m.fbmy5635_rel_202302162102.cy10a_bee
100	2670	1	0.1	4.0	0.4	0.000	0.046	0.040	3.677	10365	12.9	3.882	387	1.8	2.4	8.9	0.033	2669	2445	20m.fbmy5635_rel_202304122154.cy10a_bee
100	2674	2	0.1	4.3	0.4	0.001	0.050	0.043	4.504	10385	12.9	3.884	386	1.8	2.4	9.0	0.009	2685	2461	20m.fbmy5635_rel_202305292102.cy10a_bee
100	2718	5	0.2	4.2	0.4	0.002	0.076	0.042	4.204	10560	12.8	3.886	377	1.8	2.4	8.9	0.010	2732	2493	20m.fbmy5635_rel_20230529_832.cy10a_bee
100	2609	5	0.2	4.0	0.3	0.002	0.060	0.040	3.596	10148	12.8	3.890	392	1.9	2.5	8.8	0.009	2605	2381	20m.fbmy5635_rel_20230529_843.cy10a_bee
100	2606	1	0.1	4.2	0.5	0.000	0.054	0.042	4.630	10119	12.8	3.884	393	1.8	2.3	8.9	0.003	2620	2319	20m.fbmy5635_rel_20230529_850.cy10a_bee
q500.1
q500.1: range queries with 500 insert/s per client. Graphs for performance per 1-second interval are here.
Average throughput:
Query response time histogram: each cell has the percentage of responses that take <= the time in the header and max is the max response time in seconds. For max values in the top 25% of the range have a red background and in the bottom 25% of the range have a green background. The red background is not used when the min value is within 80% of the max value.
| dbms | 256us | 1ms | 4ms | 16ms | 64ms | 256ms | 1s | 4s | 16s | gt | max |
|---|---|---|---|---|---|---|---|---|---|---|---|
| fbmy5635_rel_202104072149.cy10a_bee | 1.283 | 98.717 | 0.001 | nonzero | 0.021 | ||||||
| fbmy5635_rel_202203072101.cy10a_bee | 1.667 | 98.332 | 0.001 | 0.003 | |||||||
| fbmy5635_rel_202205192101.cy10a_bee | 1.282 | 98.718 | nonzero | 0.004 | |||||||
| fbmy5635_rel_202208092101.cy10a_bee | 1.489 | 98.510 | 0.001 | 0.003 | |||||||
| fbmy5635_rel_202210112144.cy10a_bee | 1.453 | 98.546 | 0.001 | nonzero | 0.005 | ||||||
| fbmy5635_rel_202302162102.cy10a_bee | 1.201 | 98.798 | 0.001 | 0.003 | |||||||
| fbmy5635_rel_202304122154.cy10a_bee | 1.959 | 98.041 | 0.001 | 0.003 | |||||||
| fbmy5635_rel_202305292102.cy10a_bee | 1.459 | 98.540 | 0.001 | 0.002 | |||||||
| fbmy5635_rel_20230529_832.cy10a_bee | 1.176 | 98.823 | nonzero | 0.003 | |||||||
| fbmy5635_rel_20230529_843.cy10a_bee | 0.890 | 99.110 | nonzero | 0.003 | |||||||
| fbmy5635_rel_20230529_850.cy10a_bee | 1.591 | 98.408 | 0.001 | 0.004 |
Insert response time histogram: each cell has the percentage of responses that take <= the time in the header and max is the max response time in seconds. For max values in the top 25% of the range have a red background and in the bottom 25% of the range have a green background. The red background is not used when the min value is within 80% of the max value.
| dbms | 256us | 1ms | 4ms | 16ms | 64ms | 256ms | 1s | 4s | 16s | gt | max |
|---|---|---|---|---|---|---|---|---|---|---|---|
| fbmy5635_rel_202104072149.cy10a_bee | 99.725 | 0.272 | 0.003 | 0.049 | |||||||
| fbmy5635_rel_202203072101.cy10a_bee | 99.681 | 0.317 | 0.003 | 0.039 | |||||||
| fbmy5635_rel_202205192101.cy10a_bee | 99.711 | 0.286 | 0.003 | 0.055 | |||||||
| fbmy5635_rel_202208092101.cy10a_bee | 99.700 | 0.297 | 0.003 | 0.072 | |||||||
| fbmy5635_rel_202210112144.cy10a_bee | 99.681 | 0.317 | 0.003 | 0.058 | |||||||
| fbmy5635_rel_202302162102.cy10a_bee | 99.558 | 0.439 | 0.003 | 0.040 | |||||||
| fbmy5635_rel_202304122154.cy10a_bee | 99.631 | 0.369 | 0.014 | ||||||||
| fbmy5635_rel_202305292102.cy10a_bee | 99.600 | 0.400 | 0.015 | ||||||||
| fbmy5635_rel_20230529_832.cy10a_bee | 99.628 | 0.372 | 0.014 | ||||||||
| fbmy5635_rel_20230529_843.cy10a_bee | 99.619 | 0.378 | 0.003 | 0.040 | |||||||
| fbmy5635_rel_20230529_850.cy10a_bee | 99.608 | 0.389 | 0.003 | 0.039 |
Delete response time histogram: each cell has the percentage of responses that take <= the time in the header and max is the max response time in seconds. For max values in the top 25% of the range have a red background and in the bottom 25% of the range have a green background. The red background is not used when the min value is within 80% of the max value.
| dbms | 256us | 1ms | 4ms | 16ms | 64ms | 256ms | 1s | 4s | 16s | gt | max |
|---|---|---|---|---|---|---|---|---|---|---|---|
| fbmy5635_rel_202104072149.cy10a_bee | 99.722 | 0.275 | 0.003 | 0.048 | |||||||
| fbmy5635_rel_202203072101.cy10a_bee | 99.692 | 0.306 | 0.003 | 0.040 | |||||||
| fbmy5635_rel_202205192101.cy10a_bee | 99.711 | 0.286 | 0.003 | 0.055 | |||||||
| fbmy5635_rel_202208092101.cy10a_bee | 99.419 | 0.578 | 0.003 | 0.071 | |||||||
| fbmy5635_rel_202210112144.cy10a_bee | 99.708 | 0.286 | 0.006 | 0.058 | |||||||
| fbmy5635_rel_202302162102.cy10a_bee | 91.175 | 8.725 | 0.100 | 0.040 | |||||||
| fbmy5635_rel_202304122154.cy10a_bee | 91.025 | 8.867 | 0.108 | 0.043 | |||||||
| fbmy5635_rel_202305292102.cy10a_bee | 90.922 | 8.967 | 0.111 | 0.039 | |||||||
| fbmy5635_rel_20230529_832.cy10a_bee | 90.994 | 8.886 | 0.119 | 0.048 | |||||||
| fbmy5635_rel_20230529_843.cy10a_bee | 91.175 | 8.714 | 0.111 | 0.056 | |||||||
| fbmy5635_rel_20230529_850.cy10a_bee | 90.978 | 8.931 | 0.092 | 0.039 |
Performance metrics for the DBMS listed above. Some are normalized by throughput, others are not. Legend for results is here.
ips	qps	rps	rmbps	wps	wmbps	rpq	rkbpq	wpi	wkbpi	csps	cpups	cspq	cpupq	dbgb1	dbgb2	rss	maxop	p50	p99	tag
499	2694	0	0.0	5.3	1.0	0.000	0.000	0.011	2.010	10574	13.5	3.924	401	1.6	2.6	8.8	0.021	2701	2477	20m.fbmy5635_rel_202104072149.cy10a_bee
499	2649	0	0.0	5.9	1.2	0.000	0.000	0.012	2.441	10401	13.5	3.927	408	1.6	2.5	8.8	0.003	2653	2429	20m.fbmy5635_rel_202203072101.cy10a_bee
499	2604	0	0.0	5.8	1.2	0.000	0.000	0.012	2.435	10230	13.4	3.928	412	1.6	2.5	8.8	0.004	2605	2397	20m.fbmy5635_rel_202205192101.cy10a_bee
499	2629	0	0.0	7.7	1.1	0.000	0.019	0.015	2.264	10344	13.4	3.935	408	1.6	2.5	8.7	0.003	2637	2413	20m.fbmy5635_rel_202208092101.cy10a_bee
499	2608	0	0.0	7.5	1.0	0.000	0.000	0.015	2.138	10263	13.4	3.934	411	1.6	2.6	8.8	0.005	2620	2413	20m.fbmy5635_rel_202210112144.cy10a_bee
499	2621	3	0.0	5.2	0.9	0.001	0.006	0.010	1.835	10297	13.4	3.928	409	1.7	2.7	8.7	0.003	2621	2414	20m.fbmy5635_rel_202302162102.cy10a_bee
499	2624	3	0.0	5.3	0.9	0.001	0.008	0.011	1.934	10303	13.5	3.926	412	1.7	2.7	8.8	0.003	2637	2429	20m.fbmy5635_rel_202304122154.cy10a_bee
499	2615	3	0.0	5.1	0.8	0.001	0.006	0.010	1.732	10272	13.4	3.928	410	1.7	2.7	8.7	0.002	2621	2413	20m.fbmy5635_rel_202305292102.cy10a_bee
499	2601	3	0.0	5.2	0.9	0.001	0.006	0.010	1.819	10225	13.4	3.931	412	1.7	2.7	8.8	0.003	2605	2413	20m.fbmy5635_rel_20230529_832.cy10a_bee
499	2597	3	0.0	5.2	0.9	0.001	0.007	0.010	1.790	10237	13.4	3.941	413	1.7	2.7	8.6	0.003	2605	2413	20m.fbmy5635_rel_20230529_843.cy10a_bee
499	2584	3	0.0	5.0	0.8	0.001	0.006	0.010	1.714	10151	13.4	3.929	415	1.8	2.7	8.8	0.004	2588	2397	20m.fbmy5635_rel_20230529_850.cy10a_bee
q1000.1
q1000.1: range queries with 1000 insert/s per client. Graphs for performance per 1-second interval are here.
Average throughput:
Query response time histogram: each cell has the percentage of responses that take <= the time in the header and max is the max response time in seconds. For max values in the top 25% of the range have a red background and in the bottom 25% of the range have a green background. The red background is not used when the min value is within 80% of the max value.
| dbms | 256us | 1ms | 4ms | 16ms | 64ms | 256ms | 1s | 4s | 16s | gt | max |
|---|---|---|---|---|---|---|---|---|---|---|---|
| fbmy5635_rel_202104072149.cy10a_bee | 2.035 | 97.964 | 0.001 | 0.004 | |||||||
| fbmy5635_rel_202203072101.cy10a_bee | 1.518 | 98.481 | 0.001 | nonzero | 0.005 | ||||||
| fbmy5635_rel_202205192101.cy10a_bee | 1.428 | 98.570 | 0.001 | nonzero | 0.010 | ||||||
| fbmy5635_rel_202208092101.cy10a_bee | 1.718 | 98.280 | 0.001 | 0.004 | |||||||
| fbmy5635_rel_202210112144.cy10a_bee | 1.751 | 98.248 | 0.001 | nonzero | 0.005 | ||||||
| fbmy5635_rel_202302162102.cy10a_bee | 1.793 | 98.206 | 0.001 | 0.003 | |||||||
| fbmy5635_rel_202304122154.cy10a_bee | 1.846 | 98.153 | 0.001 | 0.004 | |||||||
| fbmy5635_rel_202305292102.cy10a_bee | 2.142 | 97.857 | 0.001 | nonzero | 0.018 | ||||||
| fbmy5635_rel_20230529_832.cy10a_bee | 1.601 | 98.398 | 0.001 | nonzero | 0.007 | ||||||
| fbmy5635_rel_20230529_843.cy10a_bee | 1.840 | 98.159 | 0.001 | 0.003 | |||||||
| fbmy5635_rel_20230529_850.cy10a_bee | 1.723 | 98.276 | 0.001 | nonzero | 0.004 |
Insert response time histogram: each cell has the percentage of responses that take <= the time in the header and max is the max response time in seconds. For max values in the top 25% of the range have a red background and in the bottom 25% of the range have a green background. The red background is not used when the min value is within 80% of the max value.
| dbms | 256us | 1ms | 4ms | 16ms | 64ms | 256ms | 1s | 4s | 16s | gt | max |
|---|---|---|---|---|---|---|---|---|---|---|---|
| fbmy5635_rel_202104072149.cy10a_bee | 99.714 | 0.283 | 0.003 | 0.049 | |||||||
| fbmy5635_rel_202203072101.cy10a_bee | 99.728 | 0.269 | 0.003 | 0.049 | |||||||
| fbmy5635_rel_202205192101.cy10a_bee | 99.708 | 0.289 | 0.003 | 0.048 | |||||||
| fbmy5635_rel_202208092101.cy10a_bee | 99.703 | 0.293 | 0.004 | 0.056 | |||||||
| fbmy5635_rel_202210112144.cy10a_bee | 99.715 | 0.282 | 0.001 | 0.001 | 0.068 | ||||||
| fbmy5635_rel_202302162102.cy10a_bee | 99.692 | 0.306 | 0.003 | 0.039 | |||||||
| fbmy5635_rel_202304122154.cy10a_bee | 99.692 | 0.308 | 0.014 | ||||||||
| fbmy5635_rel_202305292102.cy10a_bee | 99.671 | 0.326 | 0.003 | 0.041 | |||||||
| fbmy5635_rel_20230529_832.cy10a_bee | 99.678 | 0.321 | 0.001 | 0.058 | |||||||
| fbmy5635_rel_20230529_843.cy10a_bee | 99.669 | 0.328 | 0.003 | 0.038 | |||||||
| fbmy5635_rel_20230529_850.cy10a_bee | 99.690 | 0.308 | 0.001 | 0.055 |
Delete response time histogram: each cell has the percentage of responses that take <= the time in the header and max is the max response time in seconds. For max values in the top 25% of the range have a red background and in the bottom 25% of the range have a green background. The red background is not used when the min value is within 80% of the max value.
| dbms | 256us | 1ms | 4ms | 16ms | 64ms | 256ms | 1s | 4s | 16s | gt | max |
|---|---|---|---|---|---|---|---|---|---|---|---|
| fbmy5635_rel_202104072149.cy10a_bee | 98.662 | 1.324 | 0.014 | 0.049 | |||||||
| fbmy5635_rel_202203072101.cy10a_bee | 98.578 | 1.406 | 0.017 | 0.056 | |||||||
| fbmy5635_rel_202205192101.cy10a_bee | 99.200 | 0.783 | 0.017 | 0.049 | |||||||
| fbmy5635_rel_202208092101.cy10a_bee | 99.272 | 0.724 | 0.004 | 0.056 | |||||||
| fbmy5635_rel_202210112144.cy10a_bee | 99.729 | 0.267 | 0.003 | 0.001 | 0.067 | ||||||
| fbmy5635_rel_202302162102.cy10a_bee | 95.372 | 4.569 | 0.058 | 0.039 | |||||||
| fbmy5635_rel_202304122154.cy10a_bee | 95.344 | 4.603 | 0.053 | 0.039 | |||||||
| fbmy5635_rel_202305292102.cy10a_bee | 95.372 | 4.565 | 0.062 | 0.040 | |||||||
| fbmy5635_rel_20230529_832.cy10a_bee | 95.357 | 4.579 | 0.064 | 0.057 | |||||||
| fbmy5635_rel_20230529_843.cy10a_bee | 95.344 | 4.594 | 0.061 | 0.063 | |||||||
| fbmy5635_rel_20230529_850.cy10a_bee | 95.382 | 4.549 | 0.069 | 0.054 |
Performance metrics for the DBMS listed above. Some are normalized by throughput, others are not. Legend for results is here.
ips	qps	rps	rmbps	wps	wmbps	rpq	rkbpq	wpi	wkbpi	csps	cpups	cspq	cpupq	dbgb1	dbgb2	rss	maxop	p50	p99	tag
998	2686	2	0.0	8.5	2.3	0.001	0.003	0.009	2.331	10738	14.8	3.998	441	1.6	3.4	8.8	0.004	2685	2461	20m.fbmy5635_rel_202104072149.cy10a_bee
998	2626	2	0.1	8.1	2.1	0.001	0.041	0.008	2.205	10511	14.7	4.003	448	1.7	3.4	9.0	0.005	2623	2413	20m.fbmy5635_rel_202203072101.cy10a_bee
998	2606	2	0.1	7.9	2.1	0.001	0.042	0.008	2.172	10430	14.8	4.003	454	1.6	3.3	9.1	0.010	2605	2397	20m.fbmy5635_rel_202205192101.cy10a_bee
998	2621	2	0.1	10.2	2.2	0.001	0.044	0.010	2.264	10506	14.7	4.009	449	1.6	3.4	8.9	0.004	2621	2413	20m.fbmy5635_rel_202208092101.cy10a_bee
999	2605	1	0.1	10.3	2.3	0.000	0.030	0.010	2.312	10448	14.8	4.010	454	1.6	3.3	8.9	0.005	2605	2413	20m.fbmy5635_rel_202210112144.cy10a_bee
998	2623	6	0.0	7.3	1.8	0.002	0.012	0.007	1.802	10500	14.7	4.003	448	1.7	3.5	8.8	0.003	2621	2429	20m.fbmy5635_rel_202302162102.cy10a_bee
998	2594	6	0.0	7.1	1.7	0.002	0.012	0.007	1.700	10383	14.6	4.003	450	1.8	3.5	8.7	0.004	2589	2397	20m.fbmy5635_rel_202304122154.cy10a_bee
998	2612	6	0.0	7.1	1.7	0.002	0.013	0.007	1.792	10468	14.8	4.008	453	1.8	3.5	8.8	0.018	2605	2413	20m.fbmy5635_rel_202305292102.cy10a_bee
998	2599	6	0.0	7.1	1.7	0.002	0.018	0.007	1.734	10412	14.7	4.005	452	1.7	3.5	8.8	0.007	2605	2397	20m.fbmy5635_rel_20230529_832.cy10a_bee
998	2589	6	0.0	7.6	1.8	0.003	0.014	0.008	1.877	10377	14.8	4.008	457	1.9	3.6	8.9	0.003	2589	2397	20m.fbmy5635_rel_20230529_843.cy10a_bee
998	2575	12	0.1	7.2	1.8	0.005	0.024	0.007	1.798	10310	14.7	4.003	457	1.7	3.5	8.8	0.004	2573	2381	20m.fbmy5635_rel_20230529_850.cy10a_bee
l.i0
l.i0: load without secondary indexes
Performance metrics for all DBMS, not just the ones listed above. Some are normalized by throughput, others are not. Legend for results is here.
ips	qps	rps	rmbps	wps	wmbps	rpq	rkbpq	wpi	wkbpi	csps	cpups	cspq	cpupq	dbgb1	dbgb2	rss	maxop	p50	p99	tag
81301	0	0	0.0	36.9	13.8	0.000	0.000	0.000	0.174	7991	23.2	0.098	23	0.7	1.8	0.2	0.112	82006	73618	20m.fbmy5635_rel_202104072149.cy10a_bee
79681	0	0	0.0	35.9	13.5	0.000	0.000	0.000	0.174	7829	23.1	0.098	23	0.7	1.8	0.2	0.109	80408	72917	20m.fbmy5635_rel_202203072101.cy10a_bee
78431	0	0	0.0	35.5	13.2	0.000	0.000	0.000	0.173	7673	22.7	0.098	23	0.7	1.8	0.2	0.071	78809	72116	20m.fbmy5635_rel_202205192101.cy10a_bee
78125	0	0	0.0	37.7	13.2	0.000	0.000	0.000	0.174	7662	22.7	0.098	23	0.7	1.8	0.2	0.070	78713	70920	20m.fbmy5635_rel_202208092101.cy10a_bee
77220	0	0	0.0	37.2	13.1	0.000	0.000	0.000	0.173	7613	22.6	0.099	23	0.7	1.8	0.2	0.072	78251	70719	20m.fbmy5635_rel_202210112144.cy10a_bee
78125	0	0	0.0	35.4	13.2	0.000	0.000	0.000	0.173	7671	22.6	0.098	23	0.7	1.8	0.2	0.098	78810	70520	20m.fbmy5635_rel_202302162102.cy10a_bee
77220	0	0	0.0	35.0	13.0	0.000	0.000	0.000	0.173	7553	22.4	0.098	23	0.7	1.8	0.2	0.071	77613	70919	20m.fbmy5635_rel_202304122154.cy10a_bee
75758	0	0	0.0	34.7	12.8	0.000	0.000	0.000	0.173	7472	21.8	0.099	23	0.7	1.8	0.2	0.065	76715	69920	20m.fbmy5635_rel_202305292102.cy10a_bee
75758	0	0	0.0	35.3	12.8	0.000	0.000	0.000	0.173	7475	21.7	0.099	23	0.7	1.8	0.2	0.066	76415	69954	20m.fbmy5635_rel_20230529_832.cy10a_bee
77220	0	0	0.0	35.2	13.1	0.000	0.000	0.000	0.173	7573	22.7	0.098	24	0.7	1.8	0.2	0.069	78010	70420	20m.fbmy5635_rel_20230529_843.cy10a_bee
76628	0	0	0.0	34.7	12.9	0.000	0.000	0.000	0.173	7511	22.4	0.098	23	0.7	1.8	0.2	0.073	77212	69420	20m.fbmy5635_rel_20230529_850.cy10a_bee
l.x
l.x: create secondary indexes
Performance metrics for all DBMS, not just the ones listed above. Some are normalized by throughput, others are not. Legend for results is here.
ips	qps	rps	rmbps	wps	wmbps	rpq	rkbpq	wpi	wkbpi	csps	cpups	cspq	cpupq	dbgb1	dbgb2	rss	maxop	p50	p99	tag
82377	0	0	0.0	29.7	12.5	0.000	0.000	0.000	0.155	244	11.8	0.003	11	1.4	2.5	1.5	0.008	NA	NA	20m.fbmy5635_rel_202104072149.cy10a_bee
83402	0	0	0.0	32.8	12.7	0.000	0.000	0.000	0.155	286	11.9	0.003	11	1.5	2.5	1.5	0.013	NA	NA	20m.fbmy5635_rel_202203072101.cy10a_bee
82377	0	0	0.0	32.2	12.5	0.000	0.000	0.000	0.155	261	11.8	0.003	11	1.5	2.5	1.5	0.007	NA	NA	20m.fbmy5635_rel_202205192101.cy10a_bee
82377	0	0	0.0	33.7	12.5	0.000	0.000	0.000	0.155	348	11.8	0.004	11	1.5	2.5	1.5	0.007	NA	NA	20m.fbmy5635_rel_202208092101.cy10a_bee
82377	0	0	0.0	33.6	12.5	0.000	0.000	0.000	0.155	325	11.9	0.004	12	1.5	2.5	1.5	0.008	NA	NA	20m.fbmy5635_rel_202210112144.cy10a_bee
81376	0	0	0.0	31.7	12.4	0.000	0.000	0.000	0.156	243	11.8	0.003	12	1.5	2.5	1.5	0.008	NA	NA	20m.fbmy5635_rel_202302162102.cy10a_bee
82041	0	0	0.0	31.8	12.5	0.000	0.000	0.000	0.156	273	11.8	0.003	12	1.5	2.5	1.5	0.008	NA	NA	20m.fbmy5635_rel_202304122154.cy10a_bee
83058	0	0	0.0	32.2	12.6	0.000	0.000	0.000	0.155	237	11.9	0.003	11	1.5	2.5	1.5	0.007	NA	NA	20m.fbmy5635_rel_202305292102.cy10a_bee
81707	0	0	0.0	31.8	12.4	0.000	0.000	0.000	0.156	276	11.8	0.003	12	1.5	2.5	1.5	0.009	NA	NA	20m.fbmy5635_rel_20230529_832.cy10a_bee
82041	0	0	0.0	32.0	12.5	0.000	0.000	0.000	0.155	259	11.8	0.003	12	1.5	2.5	1.5	0.007	NA	NA	20m.fbmy5635_rel_20230529_843.cy10a_bee
81376	0	0	0.0	31.9	12.4	0.000	0.000	0.000	0.156	265	11.8	0.003	12	1.5	2.5	1.5	0.008	NA	NA	20m.fbmy5635_rel_20230529_850.cy10a_bee
l.i1
l.i1: continue load after secondary indexes created
Performance metrics for all DBMS, not just the ones listed above. Some are normalized by throughput, others are not. Legend for results is here.
ips	qps	rps	rmbps	wps	wmbps	rpq	rkbpq	wpi	wkbpi	csps	cpups	cspq	cpupq	dbgb1	dbgb2	rss	maxop	p50	p99	tag
27012	0	63	1.7	118.3	44.5	0.002	0.064	0.004	1.687	11540	45.6	0.427	135	2.4	3.0	8.3	0.090	26970	24423	20m.fbmy5635_rel_202104072149.cy10a_bee
26490	0	68	1.2	115.1	43.8	0.003	0.048	0.004	1.693	11380	45.1	0.430	136	2.1	2.6	8.4	0.151	26471	23785	20m.fbmy5635_rel_202203072101.cy10a_bee
26014	0	64	0.8	113.3	43.3	0.002	0.033	0.004	1.705	11163	45.0	0.429	138	1.9	2.4	8.4	0.081	26021	23285	20m.fbmy5635_rel_202205192101.cy10a_bee
26110	0	55	0.9	115.4	43.2	0.002	0.037	0.004	1.695	11192	44.8	0.429	137	2.4	2.9	8.3	0.117	26087	23473	20m.fbmy5635_rel_202208092101.cy10a_bee
26035	0	49	0.9	115.1	43.3	0.002	0.036	0.004	1.704	11155	45.1	0.428	139	2.3	2.8	8.4	0.180	26070	23273	20m.fbmy5635_rel_202210112144.cy10a_bee
26774	0	88	0.9	104.5	39.5	0.003	0.036	0.004	1.512	11346	44.6	0.424	133	2.8	3.4	8.4	0.080	26769	24284	20m.fbmy5635_rel_202302162102.cy10a_bee
26716	0	82	0.9	104.0	39.3	0.003	0.033	0.004	1.507	11300	44.3	0.423	133	2.4	2.9	8.4	0.102	26671	24123	20m.fbmy5635_rel_202304122154.cy10a_bee
26511	0	82	0.8	103.8	39.3	0.003	0.031	0.004	1.519	11254	44.8	0.425	135	2.4	2.9	8.4	0.092	26471	23783	20m.fbmy5635_rel_202305292102.cy10a_bee
26469	0	130	1.2	104.5	38.8	0.005	0.047	0.004	1.501	11326	44.5	0.428	134	2.4	2.9	8.4	0.081	26421	23973	20m.fbmy5635_rel_20230529_832.cy10a_bee
26151	0	86	0.9	101.5	38.3	0.003	0.036	0.004	1.502	11114	44.7	0.425	137	2.5	3.0	8.4	0.216	26121	23423	20m.fbmy5635_rel_20230529_843.cy10a_bee
26427	0	141	0.9	103.6	38.8	0.005	0.034	0.004	1.505	11265	44.6	0.426	135	2.7	3.2	8.4	0.093	26384	23774	20m.fbmy5635_rel_20230529_850.cy10a_bee
q100.1
q100.1: range queries with 100 insert/s per client
Performance metrics for all DBMS, not just the ones listed above. Some are normalized by throughput, others are not. Legend for results is here.
ips	qps	rps	rmbps	wps	wmbps	rpq	rkbpq	wpi	wkbpi	csps	cpups	cspq	cpupq	dbgb1	dbgb2	rss	maxop	p50	p99	tag
100	2719	1	0.1	4.6	0.6	0.000	0.037	0.046	6.092	10559	13.0	3.883	382	1.5	2.1	8.7	0.010	2733	2381	20m.fbmy5635_rel_202104072149.cy10a_bee
100	2697	0	0.1	4.6	0.6	0.000	0.026	0.046	6.080	10487	12.9	3.888	383	1.5	2.1	8.9	0.009	2703	2445	20m.fbmy5635_rel_202203072101.cy10a_bee
100	2643	1	0.1	4.4	0.5	0.000	0.024	0.044	5.323	10265	12.8	3.884	387	1.5	2.1	8.8	0.003	2653	2413	20m.fbmy5635_rel_202205192101.cy10a_bee
100	2631	1	0.0	6.2	0.4	0.000	0.001	0.062	4.283	10234	12.7	3.890	386	1.7	2.3	8.8	0.005	2637	2397	20m.fbmy5635_rel_202208092101.cy10a_bee
100	2628	0	0.0	6.6	0.6	0.000	0.014	0.066	6.146	10221	12.8	3.890	390	1.5	2.1	8.7	0.007	2637	2349	20m.fbmy5635_rel_202210112144.cy10a_bee
100	2638	1	0.1	4.0	0.3	0.000	0.039	0.041	3.590	10252	12.7	3.886	385	1.7	2.3	8.8	0.006	2652	2429	20m.fbmy5635_rel_202302162102.cy10a_bee
100	2670	1	0.1	4.0	0.4	0.000	0.046	0.040	3.677	10365	12.9	3.882	387	1.8	2.4	8.9	0.033	2669	2445	20m.fbmy5635_rel_202304122154.cy10a_bee
100	2674	2	0.1	4.3	0.4	0.001	0.050	0.043	4.504	10385	12.9	3.884	386	1.8	2.4	9.0	0.009	2685	2461	20m.fbmy5635_rel_202305292102.cy10a_bee
100	2718	5	0.2	4.2	0.4	0.002	0.076	0.042	4.204	10560	12.8	3.886	377	1.8	2.4	8.9	0.010	2732	2493	20m.fbmy5635_rel_20230529_832.cy10a_bee
100	2609	5	0.2	4.0	0.3	0.002	0.060	0.040	3.596	10148	12.8	3.890	392	1.9	2.5	8.8	0.009	2605	2381	20m.fbmy5635_rel_20230529_843.cy10a_bee
100	2606	1	0.1	4.2	0.5	0.000	0.054	0.042	4.630	10119	12.8	3.884	393	1.8	2.3	8.9	0.003	2620	2319	20m.fbmy5635_rel_20230529_850.cy10a_bee
q500.1
q500.1: range queries with 500 insert/s per client
Performance metrics for all DBMS, not just the ones listed above. Some are normalized by throughput, others are not. Legend for results is here.
ips	qps	rps	rmbps	wps	wmbps	rpq	rkbpq	wpi	wkbpi	csps	cpups	cspq	cpupq	dbgb1	dbgb2	rss	maxop	p50	p99	tag
499	2694	0	0.0	5.3	1.0	0.000	0.000	0.011	2.010	10574	13.5	3.924	401	1.6	2.6	8.8	0.021	2701	2477	20m.fbmy5635_rel_202104072149.cy10a_bee
499	2649	0	0.0	5.9	1.2	0.000	0.000	0.012	2.441	10401	13.5	3.927	408	1.6	2.5	8.8	0.003	2653	2429	20m.fbmy5635_rel_202203072101.cy10a_bee
499	2604	0	0.0	5.8	1.2	0.000	0.000	0.012	2.435	10230	13.4	3.928	412	1.6	2.5	8.8	0.004	2605	2397	20m.fbmy5635_rel_202205192101.cy10a_bee
499	2629	0	0.0	7.7	1.1	0.000	0.019	0.015	2.264	10344	13.4	3.935	408	1.6	2.5	8.7	0.003	2637	2413	20m.fbmy5635_rel_202208092101.cy10a_bee
499	2608	0	0.0	7.5	1.0	0.000	0.000	0.015	2.138	10263	13.4	3.934	411	1.6	2.6	8.8	0.005	2620	2413	20m.fbmy5635_rel_202210112144.cy10a_bee
499	2621	3	0.0	5.2	0.9	0.001	0.006	0.010	1.835	10297	13.4	3.928	409	1.7	2.7	8.7	0.003	2621	2414	20m.fbmy5635_rel_202302162102.cy10a_bee
499	2624	3	0.0	5.3	0.9	0.001	0.008	0.011	1.934	10303	13.5	3.926	412	1.7	2.7	8.8	0.003	2637	2429	20m.fbmy5635_rel_202304122154.cy10a_bee
499	2615	3	0.0	5.1	0.8	0.001	0.006	0.010	1.732	10272	13.4	3.928	410	1.7	2.7	8.7	0.002	2621	2413	20m.fbmy5635_rel_202305292102.cy10a_bee
499	2601	3	0.0	5.2	0.9	0.001	0.006	0.010	1.819	10225	13.4	3.931	412	1.7	2.7	8.8	0.003	2605	2413	20m.fbmy5635_rel_20230529_832.cy10a_bee
499	2597	3	0.0	5.2	0.9	0.001	0.007	0.010	1.790	10237	13.4	3.941	413	1.7	2.7	8.6	0.003	2605	2413	20m.fbmy5635_rel_20230529_843.cy10a_bee
499	2584	3	0.0	5.0	0.8	0.001	0.006	0.010	1.714	10151	13.4	3.929	415	1.8	2.7	8.8	0.004	2588	2397	20m.fbmy5635_rel_20230529_850.cy10a_bee
q1000.1
q1000.1: range queries with 1000 insert/s per client
Performance metrics for all DBMS, not just the ones listed above. Some are normalized by throughput, others are not. Legend for results is here.
ips	qps	rps	rmbps	wps	wmbps	rpq	rkbpq	wpi	wkbpi	csps	cpups	cspq	cpupq	dbgb1	dbgb2	rss	maxop	p50	p99	tag
998	2686	2	0.0	8.5	2.3	0.001	0.003	0.009	2.331	10738	14.8	3.998	441	1.6	3.4	8.8	0.004	2685	2461	20m.fbmy5635_rel_202104072149.cy10a_bee
998	2626	2	0.1	8.1	2.1	0.001	0.041	0.008	2.205	10511	14.7	4.003	448	1.7	3.4	9.0	0.005	2623	2413	20m.fbmy5635_rel_202203072101.cy10a_bee
998	2606	2	0.1	7.9	2.1	0.001	0.042	0.008	2.172	10430	14.8	4.003	454	1.6	3.3	9.1	0.010	2605	2397	20m.fbmy5635_rel_202205192101.cy10a_bee
998	2621	2	0.1	10.2	2.2	0.001	0.044	0.010	2.264	10506	14.7	4.009	449	1.6	3.4	8.9	0.004	2621	2413	20m.fbmy5635_rel_202208092101.cy10a_bee
999	2605	1	0.1	10.3	2.3	0.000	0.030	0.010	2.312	10448	14.8	4.010	454	1.6	3.3	8.9	0.005	2605	2413	20m.fbmy5635_rel_202210112144.cy10a_bee
998	2623	6	0.0	7.3	1.8	0.002	0.012	0.007	1.802	10500	14.7	4.003	448	1.7	3.5	8.8	0.003	2621	2429	20m.fbmy5635_rel_202302162102.cy10a_bee
998	2594	6	0.0	7.1	1.7	0.002	0.012	0.007	1.700	10383	14.6	4.003	450	1.8	3.5	8.7	0.004	2589	2397	20m.fbmy5635_rel_202304122154.cy10a_bee
998	2612	6	0.0	7.1	1.7	0.002	0.013	0.007	1.792	10468	14.8	4.008	453	1.8	3.5	8.8	0.018	2605	2413	20m.fbmy5635_rel_202305292102.cy10a_bee
998	2599	6	0.0	7.1	1.7	0.002	0.018	0.007	1.734	10412	14.7	4.005	452	1.7	3.5	8.8	0.007	2605	2397	20m.fbmy5635_rel_20230529_832.cy10a_bee
998	2589	6	0.0	7.6	1.8	0.003	0.014	0.008	1.877	10377	14.8	4.008	457	1.9	3.6	8.9	0.003	2589	2397	20m.fbmy5635_rel_20230529_843.cy10a_bee
998	2575	12	0.1	7.2	1.8	0.005	0.024	0.007	1.798	10310	14.7	4.003	457	1.7	3.5	8.8	0.004	2573	2381	20m.fbmy5635_rel_20230529_850.cy10a_bee
l.i0
- l.i0: load without secondary indexes
- Legend for results is here.
- Each entry lists the percentage of responses that fit in that bucket (slower than max time for previous bucket, faster than min time for next bucket).
Insert response time histogram
256us	1ms	4ms	16ms	64ms	256ms	1s	4s	16s	gt	max	tag
0.000	0.001	99.873	0.122	0.002	0.002	0.000	0.000	0.000	0.000	0.112	fbmy5635_rel_202104072149.cy10a_bee
0.000	0.000	99.870	0.125	0.003	0.002	0.000	0.000	0.000	0.000	0.109	fbmy5635_rel_202203072101.cy10a_bee
0.000	0.000	99.870	0.126	0.004	0.001	0.000	0.000	0.000	0.000	0.071	fbmy5635_rel_202205192101.cy10a_bee
0.000	0.000	99.868	0.129	0.003	0.001	0.000	0.000	0.000	0.000	0.070	fbmy5635_rel_202208092101.cy10a_bee
0.000	0.000	99.868	0.128	0.003	0.002	0.000	0.000	0.000	0.000	0.072	fbmy5635_rel_202210112144.cy10a_bee
0.000	0.000	99.869	0.127	0.003	0.002	0.000	0.000	0.000	0.000	0.098	fbmy5635_rel_202302162102.cy10a_bee
0.000	0.000	99.867	0.128	0.004	0.001	0.000	0.000	0.000	0.000	0.071	fbmy5635_rel_202304122154.cy10a_bee
0.000	0.000	99.865	0.131	0.004	0.001	0.000	0.000	0.000	0.000	0.065	fbmy5635_rel_202305292102.cy10a_bee
0.000	0.000	99.865	0.131	0.003	0.002	0.000	0.000	0.000	0.000	0.066	fbmy5635_rel_20230529_832.cy10a_bee
0.000	0.000	99.867	0.128	0.005	0.001	0.000	0.000	0.000	0.000	0.069	fbmy5635_rel_20230529_843.cy10a_bee
0.000	0.000	99.866	0.131	0.002	0.002	0.000	0.000	0.000	0.000	0.073	fbmy5635_rel_20230529_850.cy10a_bee
l.x
- l.x: create secondary indexes
- Legend for results is here.
- Each entry lists the percentage of responses that fit in that bucket (slower than max time for previous bucket, faster than min time for next bucket).
TODO - determine whether there is data for create index response time
l.i1
- l.i1: continue load after secondary indexes created
- Legend for results is here.
- Each entry lists the percentage of responses that fit in that bucket (slower than max time for previous bucket, faster than min time for next bucket).
Insert response time histogram
256us	1ms	4ms	16ms	64ms	256ms	1s	4s	16s	gt	max	tag
0.000	0.000	99.808	0.186	0.003	0.002	0.000	0.000	0.000	0.000	0.090	fbmy5635_rel_202104072149.cy10a_bee
0.000	0.000	99.804	0.186	0.008	0.002	0.000	0.000	0.000	0.000	0.151	fbmy5635_rel_202203072101.cy10a_bee
0.000	0.000	99.803	0.192	0.003	0.002	0.000	0.000	0.000	0.000	0.081	fbmy5635_rel_202205192101.cy10a_bee
0.000	0.000	99.801	0.194	0.002	0.003	0.000	0.000	0.000	0.000	0.117	fbmy5635_rel_202208092101.cy10a_bee
0.000	0.000	99.803	0.188	0.006	0.003	0.000	0.000	0.000	0.000	0.180	fbmy5635_rel_202210112144.cy10a_bee
0.000	0.000	99.809	0.186	0.004	0.001	0.000	0.000	0.000	0.000	0.080	fbmy5635_rel_202302162102.cy10a_bee
0.000	0.000	99.808	0.188	0.003	0.002	0.000	0.000	0.000	0.000	0.102	fbmy5635_rel_202304122154.cy10a_bee
0.000	0.000	99.807	0.188	0.004	0.001	0.000	0.000	0.000	0.000	0.092	fbmy5635_rel_202305292102.cy10a_bee
0.000	0.000	99.804	0.191	0.003	0.001	0.000	0.000	0.000	0.000	0.081	fbmy5635_rel_20230529_832.cy10a_bee
0.000	0.000	99.802	0.187	0.009	0.002	0.000	0.000	0.000	0.000	0.216	fbmy5635_rel_20230529_843.cy10a_bee
0.000	0.000	99.803	0.192	0.003	0.002	0.000	0.000	0.000	0.000	0.093	fbmy5635_rel_20230529_850.cy10a_bee
Delete response time histogram
256us	1ms	4ms	16ms	64ms	256ms	1s	4s	16s	gt	max	tag
0.000	0.000	99.801	0.189	0.008	0.002	0.000	0.000	0.000	0.000	0.090	fbmy5635_rel_202104072149.cy10a_bee
0.000	0.000	99.791	0.193	0.014	0.002	0.000	0.000	0.000	0.000	0.150	fbmy5635_rel_202203072101.cy10a_bee
0.000	0.000	99.793	0.196	0.009	0.002	0.000	0.000	0.000	0.000	0.082	fbmy5635_rel_202205192101.cy10a_bee
0.000	0.000	99.795	0.195	0.007	0.003	0.000	0.000	0.000	0.000	0.117	fbmy5635_rel_202208092101.cy10a_bee
0.000	0.000	99.795	0.191	0.011	0.003	0.000	0.000	0.000	0.000	0.180	fbmy5635_rel_202210112144.cy10a_bee
0.000	0.000	99.800	0.191	0.008	0.001	0.000	0.000	0.000	0.000	0.080	fbmy5635_rel_202302162102.cy10a_bee
0.000	0.000	99.798	0.195	0.006	0.002	0.000	0.000	0.000	0.000	0.102	fbmy5635_rel_202304122154.cy10a_bee
0.000	0.000	99.796	0.194	0.008	0.001	0.000	0.000	0.000	0.000	0.092	fbmy5635_rel_202305292102.cy10a_bee
0.000	0.000	99.794	0.197	0.007	0.001	0.000	0.000	0.000	0.000	0.081	fbmy5635_rel_20230529_832.cy10a_bee
0.000	0.000	99.796	0.190	0.013	0.002	0.000	0.000	0.000	0.000	0.216	fbmy5635_rel_20230529_843.cy10a_bee
0.000	0.000	99.794	0.197	0.007	0.001	0.000	0.000	0.000	0.000	0.093	fbmy5635_rel_20230529_850.cy10a_bee
q100.1
- q100.1: range queries with 100 insert/s per client
- Legend for results is here.
- Each entry lists the percentage of responses that fit in that bucket (slower than max time for previous bucket, faster than min time for next bucket).
Query response time histogram
256us	1ms	4ms	16ms	64ms	256ms	1s	4s	16s	gt	max	tag
3.040	96.958	0.001	0.002	0.000	0.000	0.000	0.000	0.000	0.000	0.010	fbmy5635_rel_202104072149.cy10a_bee
2.315	97.684	0.001	nonzero	0.000	0.000	0.000	0.000	0.000	0.000	0.009	fbmy5635_rel_202203072101.cy10a_bee
1.291	98.708	0.001	0.000	0.000	0.000	0.000	0.000	0.000	0.000	0.003	fbmy5635_rel_202205192101.cy10a_bee
1.874	98.125	0.001	nonzero	0.000	0.000	0.000	0.000	0.000	0.000	0.005	fbmy5635_rel_202208092101.cy10a_bee
1.851	98.148	0.001	nonzero	0.000	0.000	0.000	0.000	0.000	0.000	0.007	fbmy5635_rel_202210112144.cy10a_bee
2.065	97.934	0.001	nonzero	0.000	0.000	0.000	0.000	0.000	0.000	0.006	fbmy5635_rel_202302162102.cy10a_bee
2.021	97.978	0.001	nonzero	nonzero	0.000	0.000	0.000	0.000	0.000	0.033	fbmy5635_rel_202304122154.cy10a_bee
1.953	98.046	0.001	nonzero	0.000	0.000	0.000	0.000	0.000	0.000	0.009	fbmy5635_rel_202305292102.cy10a_bee
1.781	98.219	0.001	nonzero	0.000	0.000	0.000	0.000	0.000	0.000	0.010	fbmy5635_rel_20230529_832.cy10a_bee
1.574	98.426	0.001	nonzero	0.000	0.000	0.000	0.000	0.000	0.000	0.009	fbmy5635_rel_20230529_843.cy10a_bee
1.535	98.464	0.001	0.000	0.000	0.000	0.000	0.000	0.000	0.000	0.003	fbmy5635_rel_20230529_850.cy10a_bee
Insert response time histogram
256us	1ms	4ms	16ms	64ms	256ms	1s	4s	16s	gt	max	tag
0.000	0.000	99.444	0.556	0.000	0.000	0.000	0.000	0.000	0.000	0.014	fbmy5635_rel_202104072149.cy10a_bee
0.000	0.000	99.597	0.403	0.000	0.000	0.000	0.000	0.000	0.000	0.008	fbmy5635_rel_202203072101.cy10a_bee
0.000	0.000	99.472	0.528	0.000	0.000	0.000	0.000	0.000	0.000	0.013	fbmy5635_rel_202205192101.cy10a_bee
0.000	0.000	99.500	0.500	0.000	0.000	0.000	0.000	0.000	0.000	0.014	fbmy5635_rel_202208092101.cy10a_bee
0.000	0.000	99.431	0.569	0.000	0.000	0.000	0.000	0.000	0.000	0.015	fbmy5635_rel_202210112144.cy10a_bee
0.000	0.000	99.542	0.458	0.000	0.000	0.000	0.000	0.000	0.000	0.009	fbmy5635_rel_202302162102.cy10a_bee
0.000	0.000	99.514	0.486	0.000	0.000	0.000	0.000	0.000	0.000	0.009	fbmy5635_rel_202304122154.cy10a_bee
0.000	0.000	99.528	0.472	0.000	0.000	0.000	0.000	0.000	0.000	0.009	fbmy5635_rel_202305292102.cy10a_bee
0.000	0.000	99.319	0.681	0.000	0.000	0.000	0.000	0.000	0.000	0.015	fbmy5635_rel_20230529_832.cy10a_bee
0.000	0.000	99.250	0.750	0.000	0.000	0.000	0.000	0.000	0.000	0.014	fbmy5635_rel_20230529_843.cy10a_bee
0.000	0.000	99.444	0.556	0.000	0.000	0.000	0.000	0.000	0.000	0.015	fbmy5635_rel_20230529_850.cy10a_bee
Delete response time histogram
256us	1ms	4ms	16ms	64ms	256ms	1s	4s	16s	gt	max	tag
0.000	0.000	99.403	0.597	0.000	0.000	0.000	0.000	0.000	0.000	0.015	fbmy5635_rel_202104072149.cy10a_bee
0.000	0.000	99.542	0.458	0.000	0.000	0.000	0.000	0.000	0.000	0.009	fbmy5635_rel_202203072101.cy10a_bee
0.000	0.000	99.417	0.583	0.000	0.000	0.000	0.000	0.000	0.000	0.012	fbmy5635_rel_202205192101.cy10a_bee
0.000	0.000	72.083	27.583	0.333	0.000	0.000	0.000	0.000	0.000	0.021	fbmy5635_rel_202208092101.cy10a_bee
0.000	0.000	99.486	0.514	0.000	0.000	0.000	0.000	0.000	0.000	0.014	fbmy5635_rel_202210112144.cy10a_bee
0.000	0.000	86.542	13.319	0.139	0.000	0.000	0.000	0.000	0.000	0.017	fbmy5635_rel_202302162102.cy10a_bee
0.000	0.000	86.722	13.097	0.181	0.000	0.000	0.000	0.000	0.000	0.017	fbmy5635_rel_202304122154.cy10a_bee
0.000	0.000	71.889	27.819	0.292	0.000	0.000	0.000	0.000	0.000	0.023	fbmy5635_rel_202305292102.cy10a_bee
0.000	0.000	72.014	27.597	0.389	0.000	0.000	0.000	0.000	0.000	0.021	fbmy5635_rel_20230529_832.cy10a_bee
0.000	0.000	72.611	27.083	0.306	0.000	0.000	0.000	0.000	0.000	0.018	fbmy5635_rel_20230529_843.cy10a_bee
0.000	0.000	85.139	14.708	0.153	0.000	0.000	0.000	0.000	0.000	0.017	fbmy5635_rel_20230529_850.cy10a_bee
q500.1
- q500.1: range queries with 500 insert/s per client
- Legend for results is here.
- Each entry lists the percentage of responses that fit in that bucket (slower than max time for previous bucket, faster than min time for next bucket).
Query response time histogram
256us	1ms	4ms	16ms	64ms	256ms	1s	4s	16s	gt	max	tag
1.283	98.717	0.001	0.000	nonzero	0.000	0.000	0.000	0.000	0.000	0.021	fbmy5635_rel_202104072149.cy10a_bee
1.667	98.332	0.001	0.000	0.000	0.000	0.000	0.000	0.000	0.000	0.003	fbmy5635_rel_202203072101.cy10a_bee
1.282	98.718	nonzero	0.000	0.000	0.000	0.000	0.000	0.000	0.000	0.004	fbmy5635_rel_202205192101.cy10a_bee
1.489	98.510	0.001	0.000	0.000	0.000	0.000	0.000	0.000	0.000	0.003	fbmy5635_rel_202208092101.cy10a_bee
1.453	98.546	0.001	nonzero	0.000	0.000	0.000	0.000	0.000	0.000	0.005	fbmy5635_rel_202210112144.cy10a_bee
1.201	98.798	0.001	0.000	0.000	0.000	0.000	0.000	0.000	0.000	0.003	fbmy5635_rel_202302162102.cy10a_bee
1.959	98.041	0.001	0.000	0.000	0.000	0.000	0.000	0.000	0.000	0.003	fbmy5635_rel_202304122154.cy10a_bee
1.459	98.540	0.001	0.000	0.000	0.000	0.000	0.000	0.000	0.000	0.002	fbmy5635_rel_202305292102.cy10a_bee
1.176	98.823	nonzero	0.000	0.000	0.000	0.000	0.000	0.000	0.000	0.003	fbmy5635_rel_20230529_832.cy10a_bee
0.890	99.110	nonzero	0.000	0.000	0.000	0.000	0.000	0.000	0.000	0.003	fbmy5635_rel_20230529_843.cy10a_bee
1.591	98.408	0.001	0.000	0.000	0.000	0.000	0.000	0.000	0.000	0.004	fbmy5635_rel_20230529_850.cy10a_bee
Insert response time histogram
256us	1ms	4ms	16ms	64ms	256ms	1s	4s	16s	gt	max	tag
0.000	0.000	99.725	0.272	0.003	0.000	0.000	0.000	0.000	0.000	0.049	fbmy5635_rel_202104072149.cy10a_bee
0.000	0.000	99.681	0.317	0.003	0.000	0.000	0.000	0.000	0.000	0.039	fbmy5635_rel_202203072101.cy10a_bee
0.000	0.000	99.711	0.286	0.003	0.000	0.000	0.000	0.000	0.000	0.055	fbmy5635_rel_202205192101.cy10a_bee
0.000	0.000	99.700	0.297	0.000	0.003	0.000	0.000	0.000	0.000	0.072	fbmy5635_rel_202208092101.cy10a_bee
0.000	0.000	99.681	0.317	0.003	0.000	0.000	0.000	0.000	0.000	0.058	fbmy5635_rel_202210112144.cy10a_bee
0.000	0.000	99.558	0.439	0.003	0.000	0.000	0.000	0.000	0.000	0.040	fbmy5635_rel_202302162102.cy10a_bee
0.000	0.000	99.631	0.369	0.000	0.000	0.000	0.000	0.000	0.000	0.014	fbmy5635_rel_202304122154.cy10a_bee
0.000	0.000	99.600	0.400	0.000	0.000	0.000	0.000	0.000	0.000	0.015	fbmy5635_rel_202305292102.cy10a_bee
0.000	0.000	99.628	0.372	0.000	0.000	0.000	0.000	0.000	0.000	0.014	fbmy5635_rel_20230529_832.cy10a_bee
0.000	0.000	99.619	0.378	0.003	0.000	0.000	0.000	0.000	0.000	0.040	fbmy5635_rel_20230529_843.cy10a_bee
0.000	0.000	99.608	0.389	0.003	0.000	0.000	0.000	0.000	0.000	0.039	fbmy5635_rel_20230529_850.cy10a_bee
Delete response time histogram
256us	1ms	4ms	16ms	64ms	256ms	1s	4s	16s	gt	max	tag
0.000	0.000	99.722	0.275	0.003	0.000	0.000	0.000	0.000	0.000	0.048	fbmy5635_rel_202104072149.cy10a_bee
0.000	0.000	99.692	0.306	0.003	0.000	0.000	0.000	0.000	0.000	0.040	fbmy5635_rel_202203072101.cy10a_bee
0.000	0.000	99.711	0.286	0.003	0.000	0.000	0.000	0.000	0.000	0.055	fbmy5635_rel_202205192101.cy10a_bee
0.000	0.000	99.419	0.578	0.000	0.003	0.000	0.000	0.000	0.000	0.071	fbmy5635_rel_202208092101.cy10a_bee
0.000	0.000	99.708	0.286	0.006	0.000	0.000	0.000	0.000	0.000	0.058	fbmy5635_rel_202210112144.cy10a_bee
0.000	0.000	91.175	8.725	0.100	0.000	0.000	0.000	0.000	0.000	0.040	fbmy5635_rel_202302162102.cy10a_bee
0.000	0.000	91.025	8.867	0.108	0.000	0.000	0.000	0.000	0.000	0.043	fbmy5635_rel_202304122154.cy10a_bee
0.000	0.000	90.922	8.967	0.111	0.000	0.000	0.000	0.000	0.000	0.039	fbmy5635_rel_202305292102.cy10a_bee
0.000	0.000	90.994	8.886	0.119	0.000	0.000	0.000	0.000	0.000	0.048	fbmy5635_rel_20230529_832.cy10a_bee
0.000	0.000	91.175	8.714	0.111	0.000	0.000	0.000	0.000	0.000	0.056	fbmy5635_rel_20230529_843.cy10a_bee
0.000	0.000	90.978	8.931	0.092	0.000	0.000	0.000	0.000	0.000	0.039	fbmy5635_rel_20230529_850.cy10a_bee
q1000.1
- q1000.1: range queries with 1000 insert/s per client
- Legend for results is here.
- Each entry lists the percentage of responses that fit in that bucket (slower than max time for previous bucket, faster than min time for next bucket).
Query response time histogram
256us	1ms	4ms	16ms	64ms	256ms	1s	4s	16s	gt	max	tag
2.035	97.964	0.001	0.000	0.000	0.000	0.000	0.000	0.000	0.000	0.004	fbmy5635_rel_202104072149.cy10a_bee
1.518	98.481	0.001	nonzero	0.000	0.000	0.000	0.000	0.000	0.000	0.005	fbmy5635_rel_202203072101.cy10a_bee
1.428	98.570	0.001	nonzero	0.000	0.000	0.000	0.000	0.000	0.000	0.010	fbmy5635_rel_202205192101.cy10a_bee
1.718	98.280	0.001	0.000	0.000	0.000	0.000	0.000	0.000	0.000	0.004	fbmy5635_rel_202208092101.cy10a_bee
1.751	98.248	0.001	nonzero	0.000	0.000	0.000	0.000	0.000	0.000	0.005	fbmy5635_rel_202210112144.cy10a_bee
1.793	98.206	0.001	0.000	0.000	0.000	0.000	0.000	0.000	0.000	0.003	fbmy5635_rel_202302162102.cy10a_bee
1.846	98.153	0.001	0.000	0.000	0.000	0.000	0.000	0.000	0.000	0.004	fbmy5635_rel_202304122154.cy10a_bee
2.142	97.857	0.001	0.000	nonzero	0.000	0.000	0.000	0.000	0.000	0.018	fbmy5635_rel_202305292102.cy10a_bee
1.601	98.398	0.001	nonzero	0.000	0.000	0.000	0.000	0.000	0.000	0.007	fbmy5635_rel_20230529_832.cy10a_bee
1.840	98.159	0.001	0.000	0.000	0.000	0.000	0.000	0.000	0.000	0.003	fbmy5635_rel_20230529_843.cy10a_bee
1.723	98.276	0.001	nonzero	0.000	0.000	0.000	0.000	0.000	0.000	0.004	fbmy5635_rel_20230529_850.cy10a_bee
Insert response time histogram
256us	1ms	4ms	16ms	64ms	256ms	1s	4s	16s	gt	max	tag
0.000	0.000	99.714	0.283	0.003	0.000	0.000	0.000	0.000	0.000	0.049	fbmy5635_rel_202104072149.cy10a_bee
0.000	0.000	99.728	0.269	0.003	0.000	0.000	0.000	0.000	0.000	0.049	fbmy5635_rel_202203072101.cy10a_bee
0.000	0.000	99.708	0.289	0.003	0.000	0.000	0.000	0.000	0.000	0.048	fbmy5635_rel_202205192101.cy10a_bee
0.000	0.000	99.703	0.293	0.004	0.000	0.000	0.000	0.000	0.000	0.056	fbmy5635_rel_202208092101.cy10a_bee
0.000	0.000	99.715	0.282	0.001	0.001	0.000	0.000	0.000	0.000	0.068	fbmy5635_rel_202210112144.cy10a_bee
0.000	0.000	99.692	0.306	0.003	0.000	0.000	0.000	0.000	0.000	0.039	fbmy5635_rel_202302162102.cy10a_bee
0.000	0.000	99.692	0.308	0.000	0.000	0.000	0.000	0.000	0.000	0.014	fbmy5635_rel_202304122154.cy10a_bee
0.000	0.000	99.671	0.326	0.003	0.000	0.000	0.000	0.000	0.000	0.041	fbmy5635_rel_202305292102.cy10a_bee
0.000	0.000	99.678	0.321	0.001	0.000	0.000	0.000	0.000	0.000	0.058	fbmy5635_rel_20230529_832.cy10a_bee
0.000	0.000	99.669	0.328	0.003	0.000	0.000	0.000	0.000	0.000	0.038	fbmy5635_rel_20230529_843.cy10a_bee
0.000	0.000	99.690	0.308	0.001	0.000	0.000	0.000	0.000	0.000	0.055	fbmy5635_rel_20230529_850.cy10a_bee
Delete response time histogram
256us	1ms	4ms	16ms	64ms	256ms	1s	4s	16s	gt	max	tag
0.000	0.000	98.662	1.324	0.014	0.000	0.000	0.000	0.000	0.000	0.049	fbmy5635_rel_202104072149.cy10a_bee
0.000	0.000	98.578	1.406	0.017	0.000	0.000	0.000	0.000	0.000	0.056	fbmy5635_rel_202203072101.cy10a_bee
0.000	0.000	99.200	0.783	0.017	0.000	0.000	0.000	0.000	0.000	0.049	fbmy5635_rel_202205192101.cy10a_bee
0.000	0.000	99.272	0.724	0.004	0.000	0.000	0.000	0.000	0.000	0.056	fbmy5635_rel_202208092101.cy10a_bee
0.000	0.000	99.729	0.267	0.003	0.001	0.000	0.000	0.000	0.000	0.067	fbmy5635_rel_202210112144.cy10a_bee
0.000	0.000	95.372	4.569	0.058	0.000	0.000	0.000	0.000	0.000	0.039	fbmy5635_rel_202302162102.cy10a_bee
0.000	0.000	95.344	4.603	0.053	0.000	0.000	0.000	0.000	0.000	0.039	fbmy5635_rel_202304122154.cy10a_bee
0.000	0.000	95.372	4.565	0.062	0.000	0.000	0.000	0.000	0.000	0.040	fbmy5635_rel_202305292102.cy10a_bee
0.000	0.000	95.357	4.579	0.064	0.000	0.000	0.000	0.000	0.000	0.057	fbmy5635_rel_20230529_832.cy10a_bee
0.000	0.000	95.344	4.594	0.061	0.000	0.000	0.000	0.000	0.000	0.063	fbmy5635_rel_20230529_843.cy10a_bee
0.000	0.000	95.382	4.549	0.069	0.000	0.000	0.000	0.000	0.000	0.054	fbmy5635_rel_20230529_850.cy10a_bee