Introduction
This is a report for the insert benchmark with 4000M docs and 8 client(s). It is generated by scripts (bash, awk, sed) and Tufte might not be impressed. An overview of the insert benchmark is here and a short update is here. Below, by DBMS, I mean DBMS+version.config. An example is my8020.c10b40 where my means MySQL, 8020 is version 8.0.20 and c10b40 is the name for the configuration file.
The test server is a c2-standard-30 with 15 cores, hyperthreads disabled, 120G RAM and XFS with SW RAID 0 across 4 NVMe SSD. The benchmark was run with 8 clients and there were 1 or 3 connections per client (1 for queries or inserts without rate limits, 1+1 for rate limited inserts+deletes). It uses 8 tables, 1 per client. It loads 500M rows per table without secondary indexes, creates secondary indexes, then inserts 40M rows per table with a delete per insert to avoid growing the table. It then does 3 read+write tests for 3600s each that do queries as fast as possible with 100, 500 and then 1000 inserts/second/client concurrent with the queries. There are also deletes to match the inserts and avoid growing the table. The database is larger than memory. Clients and the DBMS share one server. The per-database configs are in the per-database subdirectories here.
The tested DBMS are:
- pg153_o3_native_lto.cx7a28_gcp_c2s30 - Postgres 15.3, o3_native_lto build, cx7a28_gcp_c2s30 config that combines a4, a12, a16, a26 (better for IO-bound workloads)
- pg154_o3_native_lto.cx7a28_gcp_c2s30 - Postgres 15.4, o3_native_lto build, cx7a28_gcp_c2s30 config that combines a4, a12, a16, a26 (better for IO-bound workloads)
- pg16beta1_o3_native_lto.cx7a28_gcp_c2s30 - Postgres 16 beta1, o3_native_lto build, cx7a28_gcp_c2s30 config that combines a4, a12, a16, a26 (better for IO-bound workloads)
- pg16beta2_o3_native_lto.cx7a28_gcp_c2s30 - Postgres 16 beta2, o3_native_lto build, cx7a28_gcp_c2s30 config that combines a4, a12, a16, a26 (better for IO-bound workloads)
- pg16beta3_o3_native_lto.cx7a28_gcp_c2s30 - Postgres 16 beta3, o3_native_lto build, cx7a28_gcp_c2s30 config that combines a4, a12, a16, a26 (better for IO-bound workloads)
Contents
- Summary
- l.i0: load without secondary indexes
- l.x: create secondary indexes
- l.i1: continue load after secondary indexes created
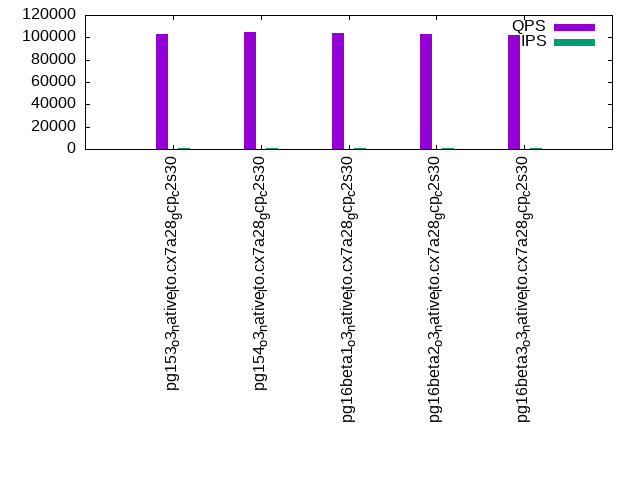
- q100.1: range queries with 100 insert/s per client
- q500.1: range queries with 500 insert/s per client
- q1000.1: range queries with 1000 insert/s per client
Summary
The numbers are inserts/s for l.i0 and l.i1, indexed docs (or rows) /s for l.x and queries/s for q*.2. The values are the average rate over the entire test for inserts (IPS) and queries (QPS). The range of values for IPS and QPS is split into 3 parts: bottom 25%, middle 50%, top 25%. Values in the bottom 25% have a red background, values in the top 25% have a green background and values in the middle have no color. A gray background is used for values that can be ignored because the DBMS did not sustain the target insert rate. Red backgrounds are not used when the minimum value is within 80% of the max value.
| dbms | l.i0 | l.x | l.i1 | q100.1 | q500.1 | q1000.1 |
|---|---|---|---|---|---|---|
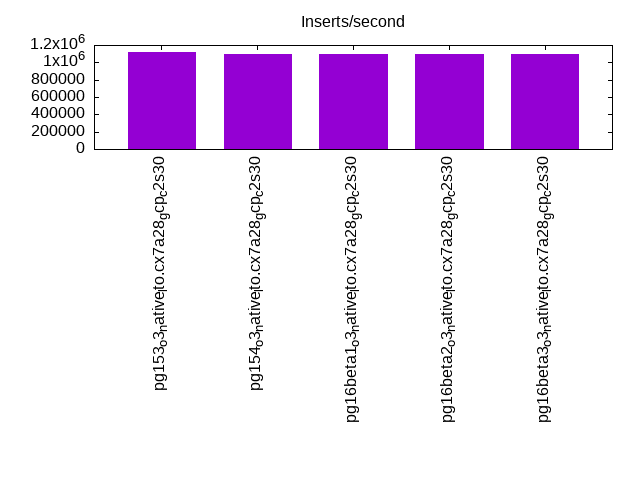
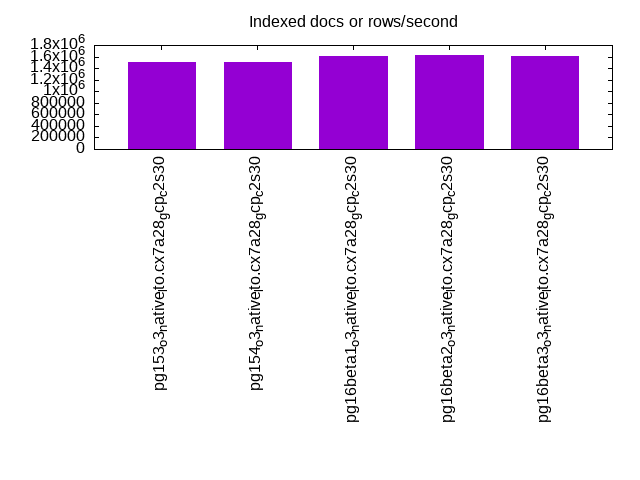
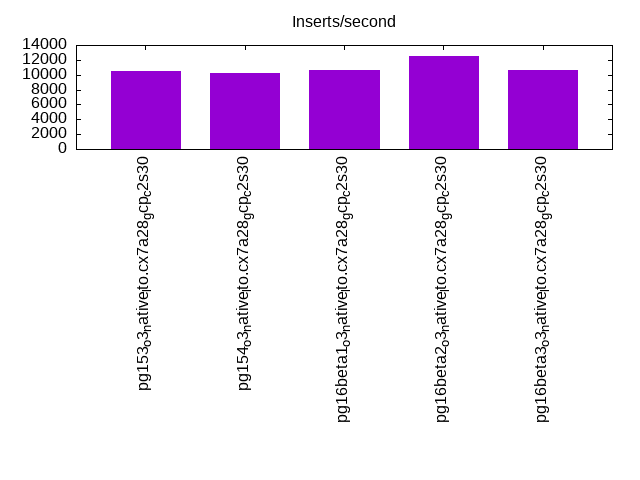
| pg153_o3_native_lto.cx7a28_gcp_c2s30 | 1114206 | 1498726 | 10488 | 102673 | 93484 | 72343 |
| pg154_o3_native_lto.cx7a28_gcp_c2s30 | 1093494 | 1506629 | 10245 | 104580 | 94926 | 93230 |
| pg16beta1_o3_native_lto.cx7a28_gcp_c2s30 | 1092896 | 1612944 | 10691 | 103855 | 92613 | 82913 |
| pg16beta2_o3_native_lto.cx7a28_gcp_c2s30 | 1100110 | 1628042 | 12476 | 102875 | 100236 | 88094 |
| pg16beta3_o3_native_lto.cx7a28_gcp_c2s30 | 1097394 | 1605821 | 10694 | 102343 | 90757 | 74954 |
This table has relative throughput, throughput for the DBMS relative to the DBMS in the first line, using the absolute throughput from the previous table. Values less than 0.95 have a yellow background. Values greater than 1.05 have a blue background.
| dbms | l.i0 | l.x | l.i1 | q100.1 | q500.1 | q1000.1 |
|---|---|---|---|---|---|---|
| pg153_o3_native_lto.cx7a28_gcp_c2s30 | 1.00 | 1.00 | 1.00 | 1.00 | 1.00 | 1.00 |
| pg154_o3_native_lto.cx7a28_gcp_c2s30 | 0.98 | 1.01 | 0.98 | 1.02 | 1.02 | 1.29 |
| pg16beta1_o3_native_lto.cx7a28_gcp_c2s30 | 0.98 | 1.08 | 1.02 | 1.01 | 0.99 | 1.15 |
| pg16beta2_o3_native_lto.cx7a28_gcp_c2s30 | 0.99 | 1.09 | 1.19 | 1.00 | 1.07 | 1.22 |
| pg16beta3_o3_native_lto.cx7a28_gcp_c2s30 | 0.98 | 1.07 | 1.02 | 1.00 | 0.97 | 1.04 |
This lists the average rate of inserts/s for the tests that do inserts concurrent with queries. For such tests the query rate is listed in the table above. The read+write tests are setup so that the insert rate should match the target rate every second. Cells that are not at least 95% of the target have a red background to indicate a failure to satisfy the target.
| dbms | q100.1 | q500.1 | q1000.1 |
|---|---|---|---|
| pg153_o3_native_lto.cx7a28_gcp_c2s30 | 798 | 3987 | 7717 |
| pg154_o3_native_lto.cx7a28_gcp_c2s30 | 798 | 3987 | 7319 |
| pg16beta1_o3_native_lto.cx7a28_gcp_c2s30 | 797 | 3988 | 7155 |
| pg16beta2_o3_native_lto.cx7a28_gcp_c2s30 | 797 | 3987 | 7036 |
| pg16beta3_o3_native_lto.cx7a28_gcp_c2s30 | 797 | 3988 | 6210 |
| target | 800 | 4000 | 8000 |
l.i0
l.i0: load without secondary indexes. Graphs for performance per 1-second interval are here.
Average throughput:
Insert response time histogram: each cell has the percentage of responses that take <= the time in the header and max is the max response time in seconds. For the max column values in the top 25% of the range have a red background and in the bottom 25% of the range have a green background. The red background is not used when the min value is within 80% of the max value.
| dbms | 256us | 1ms | 4ms | 16ms | 64ms | 256ms | 1s | 4s | 16s | gt | max |
|---|---|---|---|---|---|---|---|---|---|---|---|
| pg153_o3_native_lto.cx7a28_gcp_c2s30 | 97.447 | 2.508 | 0.029 | 0.009 | 0.007 | nonzero | 0.574 | ||||
| pg154_o3_native_lto.cx7a28_gcp_c2s30 | 96.869 | 3.093 | 0.026 | 0.006 | 0.005 | nonzero | 0.885 | ||||
| pg16beta1_o3_native_lto.cx7a28_gcp_c2s30 | 97.296 | 2.664 | 0.026 | 0.007 | 0.006 | 0.001 | nonzero | 1.062 | |||
| pg16beta2_o3_native_lto.cx7a28_gcp_c2s30 | 97.280 | 2.678 | 0.027 | 0.008 | 0.006 | 0.001 | 0.651 | ||||
| pg16beta3_o3_native_lto.cx7a28_gcp_c2s30 | 97.299 | 2.660 | 0.029 | 0.007 | 0.005 | nonzero | nonzero | 2.134 |
Performance metrics for the DBMS listed above. Some are normalized by throughput, others are not. Legend for results is here.
ips	qps	rps	rmbps	wps	wmbps	rpq	rkbpq	wpi	wkbpi	csps	cpups	cspq	cpupq	dbgb1	dbgb2	rss	maxop	p50	p99	tag
1114206	0	545	4.3	1457.4	282.3	0.000	0.004	0.001	0.259	92740	84.7	0.083	11	382.7	414.8	3.3	0.574	143293	83210	4000m.pg153_o3_native_lto.cx7a28_gcp_c2s30
1093494	0	547	4.3	1447.9	282.2	0.001	0.004	0.001	0.264	91711	84.1	0.084	12	382.7	414.8	12.0	0.885	140346	81441	4000m.pg154_o3_native_lto.cx7a28_gcp_c2s30
1092896	0	548	4.3	1429.4	276.2	0.001	0.004	0.001	0.259	91453	84.2	0.084	12	382.7	414.8	5.0	1.062	140548	66451	4000m.pg16beta1_o3_native_lto.cx7a28_gcp_c2s30
1100110	0	545	4.3	1446.1	280.7	0.000	0.004	0.001	0.261	92505	84.1	0.084	11	382.7	414.8	7.9	0.651	141846	74119	4000m.pg16beta2_o3_native_lto.cx7a28_gcp_c2s30
1097394	0	547	4.3	1450.2	281.0	0.000	0.004	0.001	0.262	91306	84.6	0.083	12	382.7	414.8	9.4	2.134	140766	85636	4000m.pg16beta3_o3_native_lto.cx7a28_gcp_c2s30
l.x
l.x: create secondary indexes.
Average throughput:
Performance metrics for the DBMS listed above. Some are normalized by throughput, others are not. Legend for results is here.
ips	qps	rps	rmbps	wps	wmbps	rpq	rkbpq	wpi	wkbpi	csps	cpups	cspq	cpupq	dbgb1	dbgb2	rss	maxop	p50	p99	tag
1498726	0	3618	748.5	1278.2	282.0	0.002	0.511	0.001	0.193	36711	34.2	0.024	3	735.2	767.1	56.7	0.002	NA	NA	4000m.pg153_o3_native_lto.cx7a28_gcp_c2s30
1506629	0	3689	753.9	1284.3	282.9	0.002	0.512	0.001	0.192	36992	34.4	0.025	3	735.2	767.0	56.6	0.002	NA	NA	4000m.pg154_o3_native_lto.cx7a28_gcp_c2s30
1612944	0	2916	654.0	1364.6	306.1	0.002	0.415	0.001	0.194	45961	36.0	0.028	3	735.2	767.0	56.8	0.025	NA	NA	4000m.pg16beta1_o3_native_lto.cx7a28_gcp_c2s30
1628042	0	2970	663.8	1386.0	311.4	0.002	0.417	0.001	0.196	45824	35.8	0.028	3	735.2	767.0	56.9	0.184	NA	NA	4000m.pg16beta2_o3_native_lto.cx7a28_gcp_c2s30
1605821	0	2917	657.0	1359.7	302.3	0.002	0.419	0.001	0.193	46247	35.9	0.029	3	735.2	767.1	57.0	0.002	NA	NA	4000m.pg16beta3_o3_native_lto.cx7a28_gcp_c2s30
l.i1
l.i1: continue load after secondary indexes created. Graphs for performance per 1-second interval are here.
Average throughput:
Insert response time histogram: each cell has the percentage of responses that take <= the time in the header and max is the max response time in seconds. For the max column values in the top 25% of the range have a red background and in the bottom 25% of the range have a green background. The red background is not used when the min value is within 80% of the max value.
| dbms | 256us | 1ms | 4ms | 16ms | 64ms | 256ms | 1s | 4s | 16s | gt | max |
|---|---|---|---|---|---|---|---|---|---|---|---|
| pg153_o3_native_lto.cx7a28_gcp_c2s30 | 13.586 | 54.976 | 31.411 | 0.025 | 0.002 | 0.921 | |||||
| pg154_o3_native_lto.cx7a28_gcp_c2s30 | 32.071 | 42.255 | 25.626 | 0.045 | 0.003 | nonzero | 1.172 | ||||
| pg16beta1_o3_native_lto.cx7a28_gcp_c2s30 | 28.788 | 37.415 | 33.767 | 0.028 | 0.002 | nonzero | 1.784 | ||||
| pg16beta2_o3_native_lto.cx7a28_gcp_c2s30 | 36.822 | 39.577 | 23.561 | 0.036 | 0.003 | nonzero | 1.187 | ||||
| pg16beta3_o3_native_lto.cx7a28_gcp_c2s30 | 34.924 | 39.387 | 25.639 | 0.047 | 0.003 | nonzero | 1.301 |
Delete response time histogram: each cell has the percentage of responses that take <= the time in the header and max is the max response time in seconds. For the max column values in the top 25% of the range have a red background and in the bottom 25% of the range have a green background. The red background is not used when the min value is within 80% of the max value.
| dbms | 256us | 1ms | 4ms | 16ms | 64ms | 256ms | 1s | 4s | 16s | gt | max |
|---|---|---|---|---|---|---|---|---|---|---|---|
| pg153_o3_native_lto.cx7a28_gcp_c2s30 | 61.001 | 6.219 | 1.915 | 6.381 | 14.400 | 10.082 | 0.002 | 0.952 | |||
| pg154_o3_native_lto.cx7a28_gcp_c2s30 | 70.309 | 4.361 | 0.919 | 3.490 | 11.623 | 9.281 | 0.018 | 0.747 | |||
| pg16beta1_o3_native_lto.cx7a28_gcp_c2s30 | 66.122 | 8.515 | 0.814 | 2.653 | 9.291 | 12.598 | 0.007 | 0.723 | |||
| pg16beta2_o3_native_lto.cx7a28_gcp_c2s30 | 70.702 | 4.903 | 0.696 | 2.609 | 10.894 | 10.194 | 0.003 | 0.786 | |||
| pg16beta3_o3_native_lto.cx7a28_gcp_c2s30 | 69.171 | 5.167 | 0.694 | 2.583 | 12.071 | 10.308 | 0.006 | nonzero | 1.028 |
Performance metrics for the DBMS listed above. Some are normalized by throughput, others are not. Legend for results is here.
ips	qps	rps	rmbps	wps	wmbps	rpq	rkbpq	wpi	wkbpi	csps	cpups	cspq	cpupq	dbgb1	dbgb2	rss	maxop	p50	p99	tag
10488	0	11439	129.5	20157.0	310.5	1.091	12.645	1.922	30.315	28728	37.2	2.739	532	773.1	805.1	47.1	0.921	250	200	4000m.pg153_o3_native_lto.cx7a28_gcp_c2s30
10245	0	8309	90.8	16543.4	272.0	0.811	9.079	1.615	27.187	22263	30.8	2.173	451	771.4	803.4	71.0	1.172	350	200	4000m.pg154_o3_native_lto.cx7a28_gcp_c2s30
10691	0	10297	113.4	18233.0	298.0	0.963	10.863	1.705	28.543	26215	37.1	2.452	521	773.9	805.9	70.7	1.784	499	300	4000m.pg16beta1_o3_native_lto.cx7a28_gcp_c2s30
12476	0	9646	114.5	19296.1	341.1	0.773	9.402	1.547	27.998	25970	36.7	2.082	441	776.2	808.2	70.3	1.187	350	250	4000m.pg16beta2_o3_native_lto.cx7a28_gcp_c2s30
10694	0	8813	104.7	17284.4	303.5	0.824	10.021	1.616	29.056	23352	31.7	2.184	445	775.4	807.4	70.1	1.301	1649	699	4000m.pg16beta3_o3_native_lto.cx7a28_gcp_c2s30
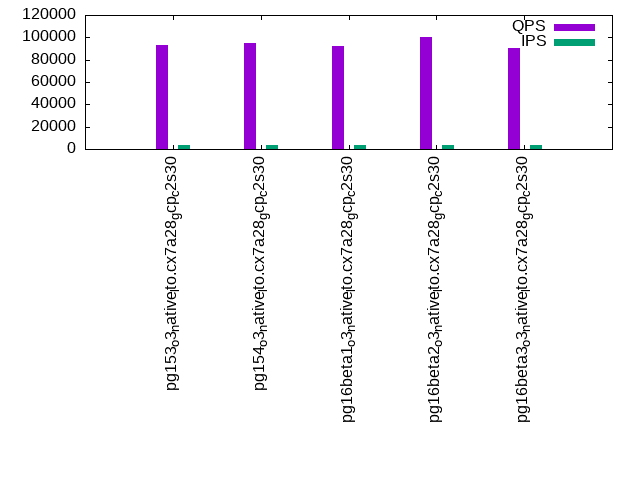
q100.1
q100.1: range queries with 100 insert/s per client. Graphs for performance per 1-second interval are here.
Average throughput:
Query response time histogram: each cell has the percentage of responses that take <= the time in the header and max is the max response time in seconds. For max values in the top 25% of the range have a red background and in the bottom 25% of the range have a green background. The red background is not used when the min value is within 80% of the max value.
| dbms | 256us | 1ms | 4ms | 16ms | 64ms | 256ms | 1s | 4s | 16s | gt | max |
|---|---|---|---|---|---|---|---|---|---|---|---|
| pg153_o3_native_lto.cx7a28_gcp_c2s30 | 99.827 | 0.171 | 0.001 | nonzero | nonzero | 0.033 | |||||
| pg154_o3_native_lto.cx7a28_gcp_c2s30 | 99.837 | 0.162 | 0.001 | nonzero | nonzero | nonzero | nonzero | 0.277 | |||
| pg16beta1_o3_native_lto.cx7a28_gcp_c2s30 | 99.824 | 0.175 | 0.001 | nonzero | nonzero | 0.049 | |||||
| pg16beta2_o3_native_lto.cx7a28_gcp_c2s30 | 99.743 | 0.256 | 0.001 | nonzero | 0.015 | ||||||
| pg16beta3_o3_native_lto.cx7a28_gcp_c2s30 | 99.773 | 0.226 | 0.001 | nonzero | 0.015 |
Insert response time histogram: each cell has the percentage of responses that take <= the time in the header and max is the max response time in seconds. For max values in the top 25% of the range have a red background and in the bottom 25% of the range have a green background. The red background is not used when the min value is within 80% of the max value.
| dbms | 256us | 1ms | 4ms | 16ms | 64ms | 256ms | 1s | 4s | 16s | gt | max |
|---|---|---|---|---|---|---|---|---|---|---|---|
| pg153_o3_native_lto.cx7a28_gcp_c2s30 | 35.142 | 64.856 | 0.002 | 0.074 | |||||||
| pg154_o3_native_lto.cx7a28_gcp_c2s30 | 8.526 | 9.663 | 81.800 | 0.010 | 0.151 | ||||||
| pg16beta1_o3_native_lto.cx7a28_gcp_c2s30 | 12.436 | 3.875 | 83.661 | 0.028 | 0.114 | ||||||
| pg16beta2_o3_native_lto.cx7a28_gcp_c2s30 | 12.292 | 4.911 | 82.785 | 0.012 | 0.078 | ||||||
| pg16beta3_o3_native_lto.cx7a28_gcp_c2s30 | 9.155 | 9.540 | 81.299 | 0.007 | 0.071 |
Delete response time histogram: each cell has the percentage of responses that take <= the time in the header and max is the max response time in seconds. For max values in the top 25% of the range have a red background and in the bottom 25% of the range have a green background. The red background is not used when the min value is within 80% of the max value.
| dbms | 256us | 1ms | 4ms | 16ms | 64ms | 256ms | 1s | 4s | 16s | gt | max |
|---|---|---|---|---|---|---|---|---|---|---|---|
| pg153_o3_native_lto.cx7a28_gcp_c2s30 | 22.403 | 25.446 | 25.656 | 13.708 | 12.785 | 0.002 | 0.077 | ||||
| pg154_o3_native_lto.cx7a28_gcp_c2s30 | 30.752 | 30.965 | 33.983 | 4.297 | 0.003 | 0.021 | |||||
| pg16beta1_o3_native_lto.cx7a28_gcp_c2s30 | 54.668 | 32.571 | 0.257 | 1.071 | 11.432 | 0.041 | |||||
| pg16beta2_o3_native_lto.cx7a28_gcp_c2s30 | 19.108 | 24.648 | 17.300 | 32.281 | 6.663 | 0.038 | |||||
| pg16beta3_o3_native_lto.cx7a28_gcp_c2s30 | 32.977 | 26.264 | 25.845 | 2.411 | 12.500 | 0.002 | 0.065 |
Performance metrics for the DBMS listed above. Some are normalized by throughput, others are not. Legend for results is here.
ips	qps	rps	rmbps	wps	wmbps	rpq	rkbpq	wpi	wkbpi	csps	cpups	cspq	cpupq	dbgb1	dbgb2	rss	maxop	p50	p99	tag
798	102673	1559	13.3	1638.1	25.0	0.015	0.132	2.054	32.077	394194	53.5	3.839	78	773.1	805.2	70.9	0.033	12898	9497	4000m.pg153_o3_native_lto.cx7a28_gcp_c2s30
798	104580	1545	13.1	1640.4	23.9	0.015	0.128	2.057	30.666	401477	52.9	3.839	76	771.5	803.6	70.9	0.277	12962	12738	4000m.pg154_o3_native_lto.cx7a28_gcp_c2s30
797	103855	1647	14.0	1642.0	25.4	0.016	0.138	2.059	32.643	399088	53.1	3.843	77	774.0	806.0	70.9	0.049	13159	5354	4000m.pg16beta1_o3_native_lto.cx7a28_gcp_c2s30
797	102875	1770	15.0	1737.2	27.1	0.017	0.149	2.179	34.841	395506	53.4	3.845	78	776.2	808.2	70.9	0.015	12946	12626	4000m.pg16beta2_o3_native_lto.cx7a28_gcp_c2s30
797	102343	1730	14.7	1794.8	27.7	0.017	0.147	2.251	35.569	393384	53.3	3.844	78	775.4	807.5	70.9	0.015	12898	5242	4000m.pg16beta3_o3_native_lto.cx7a28_gcp_c2s30
q500.1
q500.1: range queries with 500 insert/s per client. Graphs for performance per 1-second interval are here.
Average throughput:
Query response time histogram: each cell has the percentage of responses that take <= the time in the header and max is the max response time in seconds. For max values in the top 25% of the range have a red background and in the bottom 25% of the range have a green background. The red background is not used when the min value is within 80% of the max value.
| dbms | 256us | 1ms | 4ms | 16ms | 64ms | 256ms | 1s | 4s | 16s | gt | max |
|---|---|---|---|---|---|---|---|---|---|---|---|
| pg153_o3_native_lto.cx7a28_gcp_c2s30 | 99.846 | 0.151 | 0.002 | 0.001 | nonzero | 0.028 | |||||
| pg154_o3_native_lto.cx7a28_gcp_c2s30 | 99.794 | 0.202 | 0.003 | 0.001 | nonzero | 0.028 | |||||
| pg16beta1_o3_native_lto.cx7a28_gcp_c2s30 | 99.836 | 0.162 | 0.002 | 0.001 | nonzero | 0.028 | |||||
| pg16beta2_o3_native_lto.cx7a28_gcp_c2s30 | 99.844 | 0.150 | 0.004 | 0.001 | nonzero | 0.033 | |||||
| pg16beta3_o3_native_lto.cx7a28_gcp_c2s30 | 99.801 | 0.195 | 0.003 | 0.001 | nonzero | 0.027 |
Insert response time histogram: each cell has the percentage of responses that take <= the time in the header and max is the max response time in seconds. For max values in the top 25% of the range have a red background and in the bottom 25% of the range have a green background. The red background is not used when the min value is within 80% of the max value.
| dbms | 256us | 1ms | 4ms | 16ms | 64ms | 256ms | 1s | 4s | 16s | gt | max |
|---|---|---|---|---|---|---|---|---|---|---|---|
| pg153_o3_native_lto.cx7a28_gcp_c2s30 | 8.934 | 91.060 | 0.006 | 0.102 | |||||||
| pg154_o3_native_lto.cx7a28_gcp_c2s30 | 4.783 | 95.215 | 0.002 | 0.074 | |||||||
| pg16beta1_o3_native_lto.cx7a28_gcp_c2s30 | 1.236 | 9.515 | 89.228 | 0.020 | 0.121 | ||||||
| pg16beta2_o3_native_lto.cx7a28_gcp_c2s30 | 0.210 | 15.484 | 84.306 | 0.059 | |||||||
| pg16beta3_o3_native_lto.cx7a28_gcp_c2s30 | 12.511 | 87.489 | nonzero | 0.076 |
Delete response time histogram: each cell has the percentage of responses that take <= the time in the header and max is the max response time in seconds. For max values in the top 25% of the range have a red background and in the bottom 25% of the range have a green background. The red background is not used when the min value is within 80% of the max value.
| dbms | 256us | 1ms | 4ms | 16ms | 64ms | 256ms | 1s | 4s | 16s | gt | max |
|---|---|---|---|---|---|---|---|---|---|---|---|
| pg153_o3_native_lto.cx7a28_gcp_c2s30 | 56.588 | 9.913 | 2.668 | 21.186 | 9.644 | nonzero | 0.085 | ||||
| pg154_o3_native_lto.cx7a28_gcp_c2s30 | 46.282 | 12.436 | 2.827 | 20.974 | 17.481 | 0.045 | |||||
| pg16beta1_o3_native_lto.cx7a28_gcp_c2s30 | 77.226 | 10.030 | 0.227 | 0.016 | 12.501 | 0.053 | |||||
| pg16beta2_o3_native_lto.cx7a28_gcp_c2s30 | 18.599 | 8.515 | 1.808 | 17.053 | 53.961 | 0.064 | 0.102 | ||||
| pg16beta3_o3_native_lto.cx7a28_gcp_c2s30 | 41.174 | 8.645 | 3.058 | 18.293 | 28.829 | 0.001 | 0.075 |
Performance metrics for the DBMS listed above. Some are normalized by throughput, others are not. Legend for results is here.
ips	qps	rps	rmbps	wps	wmbps	rpq	rkbpq	wpi	wkbpi	csps	cpups	cspq	cpupq	dbgb1	dbgb2	rss	maxop	p50	p99	tag
3987	93484	5885	47.7	10231.0	135.6	0.063	0.522	2.566	34.825	363973	57.6	3.893	92	773.4	805.5	70.9	0.028	11491	10979	4000m.pg153_o3_native_lto.cx7a28_gcp_c2s30
3987	94926	5828	47.2	10144.9	131.4	0.061	0.509	2.545	33.739	361213	58.4	3.805	92	772.4	804.5	70.9	0.028	11608	11108	4000m.pg154_o3_native_lto.cx7a28_gcp_c2s30
3988	92613	5850	47.4	10316.7	133.7	0.063	0.524	2.587	34.333	361749	57.7	3.906	93	774.4	806.5	70.9	0.028	11507	10932	4000m.pg16beta1_o3_native_lto.cx7a28_gcp_c2s30
3987	100236	5880	47.7	10231.3	131.1	0.059	0.487	2.566	33.679	349150	62.8	3.483	94	776.2	808.2	70.9	0.033	12546	11427	4000m.pg16beta2_o3_native_lto.cx7a28_gcp_c2s30
3988	90757	5857	47.4	10195.0	130.8	0.065	0.535	2.557	33.597	342006	60.3	3.768	100	775.5	807.6	70.9	0.027	11409	10377	4000m.pg16beta3_o3_native_lto.cx7a28_gcp_c2s30
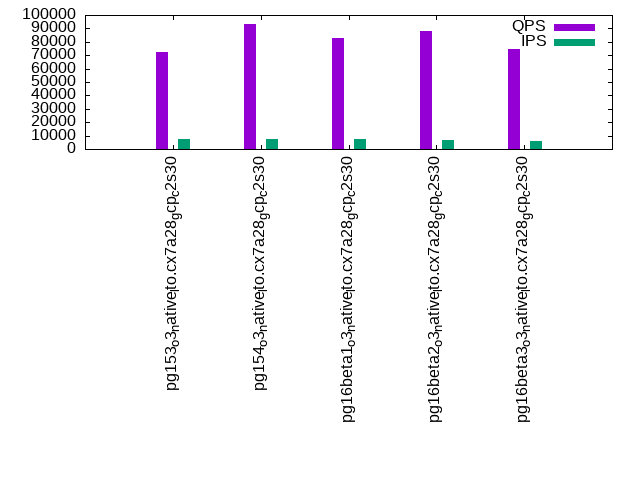
q1000.1
q1000.1: range queries with 1000 insert/s per client. Graphs for performance per 1-second interval are here.
Average throughput:
Query response time histogram: each cell has the percentage of responses that take <= the time in the header and max is the max response time in seconds. For max values in the top 25% of the range have a red background and in the bottom 25% of the range have a green background. The red background is not used when the min value is within 80% of the max value.
| dbms | 256us | 1ms | 4ms | 16ms | 64ms | 256ms | 1s | 4s | 16s | gt | max |
|---|---|---|---|---|---|---|---|---|---|---|---|
| pg153_o3_native_lto.cx7a28_gcp_c2s30 | 99.545 | 0.448 | 0.006 | 0.001 | nonzero | nonzero | 0.101 | ||||
| pg154_o3_native_lto.cx7a28_gcp_c2s30 | 99.684 | 0.305 | 0.009 | 0.002 | nonzero | 0.036 | |||||
| pg16beta1_o3_native_lto.cx7a28_gcp_c2s30 | 99.674 | 0.319 | 0.006 | 0.001 | nonzero | 0.036 | |||||
| pg16beta2_o3_native_lto.cx7a28_gcp_c2s30 | 99.616 | 0.369 | 0.011 | 0.004 | nonzero | nonzero | nonzero | 0.611 | |||
| pg16beta3_o3_native_lto.cx7a28_gcp_c2s30 | 99.681 | 0.310 | 0.008 | 0.002 | nonzero | 0.032 |
Insert response time histogram: each cell has the percentage of responses that take <= the time in the header and max is the max response time in seconds. For max values in the top 25% of the range have a red background and in the bottom 25% of the range have a green background. The red background is not used when the min value is within 80% of the max value.
| dbms | 256us | 1ms | 4ms | 16ms | 64ms | 256ms | 1s | 4s | 16s | gt | max |
|---|---|---|---|---|---|---|---|---|---|---|---|
| pg153_o3_native_lto.cx7a28_gcp_c2s30 | 16.902 | 82.937 | 0.161 | 0.001 | 0.287 | ||||||
| pg154_o3_native_lto.cx7a28_gcp_c2s30 | 22.045 | 77.953 | 0.001 | 0.139 | |||||||
| pg16beta1_o3_native_lto.cx7a28_gcp_c2s30 | 18.563 | 81.423 | 0.013 | 0.119 | |||||||
| pg16beta2_o3_native_lto.cx7a28_gcp_c2s30 | 28.020 | 71.935 | 0.035 | 0.010 | 0.636 | ||||||
| pg16beta3_o3_native_lto.cx7a28_gcp_c2s30 | 26.555 | 73.444 | 0.001 | 0.199 |
Delete response time histogram: each cell has the percentage of responses that take <= the time in the header and max is the max response time in seconds. For max values in the top 25% of the range have a red background and in the bottom 25% of the range have a green background. The red background is not used when the min value is within 80% of the max value.
| dbms | 256us | 1ms | 4ms | 16ms | 64ms | 256ms | 1s | 4s | 16s | gt | max |
|---|---|---|---|---|---|---|---|---|---|---|---|
| pg153_o3_native_lto.cx7a28_gcp_c2s30 | 55.252 | 21.460 | 0.144 | 0.025 | 23.092 | 0.028 | 0.089 | ||||
| pg154_o3_native_lto.cx7a28_gcp_c2s30 | 26.624 | 19.401 | 0.211 | 0.027 | 48.973 | 4.763 | 0.113 | ||||
| pg16beta1_o3_native_lto.cx7a28_gcp_c2s30 | 41.841 | 23.152 | 0.207 | 0.039 | 31.878 | 2.884 | 0.120 | ||||
| pg16beta2_o3_native_lto.cx7a28_gcp_c2s30 | 23.439 | 14.688 | 0.101 | 0.010 | 53.007 | 8.753 | 0.002 | 0.644 | |||
| pg16beta3_o3_native_lto.cx7a28_gcp_c2s30 | 34.998 | 19.280 | 0.201 | 0.022 | 38.218 | 7.282 | 0.131 |
Performance metrics for the DBMS listed above. Some are normalized by throughput, others are not. Legend for results is here.
ips	qps	rps	rmbps	wps	wmbps	rpq	rkbpq	wpi	wkbpi	csps	cpups	cspq	cpupq	dbgb1	dbgb2	rss	maxop	p50	p99	tag
7717	72343	11499	112.7	20645.3	274.0	0.159	1.595	2.675	36.362	275131	66.4	3.803	138	774.1	806.1	50.0	0.101	9158	8662	4000m.pg153_o3_native_lto.cx7a28_gcp_c2s30
7319	93230	10799	87.2	18735.1	236.9	0.116	0.958	2.560	33.147	250528	77.3	2.687	124	774.2	806.2	70.9	0.036	11859	9909	4000m.pg154_o3_native_lto.cx7a28_gcp_c2s30
7155	82913	10589	85.6	18374.9	233.9	0.128	1.057	2.568	33.480	254246	68.0	3.066	123	775.3	807.3	70.9	0.036	11092	9222	4000m.pg16beta1_o3_native_lto.cx7a28_gcp_c2s30
7036	88094	10414	84.4	18139.6	227.3	0.118	0.981	2.578	33.077	239409	77.9	2.718	133	776.2	808.3	70.9	0.611	11832	8311	4000m.pg16beta2_o3_native_lto.cx7a28_gcp_c2s30
6210	74954	9166	74.4	15730.2	198.7	0.122	1.017	2.533	32.775	217134	63.2	2.897	126	775.8	807.8	70.9	0.032	11576	8599	4000m.pg16beta3_o3_native_lto.cx7a28_gcp_c2s30
l.i0
l.i0: load without secondary indexes
Performance metrics for all DBMS, not just the ones listed above. Some are normalized by throughput, others are not. Legend for results is here.
ips	qps	rps	rmbps	wps	wmbps	rpq	rkbpq	wpi	wkbpi	csps	cpups	cspq	cpupq	dbgb1	dbgb2	rss	maxop	p50	p99	tag
1114206	0	545	4.3	1457.4	282.3	0.000	0.004	0.001	0.259	92740	84.7	0.083	11	382.7	414.8	3.3	0.574	143293	83210	4000m.pg153_o3_native_lto.cx7a28_gcp_c2s30
1093494	0	547	4.3	1447.9	282.2	0.001	0.004	0.001	0.264	91711	84.1	0.084	12	382.7	414.8	12.0	0.885	140346	81441	4000m.pg154_o3_native_lto.cx7a28_gcp_c2s30
1092896	0	548	4.3	1429.4	276.2	0.001	0.004	0.001	0.259	91453	84.2	0.084	12	382.7	414.8	5.0	1.062	140548	66451	4000m.pg16beta1_o3_native_lto.cx7a28_gcp_c2s30
1100110	0	545	4.3	1446.1	280.7	0.000	0.004	0.001	0.261	92505	84.1	0.084	11	382.7	414.8	7.9	0.651	141846	74119	4000m.pg16beta2_o3_native_lto.cx7a28_gcp_c2s30
1097394	0	547	4.3	1450.2	281.0	0.000	0.004	0.001	0.262	91306	84.6	0.083	12	382.7	414.8	9.4	2.134	140766	85636	4000m.pg16beta3_o3_native_lto.cx7a28_gcp_c2s30
l.x
l.x: create secondary indexes
Performance metrics for all DBMS, not just the ones listed above. Some are normalized by throughput, others are not. Legend for results is here.
ips	qps	rps	rmbps	wps	wmbps	rpq	rkbpq	wpi	wkbpi	csps	cpups	cspq	cpupq	dbgb1	dbgb2	rss	maxop	p50	p99	tag
1498726	0	3618	748.5	1278.2	282.0	0.002	0.511	0.001	0.193	36711	34.2	0.024	3	735.2	767.1	56.7	0.002	NA	NA	4000m.pg153_o3_native_lto.cx7a28_gcp_c2s30
1506629	0	3689	753.9	1284.3	282.9	0.002	0.512	0.001	0.192	36992	34.4	0.025	3	735.2	767.0	56.6	0.002	NA	NA	4000m.pg154_o3_native_lto.cx7a28_gcp_c2s30
1612944	0	2916	654.0	1364.6	306.1	0.002	0.415	0.001	0.194	45961	36.0	0.028	3	735.2	767.0	56.8	0.025	NA	NA	4000m.pg16beta1_o3_native_lto.cx7a28_gcp_c2s30
1628042	0	2970	663.8	1386.0	311.4	0.002	0.417	0.001	0.196	45824	35.8	0.028	3	735.2	767.0	56.9	0.184	NA	NA	4000m.pg16beta2_o3_native_lto.cx7a28_gcp_c2s30
1605821	0	2917	657.0	1359.7	302.3	0.002	0.419	0.001	0.193	46247	35.9	0.029	3	735.2	767.1	57.0	0.002	NA	NA	4000m.pg16beta3_o3_native_lto.cx7a28_gcp_c2s30
l.i1
l.i1: continue load after secondary indexes created
Performance metrics for all DBMS, not just the ones listed above. Some are normalized by throughput, others are not. Legend for results is here.
ips	qps	rps	rmbps	wps	wmbps	rpq	rkbpq	wpi	wkbpi	csps	cpups	cspq	cpupq	dbgb1	dbgb2	rss	maxop	p50	p99	tag
10488	0	11439	129.5	20157.0	310.5	1.091	12.645	1.922	30.315	28728	37.2	2.739	532	773.1	805.1	47.1	0.921	250	200	4000m.pg153_o3_native_lto.cx7a28_gcp_c2s30
10245	0	8309	90.8	16543.4	272.0	0.811	9.079	1.615	27.187	22263	30.8	2.173	451	771.4	803.4	71.0	1.172	350	200	4000m.pg154_o3_native_lto.cx7a28_gcp_c2s30
10691	0	10297	113.4	18233.0	298.0	0.963	10.863	1.705	28.543	26215	37.1	2.452	521	773.9	805.9	70.7	1.784	499	300	4000m.pg16beta1_o3_native_lto.cx7a28_gcp_c2s30
12476	0	9646	114.5	19296.1	341.1	0.773	9.402	1.547	27.998	25970	36.7	2.082	441	776.2	808.2	70.3	1.187	350	250	4000m.pg16beta2_o3_native_lto.cx7a28_gcp_c2s30
10694	0	8813	104.7	17284.4	303.5	0.824	10.021	1.616	29.056	23352	31.7	2.184	445	775.4	807.4	70.1	1.301	1649	699	4000m.pg16beta3_o3_native_lto.cx7a28_gcp_c2s30
q100.1
q100.1: range queries with 100 insert/s per client
Performance metrics for all DBMS, not just the ones listed above. Some are normalized by throughput, others are not. Legend for results is here.
ips	qps	rps	rmbps	wps	wmbps	rpq	rkbpq	wpi	wkbpi	csps	cpups	cspq	cpupq	dbgb1	dbgb2	rss	maxop	p50	p99	tag
798	102673	1559	13.3	1638.1	25.0	0.015	0.132	2.054	32.077	394194	53.5	3.839	78	773.1	805.2	70.9	0.033	12898	9497	4000m.pg153_o3_native_lto.cx7a28_gcp_c2s30
798	104580	1545	13.1	1640.4	23.9	0.015	0.128	2.057	30.666	401477	52.9	3.839	76	771.5	803.6	70.9	0.277	12962	12738	4000m.pg154_o3_native_lto.cx7a28_gcp_c2s30
797	103855	1647	14.0	1642.0	25.4	0.016	0.138	2.059	32.643	399088	53.1	3.843	77	774.0	806.0	70.9	0.049	13159	5354	4000m.pg16beta1_o3_native_lto.cx7a28_gcp_c2s30
797	102875	1770	15.0	1737.2	27.1	0.017	0.149	2.179	34.841	395506	53.4	3.845	78	776.2	808.2	70.9	0.015	12946	12626	4000m.pg16beta2_o3_native_lto.cx7a28_gcp_c2s30
797	102343	1730	14.7	1794.8	27.7	0.017	0.147	2.251	35.569	393384	53.3	3.844	78	775.4	807.5	70.9	0.015	12898	5242	4000m.pg16beta3_o3_native_lto.cx7a28_gcp_c2s30
q500.1
q500.1: range queries with 500 insert/s per client
Performance metrics for all DBMS, not just the ones listed above. Some are normalized by throughput, others are not. Legend for results is here.
ips	qps	rps	rmbps	wps	wmbps	rpq	rkbpq	wpi	wkbpi	csps	cpups	cspq	cpupq	dbgb1	dbgb2	rss	maxop	p50	p99	tag
3987	93484	5885	47.7	10231.0	135.6	0.063	0.522	2.566	34.825	363973	57.6	3.893	92	773.4	805.5	70.9	0.028	11491	10979	4000m.pg153_o3_native_lto.cx7a28_gcp_c2s30
3987	94926	5828	47.2	10144.9	131.4	0.061	0.509	2.545	33.739	361213	58.4	3.805	92	772.4	804.5	70.9	0.028	11608	11108	4000m.pg154_o3_native_lto.cx7a28_gcp_c2s30
3988	92613	5850	47.4	10316.7	133.7	0.063	0.524	2.587	34.333	361749	57.7	3.906	93	774.4	806.5	70.9	0.028	11507	10932	4000m.pg16beta1_o3_native_lto.cx7a28_gcp_c2s30
3987	100236	5880	47.7	10231.3	131.1	0.059	0.487	2.566	33.679	349150	62.8	3.483	94	776.2	808.2	70.9	0.033	12546	11427	4000m.pg16beta2_o3_native_lto.cx7a28_gcp_c2s30
3988	90757	5857	47.4	10195.0	130.8	0.065	0.535	2.557	33.597	342006	60.3	3.768	100	775.5	807.6	70.9	0.027	11409	10377	4000m.pg16beta3_o3_native_lto.cx7a28_gcp_c2s30
q1000.1
q1000.1: range queries with 1000 insert/s per client
Performance metrics for all DBMS, not just the ones listed above. Some are normalized by throughput, others are not. Legend for results is here.
ips	qps	rps	rmbps	wps	wmbps	rpq	rkbpq	wpi	wkbpi	csps	cpups	cspq	cpupq	dbgb1	dbgb2	rss	maxop	p50	p99	tag
7717	72343	11499	112.7	20645.3	274.0	0.159	1.595	2.675	36.362	275131	66.4	3.803	138	774.1	806.1	50.0	0.101	9158	8662	4000m.pg153_o3_native_lto.cx7a28_gcp_c2s30
7319	93230	10799	87.2	18735.1	236.9	0.116	0.958	2.560	33.147	250528	77.3	2.687	124	774.2	806.2	70.9	0.036	11859	9909	4000m.pg154_o3_native_lto.cx7a28_gcp_c2s30
7155	82913	10589	85.6	18374.9	233.9	0.128	1.057	2.568	33.480	254246	68.0	3.066	123	775.3	807.3	70.9	0.036	11092	9222	4000m.pg16beta1_o3_native_lto.cx7a28_gcp_c2s30
7036	88094	10414	84.4	18139.6	227.3	0.118	0.981	2.578	33.077	239409	77.9	2.718	133	776.2	808.3	70.9	0.611	11832	8311	4000m.pg16beta2_o3_native_lto.cx7a28_gcp_c2s30
6210	74954	9166	74.4	15730.2	198.7	0.122	1.017	2.533	32.775	217134	63.2	2.897	126	775.8	807.8	70.9	0.032	11576	8599	4000m.pg16beta3_o3_native_lto.cx7a28_gcp_c2s30
l.i0
- l.i0: load without secondary indexes
- Legend for results is here.
- Each entry lists the percentage of responses that fit in that bucket (slower than max time for previous bucket, faster than min time for next bucket).
Insert response time histogram
256us	1ms	4ms	16ms	64ms	256ms	1s	4s	16s	gt	max	tag
0.000	97.447	2.508	0.029	0.009	0.007	nonzero	0.000	0.000	0.000	0.574	pg153_o3_native_lto.cx7a28_gcp_c2s30
0.000	96.869	3.093	0.026	0.006	0.005	nonzero	0.000	0.000	0.000	0.885	pg154_o3_native_lto.cx7a28_gcp_c2s30
0.000	97.296	2.664	0.026	0.007	0.006	0.001	nonzero	0.000	0.000	1.062	pg16beta1_o3_native_lto.cx7a28_gcp_c2s30
0.000	97.280	2.678	0.027	0.008	0.006	0.001	0.000	0.000	0.000	0.651	pg16beta2_o3_native_lto.cx7a28_gcp_c2s30
0.000	97.299	2.660	0.029	0.007	0.005	nonzero	nonzero	0.000	0.000	2.134	pg16beta3_o3_native_lto.cx7a28_gcp_c2s30
l.x
- l.x: create secondary indexes
- Legend for results is here.
- Each entry lists the percentage of responses that fit in that bucket (slower than max time for previous bucket, faster than min time for next bucket).
TODO - determine whether there is data for create index response time
l.i1
- l.i1: continue load after secondary indexes created
- Legend for results is here.
- Each entry lists the percentage of responses that fit in that bucket (slower than max time for previous bucket, faster than min time for next bucket).
Insert response time histogram
256us	1ms	4ms	16ms	64ms	256ms	1s	4s	16s	gt	max	tag
0.000	0.000	13.586	54.976	31.411	0.025	0.002	0.000	0.000	0.000	0.921	pg153_o3_native_lto.cx7a28_gcp_c2s30
0.000	0.000	32.071	42.255	25.626	0.045	0.003	nonzero	0.000	0.000	1.172	pg154_o3_native_lto.cx7a28_gcp_c2s30
0.000	0.000	28.788	37.415	33.767	0.028	0.002	nonzero	0.000	0.000	1.784	pg16beta1_o3_native_lto.cx7a28_gcp_c2s30
0.000	0.000	36.822	39.577	23.561	0.036	0.003	nonzero	0.000	0.000	1.187	pg16beta2_o3_native_lto.cx7a28_gcp_c2s30
0.000	0.000	34.924	39.387	25.639	0.047	0.003	nonzero	0.000	0.000	1.301	pg16beta3_o3_native_lto.cx7a28_gcp_c2s30
Delete response time histogram
256us	1ms	4ms	16ms	64ms	256ms	1s	4s	16s	gt	max	tag
61.001	6.219	1.915	6.381	14.400	10.082	0.002	0.000	0.000	0.000	0.952	pg153_o3_native_lto.cx7a28_gcp_c2s30
70.309	4.361	0.919	3.490	11.623	9.281	0.018	0.000	0.000	0.000	0.747	pg154_o3_native_lto.cx7a28_gcp_c2s30
66.122	8.515	0.814	2.653	9.291	12.598	0.007	0.000	0.000	0.000	0.723	pg16beta1_o3_native_lto.cx7a28_gcp_c2s30
70.702	4.903	0.696	2.609	10.894	10.194	0.003	0.000	0.000	0.000	0.786	pg16beta2_o3_native_lto.cx7a28_gcp_c2s30
69.171	5.167	0.694	2.583	12.071	10.308	0.006	nonzero	0.000	0.000	1.028	pg16beta3_o3_native_lto.cx7a28_gcp_c2s30
q100.1
- q100.1: range queries with 100 insert/s per client
- Legend for results is here.
- Each entry lists the percentage of responses that fit in that bucket (slower than max time for previous bucket, faster than min time for next bucket).
Query response time histogram
256us	1ms	4ms	16ms	64ms	256ms	1s	4s	16s	gt	max	tag
99.827	0.171	0.001	nonzero	nonzero	0.000	0.000	0.000	0.000	0.000	0.033	pg153_o3_native_lto.cx7a28_gcp_c2s30
99.837	0.162	0.001	nonzero	nonzero	nonzero	nonzero	0.000	0.000	0.000	0.277	pg154_o3_native_lto.cx7a28_gcp_c2s30
99.824	0.175	0.001	nonzero	nonzero	0.000	0.000	0.000	0.000	0.000	0.049	pg16beta1_o3_native_lto.cx7a28_gcp_c2s30
99.743	0.256	0.001	nonzero	0.000	0.000	0.000	0.000	0.000	0.000	0.015	pg16beta2_o3_native_lto.cx7a28_gcp_c2s30
99.773	0.226	0.001	nonzero	0.000	0.000	0.000	0.000	0.000	0.000	0.015	pg16beta3_o3_native_lto.cx7a28_gcp_c2s30
Insert response time histogram
256us	1ms	4ms	16ms	64ms	256ms	1s	4s	16s	gt	max	tag
0.000	0.000	0.000	35.142	64.856	0.002	0.000	0.000	0.000	0.000	0.074	pg153_o3_native_lto.cx7a28_gcp_c2s30
0.000	0.000	8.526	9.663	81.800	0.010	0.000	0.000	0.000	0.000	0.151	pg154_o3_native_lto.cx7a28_gcp_c2s30
0.000	0.000	12.436	3.875	83.661	0.028	0.000	0.000	0.000	0.000	0.114	pg16beta1_o3_native_lto.cx7a28_gcp_c2s30
0.000	0.000	12.292	4.911	82.785	0.012	0.000	0.000	0.000	0.000	0.078	pg16beta2_o3_native_lto.cx7a28_gcp_c2s30
0.000	0.000	9.155	9.540	81.299	0.007	0.000	0.000	0.000	0.000	0.071	pg16beta3_o3_native_lto.cx7a28_gcp_c2s30
Delete response time histogram
256us	1ms	4ms	16ms	64ms	256ms	1s	4s	16s	gt	max	tag
22.403	25.446	25.656	13.708	12.785	0.002	0.000	0.000	0.000	0.000	0.077	pg153_o3_native_lto.cx7a28_gcp_c2s30
30.752	30.965	33.983	4.297	0.003	0.000	0.000	0.000	0.000	0.000	0.021	pg154_o3_native_lto.cx7a28_gcp_c2s30
54.668	32.571	0.257	1.071	11.432	0.000	0.000	0.000	0.000	0.000	0.041	pg16beta1_o3_native_lto.cx7a28_gcp_c2s30
19.108	24.648	17.300	32.281	6.663	0.000	0.000	0.000	0.000	0.000	0.038	pg16beta2_o3_native_lto.cx7a28_gcp_c2s30
32.977	26.264	25.845	2.411	12.500	0.002	0.000	0.000	0.000	0.000	0.065	pg16beta3_o3_native_lto.cx7a28_gcp_c2s30
q500.1
- q500.1: range queries with 500 insert/s per client
- Legend for results is here.
- Each entry lists the percentage of responses that fit in that bucket (slower than max time for previous bucket, faster than min time for next bucket).
Query response time histogram
256us	1ms	4ms	16ms	64ms	256ms	1s	4s	16s	gt	max	tag
99.846	0.151	0.002	0.001	nonzero	0.000	0.000	0.000	0.000	0.000	0.028	pg153_o3_native_lto.cx7a28_gcp_c2s30
99.794	0.202	0.003	0.001	nonzero	0.000	0.000	0.000	0.000	0.000	0.028	pg154_o3_native_lto.cx7a28_gcp_c2s30
99.836	0.162	0.002	0.001	nonzero	0.000	0.000	0.000	0.000	0.000	0.028	pg16beta1_o3_native_lto.cx7a28_gcp_c2s30
99.844	0.150	0.004	0.001	nonzero	0.000	0.000	0.000	0.000	0.000	0.033	pg16beta2_o3_native_lto.cx7a28_gcp_c2s30
99.801	0.195	0.003	0.001	nonzero	0.000	0.000	0.000	0.000	0.000	0.027	pg16beta3_o3_native_lto.cx7a28_gcp_c2s30
Insert response time histogram
256us	1ms	4ms	16ms	64ms	256ms	1s	4s	16s	gt	max	tag
0.000	0.000	0.000	8.934	91.060	0.006	0.000	0.000	0.000	0.000	0.102	pg153_o3_native_lto.cx7a28_gcp_c2s30
0.000	0.000	0.000	4.783	95.215	0.002	0.000	0.000	0.000	0.000	0.074	pg154_o3_native_lto.cx7a28_gcp_c2s30
0.000	0.000	1.236	9.515	89.228	0.020	0.000	0.000	0.000	0.000	0.121	pg16beta1_o3_native_lto.cx7a28_gcp_c2s30
0.000	0.000	0.210	15.484	84.306	0.000	0.000	0.000	0.000	0.000	0.059	pg16beta2_o3_native_lto.cx7a28_gcp_c2s30
0.000	0.000	0.000	12.511	87.489	nonzero	0.000	0.000	0.000	0.000	0.076	pg16beta3_o3_native_lto.cx7a28_gcp_c2s30
Delete response time histogram
256us	1ms	4ms	16ms	64ms	256ms	1s	4s	16s	gt	max	tag
56.588	9.913	2.668	21.186	9.644	nonzero	0.000	0.000	0.000	0.000	0.085	pg153_o3_native_lto.cx7a28_gcp_c2s30
46.282	12.436	2.827	20.974	17.481	0.000	0.000	0.000	0.000	0.000	0.045	pg154_o3_native_lto.cx7a28_gcp_c2s30
77.226	10.030	0.227	0.016	12.501	0.000	0.000	0.000	0.000	0.000	0.053	pg16beta1_o3_native_lto.cx7a28_gcp_c2s30
18.599	8.515	1.808	17.053	53.961	0.064	0.000	0.000	0.000	0.000	0.102	pg16beta2_o3_native_lto.cx7a28_gcp_c2s30
41.174	8.645	3.058	18.293	28.829	0.001	0.000	0.000	0.000	0.000	0.075	pg16beta3_o3_native_lto.cx7a28_gcp_c2s30
q1000.1
- q1000.1: range queries with 1000 insert/s per client
- Legend for results is here.
- Each entry lists the percentage of responses that fit in that bucket (slower than max time for previous bucket, faster than min time for next bucket).
Query response time histogram
256us	1ms	4ms	16ms	64ms	256ms	1s	4s	16s	gt	max	tag
99.545	0.448	0.006	0.001	nonzero	nonzero	0.000	0.000	0.000	0.000	0.101	pg153_o3_native_lto.cx7a28_gcp_c2s30
99.684	0.305	0.009	0.002	nonzero	0.000	0.000	0.000	0.000	0.000	0.036	pg154_o3_native_lto.cx7a28_gcp_c2s30
99.674	0.319	0.006	0.001	nonzero	0.000	0.000	0.000	0.000	0.000	0.036	pg16beta1_o3_native_lto.cx7a28_gcp_c2s30
99.616	0.369	0.011	0.004	nonzero	nonzero	nonzero	0.000	0.000	0.000	0.611	pg16beta2_o3_native_lto.cx7a28_gcp_c2s30
99.681	0.310	0.008	0.002	nonzero	0.000	0.000	0.000	0.000	0.000	0.032	pg16beta3_o3_native_lto.cx7a28_gcp_c2s30
Insert response time histogram
256us	1ms	4ms	16ms	64ms	256ms	1s	4s	16s	gt	max	tag
0.000	0.000	0.000	16.902	82.937	0.161	0.001	0.000	0.000	0.000	0.287	pg153_o3_native_lto.cx7a28_gcp_c2s30
0.000	0.000	0.000	22.045	77.953	0.001	0.000	0.000	0.000	0.000	0.139	pg154_o3_native_lto.cx7a28_gcp_c2s30
0.000	0.000	0.000	18.563	81.423	0.013	0.000	0.000	0.000	0.000	0.119	pg16beta1_o3_native_lto.cx7a28_gcp_c2s30
0.000	0.000	0.000	28.020	71.935	0.035	0.010	0.000	0.000	0.000	0.636	pg16beta2_o3_native_lto.cx7a28_gcp_c2s30
0.000	0.000	0.000	26.555	73.444	0.001	0.000	0.000	0.000	0.000	0.199	pg16beta3_o3_native_lto.cx7a28_gcp_c2s30
Delete response time histogram
256us	1ms	4ms	16ms	64ms	256ms	1s	4s	16s	gt	max	tag
55.252	21.460	0.144	0.025	23.092	0.028	0.000	0.000	0.000	0.000	0.089	pg153_o3_native_lto.cx7a28_gcp_c2s30
26.624	19.401	0.211	0.027	48.973	4.763	0.000	0.000	0.000	0.000	0.113	pg154_o3_native_lto.cx7a28_gcp_c2s30
41.841	23.152	0.207	0.039	31.878	2.884	0.000	0.000	0.000	0.000	0.120	pg16beta1_o3_native_lto.cx7a28_gcp_c2s30
23.439	14.688	0.101	0.010	53.007	8.753	0.002	0.000	0.000	0.000	0.644	pg16beta2_o3_native_lto.cx7a28_gcp_c2s30
34.998	19.280	0.201	0.022	38.218	7.282	0.000	0.000	0.000	0.000	0.131	pg16beta3_o3_native_lto.cx7a28_gcp_c2s30