Introduction
This is a report for the insert benchmark with 12000M docs and 24 client(s). It is generated by scripts (bash, awk, sed) and Tufte might not be impressed. An overview of the insert benchmark is here and a short update is here. Below, by DBMS, I mean DBMS+version.config. An example is my8020.c10b40 where my means MySQL, 8020 is version 8.0.20 and c10b40 is the name for the configuration file.
The test server has 80 cores, hyperthreads enabled, 256G RAM and fast NVMe with XFS. The benchmark was run with 24 clients and there were 1 or 3 connections per client (1 for queries or inserts without rate limits, 1+1 for rate limited inserts+deletes). There are 24 tables, with a client per table. It loads 500M rows per-table without secondary indexes, creates secondary indexes, then inserts 50M rows per-table with a delete per insert to avoid growing the table. It then does 3 read+write tests for 3600s each that do queries as fast as possible with 100, 500 and then 1000 inserts/second/client concurrent with the queries and 1000 deletes/second to avoid growing the table. The database is larger than memory.
The tested DBMS are:
- fbmy8028_ef5b9b101_jun23_hack.cy9cx_u - FB MySQL 8.0.28 compiled at git hash ef5b9b101 in June 2023 with RocksDB 8.3.1, cy9cx_u (base) config
- fbmy8028_ef5b9b101_jun23_hack.cy9cx_u_sd8k - FB MySQL 8.0.28 compiled at git hash ef5b9b101 in June 2023 with RocksDB 8.3.1, cy9cx_u config, adds rocksdb_compaction_sequential_deletes[_window]=8191/8192
- fbmy8028_ef5b9b101_jun23_hack.cy9cx_u_sd32k - FB MySQL 8.0.28 compiled at git hash ef5b9b101 in June 2023 with RocksDB 8.3.1, cy9cx_u config, adds rocksdb_compaction_sequential_deletes[_window]=32767/32768
- fbmy8028_ef5b9b101_jun23_hack.cy9cx_u_sd128k - FB MySQL 8.0.28 compiled at git hash ef5b9b101 in June 2023 with RocksDB 8.3.1, cy9cx_u config, adds rocksdb_compaction_sequential_deletes[_window]=131071/131072
Contents
- Summary
- l.i0: load without secondary indexes
- l.x: create secondary indexes
- l.i1: continue load after secondary indexes created
- q100.1: range queries with 100 insert/s per client
- q500.1: range queries with 500 insert/s per client
- q1000.1: range queries with 1000 insert/s per client
Summary
The numbers are inserts/s for l.i0 and l.i1, indexed docs (or rows) /s for l.x and queries/s for q100, q500, q1000. The values are the average rate over the entire test for inserts (IPS) and queries (QPS). The range of values for IPS and QPS is split into 3 parts: bottom 25%, middle 50%, top 25%. Values in the bottom 25% have a red background, values in the top 25% have a green background and values in the middle have no color. A gray background is used for values that can be ignored because the DBMS did not sustain the target insert rate. Red backgrounds are not used when the minimum value is within 80% of the max value.
| dbms | l.i0 | l.x | l.i1 | q100.1 | q500.1 | q1000.1 |
|---|---|---|---|---|---|---|
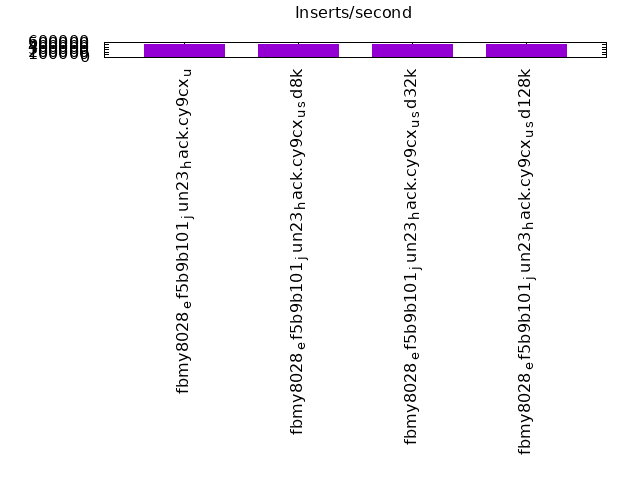
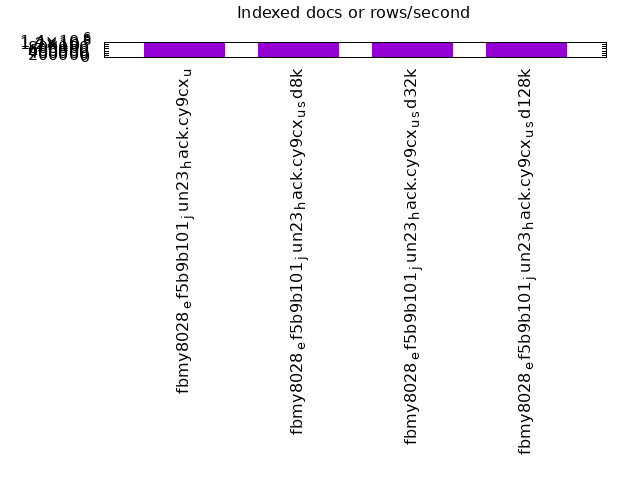
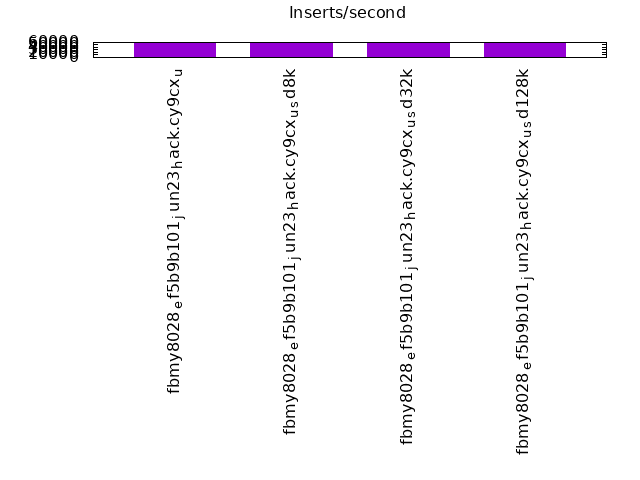
| fbmy8028_ef5b9b101_jun23_hack.cy9cx_u | 537418 | 1384414 | 57441 | 68096 | 64286 | 58654 |
| fbmy8028_ef5b9b101_jun23_hack.cy9cx_u_sd8k | 536481 | 1386974 | 57562 | 64253 | 60577 | 55112 |
| fbmy8028_ef5b9b101_jun23_hack.cy9cx_u_sd32k | 533737 | 1392284 | 57375 | 64859 | 60276 | 54966 |
| fbmy8028_ef5b9b101_jun23_hack.cy9cx_u_sd128k | 537996 | 1396985 | 56891 | 65246 | 60816 | 56063 |
This table has relative throughput, throughput for the DBMS relative to the DBMS in the first line, using the absolute throughput from the previous table. Values less than 0.95 have a yellow background. Values greater than 1.05 have a blue background.
| dbms | l.i0 | l.x | l.i1 | q100.1 | q500.1 | q1000.1 |
|---|---|---|---|---|---|---|
| fbmy8028_ef5b9b101_jun23_hack.cy9cx_u | 1.00 | 1.00 | 1.00 | 1.00 | 1.00 | 1.00 |
| fbmy8028_ef5b9b101_jun23_hack.cy9cx_u_sd8k | 1.00 | 1.00 | 1.00 | 0.94 | 0.94 | 0.94 |
| fbmy8028_ef5b9b101_jun23_hack.cy9cx_u_sd32k | 0.99 | 1.01 | 1.00 | 0.95 | 0.94 | 0.94 |
| fbmy8028_ef5b9b101_jun23_hack.cy9cx_u_sd128k | 1.00 | 1.01 | 0.99 | 0.96 | 0.95 | 0.96 |
This lists the average rate of inserts/s for the tests that do inserts concurrent with queries. For such tests the query rate is listed in the table above. The read+write tests are setup so that the insert rate should match the target rate every second. Cells that are not at least 95% of the target have a red background to indicate a failure to satisfy the target.
| dbms | q100.1 | q500.1 | q1000.1 |
|---|---|---|---|
| fbmy8028_ef5b9b101_jun23_hack.cy9cx_u | 2381 | 11907 | 23828 |
| fbmy8028_ef5b9b101_jun23_hack.cy9cx_u_sd8k | 2381 | 11907 | 23834 |
| fbmy8028_ef5b9b101_jun23_hack.cy9cx_u_sd32k | 2381 | 11907 | 23828 |
| fbmy8028_ef5b9b101_jun23_hack.cy9cx_u_sd128k | 2381 | 11907 | 23828 |
| target | 2400 | 12000 | 24000 |
l.i0
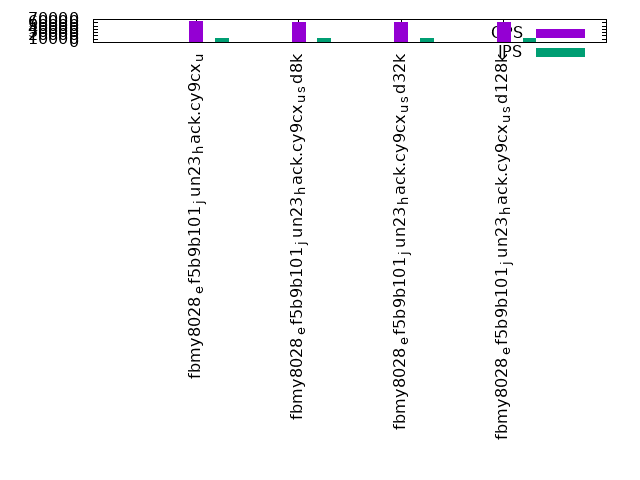
l.i0: load without secondary indexes. Graphs for performance per 1-second interval are here.
Average throughput:
Insert response time histogram: each cell has the percentage of responses that take <= the time in the header and max is the max response time in seconds. For the max column values in the top 25% of the range have a red background and in the bottom 25% of the range have a green background. The red background is not used when the min value is within 80% of the max value.
| dbms | 256us | 1ms | 4ms | 16ms | 64ms | 256ms | 1s | 4s | 16s | gt | max |
|---|---|---|---|---|---|---|---|---|---|---|---|
| fbmy8028_ef5b9b101_jun23_hack.cy9cx_u | 43.568 | 56.385 | 0.005 | 0.042 | 0.237 | ||||||
| fbmy8028_ef5b9b101_jun23_hack.cy9cx_u_sd8k | 43.658 | 56.295 | 0.006 | 0.041 | nonzero | 0.258 | |||||
| fbmy8028_ef5b9b101_jun23_hack.cy9cx_u_sd32k | 41.706 | 58.248 | 0.006 | 0.041 | nonzero | 0.381 | |||||
| fbmy8028_ef5b9b101_jun23_hack.cy9cx_u_sd128k | 43.873 | 56.077 | 0.009 | 0.041 | nonzero | 0.463 |
Performance metrics for the DBMS listed above. Some are normalized by throughput, others are not. Legend for results is here.
ips	qps	rps	rmbps	wps	wmbps	rpq	rkbpq	wpi	wkbpi	csps	cpups	cspq	cpupq	dbgb1	dbgb2	rss	maxop	p50	p99	tag
537418	0	8	0.3	1835.0	116.7	0.000	0.001	0.003	0.222	354757	39.6	0.660	59	376.2	376.7	92.4	0.237	22977	13486	12000m.fbmy8028_ef5b9b101_jun23_hack.cy9cx_u
536481	0	7	0.2	1846.9	117.4	0.000	0.000	0.003	0.224	346019	39.7	0.645	59	376.3	376.9	92.9	0.258	23376	14086	12000m.fbmy8028_ef5b9b101_jun23_hack.cy9cx_u_sd8k
533737	0	15	0.5	1847.0	117.0	0.000	0.001	0.003	0.224	356562	39.7	0.668	60	375.8	376.4	93.7	0.381	22977	14288	12000m.fbmy8028_ef5b9b101_jun23_hack.cy9cx_u_sd32k
537996	0	10	0.3	1841.1	116.7	0.000	0.001	0.003	0.222	355940	39.8	0.662	59	375.5	376.1	92.4	0.463	23177	13884	12000m.fbmy8028_ef5b9b101_jun23_hack.cy9cx_u_sd128k
l.x
l.x: create secondary indexes.
Average throughput:
Performance metrics for the DBMS listed above. Some are normalized by throughput, others are not. Legend for results is here.
ips	qps	rps	rmbps	wps	wmbps	rpq	rkbpq	wpi	wkbpi	csps	cpups	cspq	cpupq	dbgb1	dbgb2	rss	maxop	p50	p99	tag
1384414	0	2539	144.6	1710.1	99.7	0.002	0.107	0.001	0.074	43543	30.5	0.031	18	771.7	771.9	185.5	0.007	NA	NA	12000m.fbmy8028_ef5b9b101_jun23_hack.cy9cx_u
1386974	0	2544	145.1	1717.6	100.6	0.002	0.107	0.001	0.074	43995	30.6	0.032	18	771.5	771.6	185.4	0.004	NA	NA	12000m.fbmy8028_ef5b9b101_jun23_hack.cy9cx_u_sd8k
1392284	0	2553	145.5	1721.7	102.2	0.002	0.107	0.001	0.075	45143	30.7	0.032	18	771.4	771.6	185.4	0.006	NA	NA	12000m.fbmy8028_ef5b9b101_jun23_hack.cy9cx_u_sd32k
1396985	0	2560	146.1	1730.1	102.2	0.002	0.107	0.001	0.075	44889	30.8	0.032	18	771.1	771.3	185.6	0.004	NA	NA	12000m.fbmy8028_ef5b9b101_jun23_hack.cy9cx_u_sd128k
l.i1
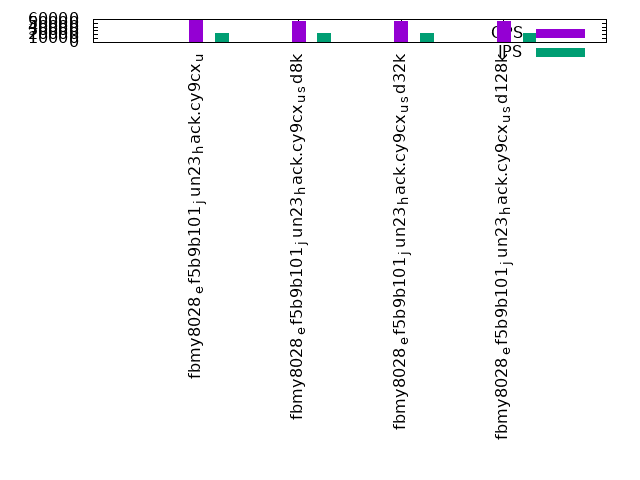
l.i1: continue load after secondary indexes created. Graphs for performance per 1-second interval are here.
Average throughput:
Insert response time histogram: each cell has the percentage of responses that take <= the time in the header and max is the max response time in seconds. For the max column values in the top 25% of the range have a red background and in the bottom 25% of the range have a green background. The red background is not used when the min value is within 80% of the max value.
| dbms | 256us | 1ms | 4ms | 16ms | 64ms | 256ms | 1s | 4s | 16s | gt | max |
|---|---|---|---|---|---|---|---|---|---|---|---|
| fbmy8028_ef5b9b101_jun23_hack.cy9cx_u | 0.022 | 11.129 | 88.752 | 0.069 | 0.027 | 0.002 | 1.156 | ||||
| fbmy8028_ef5b9b101_jun23_hack.cy9cx_u_sd8k | 0.021 | 10.445 | 89.467 | 0.066 | 0.001 | 0.309 | |||||
| fbmy8028_ef5b9b101_jun23_hack.cy9cx_u_sd32k | 0.022 | 10.662 | 89.120 | 0.190 | 0.005 | 0.472 | |||||
| fbmy8028_ef5b9b101_jun23_hack.cy9cx_u_sd128k | 0.023 | 10.555 | 89.141 | 0.272 | 0.009 | 0.417 |
Delete response time histogram: each cell has the percentage of responses that take <= the time in the header and max is the max response time in seconds. For the max column values in the top 25% of the range have a red background and in the bottom 25% of the range have a green background. The red background is not used when the min value is within 80% of the max value.
| dbms | 256us | 1ms | 4ms | 16ms | 64ms | 256ms | 1s | 4s | 16s | gt | max |
|---|---|---|---|---|---|---|---|---|---|---|---|
| fbmy8028_ef5b9b101_jun23_hack.cy9cx_u | 0.023 | 10.804 | 89.075 | 0.070 | 0.027 | 0.002 | 1.156 | ||||
| fbmy8028_ef5b9b101_jun23_hack.cy9cx_u_sd8k | 0.022 | 10.662 | 89.249 | 0.067 | 0.001 | 0.423 | |||||
| fbmy8028_ef5b9b101_jun23_hack.cy9cx_u_sd32k | 0.023 | 10.825 | 88.956 | 0.191 | 0.005 | 0.858 | |||||
| fbmy8028_ef5b9b101_jun23_hack.cy9cx_u_sd128k | 0.024 | 10.778 | 88.916 | 0.273 | 0.009 | 0.502 |
Performance metrics for the DBMS listed above. Some are normalized by throughput, others are not. Legend for results is here.
ips	qps	rps	rmbps	wps	wmbps	rpq	rkbpq	wpi	wkbpi	csps	cpups	cspq	cpupq	dbgb1	dbgb2	rss	maxop	p50	p99	tag
57441	0	670	14.9	1595.7	96.1	0.012	0.266	0.028	1.714	157303	19.1	2.739	266	843.8	844.8	179.9	1.156	2447	999	12000m.fbmy8028_ef5b9b101_jun23_hack.cy9cx_u
57562	0	451	14.4	1944.5	119.7	0.008	0.256	0.034	2.130	157721	20.7	2.740	288	842.2	843.2	179.9	0.309	2398	2048	12000m.fbmy8028_ef5b9b101_jun23_hack.cy9cx_u_sd8k
57375	0	440	13.6	1886.8	115.6	0.008	0.243	0.033	2.063	159692	20.5	2.783	286	846.3	847.4	180.0	0.472	2447	849	12000m.fbmy8028_ef5b9b101_jun23_hack.cy9cx_u_sd32k
56891	0	476	14.3	1735.0	105.7	0.008	0.257	0.030	1.902	161831	20.0	2.845	281	845.2	846.2	180.0	0.417	2447	599	12000m.fbmy8028_ef5b9b101_jun23_hack.cy9cx_u_sd128k
q100.1
q100.1: range queries with 100 insert/s per client. Graphs for performance per 1-second interval are here.
Average throughput:
Query response time histogram: each cell has the percentage of responses that take <= the time in the header and max is the max response time in seconds. For max values in the top 25% of the range have a red background and in the bottom 25% of the range have a green background. The red background is not used when the min value is within 80% of the max value.
| dbms | 256us | 1ms | 4ms | 16ms | 64ms | 256ms | 1s | 4s | 16s | gt | max |
|---|---|---|---|---|---|---|---|---|---|---|---|
| fbmy8028_ef5b9b101_jun23_hack.cy9cx_u | 24.504 | 75.115 | 0.376 | 0.005 | nonzero | 0.001 | 0.083 | ||||
| fbmy8028_ef5b9b101_jun23_hack.cy9cx_u_sd8k | 23.284 | 76.062 | 0.643 | 0.010 | nonzero | 0.001 | 0.108 | ||||
| fbmy8028_ef5b9b101_jun23_hack.cy9cx_u_sd32k | 24.677 | 74.709 | 0.608 | 0.006 | nonzero | 0.001 | 0.083 | ||||
| fbmy8028_ef5b9b101_jun23_hack.cy9cx_u_sd128k | 25.000 | 74.416 | 0.579 | 0.004 | nonzero | 0.001 | 0.082 |
Insert response time histogram: each cell has the percentage of responses that take <= the time in the header and max is the max response time in seconds. For max values in the top 25% of the range have a red background and in the bottom 25% of the range have a green background. The red background is not used when the min value is within 80% of the max value.
| dbms | 256us | 1ms | 4ms | 16ms | 64ms | 256ms | 1s | 4s | 16s | gt | max |
|---|---|---|---|---|---|---|---|---|---|---|---|
| fbmy8028_ef5b9b101_jun23_hack.cy9cx_u | 99.749 | 0.244 | 0.005 | 0.002 | 0.084 | ||||||
| fbmy8028_ef5b9b101_jun23_hack.cy9cx_u_sd8k | 98.847 | 1.132 | 0.020 | 0.002 | 0.076 | ||||||
| fbmy8028_ef5b9b101_jun23_hack.cy9cx_u_sd32k | 93.806 | 6.188 | 0.006 | 0.001 | 0.072 | ||||||
| fbmy8028_ef5b9b101_jun23_hack.cy9cx_u_sd128k | 99.223 | 0.770 | 0.003 | 0.004 | 0.088 |
Delete response time histogram: each cell has the percentage of responses that take <= the time in the header and max is the max response time in seconds. For max values in the top 25% of the range have a red background and in the bottom 25% of the range have a green background. The red background is not used when the min value is within 80% of the max value.
| dbms | 256us | 1ms | 4ms | 16ms | 64ms | 256ms | 1s | 4s | 16s | gt | max |
|---|---|---|---|---|---|---|---|---|---|---|---|
| fbmy8028_ef5b9b101_jun23_hack.cy9cx_u | 99.817 | 0.165 | 0.011 | 0.008 | 0.084 | ||||||
| fbmy8028_ef5b9b101_jun23_hack.cy9cx_u_sd8k | 99.366 | 0.605 | 0.027 | 0.002 | 0.077 | ||||||
| fbmy8028_ef5b9b101_jun23_hack.cy9cx_u_sd32k | 95.047 | 4.939 | 0.011 | 0.003 | 0.078 | ||||||
| fbmy8028_ef5b9b101_jun23_hack.cy9cx_u_sd128k | 99.597 | 0.386 | 0.010 | 0.007 | 0.088 |
Performance metrics for the DBMS listed above. Some are normalized by throughput, others are not. Legend for results is here.
ips	qps	rps	rmbps	wps	wmbps	rpq	rkbpq	wpi	wkbpi	csps	cpups	cspq	cpupq	dbgb1	dbgb2	rss	maxop	p50	p99	tag
2381	68096	3785	34.8	100.9	5.3	0.056	0.523	0.042	2.263	298655	32.3	4.386	379	841.4	843.4	183.7	0.083	2925	2046	12000m.fbmy8028_ef5b9b101_jun23_hack.cy9cx_u
2381	64253	5091	48.3	300.5	17.0	0.079	0.770	0.126	7.320	285824	33.0	4.448	411	842.1	844.2	185.7	0.108	2814	2095	12000m.fbmy8028_ef5b9b101_jun23_hack.cy9cx_u_sd8k
2381	64859	4976	47.0	142.7	7.7	0.077	0.742	0.060	3.313	287840	32.5	4.438	401	842.0	843.8	184.0	0.083	2973	2269	12000m.fbmy8028_ef5b9b101_jun23_hack.cy9cx_u_sd32k
2381	65246	4820	45.0	106.0	5.5	0.074	0.706	0.045	2.382	288564	32.2	4.423	395	841.6	843.7	183.9	0.082	3021	2285	12000m.fbmy8028_ef5b9b101_jun23_hack.cy9cx_u_sd128k
q500.1
q500.1: range queries with 500 insert/s per client. Graphs for performance per 1-second interval are here.
Average throughput:
Query response time histogram: each cell has the percentage of responses that take <= the time in the header and max is the max response time in seconds. For max values in the top 25% of the range have a red background and in the bottom 25% of the range have a green background. The red background is not used when the min value is within 80% of the max value.
| dbms | 256us | 1ms | 4ms | 16ms | 64ms | 256ms | 1s | 4s | 16s | gt | max |
|---|---|---|---|---|---|---|---|---|---|---|---|
| fbmy8028_ef5b9b101_jun23_hack.cy9cx_u | 12.264 | 87.682 | 0.034 | 0.020 | nonzero | 0.063 | |||||
| fbmy8028_ef5b9b101_jun23_hack.cy9cx_u_sd8k | 10.812 | 89.127 | 0.042 | 0.018 | nonzero | nonzero | 0.068 | ||||
| fbmy8028_ef5b9b101_jun23_hack.cy9cx_u_sd32k | 10.126 | 89.812 | 0.043 | 0.019 | nonzero | nonzero | 0.112 | ||||
| fbmy8028_ef5b9b101_jun23_hack.cy9cx_u_sd128k | 10.457 | 89.485 | 0.040 | 0.018 | nonzero | nonzero | 0.097 |
Insert response time histogram: each cell has the percentage of responses that take <= the time in the header and max is the max response time in seconds. For max values in the top 25% of the range have a red background and in the bottom 25% of the range have a green background. The red background is not used when the min value is within 80% of the max value.
| dbms | 256us | 1ms | 4ms | 16ms | 64ms | 256ms | 1s | 4s | 16s | gt | max |
|---|---|---|---|---|---|---|---|---|---|---|---|
| fbmy8028_ef5b9b101_jun23_hack.cy9cx_u | 80.199 | 19.772 | 0.029 | nonzero | 0.082 | ||||||
| fbmy8028_ef5b9b101_jun23_hack.cy9cx_u_sd8k | 7.336 | 27.365 | 65.299 | 0.053 | |||||||
| fbmy8028_ef5b9b101_jun23_hack.cy9cx_u_sd32k | 4.842 | 26.033 | 69.125 | 0.057 | |||||||
| fbmy8028_ef5b9b101_jun23_hack.cy9cx_u_sd128k | 4.981 | 49.786 | 45.233 | 0.051 |
Delete response time histogram: each cell has the percentage of responses that take <= the time in the header and max is the max response time in seconds. For max values in the top 25% of the range have a red background and in the bottom 25% of the range have a green background. The red background is not used when the min value is within 80% of the max value.
| dbms | 256us | 1ms | 4ms | 16ms | 64ms | 256ms | 1s | 4s | 16s | gt | max |
|---|---|---|---|---|---|---|---|---|---|---|---|
| fbmy8028_ef5b9b101_jun23_hack.cy9cx_u | 81.620 | 18.350 | 0.030 | nonzero | 0.082 | ||||||
| fbmy8028_ef5b9b101_jun23_hack.cy9cx_u_sd8k | 7.852 | 27.134 | 65.014 | nonzero | 0.075 | ||||||
| fbmy8028_ef5b9b101_jun23_hack.cy9cx_u_sd32k | 5.507 | 25.775 | 68.719 | nonzero | 0.081 | ||||||
| fbmy8028_ef5b9b101_jun23_hack.cy9cx_u_sd128k | 5.417 | 49.563 | 45.020 | 0.001 | 0.098 |
Performance metrics for the DBMS listed above. Some are normalized by throughput, others are not. Legend for results is here.
ips	qps	rps	rmbps	wps	wmbps	rpq	rkbpq	wpi	wkbpi	csps	cpups	cspq	cpupq	dbgb1	dbgb2	rss	maxop	p50	p99	tag
11907	64286	924	12.2	376.5	19.8	0.014	0.194	0.032	1.701	282391	34.6	4.393	431	847.5	848.9	186.3	0.063	2781	2462	12000m.fbmy8028_ef5b9b101_jun23_hack.cy9cx_u
11907	60577	1986	27.7	442.7	23.4	0.033	0.468	0.037	2.008	274990	35.6	4.539	470	842.5	843.9	187.1	0.068	2558	2254	12000m.fbmy8028_ef5b9b101_jun23_hack.cy9cx_u_sd8k
11907	60276	1926	27.3	447.8	23.8	0.032	0.465	0.038	2.043	274091	35.6	4.547	472	842.3	843.8	186.2	0.112	2669	2334	12000m.fbmy8028_ef5b9b101_jun23_hack.cy9cx_u_sd32k
11907	60816	1887	26.2	439.8	23.6	0.031	0.441	0.037	2.028	275051	35.5	4.523	467	842.5	844.0	186.4	0.097	2765	2397	12000m.fbmy8028_ef5b9b101_jun23_hack.cy9cx_u_sd128k
q1000.1
q1000.1: range queries with 1000 insert/s per client. Graphs for performance per 1-second interval are here.
Average throughput:
Query response time histogram: each cell has the percentage of responses that take <= the time in the header and max is the max response time in seconds. For max values in the top 25% of the range have a red background and in the bottom 25% of the range have a green background. The red background is not used when the min value is within 80% of the max value.
| dbms | 256us | 1ms | 4ms | 16ms | 64ms | 256ms | 1s | 4s | 16s | gt | max |
|---|---|---|---|---|---|---|---|---|---|---|---|
| fbmy8028_ef5b9b101_jun23_hack.cy9cx_u | 3.033 | 96.806 | 0.115 | 0.044 | 0.002 | nonzero | 0.120 | ||||
| fbmy8028_ef5b9b101_jun23_hack.cy9cx_u_sd8k | 2.536 | 97.138 | 0.280 | 0.046 | nonzero | nonzero | 0.067 | ||||
| fbmy8028_ef5b9b101_jun23_hack.cy9cx_u_sd32k | 2.456 | 97.214 | 0.284 | 0.046 | nonzero | nonzero | 0.236 | ||||
| fbmy8028_ef5b9b101_jun23_hack.cy9cx_u_sd128k | 2.986 | 96.763 | 0.210 | 0.041 | nonzero | nonzero | 0.108 |
Insert response time histogram: each cell has the percentage of responses that take <= the time in the header and max is the max response time in seconds. For max values in the top 25% of the range have a red background and in the bottom 25% of the range have a green background. The red background is not used when the min value is within 80% of the max value.
| dbms | 256us | 1ms | 4ms | 16ms | 64ms | 256ms | 1s | 4s | 16s | gt | max |
|---|---|---|---|---|---|---|---|---|---|---|---|
| fbmy8028_ef5b9b101_jun23_hack.cy9cx_u | 33.209 | 35.564 | 31.226 | 0.001 | 0.097 | ||||||
| fbmy8028_ef5b9b101_jun23_hack.cy9cx_u_sd8k | 3.442 | 18.155 | 78.402 | 0.002 | 0.077 | ||||||
| fbmy8028_ef5b9b101_jun23_hack.cy9cx_u_sd32k | 2.359 | 18.102 | 79.535 | 0.003 | 0.079 | ||||||
| fbmy8028_ef5b9b101_jun23_hack.cy9cx_u_sd128k | 3.251 | 22.909 | 73.838 | 0.002 | 0.101 |
Delete response time histogram: each cell has the percentage of responses that take <= the time in the header and max is the max response time in seconds. For max values in the top 25% of the range have a red background and in the bottom 25% of the range have a green background. The red background is not used when the min value is within 80% of the max value.
| dbms | 256us | 1ms | 4ms | 16ms | 64ms | 256ms | 1s | 4s | 16s | gt | max |
|---|---|---|---|---|---|---|---|---|---|---|---|
| fbmy8028_ef5b9b101_jun23_hack.cy9cx_u | 33.701 | 35.060 | 31.238 | 0.001 | 0.097 | ||||||
| fbmy8028_ef5b9b101_jun23_hack.cy9cx_u_sd8k | 3.491 | 18.099 | 78.408 | 0.002 | 0.128 | ||||||
| fbmy8028_ef5b9b101_jun23_hack.cy9cx_u_sd32k | 2.385 | 18.092 | 79.519 | 0.004 | 0.239 | ||||||
| fbmy8028_ef5b9b101_jun23_hack.cy9cx_u_sd128k | 3.396 | 22.795 | 73.807 | 0.002 | 0.104 |
Performance metrics for the DBMS listed above. Some are normalized by throughput, others are not. Legend for results is here.
ips	qps	rps	rmbps	wps	wmbps	rpq	rkbpq	wpi	wkbpi	csps	cpups	cspq	cpupq	dbgb1	dbgb2	rss	maxop	p50	p99	tag
23828	58654	1565	26.2	835.2	40.6	0.027	0.458	0.035	1.747	278755	39.0	4.753	532	842.8	843.4	187.4	0.120	2478	1966	12000m.fbmy8028_ef5b9b101_jun23_hack.cy9cx_u
23834	55112	3302	51.9	1019.8	50.4	0.060	0.965	0.043	2.163	275972	40.5	5.007	588	846.2	846.8	188.4	0.067	2301	1934	12000m.fbmy8028_ef5b9b101_jun23_hack.cy9cx_u_sd8k
23828	54966	3210	50.9	996.7	50.0	0.058	0.948	0.042	2.150	275916	40.5	5.020	589	842.7	843.4	187.4	0.236	2382	1998	12000m.fbmy8028_ef5b9b101_jun23_hack.cy9cx_u_sd32k
23828	56063	2844	43.8	858.4	43.3	0.051	0.799	0.036	1.860	278234	39.6	4.963	565	842.5	843.2	187.3	0.108	2510	2157	12000m.fbmy8028_ef5b9b101_jun23_hack.cy9cx_u_sd128k
l.i0
l.i0: load without secondary indexes
Performance metrics for all DBMS, not just the ones listed above. Some are normalized by throughput, others are not. Legend for results is here.
ips	qps	rps	rmbps	wps	wmbps	rpq	rkbpq	wpi	wkbpi	csps	cpups	cspq	cpupq	dbgb1	dbgb2	rss	maxop	p50	p99	tag
537418	0	8	0.3	1835.0	116.7	0.000	0.001	0.003	0.222	354757	39.6	0.660	59	376.2	376.7	92.4	0.237	22977	13486	12000m.fbmy8028_ef5b9b101_jun23_hack.cy9cx_u
536481	0	7	0.2	1846.9	117.4	0.000	0.000	0.003	0.224	346019	39.7	0.645	59	376.3	376.9	92.9	0.258	23376	14086	12000m.fbmy8028_ef5b9b101_jun23_hack.cy9cx_u_sd8k
533737	0	15	0.5	1847.0	117.0	0.000	0.001	0.003	0.224	356562	39.7	0.668	60	375.8	376.4	93.7	0.381	22977	14288	12000m.fbmy8028_ef5b9b101_jun23_hack.cy9cx_u_sd32k
537996	0	10	0.3	1841.1	116.7	0.000	0.001	0.003	0.222	355940	39.8	0.662	59	375.5	376.1	92.4	0.463	23177	13884	12000m.fbmy8028_ef5b9b101_jun23_hack.cy9cx_u_sd128k
l.x
l.x: create secondary indexes
Performance metrics for all DBMS, not just the ones listed above. Some are normalized by throughput, others are not. Legend for results is here.
ips	qps	rps	rmbps	wps	wmbps	rpq	rkbpq	wpi	wkbpi	csps	cpups	cspq	cpupq	dbgb1	dbgb2	rss	maxop	p50	p99	tag
1384414	0	2539	144.6	1710.1	99.7	0.002	0.107	0.001	0.074	43543	30.5	0.031	18	771.7	771.9	185.5	0.007	NA	NA	12000m.fbmy8028_ef5b9b101_jun23_hack.cy9cx_u
1386974	0	2544	145.1	1717.6	100.6	0.002	0.107	0.001	0.074	43995	30.6	0.032	18	771.5	771.6	185.4	0.004	NA	NA	12000m.fbmy8028_ef5b9b101_jun23_hack.cy9cx_u_sd8k
1392284	0	2553	145.5	1721.7	102.2	0.002	0.107	0.001	0.075	45143	30.7	0.032	18	771.4	771.6	185.4	0.006	NA	NA	12000m.fbmy8028_ef5b9b101_jun23_hack.cy9cx_u_sd32k
1396985	0	2560	146.1	1730.1	102.2	0.002	0.107	0.001	0.075	44889	30.8	0.032	18	771.1	771.3	185.6	0.004	NA	NA	12000m.fbmy8028_ef5b9b101_jun23_hack.cy9cx_u_sd128k
l.i1
l.i1: continue load after secondary indexes created
Performance metrics for all DBMS, not just the ones listed above. Some are normalized by throughput, others are not. Legend for results is here.
ips	qps	rps	rmbps	wps	wmbps	rpq	rkbpq	wpi	wkbpi	csps	cpups	cspq	cpupq	dbgb1	dbgb2	rss	maxop	p50	p99	tag
57441	0	670	14.9	1595.7	96.1	0.012	0.266	0.028	1.714	157303	19.1	2.739	266	843.8	844.8	179.9	1.156	2447	999	12000m.fbmy8028_ef5b9b101_jun23_hack.cy9cx_u
57562	0	451	14.4	1944.5	119.7	0.008	0.256	0.034	2.130	157721	20.7	2.740	288	842.2	843.2	179.9	0.309	2398	2048	12000m.fbmy8028_ef5b9b101_jun23_hack.cy9cx_u_sd8k
57375	0	440	13.6	1886.8	115.6	0.008	0.243	0.033	2.063	159692	20.5	2.783	286	846.3	847.4	180.0	0.472	2447	849	12000m.fbmy8028_ef5b9b101_jun23_hack.cy9cx_u_sd32k
56891	0	476	14.3	1735.0	105.7	0.008	0.257	0.030	1.902	161831	20.0	2.845	281	845.2	846.2	180.0	0.417	2447	599	12000m.fbmy8028_ef5b9b101_jun23_hack.cy9cx_u_sd128k
q100.1
q100.1: range queries with 100 insert/s per client
Performance metrics for all DBMS, not just the ones listed above. Some are normalized by throughput, others are not. Legend for results is here.
ips	qps	rps	rmbps	wps	wmbps	rpq	rkbpq	wpi	wkbpi	csps	cpups	cspq	cpupq	dbgb1	dbgb2	rss	maxop	p50	p99	tag
2381	68096	3785	34.8	100.9	5.3	0.056	0.523	0.042	2.263	298655	32.3	4.386	379	841.4	843.4	183.7	0.083	2925	2046	12000m.fbmy8028_ef5b9b101_jun23_hack.cy9cx_u
2381	64253	5091	48.3	300.5	17.0	0.079	0.770	0.126	7.320	285824	33.0	4.448	411	842.1	844.2	185.7	0.108	2814	2095	12000m.fbmy8028_ef5b9b101_jun23_hack.cy9cx_u_sd8k
2381	64859	4976	47.0	142.7	7.7	0.077	0.742	0.060	3.313	287840	32.5	4.438	401	842.0	843.8	184.0	0.083	2973	2269	12000m.fbmy8028_ef5b9b101_jun23_hack.cy9cx_u_sd32k
2381	65246	4820	45.0	106.0	5.5	0.074	0.706	0.045	2.382	288564	32.2	4.423	395	841.6	843.7	183.9	0.082	3021	2285	12000m.fbmy8028_ef5b9b101_jun23_hack.cy9cx_u_sd128k
q500.1
q500.1: range queries with 500 insert/s per client
Performance metrics for all DBMS, not just the ones listed above. Some are normalized by throughput, others are not. Legend for results is here.
ips	qps	rps	rmbps	wps	wmbps	rpq	rkbpq	wpi	wkbpi	csps	cpups	cspq	cpupq	dbgb1	dbgb2	rss	maxop	p50	p99	tag
11907	64286	924	12.2	376.5	19.8	0.014	0.194	0.032	1.701	282391	34.6	4.393	431	847.5	848.9	186.3	0.063	2781	2462	12000m.fbmy8028_ef5b9b101_jun23_hack.cy9cx_u
11907	60577	1986	27.7	442.7	23.4	0.033	0.468	0.037	2.008	274990	35.6	4.539	470	842.5	843.9	187.1	0.068	2558	2254	12000m.fbmy8028_ef5b9b101_jun23_hack.cy9cx_u_sd8k
11907	60276	1926	27.3	447.8	23.8	0.032	0.465	0.038	2.043	274091	35.6	4.547	472	842.3	843.8	186.2	0.112	2669	2334	12000m.fbmy8028_ef5b9b101_jun23_hack.cy9cx_u_sd32k
11907	60816	1887	26.2	439.8	23.6	0.031	0.441	0.037	2.028	275051	35.5	4.523	467	842.5	844.0	186.4	0.097	2765	2397	12000m.fbmy8028_ef5b9b101_jun23_hack.cy9cx_u_sd128k
q1000.1
q1000.1: range queries with 1000 insert/s per client
Performance metrics for all DBMS, not just the ones listed above. Some are normalized by throughput, others are not. Legend for results is here.
ips	qps	rps	rmbps	wps	wmbps	rpq	rkbpq	wpi	wkbpi	csps	cpups	cspq	cpupq	dbgb1	dbgb2	rss	maxop	p50	p99	tag
23828	58654	1565	26.2	835.2	40.6	0.027	0.458	0.035	1.747	278755	39.0	4.753	532	842.8	843.4	187.4	0.120	2478	1966	12000m.fbmy8028_ef5b9b101_jun23_hack.cy9cx_u
23834	55112	3302	51.9	1019.8	50.4	0.060	0.965	0.043	2.163	275972	40.5	5.007	588	846.2	846.8	188.4	0.067	2301	1934	12000m.fbmy8028_ef5b9b101_jun23_hack.cy9cx_u_sd8k
23828	54966	3210	50.9	996.7	50.0	0.058	0.948	0.042	2.150	275916	40.5	5.020	589	842.7	843.4	187.4	0.236	2382	1998	12000m.fbmy8028_ef5b9b101_jun23_hack.cy9cx_u_sd32k
23828	56063	2844	43.8	858.4	43.3	0.051	0.799	0.036	1.860	278234	39.6	4.963	565	842.5	843.2	187.3	0.108	2510	2157	12000m.fbmy8028_ef5b9b101_jun23_hack.cy9cx_u_sd128k
l.i0
- l.i0: load without secondary indexes
- Legend for results is here.
- Each entry lists the percentage of responses that fit in that bucket (slower than max time for previous bucket, faster than min time for next bucket).
Insert response time histogram
256us	1ms	4ms	16ms	64ms	256ms	1s	4s	16s	gt	max	tag
0.000	0.000	43.568	56.385	0.005	0.042	0.000	0.000	0.000	0.000	0.237	fbmy8028_ef5b9b101_jun23_hack.cy9cx_u
0.000	0.000	43.658	56.295	0.006	0.041	nonzero	0.000	0.000	0.000	0.258	fbmy8028_ef5b9b101_jun23_hack.cy9cx_u_sd8k
0.000	0.000	41.706	58.248	0.006	0.041	nonzero	0.000	0.000	0.000	0.381	fbmy8028_ef5b9b101_jun23_hack.cy9cx_u_sd32k
0.000	0.000	43.873	56.077	0.009	0.041	nonzero	0.000	0.000	0.000	0.463	fbmy8028_ef5b9b101_jun23_hack.cy9cx_u_sd128k
l.x
- l.x: create secondary indexes
- Legend for results is here.
- Each entry lists the percentage of responses that fit in that bucket (slower than max time for previous bucket, faster than min time for next bucket).
TODO - determine whether there is data for create index response time
l.i1
- l.i1: continue load after secondary indexes created
- Legend for results is here.
- Each entry lists the percentage of responses that fit in that bucket (slower than max time for previous bucket, faster than min time for next bucket).
Insert response time histogram
256us	1ms	4ms	16ms	64ms	256ms	1s	4s	16s	gt	max	tag
0.000	0.000	0.022	11.129	88.752	0.069	0.027	0.002	0.000	0.000	1.156	fbmy8028_ef5b9b101_jun23_hack.cy9cx_u
0.000	0.000	0.021	10.445	89.467	0.066	0.001	0.000	0.000	0.000	0.309	fbmy8028_ef5b9b101_jun23_hack.cy9cx_u_sd8k
0.000	0.000	0.022	10.662	89.120	0.190	0.005	0.000	0.000	0.000	0.472	fbmy8028_ef5b9b101_jun23_hack.cy9cx_u_sd32k
0.000	0.000	0.023	10.555	89.141	0.272	0.009	0.000	0.000	0.000	0.417	fbmy8028_ef5b9b101_jun23_hack.cy9cx_u_sd128k
Delete response time histogram
256us	1ms	4ms	16ms	64ms	256ms	1s	4s	16s	gt	max	tag
0.000	0.000	0.023	10.804	89.075	0.070	0.027	0.002	0.000	0.000	1.156	fbmy8028_ef5b9b101_jun23_hack.cy9cx_u
0.000	0.000	0.022	10.662	89.249	0.067	0.001	0.000	0.000	0.000	0.423	fbmy8028_ef5b9b101_jun23_hack.cy9cx_u_sd8k
0.000	0.000	0.023	10.825	88.956	0.191	0.005	0.000	0.000	0.000	0.858	fbmy8028_ef5b9b101_jun23_hack.cy9cx_u_sd32k
0.000	0.000	0.024	10.778	88.916	0.273	0.009	0.000	0.000	0.000	0.502	fbmy8028_ef5b9b101_jun23_hack.cy9cx_u_sd128k
q100.1
- q100.1: range queries with 100 insert/s per client
- Legend for results is here.
- Each entry lists the percentage of responses that fit in that bucket (slower than max time for previous bucket, faster than min time for next bucket).
Query response time histogram
256us	1ms	4ms	16ms	64ms	256ms	1s	4s	16s	gt	max	tag
24.504	75.115	0.376	0.005	nonzero	0.001	0.000	0.000	0.000	0.000	0.083	fbmy8028_ef5b9b101_jun23_hack.cy9cx_u
23.284	76.062	0.643	0.010	nonzero	0.001	0.000	0.000	0.000	0.000	0.108	fbmy8028_ef5b9b101_jun23_hack.cy9cx_u_sd8k
24.677	74.709	0.608	0.006	nonzero	0.001	0.000	0.000	0.000	0.000	0.083	fbmy8028_ef5b9b101_jun23_hack.cy9cx_u_sd32k
25.000	74.416	0.579	0.004	nonzero	0.001	0.000	0.000	0.000	0.000	0.082	fbmy8028_ef5b9b101_jun23_hack.cy9cx_u_sd128k
Insert response time histogram
256us	1ms	4ms	16ms	64ms	256ms	1s	4s	16s	gt	max	tag
0.000	0.000	99.749	0.244	0.005	0.002	0.000	0.000	0.000	0.000	0.084	fbmy8028_ef5b9b101_jun23_hack.cy9cx_u
0.000	0.000	98.847	1.132	0.020	0.002	0.000	0.000	0.000	0.000	0.076	fbmy8028_ef5b9b101_jun23_hack.cy9cx_u_sd8k
0.000	0.000	93.806	6.188	0.006	0.001	0.000	0.000	0.000	0.000	0.072	fbmy8028_ef5b9b101_jun23_hack.cy9cx_u_sd32k
0.000	0.000	99.223	0.770	0.003	0.004	0.000	0.000	0.000	0.000	0.088	fbmy8028_ef5b9b101_jun23_hack.cy9cx_u_sd128k
Delete response time histogram
256us	1ms	4ms	16ms	64ms	256ms	1s	4s	16s	gt	max	tag
0.000	0.000	99.817	0.165	0.011	0.008	0.000	0.000	0.000	0.000	0.084	fbmy8028_ef5b9b101_jun23_hack.cy9cx_u
0.000	0.000	99.366	0.605	0.027	0.002	0.000	0.000	0.000	0.000	0.077	fbmy8028_ef5b9b101_jun23_hack.cy9cx_u_sd8k
0.000	0.000	95.047	4.939	0.011	0.003	0.000	0.000	0.000	0.000	0.078	fbmy8028_ef5b9b101_jun23_hack.cy9cx_u_sd32k
0.000	0.000	99.597	0.386	0.010	0.007	0.000	0.000	0.000	0.000	0.088	fbmy8028_ef5b9b101_jun23_hack.cy9cx_u_sd128k
q500.1
- q500.1: range queries with 500 insert/s per client
- Legend for results is here.
- Each entry lists the percentage of responses that fit in that bucket (slower than max time for previous bucket, faster than min time for next bucket).
Query response time histogram
256us	1ms	4ms	16ms	64ms	256ms	1s	4s	16s	gt	max	tag
12.264	87.682	0.034	0.020	nonzero	0.000	0.000	0.000	0.000	0.000	0.063	fbmy8028_ef5b9b101_jun23_hack.cy9cx_u
10.812	89.127	0.042	0.018	nonzero	nonzero	0.000	0.000	0.000	0.000	0.068	fbmy8028_ef5b9b101_jun23_hack.cy9cx_u_sd8k
10.126	89.812	0.043	0.019	nonzero	nonzero	0.000	0.000	0.000	0.000	0.112	fbmy8028_ef5b9b101_jun23_hack.cy9cx_u_sd32k
10.457	89.485	0.040	0.018	nonzero	nonzero	0.000	0.000	0.000	0.000	0.097	fbmy8028_ef5b9b101_jun23_hack.cy9cx_u_sd128k
Insert response time histogram
256us	1ms	4ms	16ms	64ms	256ms	1s	4s	16s	gt	max	tag
0.000	0.000	80.199	19.772	0.029	nonzero	0.000	0.000	0.000	0.000	0.082	fbmy8028_ef5b9b101_jun23_hack.cy9cx_u
0.000	0.000	7.336	27.365	65.299	0.000	0.000	0.000	0.000	0.000	0.053	fbmy8028_ef5b9b101_jun23_hack.cy9cx_u_sd8k
0.000	0.000	4.842	26.033	69.125	0.000	0.000	0.000	0.000	0.000	0.057	fbmy8028_ef5b9b101_jun23_hack.cy9cx_u_sd32k
0.000	0.000	4.981	49.786	45.233	0.000	0.000	0.000	0.000	0.000	0.051	fbmy8028_ef5b9b101_jun23_hack.cy9cx_u_sd128k
Delete response time histogram
256us	1ms	4ms	16ms	64ms	256ms	1s	4s	16s	gt	max	tag
0.000	0.000	81.620	18.350	0.030	nonzero	0.000	0.000	0.000	0.000	0.082	fbmy8028_ef5b9b101_jun23_hack.cy9cx_u
0.000	0.000	7.852	27.134	65.014	nonzero	0.000	0.000	0.000	0.000	0.075	fbmy8028_ef5b9b101_jun23_hack.cy9cx_u_sd8k
0.000	0.000	5.507	25.775	68.719	nonzero	0.000	0.000	0.000	0.000	0.081	fbmy8028_ef5b9b101_jun23_hack.cy9cx_u_sd32k
0.000	0.000	5.417	49.563	45.020	0.001	0.000	0.000	0.000	0.000	0.098	fbmy8028_ef5b9b101_jun23_hack.cy9cx_u_sd128k
q1000.1
- q1000.1: range queries with 1000 insert/s per client
- Legend for results is here.
- Each entry lists the percentage of responses that fit in that bucket (slower than max time for previous bucket, faster than min time for next bucket).
Query response time histogram
256us	1ms	4ms	16ms	64ms	256ms	1s	4s	16s	gt	max	tag
3.033	96.806	0.115	0.044	0.002	nonzero	0.000	0.000	0.000	0.000	0.120	fbmy8028_ef5b9b101_jun23_hack.cy9cx_u
2.536	97.138	0.280	0.046	nonzero	nonzero	0.000	0.000	0.000	0.000	0.067	fbmy8028_ef5b9b101_jun23_hack.cy9cx_u_sd8k
2.456	97.214	0.284	0.046	nonzero	nonzero	0.000	0.000	0.000	0.000	0.236	fbmy8028_ef5b9b101_jun23_hack.cy9cx_u_sd32k
2.986	96.763	0.210	0.041	nonzero	nonzero	0.000	0.000	0.000	0.000	0.108	fbmy8028_ef5b9b101_jun23_hack.cy9cx_u_sd128k
Insert response time histogram
256us	1ms	4ms	16ms	64ms	256ms	1s	4s	16s	gt	max	tag
0.000	0.000	33.209	35.564	31.226	0.001	0.000	0.000	0.000	0.000	0.097	fbmy8028_ef5b9b101_jun23_hack.cy9cx_u
0.000	0.000	3.442	18.155	78.402	0.002	0.000	0.000	0.000	0.000	0.077	fbmy8028_ef5b9b101_jun23_hack.cy9cx_u_sd8k
0.000	0.000	2.359	18.102	79.535	0.003	0.000	0.000	0.000	0.000	0.079	fbmy8028_ef5b9b101_jun23_hack.cy9cx_u_sd32k
0.000	0.000	3.251	22.909	73.838	0.002	0.000	0.000	0.000	0.000	0.101	fbmy8028_ef5b9b101_jun23_hack.cy9cx_u_sd128k
Delete response time histogram
256us	1ms	4ms	16ms	64ms	256ms	1s	4s	16s	gt	max	tag
0.000	0.000	33.701	35.060	31.238	0.001	0.000	0.000	0.000	0.000	0.097	fbmy8028_ef5b9b101_jun23_hack.cy9cx_u
0.000	0.000	3.491	18.099	78.408	0.002	0.000	0.000	0.000	0.000	0.128	fbmy8028_ef5b9b101_jun23_hack.cy9cx_u_sd8k
0.000	0.000	2.385	18.092	79.519	0.004	0.000	0.000	0.000	0.000	0.239	fbmy8028_ef5b9b101_jun23_hack.cy9cx_u_sd32k
0.000	0.000	3.396	22.795	73.807	0.002	0.000	0.000	0.000	0.000	0.104	fbmy8028_ef5b9b101_jun23_hack.cy9cx_u_sd128k