Introduction
This is a report for the insert benchmark with 160M docs and 8 client(s). It is generated by scripts (bash, awk, sed) and Tufte might not be impressed. An overview of the insert benchmark is here and a short update is here. Below, by DBMS, I mean DBMS+version.config. An example is my8020.c10b40 where my means MySQL, 8020 is version 8.0.20 and c10b40 is the name for the configuration file.
The test server is a c2-standard-30 from GCP with 15 cores, hyperthreads disabled, 120G RAM, XFS + SW RAID 0 on 4 NVMe devices (1.5TB). The benchmark was run with 8 client and there were 1 or 3 connections per client (1 for queries or inserts without rate limits, 1+1 for rate limited inserts+deletes). There are 8 tables, client per table. It loads 20M rows without secondary indexes, creates secondary indexes, then inserts 200M rows with a delete per insert to avoid growing the table. It then does 3 read+write tests for 7200s each that do queries as fast as possible with 100, 500 and then 1000 inserts/second/client concurrent with the queries and 1000 deletes/second to avoid growing the table. The database is cached by InnoDB.
The tested DBMS are:
- my5651_rel.cy10a_gcp_c2s30 - InnoDB and MySQL 5.6.51, rel build, cy10a_gcp_c2s30 config, compiled with CMAKE_BUILD_TYPE=Release
- my5740_rel_lto.cy10a_gcp_c2s30 - InnoDB and MySQL 5.7.40, rel_lto build, cy10a_gcp_c2s30 config, compiled with CMAKE_BUILD_TYPE=Release
- my8033_rel_lto.cy10a_gcp_c2s30 - InnoDB and MySQL 8.0.33, rel_lto build, cy10a_gcp_c2s30 config, compiled with CMAKE_BUILD_TYPE=Release
- ps8033_rel_lto.cy10aps1_gcp_c2s30 - InnoDB and Percona Server 8.0.33, rel_lto build, cy10aps1_gcp_c2s30 config, compiled with CMAKE_BUILD_TYPE=Release, uses innodb_empty_free_list_algorithm=legacy
- ps8033_rel_lto.cy10aps2_gcp_c2s30 - InnoDB and Percona Server 8.0.33, rel_lto build, cy10aps1_gcp_c2s30 config, compiled with CMAKE_BUILD_TYPE=Release, uses innodb_empty_free_list_algorithm=backoff
Contents
- Summary
- l.i0: load without secondary indexes
- l.x: create secondary indexes
- l.i1: continue load after secondary indexes created
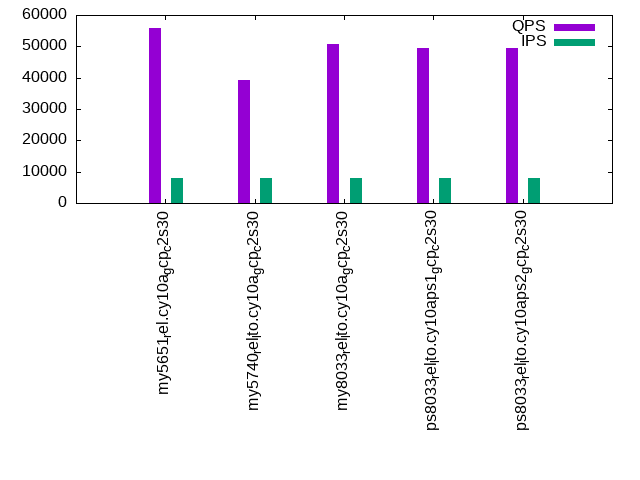
- q100.1: range queries with 100 insert/s per client
- q500.1: range queries with 500 insert/s per client
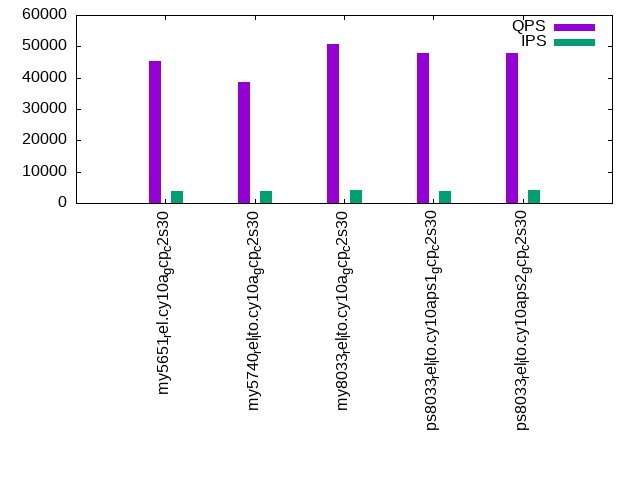
- q1000.1: range queries with 1000 insert/s per client
Summary
The numbers are inserts/s for l.i0 and l.i1, indexed docs (or rows) /s for l.x and queries/s for q*.2. The values are the average rate over the entire test for inserts (IPS) and queries (QPS). The range of values for IPS and QPS is split into 3 parts: bottom 25%, middle 50%, top 25%. Values in the bottom 25% have a red background, values in the top 25% have a green background and values in the middle have no color. A gray background is used for values that can be ignored because the DBMS did not sustain the target insert rate. Red backgrounds are not used when the minimum value is within 80% of the max value.
| dbms | l.i0 | l.x | l.i1 | q100.1 | q500.1 | q1000.1 |
|---|---|---|---|---|---|---|
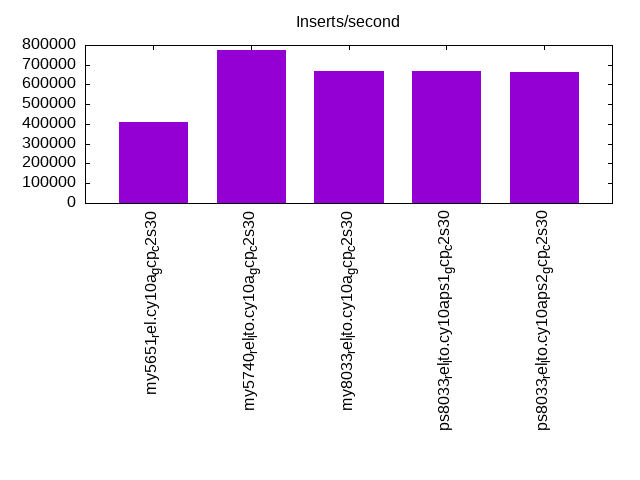
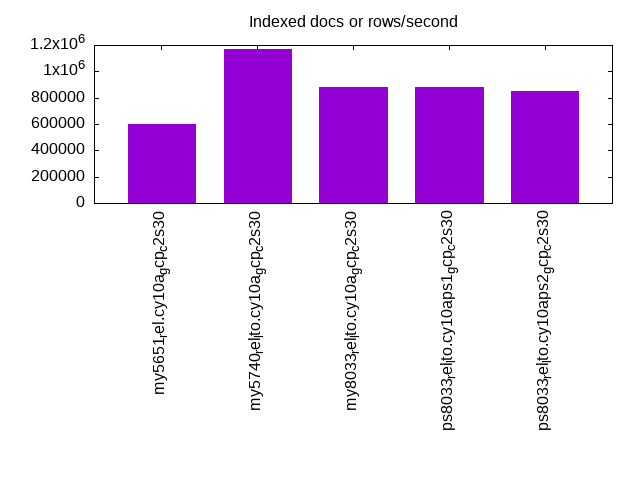
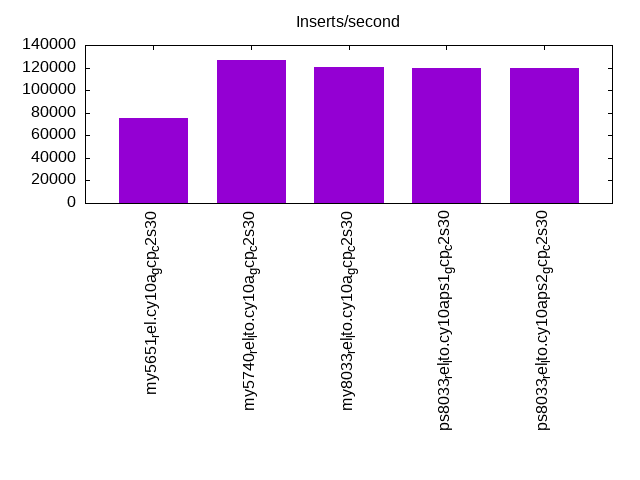
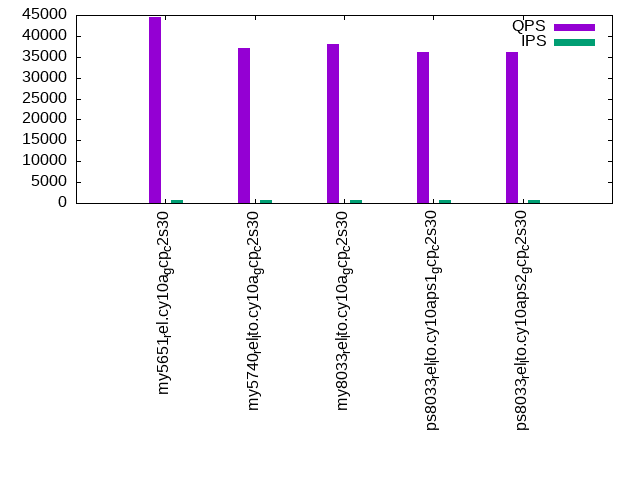
| my5651_rel.cy10a_gcp_c2s30 | 412371 | 597388 | 75404 | 44421 | 45192 | 55777 |
| my5740_rel_lto.cy10a_gcp_c2s30 | 776699 | 1168613 | 126753 | 37036 | 38692 | 39205 |
| my8033_rel_lto.cy10a_gcp_c2s30 | 666667 | 884530 | 120782 | 38074 | 50640 | 50829 |
| ps8033_rel_lto.cy10aps1_gcp_c2s30 | 666667 | 879670 | 119922 | 36192 | 47979 | 49519 |
| ps8033_rel_lto.cy10aps2_gcp_c2s30 | 663900 | 847090 | 119859 | 36096 | 47870 | 49480 |
This table has relative throughput, throughput for the DBMS relative to the DBMS in the first line, using the absolute throughput from the previous table. Values less than 0.95 have a yellow background. Values greater than 1.05 have a blue background.
| dbms | l.i0 | l.x | l.i1 | q100.1 | q500.1 | q1000.1 |
|---|---|---|---|---|---|---|
| my5651_rel.cy10a_gcp_c2s30 | 1.00 | 1.00 | 1.00 | 1.00 | 1.00 | 1.00 |
| my5740_rel_lto.cy10a_gcp_c2s30 | 1.88 | 1.96 | 1.68 | 0.83 | 0.86 | 0.70 |
| my8033_rel_lto.cy10a_gcp_c2s30 | 1.62 | 1.48 | 1.60 | 0.86 | 1.12 | 0.91 |
| ps8033_rel_lto.cy10aps1_gcp_c2s30 | 1.62 | 1.47 | 1.59 | 0.81 | 1.06 | 0.89 |
| ps8033_rel_lto.cy10aps2_gcp_c2s30 | 1.61 | 1.42 | 1.59 | 0.81 | 1.06 | 0.89 |
This lists the average rate of inserts/s for the tests that do inserts concurrent with queries. For such tests the query rate is listed in the table above. The read+write tests are setup so that the insert rate should match the target rate every second. Cells that are not at least 95% of the target have a red background to indicate a failure to satisfy the target.
| dbms | q100.1 | q500.1 | q1000.1 |
|---|---|---|---|
| my5651_rel.cy10a_gcp_c2s30 | 752 | 3800 | 7848 |
| my5740_rel_lto.cy10a_gcp_c2s30 | 782 | 3929 | 7850 |
| my8033_rel_lto.cy10a_gcp_c2s30 | 789 | 3991 | 7984 |
| ps8033_rel_lto.cy10aps1_gcp_c2s30 | 788 | 3989 | 7984 |
| ps8033_rel_lto.cy10aps2_gcp_c2s30 | 790 | 3990 | 7984 |
| target | 800 | 4000 | 8000 |
l.i0
l.i0: load without secondary indexes. Graphs for performance per 1-second interval are here.
Average throughput:
Insert response time histogram: each cell has the percentage of responses that take <= the time in the header and max is the max response time in seconds. For the max column values in the top 25% of the range have a red background and in the bottom 25% of the range have a green background. The red background is not used when the min value is within 80% of the max value.
| dbms | 256us | 1ms | 4ms | 16ms | 64ms | 256ms | 1s | 4s | 16s | gt | max |
|---|---|---|---|---|---|---|---|---|---|---|---|
| my5651_rel.cy10a_gcp_c2s30 | 2.199 | 97.506 | 0.114 | 0.168 | 0.014 | 0.195 | |||||
| my5740_rel_lto.cy10a_gcp_c2s30 | 94.406 | 5.529 | 0.031 | 0.019 | 0.015 | 0.244 | |||||
| my8033_rel_lto.cy10a_gcp_c2s30 | 8.364 | 91.556 | 0.040 | 0.026 | 0.014 | 0.232 | |||||
| ps8033_rel_lto.cy10aps1_gcp_c2s30 | 10.762 | 89.156 | 0.042 | 0.026 | 0.014 | 0.236 | |||||
| ps8033_rel_lto.cy10aps2_gcp_c2s30 | 8.208 | 91.710 | 0.041 | 0.027 | 0.014 | 0.231 |
Performance metrics for the DBMS listed above. Some are normalized by throughput, others are not. Legend for results is here.
ips	qps	rps	rmbps	wps	wmbps	rpq	rkbpq	wpi	wkbpi	csps	cpups	cspq	cpupq	dbgb1	dbgb2	rss	maxop	p50	p99	tag
412371	0	3251	12.7	550.4	73.6	0.008	0.032	0.001	0.183	84759	43.5	0.206	16	10.6	139.1	16.1	0.195	53043	42754	160m.my5651_rel.cy10a_gcp_c2s30
776699	0	0	0.0	1450.7	150.2	0.000	0.000	0.002	0.198	76832	70.3	0.099	14	10.6	139.1	17.2	0.244	107319	85407	160m.my5740_rel_lto.cy10a_gcp_c2s30
666667	0	0	0.0	1112.1	123.1	0.000	0.000	0.002	0.189	206689	72.8	0.310	16	10.6	139.1	17.2	0.232	90701	71720	160m.my8033_rel_lto.cy10a_gcp_c2s30
666667	0	0	0.0	895.9	120.3	0.000	0.000	0.001	0.185	215257	72.8	0.323	16	10.6	139.1	17.2	0.236	90634	73945	160m.ps8033_rel_lto.cy10aps1_gcp_c2s30
663900	0	0	0.0	891.4	120.8	0.000	0.000	0.001	0.186	205401	73.2	0.309	17	10.6	139.1	17.1	0.231	90301	71282	160m.ps8033_rel_lto.cy10aps2_gcp_c2s30
l.x
l.x: create secondary indexes.
Average throughput:
Performance metrics for the DBMS listed above. Some are normalized by throughput, others are not. Legend for results is here.
ips	qps	rps	rmbps	wps	wmbps	rpq	rkbpq	wpi	wkbpi	csps	cpups	cspq	cpupq	dbgb1	dbgb2	rss	maxop	p50	p99	tag
597388	0	318	1.2	7947.4	630.6	0.001	0.002	0.013	1.081	18514	39.1	0.031	10	21.7	150.2	25.9	0.001	NA	NA	160m.my5651_rel.cy10a_gcp_c2s30
1168613	0	0	0.0	13965.2	1060.7	0.000	0.000	0.012	0.929	47770	37.7	0.041	5	23.6	152.1	25.2	0.031	NA	NA	160m.my5740_rel_lto.cy10a_gcp_c2s30
884530	0	4451	282.9	18070.7	868.1	0.005	0.328	0.020	1.005	111178	81.1	0.126	14	23.5	152.1	26.7	0.011	NA	NA	160m.my8033_rel_lto.cy10a_gcp_c2s30
879670	0	4453	282.9	17863.6	862.7	0.005	0.329	0.020	1.004	105895	82.8	0.120	14	23.5	152.1	25.8	0.004	NA	NA	160m.ps8033_rel_lto.cy10aps1_gcp_c2s30
847090	0	4330	275.3	17306.8	837.4	0.005	0.333	0.020	1.012	109796	82.0	0.130	15	23.5	152.1	26.4	0.004	NA	NA	160m.ps8033_rel_lto.cy10aps2_gcp_c2s30
l.i1
l.i1: continue load after secondary indexes created. Graphs for performance per 1-second interval are here.
Average throughput:
Insert response time histogram: each cell has the percentage of responses that take <= the time in the header and max is the max response time in seconds. For the max column values in the top 25% of the range have a red background and in the bottom 25% of the range have a green background. The red background is not used when the min value is within 80% of the max value.
| dbms | 256us | 1ms | 4ms | 16ms | 64ms | 256ms | 1s | 4s | 16s | gt | max |
|---|---|---|---|---|---|---|---|---|---|---|---|
| my5651_rel.cy10a_gcp_c2s30 | 19.292 | 80.310 | 0.381 | 0.016 | nonzero | 0.262 | |||||
| my5740_rel_lto.cy10a_gcp_c2s30 | 84.918 | 15.016 | 0.051 | 0.016 | nonzero | 0.390 | |||||
| my8033_rel_lto.cy10a_gcp_c2s30 | 82.368 | 17.549 | 0.064 | 0.018 | 0.001 | nonzero | 1.015 | ||||
| ps8033_rel_lto.cy10aps1_gcp_c2s30 | 81.818 | 18.086 | 0.077 | 0.016 | 0.003 | 0.742 | |||||
| ps8033_rel_lto.cy10aps2_gcp_c2s30 | 81.635 | 18.276 | 0.071 | 0.018 | nonzero | 0.866 |
Delete response time histogram: each cell has the percentage of responses that take <= the time in the header and max is the max response time in seconds. For the max column values in the top 25% of the range have a red background and in the bottom 25% of the range have a green background. The red background is not used when the min value is within 80% of the max value.
| dbms | 256us | 1ms | 4ms | 16ms | 64ms | 256ms | 1s | 4s | 16s | gt | max |
|---|---|---|---|---|---|---|---|---|---|---|---|
| my5651_rel.cy10a_gcp_c2s30 | nonzero | 40.155 | 59.491 | 0.340 | 0.014 | nonzero | 0.258 | ||||
| my5740_rel_lto.cy10a_gcp_c2s30 | nonzero | 86.126 | 13.799 | 0.058 | 0.017 | nonzero | 0.405 | ||||
| my8033_rel_lto.cy10a_gcp_c2s30 | 84.289 | 15.630 | 0.066 | 0.014 | nonzero | nonzero | 1.019 | ||||
| ps8033_rel_lto.cy10aps1_gcp_c2s30 | 83.523 | 16.376 | 0.086 | 0.012 | 0.003 | 0.679 | |||||
| ps8033_rel_lto.cy10aps2_gcp_c2s30 | 83.397 | 16.515 | 0.073 | 0.015 | nonzero | 0.865 |
Performance metrics for the DBMS listed above. Some are normalized by throughput, others are not. Legend for results is here.
ips	qps	rps	rmbps	wps	wmbps	rpq	rkbpq	wpi	wkbpi	csps	cpups	cspq	cpupq	dbgb1	dbgb2	rss	maxop	p50	p99	tag
75404	0	3519	28.5	8030.7	275.3	0.047	0.387	0.107	3.738	167646	61.7	2.223	123	179.5	379.3	85.7	0.262	9490	7941	160m.my5651_rel.cy10a_gcp_c2s30
126753	0	2212	34.6	11359.1	397.8	0.017	0.279	0.090	3.213	67655	85.7	0.534	101	200.2	410.4	87.0	0.390	16089	11837	160m.my5740_rel_lto.cy10a_gcp_c2s30
120782	0	873	13.6	9359.0	324.0	0.007	0.116	0.077	2.747	169939	86.0	1.407	107	148.2	334.7	86.9	1.015	15283	11587	160m.my8033_rel_lto.cy10a_gcp_c2s30
119922	0	925	14.5	8504.1	299.7	0.008	0.123	0.071	2.559	166548	86.0	1.389	108	149.9	332.2	86.9	0.742	15183	11188	160m.ps8033_rel_lto.cy10aps1_gcp_c2s30
119859	0	914	14.3	8493.4	299.6	0.008	0.122	0.071	2.559	165056	86.1	1.377	108	149.9	333.3	86.9	0.866	15141	11587	160m.ps8033_rel_lto.cy10aps2_gcp_c2s30
q100.1
q100.1: range queries with 100 insert/s per client. Graphs for performance per 1-second interval are here.
Average throughput:
Query response time histogram: each cell has the percentage of responses that take <= the time in the header and max is the max response time in seconds. For max values in the top 25% of the range have a red background and in the bottom 25% of the range have a green background. The red background is not used when the min value is within 80% of the max value.
| dbms | 256us | 1ms | 4ms | 16ms | 64ms | 256ms | 1s | 4s | 16s | gt | max |
|---|---|---|---|---|---|---|---|---|---|---|---|
| my5651_rel.cy10a_gcp_c2s30 | 97.923 | 1.912 | 0.163 | 0.003 | nonzero | nonzero | 0.256 | ||||
| my5740_rel_lto.cy10a_gcp_c2s30 | 90.271 | 8.922 | 0.804 | 0.003 | nonzero | nonzero | 0.224 | ||||
| my8033_rel_lto.cy10a_gcp_c2s30 | 91.646 | 8.300 | 0.054 | nonzero | nonzero | nonzero | 0.247 | ||||
| ps8033_rel_lto.cy10aps1_gcp_c2s30 | 86.507 | 13.380 | 0.113 | nonzero | nonzero | nonzero | 0.233 | ||||
| ps8033_rel_lto.cy10aps2_gcp_c2s30 | 86.150 | 13.756 | 0.094 | nonzero | nonzero | nonzero | 0.227 |
Insert response time histogram: each cell has the percentage of responses that take <= the time in the header and max is the max response time in seconds. For max values in the top 25% of the range have a red background and in the bottom 25% of the range have a green background. The red background is not used when the min value is within 80% of the max value.
| dbms | 256us | 1ms | 4ms | 16ms | 64ms | 256ms | 1s | 4s | 16s | gt | max |
|---|---|---|---|---|---|---|---|---|---|---|---|
| my5651_rel.cy10a_gcp_c2s30 | 95.639 | 4.324 | 0.019 | 0.018 | 0.205 | ||||||
| my5740_rel_lto.cy10a_gcp_c2s30 | 81.827 | 18.161 | 0.012 | 0.028 | |||||||
| my8033_rel_lto.cy10a_gcp_c2s30 | 95.572 | 4.416 | 0.010 | 0.001 | 0.001 | 0.457 | |||||
| ps8033_rel_lto.cy10aps1_gcp_c2s30 | 96.829 | 3.159 | 0.012 | 0.043 | |||||||
| ps8033_rel_lto.cy10aps2_gcp_c2s30 | 95.234 | 4.749 | 0.016 | 0.050 |
Delete response time histogram: each cell has the percentage of responses that take <= the time in the header and max is the max response time in seconds. For max values in the top 25% of the range have a red background and in the bottom 25% of the range have a green background. The red background is not used when the min value is within 80% of the max value.
| dbms | 256us | 1ms | 4ms | 16ms | 64ms | 256ms | 1s | 4s | 16s | gt | max |
|---|---|---|---|---|---|---|---|---|---|---|---|
| my5651_rel.cy10a_gcp_c2s30 | 96.735 | 3.242 | 0.006 | 0.016 | 0.189 | ||||||
| my5740_rel_lto.cy10a_gcp_c2s30 | 99.451 | 0.549 | 0.001 | 0.017 | |||||||
| my8033_rel_lto.cy10a_gcp_c2s30 | 96.365 | 3.627 | 0.007 | 0.001 | 0.001 | 0.457 | |||||
| ps8033_rel_lto.cy10aps1_gcp_c2s30 | 97.356 | 2.635 | 0.009 | 0.043 | |||||||
| ps8033_rel_lto.cy10aps2_gcp_c2s30 | 96.053 | 3.936 | 0.011 | 0.050 |
Performance metrics for the DBMS listed above. Some are normalized by throughput, others are not. Legend for results is here.
ips	qps	rps	rmbps	wps	wmbps	rpq	rkbpq	wpi	wkbpi	csps	cpups	cspq	cpupq	dbgb1	dbgb2	rss	maxop	p50	p99	tag
752	44421	9859	153.7	14838.0	424.6	0.222	3.543	19.731	578.226	212156	58.3	4.776	197	179.5	379.3	85.8	0.256	5961	2829	160m.my5651_rel.cy10a_gcp_c2s30
782	37036	13178	205.9	14675.6	434.9	0.356	5.693	18.760	569.213	196533	59.0	5.306	239	200.2	410.4	87.0	0.224	4827	1295	160m.my5740_rel_lto.cy10a_gcp_c2s30
789	38074	2445	38.2	7082.7	198.2	0.064	1.028	8.981	257.334	154933	70.4	4.069	277	148.2	301.9	87.0	0.247	4923	3868	160m.my8033_rel_lto.cy10a_gcp_c2s30
788	36192	2986	46.7	7248.6	208.0	0.083	1.320	9.196	270.246	154294	69.3	4.263	287	149.9	292.6	87.0	0.233	4683	2382	160m.ps8033_rel_lto.cy10aps1_gcp_c2s30
790	36096	2963	46.3	7189.8	206.7	0.082	1.313	9.106	268.059	151312	69.9	4.192	290	149.9	295.2	87.0	0.227	4667	2574	160m.ps8033_rel_lto.cy10aps2_gcp_c2s30
q500.1
q500.1: range queries with 500 insert/s per client. Graphs for performance per 1-second interval are here.
Average throughput:
Query response time histogram: each cell has the percentage of responses that take <= the time in the header and max is the max response time in seconds. For max values in the top 25% of the range have a red background and in the bottom 25% of the range have a green background. The red background is not used when the min value is within 80% of the max value.
| dbms | 256us | 1ms | 4ms | 16ms | 64ms | 256ms | 1s | 4s | 16s | gt | max |
|---|---|---|---|---|---|---|---|---|---|---|---|
| my5651_rel.cy10a_gcp_c2s30 | 98.100 | 1.797 | 0.099 | 0.003 | nonzero | nonzero | nonzero | 0.257 | |||
| my5740_rel_lto.cy10a_gcp_c2s30 | 91.583 | 8.129 | 0.285 | 0.002 | nonzero | nonzero | 0.245 | ||||
| my8033_rel_lto.cy10a_gcp_c2s30 | 99.235 | 0.757 | 0.008 | 0.001 | nonzero | 0.022 | |||||
| ps8033_rel_lto.cy10aps1_gcp_c2s30 | 98.685 | 1.306 | 0.008 | 0.001 | nonzero | 0.056 | |||||
| ps8033_rel_lto.cy10aps2_gcp_c2s30 | 98.682 | 1.307 | 0.010 | 0.002 | nonzero | 0.026 |
Insert response time histogram: each cell has the percentage of responses that take <= the time in the header and max is the max response time in seconds. For max values in the top 25% of the range have a red background and in the bottom 25% of the range have a green background. The red background is not used when the min value is within 80% of the max value.
| dbms | 256us | 1ms | 4ms | 16ms | 64ms | 256ms | 1s | 4s | 16s | gt | max |
|---|---|---|---|---|---|---|---|---|---|---|---|
| my5651_rel.cy10a_gcp_c2s30 | 96.598 | 3.359 | 0.042 | 0.040 | |||||||
| my5740_rel_lto.cy10a_gcp_c2s30 | 99.288 | 0.686 | 0.026 | 0.035 | |||||||
| my8033_rel_lto.cy10a_gcp_c2s30 | 97.897 | 2.072 | 0.030 | 0.001 | 0.177 | ||||||
| ps8033_rel_lto.cy10aps1_gcp_c2s30 | 96.464 | 3.489 | 0.046 | nonzero | 0.076 | ||||||
| ps8033_rel_lto.cy10aps2_gcp_c2s30 | 93.661 | 6.181 | 0.158 | 0.036 |
Delete response time histogram: each cell has the percentage of responses that take <= the time in the header and max is the max response time in seconds. For max values in the top 25% of the range have a red background and in the bottom 25% of the range have a green background. The red background is not used when the min value is within 80% of the max value.
| dbms | 256us | 1ms | 4ms | 16ms | 64ms | 256ms | 1s | 4s | 16s | gt | max |
|---|---|---|---|---|---|---|---|---|---|---|---|
| my5651_rel.cy10a_gcp_c2s30 | 97.931 | 2.064 | 0.005 | 0.038 | |||||||
| my5740_rel_lto.cy10a_gcp_c2s30 | 99.632 | 0.363 | 0.005 | 0.026 | |||||||
| my8033_rel_lto.cy10a_gcp_c2s30 | 98.569 | 1.410 | 0.020 | 0.001 | 0.177 | ||||||
| ps8033_rel_lto.cy10aps1_gcp_c2s30 | 97.613 | 2.357 | 0.030 | nonzero | 0.082 | ||||||
| ps8033_rel_lto.cy10aps2_gcp_c2s30 | 95.090 | 4.792 | 0.118 | 0.034 |
Performance metrics for the DBMS listed above. Some are normalized by throughput, others are not. Legend for results is here.
ips	qps	rps	rmbps	wps	wmbps	rpq	rkbpq	wpi	wkbpi	csps	cpups	cspq	cpupq	dbgb1	dbgb2	rss	maxop	p50	p99	tag
3800	45192	7653	118.0	16171.8	483.7	0.169	2.674	4.255	130.335	206121	63.0	4.561	209	179.5	379.3	85.8	0.257	5900	5082	160m.my5651_rel.cy10a_gcp_c2s30
3929	38692	10756	168.1	13956.3	417.2	0.278	4.448	3.552	108.722	189641	63.9	4.901	248	200.2	410.4	87.0	0.245	4938	4093	160m.my5740_rel_lto.cy10a_gcp_c2s30
3991	50640	128	2.0	994.2	30.6	0.003	0.040	0.249	7.842	196716	58.6	3.885	174	148.2	277.3	87.0	0.022	6511	5101	160m.my8033_rel_lto.cy10a_gcp_c2s30
3989	47979	221	3.5	1033.9	32.8	0.005	0.074	0.259	8.407	184380	60.7	3.843	190	149.9	279.0	87.0	0.056	6313	4907	160m.ps8033_rel_lto.cy10aps1_gcp_c2s30
3990	47870	198	3.1	994.0	31.3	0.004	0.066	0.249	8.033	184501	60.0	3.854	188	149.9	279.0	87.0	0.026	6265	4891	160m.ps8033_rel_lto.cy10aps2_gcp_c2s30
q1000.1
q1000.1: range queries with 1000 insert/s per client. Graphs for performance per 1-second interval are here.
Average throughput:
Query response time histogram: each cell has the percentage of responses that take <= the time in the header and max is the max response time in seconds. For max values in the top 25% of the range have a red background and in the bottom 25% of the range have a green background. The red background is not used when the min value is within 80% of the max value.
| dbms | 256us | 1ms | 4ms | 16ms | 64ms | 256ms | 1s | 4s | 16s | gt | max |
|---|---|---|---|---|---|---|---|---|---|---|---|
| my5651_rel.cy10a_gcp_c2s30 | 99.150 | 0.752 | 0.084 | 0.013 | 0.001 | nonzero | 0.191 | ||||
| my5740_rel_lto.cy10a_gcp_c2s30 | 93.047 | 6.810 | 0.141 | 0.002 | 0.001 | nonzero | nonzero | 0.311 | |||
| my8033_rel_lto.cy10a_gcp_c2s30 | 99.378 | 0.592 | 0.026 | 0.004 | nonzero | 0.031 | |||||
| ps8033_rel_lto.cy10aps1_gcp_c2s30 | 99.184 | 0.783 | 0.029 | 0.004 | nonzero | 0.044 | |||||
| ps8033_rel_lto.cy10aps2_gcp_c2s30 | 99.188 | 0.778 | 0.030 | 0.004 | nonzero | 0.030 |
Insert response time histogram: each cell has the percentage of responses that take <= the time in the header and max is the max response time in seconds. For max values in the top 25% of the range have a red background and in the bottom 25% of the range have a green background. The red background is not used when the min value is within 80% of the max value.
| dbms | 256us | 1ms | 4ms | 16ms | 64ms | 256ms | 1s | 4s | 16s | gt | max |
|---|---|---|---|---|---|---|---|---|---|---|---|
| my5651_rel.cy10a_gcp_c2s30 | nonzero | 91.700 | 8.240 | 0.060 | 0.048 | ||||||
| my5740_rel_lto.cy10a_gcp_c2s30 | 99.251 | 0.714 | 0.035 | 0.052 | |||||||
| my8033_rel_lto.cy10a_gcp_c2s30 | 87.421 | 12.093 | 0.485 | 0.038 | |||||||
| ps8033_rel_lto.cy10aps1_gcp_c2s30 | 85.841 | 13.525 | 0.634 | 0.047 | |||||||
| ps8033_rel_lto.cy10aps2_gcp_c2s30 | 85.130 | 14.299 | 0.572 | 0.046 |
Delete response time histogram: each cell has the percentage of responses that take <= the time in the header and max is the max response time in seconds. For max values in the top 25% of the range have a red background and in the bottom 25% of the range have a green background. The red background is not used when the min value is within 80% of the max value.
| dbms | 256us | 1ms | 4ms | 16ms | 64ms | 256ms | 1s | 4s | 16s | gt | max |
|---|---|---|---|---|---|---|---|---|---|---|---|
| my5651_rel.cy10a_gcp_c2s30 | 0.083 | 94.648 | 5.251 | 0.018 | 0.032 | ||||||
| my5740_rel_lto.cy10a_gcp_c2s30 | 99.587 | 0.408 | 0.006 | 0.035 | |||||||
| my8033_rel_lto.cy10a_gcp_c2s30 | 89.934 | 9.702 | 0.364 | 0.048 | |||||||
| ps8033_rel_lto.cy10aps1_gcp_c2s30 | 88.365 | 11.143 | 0.492 | 0.050 | |||||||
| ps8033_rel_lto.cy10aps2_gcp_c2s30 | 87.847 | 11.726 | 0.427 | 0.039 |
Performance metrics for the DBMS listed above. Some are normalized by throughput, others are not. Legend for results is here.
ips	qps	rps	rmbps	wps	wmbps	rpq	rkbpq	wpi	wkbpi	csps	cpups	cspq	cpupq	dbgb1	dbgb2	rss	maxop	p50	p99	tag
7848	55777	1407	18.9	4665.1	145.4	0.025	0.348	0.594	18.965	199465	68.5	3.576	184	179.5	379.3	85.8	0.191	6952	5850	160m.my5651_rel.cy10a_gcp_c2s30
7850	39205	8521	133.1	13328.0	398.4	0.217	3.478	1.698	51.976	179415	67.8	4.576	259	200.2	410.4	86.9	0.311	5034	4123	160m.my5740_rel_lto.cy10a_gcp_c2s30
7984	50829	40	0.6	780.2	25.0	0.001	0.013	0.098	3.200	194464	59.0	3.826	174	148.2	277.3	87.0	0.031	6363	6258	160m.my8033_rel_lto.cy10a_gcp_c2s30
7984	49519	40	0.6	487.7	16.9	0.001	0.013	0.061	2.164	188827	59.0	3.813	179	149.9	279.0	87.0	0.044	6201	6105	160m.ps8033_rel_lto.cy10aps1_gcp_c2s30
7984	49480	40	0.6	486.5	16.9	0.001	0.013	0.061	2.163	188710	58.8	3.814	178	149.9	279.0	87.0	0.030	6191	6087	160m.ps8033_rel_lto.cy10aps2_gcp_c2s30
l.i0
l.i0: load without secondary indexes
Performance metrics for all DBMS, not just the ones listed above. Some are normalized by throughput, others are not. Legend for results is here.
ips	qps	rps	rmbps	wps	wmbps	rpq	rkbpq	wpi	wkbpi	csps	cpups	cspq	cpupq	dbgb1	dbgb2	rss	maxop	p50	p99	tag
412371	0	3251	12.7	550.4	73.6	0.008	0.032	0.001	0.183	84759	43.5	0.206	16	10.6	139.1	16.1	0.195	53043	42754	160m.my5651_rel.cy10a_gcp_c2s30
776699	0	0	0.0	1450.7	150.2	0.000	0.000	0.002	0.198	76832	70.3	0.099	14	10.6	139.1	17.2	0.244	107319	85407	160m.my5740_rel_lto.cy10a_gcp_c2s30
666667	0	0	0.0	1112.1	123.1	0.000	0.000	0.002	0.189	206689	72.8	0.310	16	10.6	139.1	17.2	0.232	90701	71720	160m.my8033_rel_lto.cy10a_gcp_c2s30
666667	0	0	0.0	895.9	120.3	0.000	0.000	0.001	0.185	215257	72.8	0.323	16	10.6	139.1	17.2	0.236	90634	73945	160m.ps8033_rel_lto.cy10aps1_gcp_c2s30
663900	0	0	0.0	891.4	120.8	0.000	0.000	0.001	0.186	205401	73.2	0.309	17	10.6	139.1	17.1	0.231	90301	71282	160m.ps8033_rel_lto.cy10aps2_gcp_c2s30
l.x
l.x: create secondary indexes
Performance metrics for all DBMS, not just the ones listed above. Some are normalized by throughput, others are not. Legend for results is here.
ips	qps	rps	rmbps	wps	wmbps	rpq	rkbpq	wpi	wkbpi	csps	cpups	cspq	cpupq	dbgb1	dbgb2	rss	maxop	p50	p99	tag
597388	0	318	1.2	7947.4	630.6	0.001	0.002	0.013	1.081	18514	39.1	0.031	10	21.7	150.2	25.9	0.001	NA	NA	160m.my5651_rel.cy10a_gcp_c2s30
1168613	0	0	0.0	13965.2	1060.7	0.000	0.000	0.012	0.929	47770	37.7	0.041	5	23.6	152.1	25.2	0.031	NA	NA	160m.my5740_rel_lto.cy10a_gcp_c2s30
884530	0	4451	282.9	18070.7	868.1	0.005	0.328	0.020	1.005	111178	81.1	0.126	14	23.5	152.1	26.7	0.011	NA	NA	160m.my8033_rel_lto.cy10a_gcp_c2s30
879670	0	4453	282.9	17863.6	862.7	0.005	0.329	0.020	1.004	105895	82.8	0.120	14	23.5	152.1	25.8	0.004	NA	NA	160m.ps8033_rel_lto.cy10aps1_gcp_c2s30
847090	0	4330	275.3	17306.8	837.4	0.005	0.333	0.020	1.012	109796	82.0	0.130	15	23.5	152.1	26.4	0.004	NA	NA	160m.ps8033_rel_lto.cy10aps2_gcp_c2s30
l.i1
l.i1: continue load after secondary indexes created
Performance metrics for all DBMS, not just the ones listed above. Some are normalized by throughput, others are not. Legend for results is here.
ips	qps	rps	rmbps	wps	wmbps	rpq	rkbpq	wpi	wkbpi	csps	cpups	cspq	cpupq	dbgb1	dbgb2	rss	maxop	p50	p99	tag
75404	0	3519	28.5	8030.7	275.3	0.047	0.387	0.107	3.738	167646	61.7	2.223	123	179.5	379.3	85.7	0.262	9490	7941	160m.my5651_rel.cy10a_gcp_c2s30
126753	0	2212	34.6	11359.1	397.8	0.017	0.279	0.090	3.213	67655	85.7	0.534	101	200.2	410.4	87.0	0.390	16089	11837	160m.my5740_rel_lto.cy10a_gcp_c2s30
120782	0	873	13.6	9359.0	324.0	0.007	0.116	0.077	2.747	169939	86.0	1.407	107	148.2	334.7	86.9	1.015	15283	11587	160m.my8033_rel_lto.cy10a_gcp_c2s30
119922	0	925	14.5	8504.1	299.7	0.008	0.123	0.071	2.559	166548	86.0	1.389	108	149.9	332.2	86.9	0.742	15183	11188	160m.ps8033_rel_lto.cy10aps1_gcp_c2s30
119859	0	914	14.3	8493.4	299.6	0.008	0.122	0.071	2.559	165056	86.1	1.377	108	149.9	333.3	86.9	0.866	15141	11587	160m.ps8033_rel_lto.cy10aps2_gcp_c2s30
q100.1
q100.1: range queries with 100 insert/s per client
Performance metrics for all DBMS, not just the ones listed above. Some are normalized by throughput, others are not. Legend for results is here.
ips	qps	rps	rmbps	wps	wmbps	rpq	rkbpq	wpi	wkbpi	csps	cpups	cspq	cpupq	dbgb1	dbgb2	rss	maxop	p50	p99	tag
752	44421	9859	153.7	14838.0	424.6	0.222	3.543	19.731	578.226	212156	58.3	4.776	197	179.5	379.3	85.8	0.256	5961	2829	160m.my5651_rel.cy10a_gcp_c2s30
782	37036	13178	205.9	14675.6	434.9	0.356	5.693	18.760	569.213	196533	59.0	5.306	239	200.2	410.4	87.0	0.224	4827	1295	160m.my5740_rel_lto.cy10a_gcp_c2s30
789	38074	2445	38.2	7082.7	198.2	0.064	1.028	8.981	257.334	154933	70.4	4.069	277	148.2	301.9	87.0	0.247	4923	3868	160m.my8033_rel_lto.cy10a_gcp_c2s30
788	36192	2986	46.7	7248.6	208.0	0.083	1.320	9.196	270.246	154294	69.3	4.263	287	149.9	292.6	87.0	0.233	4683	2382	160m.ps8033_rel_lto.cy10aps1_gcp_c2s30
790	36096	2963	46.3	7189.8	206.7	0.082	1.313	9.106	268.059	151312	69.9	4.192	290	149.9	295.2	87.0	0.227	4667	2574	160m.ps8033_rel_lto.cy10aps2_gcp_c2s30
q500.1
q500.1: range queries with 500 insert/s per client
Performance metrics for all DBMS, not just the ones listed above. Some are normalized by throughput, others are not. Legend for results is here.
ips	qps	rps	rmbps	wps	wmbps	rpq	rkbpq	wpi	wkbpi	csps	cpups	cspq	cpupq	dbgb1	dbgb2	rss	maxop	p50	p99	tag
3800	45192	7653	118.0	16171.8	483.7	0.169	2.674	4.255	130.335	206121	63.0	4.561	209	179.5	379.3	85.8	0.257	5900	5082	160m.my5651_rel.cy10a_gcp_c2s30
3929	38692	10756	168.1	13956.3	417.2	0.278	4.448	3.552	108.722	189641	63.9	4.901	248	200.2	410.4	87.0	0.245	4938	4093	160m.my5740_rel_lto.cy10a_gcp_c2s30
3991	50640	128	2.0	994.2	30.6	0.003	0.040	0.249	7.842	196716	58.6	3.885	174	148.2	277.3	87.0	0.022	6511	5101	160m.my8033_rel_lto.cy10a_gcp_c2s30
3989	47979	221	3.5	1033.9	32.8	0.005	0.074	0.259	8.407	184380	60.7	3.843	190	149.9	279.0	87.0	0.056	6313	4907	160m.ps8033_rel_lto.cy10aps1_gcp_c2s30
3990	47870	198	3.1	994.0	31.3	0.004	0.066	0.249	8.033	184501	60.0	3.854	188	149.9	279.0	87.0	0.026	6265	4891	160m.ps8033_rel_lto.cy10aps2_gcp_c2s30
q1000.1
q1000.1: range queries with 1000 insert/s per client
Performance metrics for all DBMS, not just the ones listed above. Some are normalized by throughput, others are not. Legend for results is here.
ips	qps	rps	rmbps	wps	wmbps	rpq	rkbpq	wpi	wkbpi	csps	cpups	cspq	cpupq	dbgb1	dbgb2	rss	maxop	p50	p99	tag
7848	55777	1407	18.9	4665.1	145.4	0.025	0.348	0.594	18.965	199465	68.5	3.576	184	179.5	379.3	85.8	0.191	6952	5850	160m.my5651_rel.cy10a_gcp_c2s30
7850	39205	8521	133.1	13328.0	398.4	0.217	3.478	1.698	51.976	179415	67.8	4.576	259	200.2	410.4	86.9	0.311	5034	4123	160m.my5740_rel_lto.cy10a_gcp_c2s30
7984	50829	40	0.6	780.2	25.0	0.001	0.013	0.098	3.200	194464	59.0	3.826	174	148.2	277.3	87.0	0.031	6363	6258	160m.my8033_rel_lto.cy10a_gcp_c2s30
7984	49519	40	0.6	487.7	16.9	0.001	0.013	0.061	2.164	188827	59.0	3.813	179	149.9	279.0	87.0	0.044	6201	6105	160m.ps8033_rel_lto.cy10aps1_gcp_c2s30
7984	49480	40	0.6	486.5	16.9	0.001	0.013	0.061	2.163	188710	58.8	3.814	178	149.9	279.0	87.0	0.030	6191	6087	160m.ps8033_rel_lto.cy10aps2_gcp_c2s30
l.i0
- l.i0: load without secondary indexes
- Legend for results is here.
- Each entry lists the percentage of responses that fit in that bucket (slower than max time for previous bucket, faster than min time for next bucket).
Insert response time histogram
256us	1ms	4ms	16ms	64ms	256ms	1s	4s	16s	gt	max	tag
0.000	2.199	97.506	0.114	0.168	0.014	0.000	0.000	0.000	0.000	0.195	my5651_rel.cy10a_gcp_c2s30
0.000	94.406	5.529	0.031	0.019	0.015	0.000	0.000	0.000	0.000	0.244	my5740_rel_lto.cy10a_gcp_c2s30
0.000	8.364	91.556	0.040	0.026	0.014	0.000	0.000	0.000	0.000	0.232	my8033_rel_lto.cy10a_gcp_c2s30
0.000	10.762	89.156	0.042	0.026	0.014	0.000	0.000	0.000	0.000	0.236	ps8033_rel_lto.cy10aps1_gcp_c2s30
0.000	8.208	91.710	0.041	0.027	0.014	0.000	0.000	0.000	0.000	0.231	ps8033_rel_lto.cy10aps2_gcp_c2s30
l.x
- l.x: create secondary indexes
- Legend for results is here.
- Each entry lists the percentage of responses that fit in that bucket (slower than max time for previous bucket, faster than min time for next bucket).
TODO - determine whether there is data for create index response time
l.i1
- l.i1: continue load after secondary indexes created
- Legend for results is here.
- Each entry lists the percentage of responses that fit in that bucket (slower than max time for previous bucket, faster than min time for next bucket).
Insert response time histogram
256us	1ms	4ms	16ms	64ms	256ms	1s	4s	16s	gt	max	tag
0.000	0.000	19.292	80.310	0.381	0.016	nonzero	0.000	0.000	0.000	0.262	my5651_rel.cy10a_gcp_c2s30
0.000	0.000	84.918	15.016	0.051	0.016	nonzero	0.000	0.000	0.000	0.390	my5740_rel_lto.cy10a_gcp_c2s30
0.000	0.000	82.368	17.549	0.064	0.018	0.001	nonzero	0.000	0.000	1.015	my8033_rel_lto.cy10a_gcp_c2s30
0.000	0.000	81.818	18.086	0.077	0.016	0.003	0.000	0.000	0.000	0.742	ps8033_rel_lto.cy10aps1_gcp_c2s30
0.000	0.000	81.635	18.276	0.071	0.018	nonzero	0.000	0.000	0.000	0.866	ps8033_rel_lto.cy10aps2_gcp_c2s30
Delete response time histogram
256us	1ms	4ms	16ms	64ms	256ms	1s	4s	16s	gt	max	tag
0.000	nonzero	40.155	59.491	0.340	0.014	nonzero	0.000	0.000	0.000	0.258	my5651_rel.cy10a_gcp_c2s30
0.000	nonzero	86.126	13.799	0.058	0.017	nonzero	0.000	0.000	0.000	0.405	my5740_rel_lto.cy10a_gcp_c2s30
0.000	0.000	84.289	15.630	0.066	0.014	nonzero	nonzero	0.000	0.000	1.019	my8033_rel_lto.cy10a_gcp_c2s30
0.000	0.000	83.523	16.376	0.086	0.012	0.003	0.000	0.000	0.000	0.679	ps8033_rel_lto.cy10aps1_gcp_c2s30
0.000	0.000	83.397	16.515	0.073	0.015	nonzero	0.000	0.000	0.000	0.865	ps8033_rel_lto.cy10aps2_gcp_c2s30
q100.1
- q100.1: range queries with 100 insert/s per client
- Legend for results is here.
- Each entry lists the percentage of responses that fit in that bucket (slower than max time for previous bucket, faster than min time for next bucket).
Query response time histogram
256us	1ms	4ms	16ms	64ms	256ms	1s	4s	16s	gt	max	tag
97.923	1.912	0.163	0.003	nonzero	nonzero	0.000	0.000	0.000	0.000	0.256	my5651_rel.cy10a_gcp_c2s30
90.271	8.922	0.804	0.003	nonzero	nonzero	0.000	0.000	0.000	0.000	0.224	my5740_rel_lto.cy10a_gcp_c2s30
91.646	8.300	0.054	nonzero	nonzero	nonzero	0.000	0.000	0.000	0.000	0.247	my8033_rel_lto.cy10a_gcp_c2s30
86.507	13.380	0.113	nonzero	nonzero	nonzero	0.000	0.000	0.000	0.000	0.233	ps8033_rel_lto.cy10aps1_gcp_c2s30
86.150	13.756	0.094	nonzero	nonzero	nonzero	0.000	0.000	0.000	0.000	0.227	ps8033_rel_lto.cy10aps2_gcp_c2s30
Insert response time histogram
256us	1ms	4ms	16ms	64ms	256ms	1s	4s	16s	gt	max	tag
0.000	0.000	95.639	4.324	0.019	0.018	0.000	0.000	0.000	0.000	0.205	my5651_rel.cy10a_gcp_c2s30
0.000	0.000	81.827	18.161	0.012	0.000	0.000	0.000	0.000	0.000	0.028	my5740_rel_lto.cy10a_gcp_c2s30
0.000	0.000	95.572	4.416	0.010	0.001	0.001	0.000	0.000	0.000	0.457	my8033_rel_lto.cy10a_gcp_c2s30
0.000	0.000	96.829	3.159	0.012	0.000	0.000	0.000	0.000	0.000	0.043	ps8033_rel_lto.cy10aps1_gcp_c2s30
0.000	0.000	95.234	4.749	0.016	0.000	0.000	0.000	0.000	0.000	0.050	ps8033_rel_lto.cy10aps2_gcp_c2s30
Delete response time histogram
256us	1ms	4ms	16ms	64ms	256ms	1s	4s	16s	gt	max	tag
0.000	0.000	96.735	3.242	0.006	0.016	0.000	0.000	0.000	0.000	0.189	my5651_rel.cy10a_gcp_c2s30
0.000	0.000	99.451	0.549	0.001	0.000	0.000	0.000	0.000	0.000	0.017	my5740_rel_lto.cy10a_gcp_c2s30
0.000	0.000	96.365	3.627	0.007	0.001	0.001	0.000	0.000	0.000	0.457	my8033_rel_lto.cy10a_gcp_c2s30
0.000	0.000	97.356	2.635	0.009	0.000	0.000	0.000	0.000	0.000	0.043	ps8033_rel_lto.cy10aps1_gcp_c2s30
0.000	0.000	96.053	3.936	0.011	0.000	0.000	0.000	0.000	0.000	0.050	ps8033_rel_lto.cy10aps2_gcp_c2s30
q500.1
- q500.1: range queries with 500 insert/s per client
- Legend for results is here.
- Each entry lists the percentage of responses that fit in that bucket (slower than max time for previous bucket, faster than min time for next bucket).
Query response time histogram
256us	1ms	4ms	16ms	64ms	256ms	1s	4s	16s	gt	max	tag
98.100	1.797	0.099	0.003	nonzero	nonzero	nonzero	0.000	0.000	0.000	0.257	my5651_rel.cy10a_gcp_c2s30
91.583	8.129	0.285	0.002	nonzero	nonzero	0.000	0.000	0.000	0.000	0.245	my5740_rel_lto.cy10a_gcp_c2s30
99.235	0.757	0.008	0.001	nonzero	0.000	0.000	0.000	0.000	0.000	0.022	my8033_rel_lto.cy10a_gcp_c2s30
98.685	1.306	0.008	0.001	nonzero	0.000	0.000	0.000	0.000	0.000	0.056	ps8033_rel_lto.cy10aps1_gcp_c2s30
98.682	1.307	0.010	0.002	nonzero	0.000	0.000	0.000	0.000	0.000	0.026	ps8033_rel_lto.cy10aps2_gcp_c2s30
Insert response time histogram
256us	1ms	4ms	16ms	64ms	256ms	1s	4s	16s	gt	max	tag
0.000	0.000	96.598	3.359	0.042	0.000	0.000	0.000	0.000	0.000	0.040	my5651_rel.cy10a_gcp_c2s30
0.000	0.000	99.288	0.686	0.026	0.000	0.000	0.000	0.000	0.000	0.035	my5740_rel_lto.cy10a_gcp_c2s30
0.000	0.000	97.897	2.072	0.030	0.001	0.000	0.000	0.000	0.000	0.177	my8033_rel_lto.cy10a_gcp_c2s30
0.000	0.000	96.464	3.489	0.046	nonzero	0.000	0.000	0.000	0.000	0.076	ps8033_rel_lto.cy10aps1_gcp_c2s30
0.000	0.000	93.661	6.181	0.158	0.000	0.000	0.000	0.000	0.000	0.036	ps8033_rel_lto.cy10aps2_gcp_c2s30
Delete response time histogram
256us	1ms	4ms	16ms	64ms	256ms	1s	4s	16s	gt	max	tag
0.000	0.000	97.931	2.064	0.005	0.000	0.000	0.000	0.000	0.000	0.038	my5651_rel.cy10a_gcp_c2s30
0.000	0.000	99.632	0.363	0.005	0.000	0.000	0.000	0.000	0.000	0.026	my5740_rel_lto.cy10a_gcp_c2s30
0.000	0.000	98.569	1.410	0.020	0.001	0.000	0.000	0.000	0.000	0.177	my8033_rel_lto.cy10a_gcp_c2s30
0.000	0.000	97.613	2.357	0.030	nonzero	0.000	0.000	0.000	0.000	0.082	ps8033_rel_lto.cy10aps1_gcp_c2s30
0.000	0.000	95.090	4.792	0.118	0.000	0.000	0.000	0.000	0.000	0.034	ps8033_rel_lto.cy10aps2_gcp_c2s30
q1000.1
- q1000.1: range queries with 1000 insert/s per client
- Legend for results is here.
- Each entry lists the percentage of responses that fit in that bucket (slower than max time for previous bucket, faster than min time for next bucket).
Query response time histogram
256us	1ms	4ms	16ms	64ms	256ms	1s	4s	16s	gt	max	tag
99.150	0.752	0.084	0.013	0.001	nonzero	0.000	0.000	0.000	0.000	0.191	my5651_rel.cy10a_gcp_c2s30
93.047	6.810	0.141	0.002	0.001	nonzero	nonzero	0.000	0.000	0.000	0.311	my5740_rel_lto.cy10a_gcp_c2s30
99.378	0.592	0.026	0.004	nonzero	0.000	0.000	0.000	0.000	0.000	0.031	my8033_rel_lto.cy10a_gcp_c2s30
99.184	0.783	0.029	0.004	nonzero	0.000	0.000	0.000	0.000	0.000	0.044	ps8033_rel_lto.cy10aps1_gcp_c2s30
99.188	0.778	0.030	0.004	nonzero	0.000	0.000	0.000	0.000	0.000	0.030	ps8033_rel_lto.cy10aps2_gcp_c2s30
Insert response time histogram
256us	1ms	4ms	16ms	64ms	256ms	1s	4s	16s	gt	max	tag
0.000	nonzero	91.700	8.240	0.060	0.000	0.000	0.000	0.000	0.000	0.048	my5651_rel.cy10a_gcp_c2s30
0.000	0.000	99.251	0.714	0.035	0.000	0.000	0.000	0.000	0.000	0.052	my5740_rel_lto.cy10a_gcp_c2s30
0.000	0.000	87.421	12.093	0.485	0.000	0.000	0.000	0.000	0.000	0.038	my8033_rel_lto.cy10a_gcp_c2s30
0.000	0.000	85.841	13.525	0.634	0.000	0.000	0.000	0.000	0.000	0.047	ps8033_rel_lto.cy10aps1_gcp_c2s30
0.000	0.000	85.130	14.299	0.572	0.000	0.000	0.000	0.000	0.000	0.046	ps8033_rel_lto.cy10aps2_gcp_c2s30
Delete response time histogram
256us	1ms	4ms	16ms	64ms	256ms	1s	4s	16s	gt	max	tag
0.000	0.083	94.648	5.251	0.018	0.000	0.000	0.000	0.000	0.000	0.032	my5651_rel.cy10a_gcp_c2s30
0.000	0.000	99.587	0.408	0.006	0.000	0.000	0.000	0.000	0.000	0.035	my5740_rel_lto.cy10a_gcp_c2s30
0.000	0.000	89.934	9.702	0.364	0.000	0.000	0.000	0.000	0.000	0.048	my8033_rel_lto.cy10a_gcp_c2s30
0.000	0.000	88.365	11.143	0.492	0.000	0.000	0.000	0.000	0.000	0.050	ps8033_rel_lto.cy10aps1_gcp_c2s30
0.000	0.000	87.847	11.726	0.427	0.000	0.000	0.000	0.000	0.000	0.039	ps8033_rel_lto.cy10aps2_gcp_c2s30