Introduction
This is a report for the insert benchmark with 800M docs and 1 client(s). It is generated by scripts (bash, awk, sed) and Tufte might not be impressed. An overview of the insert benchmark is here and a short update is here. Below, by DBMS, I mean DBMS+version.config. An example is my8020.c10b40 where my means MySQL, 8020 is version 8.0.20 and c10b40 is the name for the configuration file.
The test server has 8 AMD cores, 16G RAM and an NVMe SSD. It is described here as the Beelink. The benchmark was run with 1 client and there were 1 or 3 connections per client (1 for queries or inserts without rate limits, 1+1 for rate limited inserts+deletes). There is 1 table. It loads 800M rows without secondary indexes, creates secondary indexes, then inserts 10M rows with a delete per insert to avoid growing the table. It then does 3 read+write tests for 3600s each that do queries as fast as possible with 100, 500 and then 1000 inserts/second/client concurrent with the queries and 1000 deletes/second to avoid growing the table. The database is larger than memory.
The tested DBMS are:
- my5651_rel.cy10a_bee - InnoDB and MySQL 5.6.51, rel build, cy10a_bee config, compiled with CMAKE_BUILD_TYPE=Release, base config
my5651_rel.cy10a2_bee - InnoDB and MySQL 5.6.51, rel build, cy10a2_bee config, compiled with CMAKE_BUILD_TYPE=Release, adds innodb_io_capacity=20k, innodb_io_capacity_max=40k - my5651_rel.cy10a4_bee - InnoDB and MySQL 5.6.51, rel build, cy10a4_bee config, compiled with CMAKE_BUILD_TYPE=Release, adds innodb_flush_method=fsync
Contents
- Summary
- l.i0: load without secondary indexes
- l.x: create secondary indexes
- l.i1: continue load after secondary indexes created
- q100.1: range queries with 100 insert/s per client
- q500.1: range queries with 500 insert/s per client
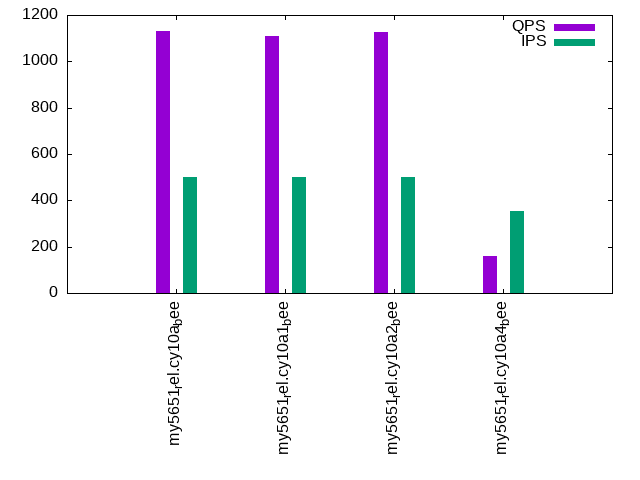
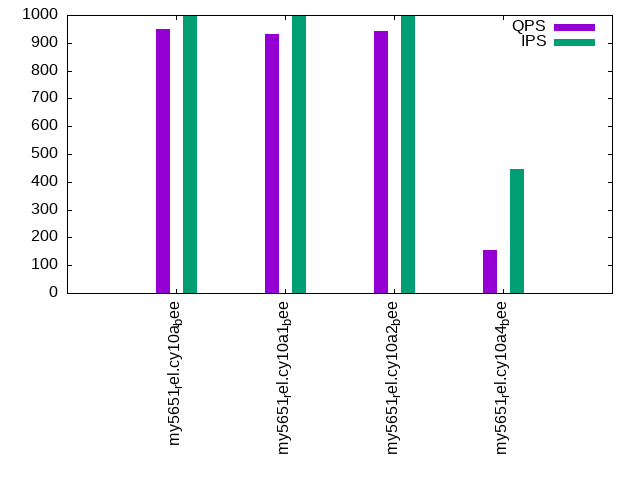
- q1000.1: range queries with 1000 insert/s per client
Summary
The numbers are inserts/s for l.i0 and l.i1, indexed docs (or rows) /s for l.x and queries/s for q100, q500, q1000. The values are the average rate over the entire test for inserts (IPS) and queries (QPS). The range of values for IPS and QPS is split into 3 parts: bottom 25%, middle 50%, top 25%. Values in the bottom 25% have a red background, values in the top 25% have a green background and values in the middle have no color. A gray background is used for values that can be ignored because the DBMS did not sustain the target insert rate. Red backgrounds are not used when the minimum value is within 80% of the max value.
| dbms | l.i0 | l.x | l.i1 | q100.1 | q500.1 | q1000.1 |
|---|---|---|---|---|---|---|
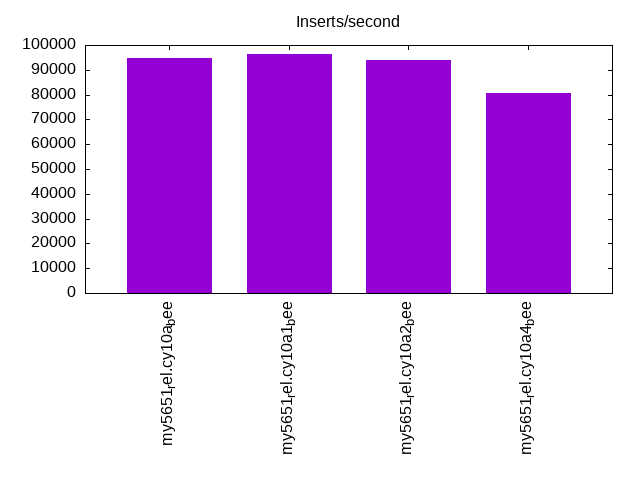
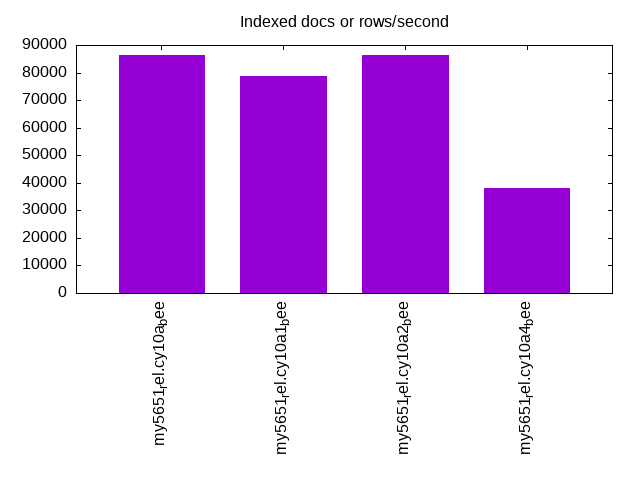
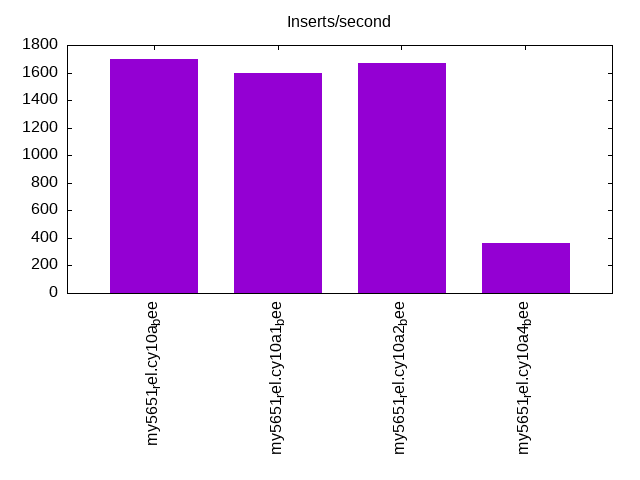
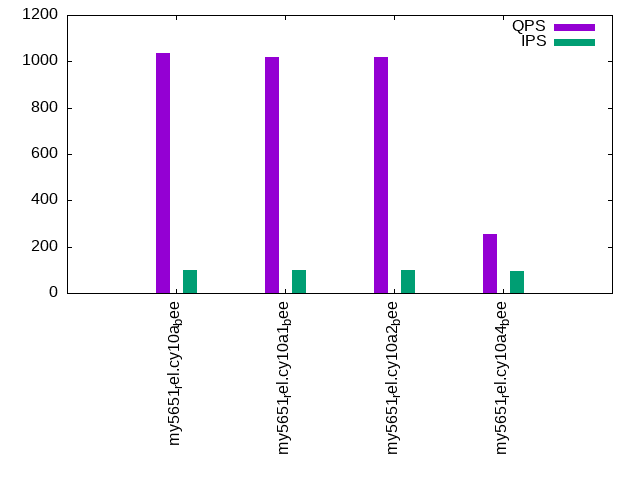
| my5651_rel.cy10a_bee | 94798 | 86507 | 1700 | 1035 | 1131 | 948 |
| my5651_rel.cy10a1_bee | 96513 | 78804 | 1597 | 1017 | 1110 | 932 |
| my5651_rel.cy10a2_bee | 93864 | 86413 | 1670 | 1018 | 1127 | 941 |
| my5651_rel.cy10a4_bee | 80678 | 37988 | 363 | 254 | 161 | 154 |
This table has relative throughput, throughput for the DBMS relative to the DBMS in the first line, using the absolute throughput from the previous table. Values less than 0.95 have a yellow background. Values greater than 1.05 have a blue background.
| dbms | l.i0 | l.x | l.i1 | q100.1 | q500.1 | q1000.1 |
|---|---|---|---|---|---|---|
| my5651_rel.cy10a_bee | 1.00 | 1.00 | 1.00 | 1.00 | 1.00 | 1.00 |
| my5651_rel.cy10a1_bee | 1.02 | 0.91 | 0.94 | 0.98 | 0.98 | 0.98 |
| my5651_rel.cy10a2_bee | 0.99 | 1.00 | 0.98 | 0.98 | 1.00 | 0.99 |
| my5651_rel.cy10a4_bee | 0.85 | 0.44 | 0.21 | 0.25 | 0.14 | 0.16 |
This lists the average rate of inserts/s for the tests that do inserts concurrent with queries. For such tests the query rate is listed in the table above. The read+write tests are setup so that the insert rate should match the target rate every second. Cells that are not at least 95% of the target have a red background to indicate a failure to satisfy the target.
| dbms | q100.1 | q500.1 | q1000.1 |
|---|---|---|---|
| my5651_rel.cy10a_bee | 100 | 499 | 999 |
| my5651_rel.cy10a1_bee | 100 | 499 | 997 |
| my5651_rel.cy10a2_bee | 100 | 499 | 998 |
| my5651_rel.cy10a4_bee | 97 | 352 | 445 |
| target | 100 | 500 | 1000 |
l.i0
l.i0: load without secondary indexes. Graphs for performance per 1-second interval are here.
Average throughput:
Insert response time histogram: each cell has the percentage of responses that take <= the time in the header and max is the max response time in seconds. For the max column values in the top 25% of the range have a red background and in the bottom 25% of the range have a green background. The red background is not used when the min value is within 80% of the max value.
| dbms | 256us | 1ms | 4ms | 16ms | 64ms | 256ms | 1s | 4s | 16s | gt | max |
|---|---|---|---|---|---|---|---|---|---|---|---|
| my5651_rel.cy10a_bee | 82.659 | 17.196 | 0.071 | 0.070 | 0.004 | 0.209 | |||||
| my5651_rel.cy10a1_bee | 86.878 | 12.982 | 0.101 | 0.035 | 0.004 | 0.222 | |||||
| my5651_rel.cy10a2_bee | 81.972 | 17.833 | 0.126 | 0.065 | 0.004 | 0.199 | |||||
| my5651_rel.cy10a4_bee | 63.202 | 35.640 | 0.973 | 0.181 | 0.003 | 0.204 |
Performance metrics for the DBMS listed above. Some are normalized by throughput, others are not. Legend for results is here.
ips	qps	rps	rmbps	wps	wmbps	rpq	rkbpq	wpi	wkbpi	csps	cpups	cspq	cpupq	dbgb1	dbgb2	rss	maxop	p50	p99	tag
94798	0	831	3.2	460.3	33.9	0.009	0.035	0.005	0.366	12098	21.6	0.128	18	52.6	93.1	10.6	0.209	95296	76713	800m.my5651_rel.cy10a_bee
96513	0	845	3.3	91.7	34.5	0.009	0.035	0.001	0.366	11118	21.8	0.115	18	52.6	93.1	10.6	0.222	96993	80208	800m.my5651_rel.cy10a1_bee
93864	0	823	3.2	469.4	33.9	0.009	0.035	0.005	0.370	12051	21.6	0.128	18	52.6	93.1	10.6	0.199	94696	69811	800m.my5651_rel.cy10a2_bee
80678	0	708	2.8	91.4	28.9	0.009	0.035	0.001	0.367	9897	20.3	0.123	20	52.6	93.1	10.6	0.204	80507	68821	800m.my5651_rel.cy10a4_bee
l.x
l.x: create secondary indexes.
Average throughput:
Performance metrics for the DBMS listed above. Some are normalized by throughput, others are not. Legend for results is here.
ips	qps	rps	rmbps	wps	wmbps	rpq	rkbpq	wpi	wkbpi	csps	cpups	cspq	cpupq	dbgb1	dbgb2	rss	maxop	p50	p99	tag
86507	0	565	82.5	698.2	104.3	0.007	0.977	0.008	1.235	1974	11.3	0.023	10	108.4	148.9	10.3	0.012	NA	NA	800m.my5651_rel.cy10a_bee
78804	0	234	74.3	335.7	95.8	0.003	0.965	0.004	1.245	1023	10.5	0.013	11	108.4	148.9	10.4	0.015	NA	NA	800m.my5651_rel.cy10a1_bee
86413	0	567	82.4	699.5	104.1	0.007	0.977	0.008	1.234	1945	11.3	0.023	10	108.4	148.9	10.3	0.018	NA	NA	800m.my5651_rel.cy10a2_bee
37988	0	129	35.8	279.9	47.0	0.003	0.966	0.007	1.268	1571	5.9	0.041	12	108.4	148.9	10.3	0.018	NA	NA	800m.my5651_rel.cy10a4_bee
l.i1
l.i1: continue load after secondary indexes created. Graphs for performance per 1-second interval are here.
Average throughput:
Insert response time histogram: each cell has the percentage of responses that take <= the time in the header and max is the max response time in seconds. For the max column values in the top 25% of the range have a red background and in the bottom 25% of the range have a green background. The red background is not used when the min value is within 80% of the max value.
| dbms | 256us | 1ms | 4ms | 16ms | 64ms | 256ms | 1s | 4s | 16s | gt | max |
|---|---|---|---|---|---|---|---|---|---|---|---|
| my5651_rel.cy10a_bee | 23.011 | 71.204 | 5.784 | 0.001 | 0.808 | ||||||
| my5651_rel.cy10a1_bee | 15.588 | 78.070 | 6.341 | 0.002 | 0.845 | ||||||
| my5651_rel.cy10a2_bee | 23.439 | 70.209 | 6.349 | 0.003 | 0.845 | ||||||
| my5651_rel.cy10a4_bee | 0.009 | 50.282 | 39.091 | 8.454 | 2.165 | 0.001 | 4.801 |
Delete response time histogram: each cell has the percentage of responses that take <= the time in the header and max is the max response time in seconds. For the max column values in the top 25% of the range have a red background and in the bottom 25% of the range have a green background. The red background is not used when the min value is within 80% of the max value.
| dbms | 256us | 1ms | 4ms | 16ms | 64ms | 256ms | 1s | 4s | 16s | gt | max |
|---|---|---|---|---|---|---|---|---|---|---|---|
| my5651_rel.cy10a_bee | 1.768 | 92.130 | 6.096 | 0.004 | 0.001 | 0.599 | |||||
| my5651_rel.cy10a1_bee | 1.978 | 90.667 | 7.350 | 0.005 | 0.001 | 0.634 | |||||
| my5651_rel.cy10a2_bee | 1.879 | 91.853 | 6.249 | 0.018 | 0.001 | 0.589 | |||||
| my5651_rel.cy10a4_bee | 3.639 | 52.834 | 38.432 | 4.418 | 0.670 | 0.006 | 0.001 | 4.292 |
Performance metrics for the DBMS listed above. Some are normalized by throughput, others are not. Legend for results is here.
ips	qps	rps	rmbps	wps	wmbps	rpq	rkbpq	wpi	wkbpi	csps	cpups	cspq	cpupq	dbgb1	dbgb2	rss	maxop	p50	p99	tag
1700	0	7487	116.2	9961.1	314.1	4.404	70.008	5.859	189.172	46829	16.1	27.545	758	151.6	193.3	10.5	0.808	1697	699	800m.my5651_rel.cy10a_bee
1597	0	6922	109.5	8400.2	295.6	4.336	70.219	5.261	189.558	34941	14.9	21.885	747	151.8	193.3	10.5	0.845	1598	699	800m.my5651_rel.cy10a1_bee
1670	0	7848	121.9	10303.6	324.1	4.699	74.737	6.170	198.749	48199	16.3	28.862	781	152.0	193.2	10.5	0.845	1548	699	800m.my5651_rel.cy10a2_bee
363	0	2025	36.0	2581.2	83.6	5.574	101.543	7.105	235.740	14812	6.8	40.771	1497	146.8	187.5	10.1	4.801	300	0	800m.my5651_rel.cy10a4_bee
q100.1
q100.1: range queries with 100 insert/s per client. Graphs for performance per 1-second interval are here.
Average throughput:
Query response time histogram: each cell has the percentage of responses that take <= the time in the header and max is the max response time in seconds. For max values in the top 25% of the range have a red background and in the bottom 25% of the range have a green background. The red background is not used when the min value is within 80% of the max value.
| dbms | 256us | 1ms | 4ms | 16ms | 64ms | 256ms | 1s | 4s | 16s | gt | max |
|---|---|---|---|---|---|---|---|---|---|---|---|
| my5651_rel.cy10a_bee | 28.539 | 18.234 | 51.759 | 1.460 | 0.008 | 0.046 | |||||
| my5651_rel.cy10a1_bee | 28.135 | 18.193 | 52.400 | 1.264 | 0.008 | 0.040 | |||||
| my5651_rel.cy10a2_bee | 28.190 | 18.229 | 51.999 | 1.574 | 0.008 | 0.041 | |||||
| my5651_rel.cy10a4_bee | 9.959 | 28.840 | 51.378 | 7.517 | 1.353 | 0.813 | 0.140 | 0.524 |
Insert response time histogram: each cell has the percentage of responses that take <= the time in the header and max is the max response time in seconds. For max values in the top 25% of the range have a red background and in the bottom 25% of the range have a green background. The red background is not used when the min value is within 80% of the max value.
| dbms | 256us | 1ms | 4ms | 16ms | 64ms | 256ms | 1s | 4s | 16s | gt | max |
|---|---|---|---|---|---|---|---|---|---|---|---|
| my5651_rel.cy10a_bee | 0.042 | 69.375 | 30.583 | 0.150 | |||||||
| my5651_rel.cy10a1_bee | 0.361 | 91.875 | 7.764 | 0.109 | |||||||
| my5651_rel.cy10a2_bee | 0.819 | 67.806 | 31.375 | 0.133 | |||||||
| my5651_rel.cy10a4_bee | 49.014 | 27.972 | 21.972 | 1.028 | 0.014 | 5.016 |
Delete response time histogram: each cell has the percentage of responses that take <= the time in the header and max is the max response time in seconds. For max values in the top 25% of the range have a red background and in the bottom 25% of the range have a green background. The red background is not used when the min value is within 80% of the max value.
| dbms | 256us | 1ms | 4ms | 16ms | 64ms | 256ms | 1s | 4s | 16s | gt | max |
|---|---|---|---|---|---|---|---|---|---|---|---|
| my5651_rel.cy10a_bee | 13.653 | 67.542 | 18.806 | 0.052 | |||||||
| my5651_rel.cy10a1_bee | 12.000 | 72.125 | 15.875 | 0.053 | |||||||
| my5651_rel.cy10a2_bee | 11.278 | 69.764 | 18.958 | 0.060 | |||||||
| my5651_rel.cy10a4_bee | 4.444 | 36.833 | 36.500 | 19.944 | 2.278 | 0.798 |
Performance metrics for the DBMS listed above. Some are normalized by throughput, others are not. Legend for results is here.
ips	qps	rps	rmbps	wps	wmbps	rpq	rkbpq	wpi	wkbpi	csps	cpups	cspq	cpupq	dbgb1	dbgb2	rss	maxop	p50	p99	tag
100	1035	10125	158.1	5700.0	172.1	9.782	156.452	57.115	1766.291	40387	10.5	39.018	812	151.6	193.3	10.5	0.046	927	783	800m.my5651_rel.cy10a_bee
100	1017	10058	158.0	5507.8	173.2	9.894	159.169	55.243	1779.332	34362	10.0	33.801	787	151.8	193.3	10.5	0.040	911	778	800m.my5651_rel.cy10a1_bee
100	1018	10463	163.4	6068.2	183.0	10.274	164.330	60.864	1879.590	42076	10.8	41.316	848	152.0	193.2	10.5	0.041	927	783	800m.my5651_rel.cy10a2_bee
97	254	2861	67.6	2213.2	65.8	11.251	272.402	22.863	696.196	17641	7.5	69.370	2359	146.8	187.5	8.4	0.524	256	16	800m.my5651_rel.cy10a4_bee
q500.1
q500.1: range queries with 500 insert/s per client. Graphs for performance per 1-second interval are here.
Average throughput:
Query response time histogram: each cell has the percentage of responses that take <= the time in the header and max is the max response time in seconds. For max values in the top 25% of the range have a red background and in the bottom 25% of the range have a green background. The red background is not used when the min value is within 80% of the max value.
| dbms | 256us | 1ms | 4ms | 16ms | 64ms | 256ms | 1s | 4s | 16s | gt | max |
|---|---|---|---|---|---|---|---|---|---|---|---|
| my5651_rel.cy10a_bee | 32.229 | 15.256 | 51.783 | 0.728 | 0.005 | 0.044 | |||||
| my5651_rel.cy10a1_bee | 31.484 | 15.686 | 52.175 | 0.648 | 0.007 | 0.042 | |||||
| my5651_rel.cy10a2_bee | 31.945 | 15.441 | 51.891 | 0.718 | 0.005 | 0.048 | |||||
| my5651_rel.cy10a4_bee | 7.984 | 26.823 | 52.677 | 7.993 | 2.434 | 1.710 | 0.379 | 0.579 |
Insert response time histogram: each cell has the percentage of responses that take <= the time in the header and max is the max response time in seconds. For max values in the top 25% of the range have a red background and in the bottom 25% of the range have a green background. The red background is not used when the min value is within 80% of the max value.
| dbms | 256us | 1ms | 4ms | 16ms | 64ms | 256ms | 1s | 4s | 16s | gt | max |
|---|---|---|---|---|---|---|---|---|---|---|---|
| my5651_rel.cy10a_bee | 14.222 | 83.883 | 1.894 | 0.125 | |||||||
| my5651_rel.cy10a1_bee | 11.153 | 88.214 | 0.633 | 0.143 | |||||||
| my5651_rel.cy10a2_bee | 12.014 | 85.817 | 2.169 | 0.116 | |||||||
| my5651_rel.cy10a4_bee | 0.003 | 67.769 | 15.636 | 15.456 | 1.136 | 2.671 |
Delete response time histogram: each cell has the percentage of responses that take <= the time in the header and max is the max response time in seconds. For max values in the top 25% of the range have a red background and in the bottom 25% of the range have a green background. The red background is not used when the min value is within 80% of the max value.
| dbms | 256us | 1ms | 4ms | 16ms | 64ms | 256ms | 1s | 4s | 16s | gt | max |
|---|---|---|---|---|---|---|---|---|---|---|---|
| my5651_rel.cy10a_bee | 14.561 | 80.550 | 4.881 | 0.008 | 0.086 | ||||||
| my5651_rel.cy10a1_bee | 14.842 | 82.039 | 3.117 | 0.003 | 0.080 | ||||||
| my5651_rel.cy10a2_bee | 15.675 | 78.586 | 5.717 | 0.022 | 0.095 | ||||||
| my5651_rel.cy10a4_bee | 4.933 | 53.033 | 31.039 | 9.864 | 1.128 | 0.003 | 1.460 |
Performance metrics for the DBMS listed above. Some are normalized by throughput, others are not. Legend for results is here.
ips	qps	rps	rmbps	wps	wmbps	rpq	rkbpq	wpi	wkbpi	csps	cpups	cspq	cpupq	dbgb1	dbgb2	rss	maxop	p50	p99	tag
499	1131	9326	145.5	4103.4	125.0	8.247	131.756	8.222	256.382	34432	10.2	30.446	722	151.6	193.3	10.5	0.044	1135	1055	800m.my5651_rel.cy10a_bee
499	1110	9224	143.9	4009.7	125.6	8.312	132.807	8.042	257.958	31368	9.7	28.264	699	151.8	193.3	10.5	0.042	1115	1023	800m.my5651_rel.cy10a1_bee
499	1127	9333	145.6	4152.9	126.5	8.280	132.289	8.322	259.632	34575	10.3	30.676	731	152.0	193.2	10.5	0.048	1134	1055	800m.my5651_rel.cy10a2_bee
352	161	2302	51.4	2127.5	62.1	14.305	327.358	6.051	180.970	16071	7.7	99.882	3828	146.8	187.5	9.3	0.579	144	0	800m.my5651_rel.cy10a4_bee
q1000.1
q1000.1: range queries with 1000 insert/s per client. Graphs for performance per 1-second interval are here.
Average throughput:
Query response time histogram: each cell has the percentage of responses that take <= the time in the header and max is the max response time in seconds. For max values in the top 25% of the range have a red background and in the bottom 25% of the range have a green background. The red background is not used when the min value is within 80% of the max value.
| dbms | 256us | 1ms | 4ms | 16ms | 64ms | 256ms | 1s | 4s | 16s | gt | max |
|---|---|---|---|---|---|---|---|---|---|---|---|
| my5651_rel.cy10a_bee | 23.990 | 18.368 | 55.675 | 1.956 | 0.011 | 0.051 | |||||
| my5651_rel.cy10a1_bee | 23.541 | 18.803 | 56.028 | 1.614 | 0.014 | 0.043 | |||||
| my5651_rel.cy10a2_bee | 24.221 | 17.932 | 55.862 | 1.975 | 0.010 | 0.045 | |||||
| my5651_rel.cy10a4_bee | 7.870 | 26.574 | 52.459 | 8.406 | 2.519 | 1.767 | 0.406 | nonzero | 1.085 |
Insert response time histogram: each cell has the percentage of responses that take <= the time in the header and max is the max response time in seconds. For max values in the top 25% of the range have a red background and in the bottom 25% of the range have a green background. The red background is not used when the min value is within 80% of the max value.
| dbms | 256us | 1ms | 4ms | 16ms | 64ms | 256ms | 1s | 4s | 16s | gt | max |
|---|---|---|---|---|---|---|---|---|---|---|---|
| my5651_rel.cy10a_bee | 49.422 | 48.818 | 1.760 | 0.120 | |||||||
| my5651_rel.cy10a1_bee | 36.826 | 62.799 | 0.375 | 0.097 | |||||||
| my5651_rel.cy10a2_bee | 42.208 | 55.644 | 2.147 | 0.129 | |||||||
| my5651_rel.cy10a4_bee | 0.229 | 75.540 | 10.915 | 12.553 | 0.762 | 2.762 |
Delete response time histogram: each cell has the percentage of responses that take <= the time in the header and max is the max response time in seconds. For max values in the top 25% of the range have a red background and in the bottom 25% of the range have a green background. The red background is not used when the min value is within 80% of the max value.
| dbms | 256us | 1ms | 4ms | 16ms | 64ms | 256ms | 1s | 4s | 16s | gt | max |
|---|---|---|---|---|---|---|---|---|---|---|---|
| my5651_rel.cy10a_bee | 12.354 | 85.789 | 1.857 | 0.063 | |||||||
| my5651_rel.cy10a1_bee | 14.979 | 83.668 | 1.353 | 0.056 | |||||||
| my5651_rel.cy10a2_bee | 13.015 | 84.835 | 2.143 | 0.007 | 0.073 | ||||||
| my5651_rel.cy10a4_bee | 2.153 | 54.085 | 34.532 | 8.367 | 0.858 | 0.006 | 1.818 |
Performance metrics for the DBMS listed above. Some are normalized by throughput, others are not. Legend for results is here.
ips	qps	rps	rmbps	wps	wmbps	rpq	rkbpq	wpi	wkbpi	csps	cpups	cspq	cpupq	dbgb1	dbgb2	rss	maxop	p50	p99	tag
999	948	11370	177.2	7125.8	216.6	11.991	191.400	7.134	222.065	47922	14.5	50.540	1223	151.6	193.3	10.5	0.051	943	879	800m.my5651_rel.cy10a_bee
997	932	11273	175.8	6945.9	216.5	12.095	193.167	6.965	222.336	41663	13.8	44.703	1185	151.8	193.3	10.5	0.043	943	847	800m.my5651_rel.cy10a1_bee
998	941	11390	177.5	7163.3	217.7	12.099	193.125	7.178	223.336	47998	14.7	50.986	1249	152.0	193.2	10.5	0.045	943	863	800m.my5651_rel.cy10a2_bee
445	154	2160	50.6	2059.4	61.4	13.978	335.602	4.625	141.303	15450	7.8	99.997	4039	150.6	191.5	9.4	1.085	128	0	800m.my5651_rel.cy10a4_bee
l.i0
l.i0: load without secondary indexes
Performance metrics for all DBMS, not just the ones listed above. Some are normalized by throughput, others are not. Legend for results is here.
ips	qps	rps	rmbps	wps	wmbps	rpq	rkbpq	wpi	wkbpi	csps	cpups	cspq	cpupq	dbgb1	dbgb2	rss	maxop	p50	p99	tag
94798	0	831	3.2	460.3	33.9	0.009	0.035	0.005	0.366	12098	21.6	0.128	18	52.6	93.1	10.6	0.209	95296	76713	800m.my5651_rel.cy10a_bee
96513	0	845	3.3	91.7	34.5	0.009	0.035	0.001	0.366	11118	21.8	0.115	18	52.6	93.1	10.6	0.222	96993	80208	800m.my5651_rel.cy10a1_bee
93864	0	823	3.2	469.4	33.9	0.009	0.035	0.005	0.370	12051	21.6	0.128	18	52.6	93.1	10.6	0.199	94696	69811	800m.my5651_rel.cy10a2_bee
80678	0	708	2.8	91.4	28.9	0.009	0.035	0.001	0.367	9897	20.3	0.123	20	52.6	93.1	10.6	0.204	80507	68821	800m.my5651_rel.cy10a4_bee
l.x
l.x: create secondary indexes
Performance metrics for all DBMS, not just the ones listed above. Some are normalized by throughput, others are not. Legend for results is here.
ips	qps	rps	rmbps	wps	wmbps	rpq	rkbpq	wpi	wkbpi	csps	cpups	cspq	cpupq	dbgb1	dbgb2	rss	maxop	p50	p99	tag
86507	0	565	82.5	698.2	104.3	0.007	0.977	0.008	1.235	1974	11.3	0.023	10	108.4	148.9	10.3	0.012	NA	NA	800m.my5651_rel.cy10a_bee
78804	0	234	74.3	335.7	95.8	0.003	0.965	0.004	1.245	1023	10.5	0.013	11	108.4	148.9	10.4	0.015	NA	NA	800m.my5651_rel.cy10a1_bee
86413	0	567	82.4	699.5	104.1	0.007	0.977	0.008	1.234	1945	11.3	0.023	10	108.4	148.9	10.3	0.018	NA	NA	800m.my5651_rel.cy10a2_bee
37988	0	129	35.8	279.9	47.0	0.003	0.966	0.007	1.268	1571	5.9	0.041	12	108.4	148.9	10.3	0.018	NA	NA	800m.my5651_rel.cy10a4_bee
l.i1
l.i1: continue load after secondary indexes created
Performance metrics for all DBMS, not just the ones listed above. Some are normalized by throughput, others are not. Legend for results is here.
ips	qps	rps	rmbps	wps	wmbps	rpq	rkbpq	wpi	wkbpi	csps	cpups	cspq	cpupq	dbgb1	dbgb2	rss	maxop	p50	p99	tag
1700	0	7487	116.2	9961.1	314.1	4.404	70.008	5.859	189.172	46829	16.1	27.545	758	151.6	193.3	10.5	0.808	1697	699	800m.my5651_rel.cy10a_bee
1597	0	6922	109.5	8400.2	295.6	4.336	70.219	5.261	189.558	34941	14.9	21.885	747	151.8	193.3	10.5	0.845	1598	699	800m.my5651_rel.cy10a1_bee
1670	0	7848	121.9	10303.6	324.1	4.699	74.737	6.170	198.749	48199	16.3	28.862	781	152.0	193.2	10.5	0.845	1548	699	800m.my5651_rel.cy10a2_bee
363	0	2025	36.0	2581.2	83.6	5.574	101.543	7.105	235.740	14812	6.8	40.771	1497	146.8	187.5	10.1	4.801	300	0	800m.my5651_rel.cy10a4_bee
q100.1
q100.1: range queries with 100 insert/s per client
Performance metrics for all DBMS, not just the ones listed above. Some are normalized by throughput, others are not. Legend for results is here.
ips	qps	rps	rmbps	wps	wmbps	rpq	rkbpq	wpi	wkbpi	csps	cpups	cspq	cpupq	dbgb1	dbgb2	rss	maxop	p50	p99	tag
100	1035	10125	158.1	5700.0	172.1	9.782	156.452	57.115	1766.291	40387	10.5	39.018	812	151.6	193.3	10.5	0.046	927	783	800m.my5651_rel.cy10a_bee
100	1017	10058	158.0	5507.8	173.2	9.894	159.169	55.243	1779.332	34362	10.0	33.801	787	151.8	193.3	10.5	0.040	911	778	800m.my5651_rel.cy10a1_bee
100	1018	10463	163.4	6068.2	183.0	10.274	164.330	60.864	1879.590	42076	10.8	41.316	848	152.0	193.2	10.5	0.041	927	783	800m.my5651_rel.cy10a2_bee
97	254	2861	67.6	2213.2	65.8	11.251	272.402	22.863	696.196	17641	7.5	69.370	2359	146.8	187.5	8.4	0.524	256	16	800m.my5651_rel.cy10a4_bee
q500.1
q500.1: range queries with 500 insert/s per client
Performance metrics for all DBMS, not just the ones listed above. Some are normalized by throughput, others are not. Legend for results is here.
ips	qps	rps	rmbps	wps	wmbps	rpq	rkbpq	wpi	wkbpi	csps	cpups	cspq	cpupq	dbgb1	dbgb2	rss	maxop	p50	p99	tag
499	1131	9326	145.5	4103.4	125.0	8.247	131.756	8.222	256.382	34432	10.2	30.446	722	151.6	193.3	10.5	0.044	1135	1055	800m.my5651_rel.cy10a_bee
499	1110	9224	143.9	4009.7	125.6	8.312	132.807	8.042	257.958	31368	9.7	28.264	699	151.8	193.3	10.5	0.042	1115	1023	800m.my5651_rel.cy10a1_bee
499	1127	9333	145.6	4152.9	126.5	8.280	132.289	8.322	259.632	34575	10.3	30.676	731	152.0	193.2	10.5	0.048	1134	1055	800m.my5651_rel.cy10a2_bee
352	161	2302	51.4	2127.5	62.1	14.305	327.358	6.051	180.970	16071	7.7	99.882	3828	146.8	187.5	9.3	0.579	144	0	800m.my5651_rel.cy10a4_bee
q1000.1
q1000.1: range queries with 1000 insert/s per client
Performance metrics for all DBMS, not just the ones listed above. Some are normalized by throughput, others are not. Legend for results is here.
ips	qps	rps	rmbps	wps	wmbps	rpq	rkbpq	wpi	wkbpi	csps	cpups	cspq	cpupq	dbgb1	dbgb2	rss	maxop	p50	p99	tag
999	948	11370	177.2	7125.8	216.6	11.991	191.400	7.134	222.065	47922	14.5	50.540	1223	151.6	193.3	10.5	0.051	943	879	800m.my5651_rel.cy10a_bee
997	932	11273	175.8	6945.9	216.5	12.095	193.167	6.965	222.336	41663	13.8	44.703	1185	151.8	193.3	10.5	0.043	943	847	800m.my5651_rel.cy10a1_bee
998	941	11390	177.5	7163.3	217.7	12.099	193.125	7.178	223.336	47998	14.7	50.986	1249	152.0	193.2	10.5	0.045	943	863	800m.my5651_rel.cy10a2_bee
445	154	2160	50.6	2059.4	61.4	13.978	335.602	4.625	141.303	15450	7.8	99.997	4039	150.6	191.5	9.4	1.085	128	0	800m.my5651_rel.cy10a4_bee
l.i0
- l.i0: load without secondary indexes
- Legend for results is here.
- Each entry lists the percentage of responses that fit in that bucket (slower than max time for previous bucket, faster than min time for next bucket).
Insert response time histogram
256us	1ms	4ms	16ms	64ms	256ms	1s	4s	16s	gt	max	tag
0.000	82.659	17.196	0.071	0.070	0.004	0.000	0.000	0.000	0.000	0.209	my5651_rel.cy10a_bee
0.000	86.878	12.982	0.101	0.035	0.004	0.000	0.000	0.000	0.000	0.222	my5651_rel.cy10a1_bee
0.000	81.972	17.833	0.126	0.065	0.004	0.000	0.000	0.000	0.000	0.199	my5651_rel.cy10a2_bee
0.000	63.202	35.640	0.973	0.181	0.003	0.000	0.000	0.000	0.000	0.204	my5651_rel.cy10a4_bee
l.x
- l.x: create secondary indexes
- Legend for results is here.
- Each entry lists the percentage of responses that fit in that bucket (slower than max time for previous bucket, faster than min time for next bucket).
TODO - determine whether there is data for create index response time
l.i1
- l.i1: continue load after secondary indexes created
- Legend for results is here.
- Each entry lists the percentage of responses that fit in that bucket (slower than max time for previous bucket, faster than min time for next bucket).
Insert response time histogram
256us	1ms	4ms	16ms	64ms	256ms	1s	4s	16s	gt	max	tag
0.000	0.000	0.000	23.011	71.204	5.784	0.001	0.000	0.000	0.000	0.808	my5651_rel.cy10a_bee
0.000	0.000	0.000	15.588	78.070	6.341	0.002	0.000	0.000	0.000	0.845	my5651_rel.cy10a1_bee
0.000	0.000	0.000	23.439	70.209	6.349	0.003	0.000	0.000	0.000	0.845	my5651_rel.cy10a2_bee
0.000	0.000	0.000	0.009	50.282	39.091	8.454	2.165	0.001	0.000	4.801	my5651_rel.cy10a4_bee
Delete response time histogram
256us	1ms	4ms	16ms	64ms	256ms	1s	4s	16s	gt	max	tag
0.000	0.000	1.768	92.130	6.096	0.004	0.001	0.000	0.000	0.000	0.599	my5651_rel.cy10a_bee
0.000	0.000	1.978	90.667	7.350	0.005	0.001	0.000	0.000	0.000	0.634	my5651_rel.cy10a1_bee
0.000	0.000	1.879	91.853	6.249	0.018	0.001	0.000	0.000	0.000	0.589	my5651_rel.cy10a2_bee
0.000	0.000	3.639	52.834	38.432	4.418	0.670	0.006	0.001	0.000	4.292	my5651_rel.cy10a4_bee
q100.1
- q100.1: range queries with 100 insert/s per client
- Legend for results is here.
- Each entry lists the percentage of responses that fit in that bucket (slower than max time for previous bucket, faster than min time for next bucket).
Query response time histogram
256us	1ms	4ms	16ms	64ms	256ms	1s	4s	16s	gt	max	tag
28.539	18.234	51.759	1.460	0.008	0.000	0.000	0.000	0.000	0.000	0.046	my5651_rel.cy10a_bee
28.135	18.193	52.400	1.264	0.008	0.000	0.000	0.000	0.000	0.000	0.040	my5651_rel.cy10a1_bee
28.190	18.229	51.999	1.574	0.008	0.000	0.000	0.000	0.000	0.000	0.041	my5651_rel.cy10a2_bee
9.959	28.840	51.378	7.517	1.353	0.813	0.140	0.000	0.000	0.000	0.524	my5651_rel.cy10a4_bee
Insert response time histogram
256us	1ms	4ms	16ms	64ms	256ms	1s	4s	16s	gt	max	tag
0.000	0.000	0.000	0.042	69.375	30.583	0.000	0.000	0.000	0.000	0.150	my5651_rel.cy10a_bee
0.000	0.000	0.000	0.361	91.875	7.764	0.000	0.000	0.000	0.000	0.109	my5651_rel.cy10a1_bee
0.000	0.000	0.000	0.819	67.806	31.375	0.000	0.000	0.000	0.000	0.133	my5651_rel.cy10a2_bee
0.000	0.000	0.000	0.000	49.014	27.972	21.972	1.028	0.014	0.000	5.016	my5651_rel.cy10a4_bee
Delete response time histogram
256us	1ms	4ms	16ms	64ms	256ms	1s	4s	16s	gt	max	tag
0.000	0.000	13.653	67.542	18.806	0.000	0.000	0.000	0.000	0.000	0.052	my5651_rel.cy10a_bee
0.000	0.000	12.000	72.125	15.875	0.000	0.000	0.000	0.000	0.000	0.053	my5651_rel.cy10a1_bee
0.000	0.000	11.278	69.764	18.958	0.000	0.000	0.000	0.000	0.000	0.060	my5651_rel.cy10a2_bee
0.000	0.000	4.444	36.833	36.500	19.944	2.278	0.000	0.000	0.000	0.798	my5651_rel.cy10a4_bee
q500.1
- q500.1: range queries with 500 insert/s per client
- Legend for results is here.
- Each entry lists the percentage of responses that fit in that bucket (slower than max time for previous bucket, faster than min time for next bucket).
Query response time histogram
256us	1ms	4ms	16ms	64ms	256ms	1s	4s	16s	gt	max	tag
32.229	15.256	51.783	0.728	0.005	0.000	0.000	0.000	0.000	0.000	0.044	my5651_rel.cy10a_bee
31.484	15.686	52.175	0.648	0.007	0.000	0.000	0.000	0.000	0.000	0.042	my5651_rel.cy10a1_bee
31.945	15.441	51.891	0.718	0.005	0.000	0.000	0.000	0.000	0.000	0.048	my5651_rel.cy10a2_bee
7.984	26.823	52.677	7.993	2.434	1.710	0.379	0.000	0.000	0.000	0.579	my5651_rel.cy10a4_bee
Insert response time histogram
256us	1ms	4ms	16ms	64ms	256ms	1s	4s	16s	gt	max	tag
0.000	0.000	0.000	14.222	83.883	1.894	0.000	0.000	0.000	0.000	0.125	my5651_rel.cy10a_bee
0.000	0.000	0.000	11.153	88.214	0.633	0.000	0.000	0.000	0.000	0.143	my5651_rel.cy10a1_bee
0.000	0.000	0.000	12.014	85.817	2.169	0.000	0.000	0.000	0.000	0.116	my5651_rel.cy10a2_bee
0.000	0.000	0.000	0.003	67.769	15.636	15.456	1.136	0.000	0.000	2.671	my5651_rel.cy10a4_bee
Delete response time histogram
256us	1ms	4ms	16ms	64ms	256ms	1s	4s	16s	gt	max	tag
0.000	0.000	14.561	80.550	4.881	0.008	0.000	0.000	0.000	0.000	0.086	my5651_rel.cy10a_bee
0.000	0.000	14.842	82.039	3.117	0.003	0.000	0.000	0.000	0.000	0.080	my5651_rel.cy10a1_bee
0.000	0.000	15.675	78.586	5.717	0.022	0.000	0.000	0.000	0.000	0.095	my5651_rel.cy10a2_bee
0.000	0.000	4.933	53.033	31.039	9.864	1.128	0.003	0.000	0.000	1.460	my5651_rel.cy10a4_bee
q1000.1
- q1000.1: range queries with 1000 insert/s per client
- Legend for results is here.
- Each entry lists the percentage of responses that fit in that bucket (slower than max time for previous bucket, faster than min time for next bucket).
Query response time histogram
256us	1ms	4ms	16ms	64ms	256ms	1s	4s	16s	gt	max	tag
23.990	18.368	55.675	1.956	0.011	0.000	0.000	0.000	0.000	0.000	0.051	my5651_rel.cy10a_bee
23.541	18.803	56.028	1.614	0.014	0.000	0.000	0.000	0.000	0.000	0.043	my5651_rel.cy10a1_bee
24.221	17.932	55.862	1.975	0.010	0.000	0.000	0.000	0.000	0.000	0.045	my5651_rel.cy10a2_bee
7.870	26.574	52.459	8.406	2.519	1.767	0.406	nonzero	0.000	0.000	1.085	my5651_rel.cy10a4_bee
Insert response time histogram
256us	1ms	4ms	16ms	64ms	256ms	1s	4s	16s	gt	max	tag
0.000	0.000	0.000	49.422	48.818	1.760	0.000	0.000	0.000	0.000	0.120	my5651_rel.cy10a_bee
0.000	0.000	0.000	36.826	62.799	0.375	0.000	0.000	0.000	0.000	0.097	my5651_rel.cy10a1_bee
0.000	0.000	0.000	42.208	55.644	2.147	0.000	0.000	0.000	0.000	0.129	my5651_rel.cy10a2_bee
0.000	0.000	0.000	0.229	75.540	10.915	12.553	0.762	0.000	0.000	2.762	my5651_rel.cy10a4_bee
Delete response time histogram
256us	1ms	4ms	16ms	64ms	256ms	1s	4s	16s	gt	max	tag
0.000	0.000	12.354	85.789	1.857	0.000	0.000	0.000	0.000	0.000	0.063	my5651_rel.cy10a_bee
0.000	0.000	14.979	83.668	1.353	0.000	0.000	0.000	0.000	0.000	0.056	my5651_rel.cy10a1_bee
0.000	0.000	13.015	84.835	2.143	0.007	0.000	0.000	0.000	0.000	0.073	my5651_rel.cy10a2_bee
0.000	0.000	2.153	54.085	34.532	8.367	0.858	0.006	0.000	0.000	1.818	my5651_rel.cy10a4_bee