Introduction
This is a report for the insert benchmark with 800M docs and 1 client(s). It is generated by scripts (bash, awk, sed) and Tufte might not be impressed. An overview of the insert benchmark is here and a short update is here. Below, by DBMS, I mean DBMS+version.config. An example is my8020.c10b40 where my means MySQL, 8020 is version 8.0.20 and c10b40 is the name for the configuration file.
The test server has 8 AMD cores, 16G RAM and an NVMe SSD. It is described here as the Beelink. The benchmark was run with 1 client and there were 1 or 3 connections per client (1 for queries or inserts without rate limits, 1+1 for rate limited inserts+deletes). There is 1 table. It loads 800M rows without secondary indexes, creates secondary indexes, then inserts 10M rows with a delete per insert to avoid growing the table. It then does 3 read+write tests for 3600s each that do queries as fast as possible with 100, 500 and then 1000 inserts/second/client concurrent with the queries and 1000 deletes/second to avoid growing the table. The database is larger than memory.
The tested DBMS are:
- my5651_rel.cy10a_bee - InnoDB and MySQL 5.6.51, rel build, cy10a_bee config, compiled with CMAKE_BUILD_TYPE=Release, base config
- my5740_rel_lto.cy10a_bee - InnoDB and MySQL 5.7.40, rel_lto build, cy10a_bee config, compiled with CMAKE_BUILD_TYPE=Release, base config
- my8033_rel_lto.cy10a_bee - InnoDB and MySQL 8.0.33, rel_lto build, cy10a_bee config, compiled with CMAKE_BUILD_TYPE=Release, base config
Contents
- Summary
- l.i0: load without secondary indexes
- l.x: create secondary indexes
- l.i1: continue load after secondary indexes created
- q100.1: range queries with 100 insert/s per client
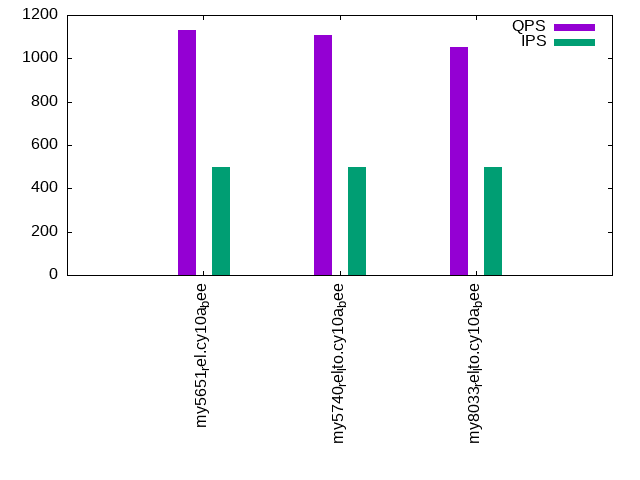
- q500.1: range queries with 500 insert/s per client
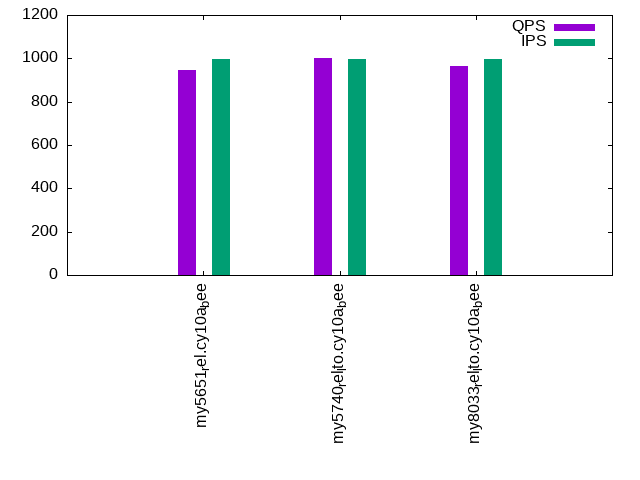
- q1000.1: range queries with 1000 insert/s per client
Summary
The numbers are inserts/s for l.i0 and l.i1, indexed docs (or rows) /s for l.x and queries/s for q100, q500, q1000. The values are the average rate over the entire test for inserts (IPS) and queries (QPS). The range of values for IPS and QPS is split into 3 parts: bottom 25%, middle 50%, top 25%. Values in the bottom 25% have a red background, values in the top 25% have a green background and values in the middle have no color. A gray background is used for values that can be ignored because the DBMS did not sustain the target insert rate. Red backgrounds are not used when the minimum value is within 80% of the max value.
| dbms | l.i0 | l.x | l.i1 | q100.1 | q500.1 | q1000.1 |
|---|---|---|---|---|---|---|
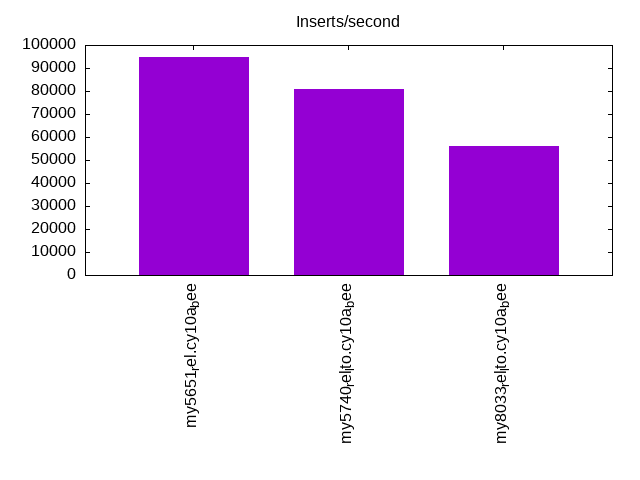
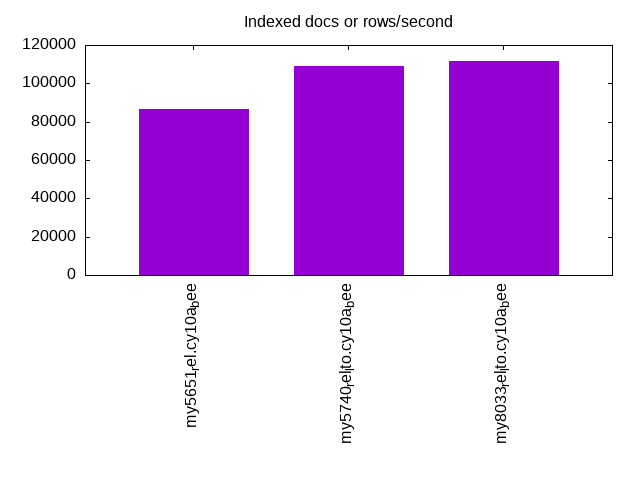
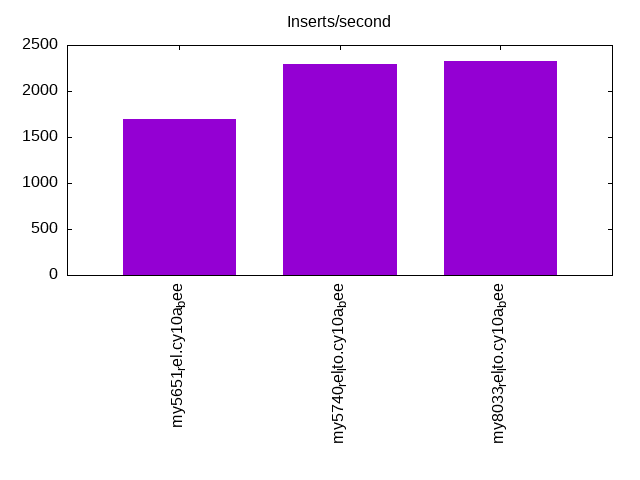
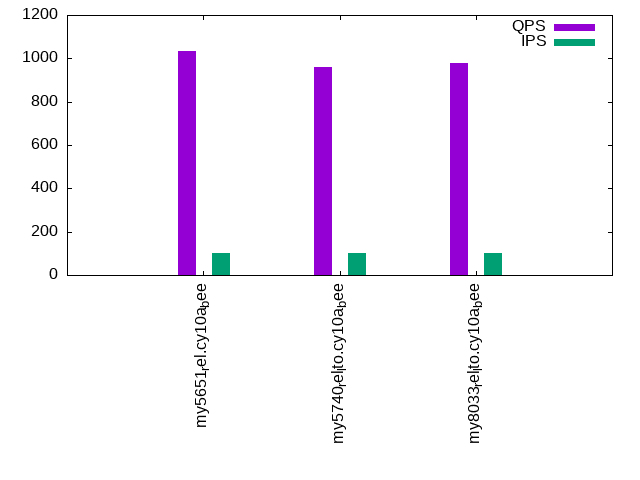
| my5651_rel.cy10a_bee | 94798 | 86507 | 1700 | 1035 | 1131 | 948 |
| my5740_rel_lto.cy10a_bee | 80718 | 109154 | 2292 | 960 | 1106 | 1002 |
| my8033_rel_lto.cy10a_bee | 56046 | 111683 | 2322 | 977 | 1050 | 963 |
This table has relative throughput, throughput for the DBMS relative to the DBMS in the first line, using the absolute throughput from the previous table. Values less than 0.95 have a yellow background. Values greater than 1.05 have a blue background.
| dbms | l.i0 | l.x | l.i1 | q100.1 | q500.1 | q1000.1 |
|---|---|---|---|---|---|---|
| my5651_rel.cy10a_bee | 1.00 | 1.00 | 1.00 | 1.00 | 1.00 | 1.00 |
| my5740_rel_lto.cy10a_bee | 0.85 | 1.26 | 1.35 | 0.93 | 0.98 | 1.06 |
| my8033_rel_lto.cy10a_bee | 0.59 | 1.29 | 1.37 | 0.94 | 0.93 | 1.02 |
This lists the average rate of inserts/s for the tests that do inserts concurrent with queries. For such tests the query rate is listed in the table above. The read+write tests are setup so that the insert rate should match the target rate every second. Cells that are not at least 95% of the target have a red background to indicate a failure to satisfy the target.
| dbms | q100.1 | q500.1 | q1000.1 |
|---|---|---|---|
| my5651_rel.cy10a_bee | 100 | 499 | 999 |
| my5740_rel_lto.cy10a_bee | 100 | 499 | 998 |
| my8033_rel_lto.cy10a_bee | 100 | 499 | 999 |
| target | 100 | 500 | 1000 |
l.i0
l.i0: load without secondary indexes. Graphs for performance per 1-second interval are here.
Average throughput:
Insert response time histogram: each cell has the percentage of responses that take <= the time in the header and max is the max response time in seconds. For the max column values in the top 25% of the range have a red background and in the bottom 25% of the range have a green background. The red background is not used when the min value is within 80% of the max value.
| dbms | 256us | 1ms | 4ms | 16ms | 64ms | 256ms | 1s | 4s | 16s | gt | max |
|---|---|---|---|---|---|---|---|---|---|---|---|
| my5651_rel.cy10a_bee | 82.659 | 17.196 | 0.071 | 0.070 | 0.004 | 0.209 | |||||
| my5740_rel_lto.cy10a_bee | 0.333 | 99.336 | 0.193 | 0.136 | 0.002 | 0.142 | |||||
| my8033_rel_lto.cy10a_bee | 99.370 | 0.495 | 0.133 | 0.003 | 0.185 |
Performance metrics for the DBMS listed above. Some are normalized by throughput, others are not. Legend for results is here.
ips	qps	rps	rmbps	wps	wmbps	rpq	rkbpq	wpi	wkbpi	csps	cpups	cspq	cpupq	dbgb1	dbgb2	rss	maxop	p50	p99	tag
94798	0	831	3.2	460.3	33.9	0.009	0.035	0.005	0.366	12098	21.6	0.128	18	52.6	93.1	10.6	0.209	95296	76713	800m.my5651_rel.cy10a_bee
80718	0	0	0.0	406.9	29.0	0.000	0.000	0.005	0.368	9027	21.4	0.112	21	52.6	93.1	10.9	0.142	81010	71080	800m.my5740_rel_lto.cy10a_bee
56046	0	0	0.0	351.5	21.4	0.000	0.000	0.006	0.391	6742	20.1	0.120	29	52.4	61.0	11.1	0.185	56137	51142	800m.my8033_rel_lto.cy10a_bee
l.x
l.x: create secondary indexes.
Average throughput:
Performance metrics for the DBMS listed above. Some are normalized by throughput, others are not. Legend for results is here.
ips	qps	rps	rmbps	wps	wmbps	rpq	rkbpq	wpi	wkbpi	csps	cpups	cspq	cpupq	dbgb1	dbgb2	rss	maxop	p50	p99	tag
86507	0	565	82.5	698.2	104.3	0.007	0.977	0.008	1.235	1974	11.3	0.023	10	108.4	148.9	10.3	0.012	NA	NA	800m.my5651_rel.cy10a_bee
109154	0	654	102.5	905.8	122.8	0.006	0.962	0.008	1.152	6214	12.1	0.057	9	117.7	158.2	10.2	0.013	NA	NA	800m.my5740_rel_lto.cy10a_bee
111683	0	1800	168.7	2214.8	150.3	0.016	1.547	0.020	1.378	8851	43.8	0.079	31	117.2	125.8	10.4	0.011	NA	NA	800m.my8033_rel_lto.cy10a_bee
l.i1
l.i1: continue load after secondary indexes created. Graphs for performance per 1-second interval are here.
Average throughput:
Insert response time histogram: each cell has the percentage of responses that take <= the time in the header and max is the max response time in seconds. For the max column values in the top 25% of the range have a red background and in the bottom 25% of the range have a green background. The red background is not used when the min value is within 80% of the max value.
| dbms | 256us | 1ms | 4ms | 16ms | 64ms | 256ms | 1s | 4s | 16s | gt | max |
|---|---|---|---|---|---|---|---|---|---|---|---|
| my5651_rel.cy10a_bee | 23.011 | 71.204 | 5.784 | 0.001 | 0.808 | ||||||
| my5740_rel_lto.cy10a_bee | 52.790 | 43.975 | 3.234 | 0.001 | 0.363 | ||||||
| my8033_rel_lto.cy10a_bee | 56.407 | 40.114 | 3.479 | 0.236 |
Delete response time histogram: each cell has the percentage of responses that take <= the time in the header and max is the max response time in seconds. For the max column values in the top 25% of the range have a red background and in the bottom 25% of the range have a green background. The red background is not used when the min value is within 80% of the max value.
| dbms | 256us | 1ms | 4ms | 16ms | 64ms | 256ms | 1s | 4s | 16s | gt | max |
|---|---|---|---|---|---|---|---|---|---|---|---|
| my5651_rel.cy10a_bee | 1.768 | 92.130 | 6.096 | 0.004 | 0.001 | 0.599 | |||||
| my5740_rel_lto.cy10a_bee | 62.198 | 37.276 | 0.522 | 0.004 | 0.090 | ||||||
| my8033_rel_lto.cy10a_bee | 18.131 | 81.200 | 0.667 | 0.002 | 0.072 |
Performance metrics for the DBMS listed above. Some are normalized by throughput, others are not. Legend for results is here.
ips	qps	rps	rmbps	wps	wmbps	rpq	rkbpq	wpi	wkbpi	csps	cpups	cspq	cpupq	dbgb1	dbgb2	rss	maxop	p50	p99	tag
1700	0	7487	116.2	9961.1	314.1	4.404	70.008	5.859	189.172	46829	16.1	27.545	758	151.6	193.3	10.5	0.808	1697	699	800m.my5651_rel.cy10a_bee
2292	0	8363	130.7	11475.6	365.4	3.649	58.383	5.007	163.234	56299	24.6	24.563	859	154.7	196.8	10.7	0.363	2297	699	800m.my5740_rel_lto.cy10a_bee
2322	0	8601	134.4	14310.3	388.0	3.704	59.260	6.162	171.099	60184	26.2	25.916	903	153.9	164.0	10.7	0.236	2347	699	800m.my8033_rel_lto.cy10a_bee
q100.1
q100.1: range queries with 100 insert/s per client. Graphs for performance per 1-second interval are here.
Average throughput:
Query response time histogram: each cell has the percentage of responses that take <= the time in the header and max is the max response time in seconds. For max values in the top 25% of the range have a red background and in the bottom 25% of the range have a green background. The red background is not used when the min value is within 80% of the max value.
| dbms | 256us | 1ms | 4ms | 16ms | 64ms | 256ms | 1s | 4s | 16s | gt | max |
|---|---|---|---|---|---|---|---|---|---|---|---|
| my5651_rel.cy10a_bee | 28.539 | 18.234 | 51.759 | 1.460 | 0.008 | 0.046 | |||||
| my5740_rel_lto.cy10a_bee | 14.773 | 29.358 | 54.023 | 1.836 | 0.010 | nonzero | 0.339 | ||||
| my8033_rel_lto.cy10a_bee | 4.742 | 38.688 | 55.233 | 1.309 | 0.028 | 0.052 |
Insert response time histogram: each cell has the percentage of responses that take <= the time in the header and max is the max response time in seconds. For max values in the top 25% of the range have a red background and in the bottom 25% of the range have a green background. The red background is not used when the min value is within 80% of the max value.
| dbms | 256us | 1ms | 4ms | 16ms | 64ms | 256ms | 1s | 4s | 16s | gt | max |
|---|---|---|---|---|---|---|---|---|---|---|---|
| my5651_rel.cy10a_bee | 0.042 | 69.375 | 30.583 | 0.150 | |||||||
| my5740_rel_lto.cy10a_bee | 1.833 | 90.444 | 7.708 | 0.014 | 0.345 | ||||||
| my8033_rel_lto.cy10a_bee | 35.097 | 62.333 | 2.569 | 0.125 |
Delete response time histogram: each cell has the percentage of responses that take <= the time in the header and max is the max response time in seconds. For max values in the top 25% of the range have a red background and in the bottom 25% of the range have a green background. The red background is not used when the min value is within 80% of the max value.
| dbms | 256us | 1ms | 4ms | 16ms | 64ms | 256ms | 1s | 4s | 16s | gt | max |
|---|---|---|---|---|---|---|---|---|---|---|---|
| my5651_rel.cy10a_bee | 13.653 | 67.542 | 18.806 | 0.052 | |||||||
| my5740_rel_lto.cy10a_bee | 55.681 | 44.139 | 0.167 | 0.014 | 0.320 | ||||||
| my8033_rel_lto.cy10a_bee | 46.250 | 52.597 | 1.153 | 0.046 |
Performance metrics for the DBMS listed above. Some are normalized by throughput, others are not. Legend for results is here.
ips	qps	rps	rmbps	wps	wmbps	rpq	rkbpq	wpi	wkbpi	csps	cpups	cspq	cpupq	dbgb1	dbgb2	rss	maxop	p50	p99	tag
100	1035	10125	158.1	5700.0	172.1	9.782	156.452	57.115	1766.291	40387	10.5	39.018	812	151.6	193.3	10.5	0.046	927	783	800m.my5651_rel.cy10a_bee
100	960	11125	173.8	8111.3	211.9	11.590	185.434	81.276	2173.873	51133	15.2	53.269	1267	154.7	196.8	10.7	0.339	927	799	800m.my5740_rel_lto.cy10a_bee
100	977	11044	172.6	8780.4	224.5	11.302	180.824	87.980	2303.235	49753	16.6	50.914	1359	153.9	164.0	10.7	0.052	943	799	800m.my8033_rel_lto.cy10a_bee
q500.1
q500.1: range queries with 500 insert/s per client. Graphs for performance per 1-second interval are here.
Average throughput:
Query response time histogram: each cell has the percentage of responses that take <= the time in the header and max is the max response time in seconds. For max values in the top 25% of the range have a red background and in the bottom 25% of the range have a green background. The red background is not used when the min value is within 80% of the max value.
| dbms | 256us | 1ms | 4ms | 16ms | 64ms | 256ms | 1s | 4s | 16s | gt | max |
|---|---|---|---|---|---|---|---|---|---|---|---|
| my5651_rel.cy10a_bee | 32.229 | 15.256 | 51.783 | 0.728 | 0.005 | 0.044 | |||||
| my5740_rel_lto.cy10a_bee | 13.448 | 32.971 | 52.766 | 0.811 | 0.004 | 0.043 | |||||
| my8033_rel_lto.cy10a_bee | 5.066 | 39.664 | 54.421 | 0.841 | 0.009 | 0.053 |
Insert response time histogram: each cell has the percentage of responses that take <= the time in the header and max is the max response time in seconds. For max values in the top 25% of the range have a red background and in the bottom 25% of the range have a green background. The red background is not used when the min value is within 80% of the max value.
| dbms | 256us | 1ms | 4ms | 16ms | 64ms | 256ms | 1s | 4s | 16s | gt | max |
|---|---|---|---|---|---|---|---|---|---|---|---|
| my5651_rel.cy10a_bee | 14.222 | 83.883 | 1.894 | 0.125 | |||||||
| my5740_rel_lto.cy10a_bee | 78.458 | 21.450 | 0.092 | 0.092 | |||||||
| my8033_rel_lto.cy10a_bee | 67.533 | 32.392 | 0.075 | 0.097 |
Delete response time histogram: each cell has the percentage of responses that take <= the time in the header and max is the max response time in seconds. For max values in the top 25% of the range have a red background and in the bottom 25% of the range have a green background. The red background is not used when the min value is within 80% of the max value.
| dbms | 256us | 1ms | 4ms | 16ms | 64ms | 256ms | 1s | 4s | 16s | gt | max |
|---|---|---|---|---|---|---|---|---|---|---|---|
| my5651_rel.cy10a_bee | 14.561 | 80.550 | 4.881 | 0.008 | 0.086 | ||||||
| my5740_rel_lto.cy10a_bee | 94.283 | 5.708 | 0.008 | 0.056 | |||||||
| my8033_rel_lto.cy10a_bee | 92.878 | 6.967 | 0.156 | 0.036 |
Performance metrics for the DBMS listed above. Some are normalized by throughput, others are not. Legend for results is here.
ips	qps	rps	rmbps	wps	wmbps	rpq	rkbpq	wpi	wkbpi	csps	cpups	cspq	cpupq	dbgb1	dbgb2	rss	maxop	p50	p99	tag
499	1131	9326	145.5	4103.4	125.0	8.247	131.756	8.222	256.382	34432	10.2	30.446	722	151.6	193.3	10.5	0.044	1135	1055	800m.my5651_rel.cy10a_bee
499	1106	9272	144.9	4201.9	128.9	8.386	134.178	8.416	264.278	35712	11.7	32.301	847	154.7	196.8	10.7	0.043	1103	1036	800m.my5740_rel_lto.cy10a_bee
499	1050	8999	140.6	5393.8	140.1	8.575	137.198	10.803	287.377	36661	12.7	34.932	968	153.9	164.0	10.7	0.053	1055	990	800m.my8033_rel_lto.cy10a_bee
q1000.1
q1000.1: range queries with 1000 insert/s per client. Graphs for performance per 1-second interval are here.
Average throughput:
Query response time histogram: each cell has the percentage of responses that take <= the time in the header and max is the max response time in seconds. For max values in the top 25% of the range have a red background and in the bottom 25% of the range have a green background. The red background is not used when the min value is within 80% of the max value.
| dbms | 256us | 1ms | 4ms | 16ms | 64ms | 256ms | 1s | 4s | 16s | gt | max |
|---|---|---|---|---|---|---|---|---|---|---|---|
| my5651_rel.cy10a_bee | 23.990 | 18.368 | 55.675 | 1.956 | 0.011 | 0.051 | |||||
| my5740_rel_lto.cy10a_bee | 12.627 | 30.859 | 54.970 | 1.535 | 0.009 | 0.049 | |||||
| my8033_rel_lto.cy10a_bee | 4.876 | 36.867 | 56.696 | 1.541 | 0.019 | 0.057 |
Insert response time histogram: each cell has the percentage of responses that take <= the time in the header and max is the max response time in seconds. For max values in the top 25% of the range have a red background and in the bottom 25% of the range have a green background. The red background is not used when the min value is within 80% of the max value.
| dbms | 256us | 1ms | 4ms | 16ms | 64ms | 256ms | 1s | 4s | 16s | gt | max |
|---|---|---|---|---|---|---|---|---|---|---|---|
| my5651_rel.cy10a_bee | 49.422 | 48.818 | 1.760 | 0.120 | |||||||
| my5740_rel_lto.cy10a_bee | 68.386 | 31.526 | 0.088 | 0.096 | |||||||
| my8033_rel_lto.cy10a_bee | 90.944 | 8.558 | 0.497 | 0.113 |
Delete response time histogram: each cell has the percentage of responses that take <= the time in the header and max is the max response time in seconds. For max values in the top 25% of the range have a red background and in the bottom 25% of the range have a green background. The red background is not used when the min value is within 80% of the max value.
| dbms | 256us | 1ms | 4ms | 16ms | 64ms | 256ms | 1s | 4s | 16s | gt | max |
|---|---|---|---|---|---|---|---|---|---|---|---|
| my5651_rel.cy10a_bee | 12.354 | 85.789 | 1.857 | 0.063 | |||||||
| my5740_rel_lto.cy10a_bee | 96.321 | 3.667 | 0.010 | 0.003 | 0.092 | ||||||
| my8033_rel_lto.cy10a_bee | 83.290 | 16.385 | 0.325 | 0.056 |
Performance metrics for the DBMS listed above. Some are normalized by throughput, others are not. Legend for results is here.
ips	qps	rps	rmbps	wps	wmbps	rpq	rkbpq	wpi	wkbpi	csps	cpups	cspq	cpupq	dbgb1	dbgb2	rss	maxop	p50	p99	tag
999	948	11370	177.2	7125.8	216.6	11.991	191.400	7.134	222.065	47922	14.5	50.540	1223	151.6	193.3	10.5	0.051	943	879	800m.my5651_rel.cy10a_bee
998	1002	11648	182.0	7160.7	219.1	11.631	186.095	7.175	224.800	50341	16.5	50.265	1318	154.7	196.8	10.7	0.049	1007	864	800m.my5740_rel_lto.cy10a_bee
999	963	11460	179.1	9254.4	239.0	11.902	190.430	9.266	245.078	52136	17.7	54.145	1471	153.9	164.0	10.7	0.057	959	895	800m.my8033_rel_lto.cy10a_bee
l.i0
l.i0: load without secondary indexes
Performance metrics for all DBMS, not just the ones listed above. Some are normalized by throughput, others are not. Legend for results is here.
ips	qps	rps	rmbps	wps	wmbps	rpq	rkbpq	wpi	wkbpi	csps	cpups	cspq	cpupq	dbgb1	dbgb2	rss	maxop	p50	p99	tag
94798	0	831	3.2	460.3	33.9	0.009	0.035	0.005	0.366	12098	21.6	0.128	18	52.6	93.1	10.6	0.209	95296	76713	800m.my5651_rel.cy10a_bee
80718	0	0	0.0	406.9	29.0	0.000	0.000	0.005	0.368	9027	21.4	0.112	21	52.6	93.1	10.9	0.142	81010	71080	800m.my5740_rel_lto.cy10a_bee
56046	0	0	0.0	351.5	21.4	0.000	0.000	0.006	0.391	6742	20.1	0.120	29	52.4	61.0	11.1	0.185	56137	51142	800m.my8033_rel_lto.cy10a_bee
l.x
l.x: create secondary indexes
Performance metrics for all DBMS, not just the ones listed above. Some are normalized by throughput, others are not. Legend for results is here.
ips	qps	rps	rmbps	wps	wmbps	rpq	rkbpq	wpi	wkbpi	csps	cpups	cspq	cpupq	dbgb1	dbgb2	rss	maxop	p50	p99	tag
86507	0	565	82.5	698.2	104.3	0.007	0.977	0.008	1.235	1974	11.3	0.023	10	108.4	148.9	10.3	0.012	NA	NA	800m.my5651_rel.cy10a_bee
109154	0	654	102.5	905.8	122.8	0.006	0.962	0.008	1.152	6214	12.1	0.057	9	117.7	158.2	10.2	0.013	NA	NA	800m.my5740_rel_lto.cy10a_bee
111683	0	1800	168.7	2214.8	150.3	0.016	1.547	0.020	1.378	8851	43.8	0.079	31	117.2	125.8	10.4	0.011	NA	NA	800m.my8033_rel_lto.cy10a_bee
l.i1
l.i1: continue load after secondary indexes created
Performance metrics for all DBMS, not just the ones listed above. Some are normalized by throughput, others are not. Legend for results is here.
ips	qps	rps	rmbps	wps	wmbps	rpq	rkbpq	wpi	wkbpi	csps	cpups	cspq	cpupq	dbgb1	dbgb2	rss	maxop	p50	p99	tag
1700	0	7487	116.2	9961.1	314.1	4.404	70.008	5.859	189.172	46829	16.1	27.545	758	151.6	193.3	10.5	0.808	1697	699	800m.my5651_rel.cy10a_bee
2292	0	8363	130.7	11475.6	365.4	3.649	58.383	5.007	163.234	56299	24.6	24.563	859	154.7	196.8	10.7	0.363	2297	699	800m.my5740_rel_lto.cy10a_bee
2322	0	8601	134.4	14310.3	388.0	3.704	59.260	6.162	171.099	60184	26.2	25.916	903	153.9	164.0	10.7	0.236	2347	699	800m.my8033_rel_lto.cy10a_bee
q100.1
q100.1: range queries with 100 insert/s per client
Performance metrics for all DBMS, not just the ones listed above. Some are normalized by throughput, others are not. Legend for results is here.
ips	qps	rps	rmbps	wps	wmbps	rpq	rkbpq	wpi	wkbpi	csps	cpups	cspq	cpupq	dbgb1	dbgb2	rss	maxop	p50	p99	tag
100	1035	10125	158.1	5700.0	172.1	9.782	156.452	57.115	1766.291	40387	10.5	39.018	812	151.6	193.3	10.5	0.046	927	783	800m.my5651_rel.cy10a_bee
100	960	11125	173.8	8111.3	211.9	11.590	185.434	81.276	2173.873	51133	15.2	53.269	1267	154.7	196.8	10.7	0.339	927	799	800m.my5740_rel_lto.cy10a_bee
100	977	11044	172.6	8780.4	224.5	11.302	180.824	87.980	2303.235	49753	16.6	50.914	1359	153.9	164.0	10.7	0.052	943	799	800m.my8033_rel_lto.cy10a_bee
q500.1
q500.1: range queries with 500 insert/s per client
Performance metrics for all DBMS, not just the ones listed above. Some are normalized by throughput, others are not. Legend for results is here.
ips	qps	rps	rmbps	wps	wmbps	rpq	rkbpq	wpi	wkbpi	csps	cpups	cspq	cpupq	dbgb1	dbgb2	rss	maxop	p50	p99	tag
499	1131	9326	145.5	4103.4	125.0	8.247	131.756	8.222	256.382	34432	10.2	30.446	722	151.6	193.3	10.5	0.044	1135	1055	800m.my5651_rel.cy10a_bee
499	1106	9272	144.9	4201.9	128.9	8.386	134.178	8.416	264.278	35712	11.7	32.301	847	154.7	196.8	10.7	0.043	1103	1036	800m.my5740_rel_lto.cy10a_bee
499	1050	8999	140.6	5393.8	140.1	8.575	137.198	10.803	287.377	36661	12.7	34.932	968	153.9	164.0	10.7	0.053	1055	990	800m.my8033_rel_lto.cy10a_bee
q1000.1
q1000.1: range queries with 1000 insert/s per client
Performance metrics for all DBMS, not just the ones listed above. Some are normalized by throughput, others are not. Legend for results is here.
ips	qps	rps	rmbps	wps	wmbps	rpq	rkbpq	wpi	wkbpi	csps	cpups	cspq	cpupq	dbgb1	dbgb2	rss	maxop	p50	p99	tag
999	948	11370	177.2	7125.8	216.6	11.991	191.400	7.134	222.065	47922	14.5	50.540	1223	151.6	193.3	10.5	0.051	943	879	800m.my5651_rel.cy10a_bee
998	1002	11648	182.0	7160.7	219.1	11.631	186.095	7.175	224.800	50341	16.5	50.265	1318	154.7	196.8	10.7	0.049	1007	864	800m.my5740_rel_lto.cy10a_bee
999	963	11460	179.1	9254.4	239.0	11.902	190.430	9.266	245.078	52136	17.7	54.145	1471	153.9	164.0	10.7	0.057	959	895	800m.my8033_rel_lto.cy10a_bee
l.i0
- l.i0: load without secondary indexes
- Legend for results is here.
- Each entry lists the percentage of responses that fit in that bucket (slower than max time for previous bucket, faster than min time for next bucket).
Insert response time histogram
256us	1ms	4ms	16ms	64ms	256ms	1s	4s	16s	gt	max	tag
0.000	82.659	17.196	0.071	0.070	0.004	0.000	0.000	0.000	0.000	0.209	my5651_rel.cy10a_bee
0.000	0.333	99.336	0.193	0.136	0.002	0.000	0.000	0.000	0.000	0.142	my5740_rel_lto.cy10a_bee
0.000	0.000	99.370	0.495	0.133	0.003	0.000	0.000	0.000	0.000	0.185	my8033_rel_lto.cy10a_bee
l.x
- l.x: create secondary indexes
- Legend for results is here.
- Each entry lists the percentage of responses that fit in that bucket (slower than max time for previous bucket, faster than min time for next bucket).
TODO - determine whether there is data for create index response time
l.i1
- l.i1: continue load after secondary indexes created
- Legend for results is here.
- Each entry lists the percentage of responses that fit in that bucket (slower than max time for previous bucket, faster than min time for next bucket).
Insert response time histogram
256us	1ms	4ms	16ms	64ms	256ms	1s	4s	16s	gt	max	tag
0.000	0.000	0.000	23.011	71.204	5.784	0.001	0.000	0.000	0.000	0.808	my5651_rel.cy10a_bee
0.000	0.000	0.000	52.790	43.975	3.234	0.001	0.000	0.000	0.000	0.363	my5740_rel_lto.cy10a_bee
0.000	0.000	0.000	56.407	40.114	3.479	0.000	0.000	0.000	0.000	0.236	my8033_rel_lto.cy10a_bee
Delete response time histogram
256us	1ms	4ms	16ms	64ms	256ms	1s	4s	16s	gt	max	tag
0.000	0.000	1.768	92.130	6.096	0.004	0.001	0.000	0.000	0.000	0.599	my5651_rel.cy10a_bee
0.000	0.000	62.198	37.276	0.522	0.004	0.000	0.000	0.000	0.000	0.090	my5740_rel_lto.cy10a_bee
0.000	0.000	18.131	81.200	0.667	0.002	0.000	0.000	0.000	0.000	0.072	my8033_rel_lto.cy10a_bee
q100.1
- q100.1: range queries with 100 insert/s per client
- Legend for results is here.
- Each entry lists the percentage of responses that fit in that bucket (slower than max time for previous bucket, faster than min time for next bucket).
Query response time histogram
256us	1ms	4ms	16ms	64ms	256ms	1s	4s	16s	gt	max	tag
28.539	18.234	51.759	1.460	0.008	0.000	0.000	0.000	0.000	0.000	0.046	my5651_rel.cy10a_bee
14.773	29.358	54.023	1.836	0.010	0.000	nonzero	0.000	0.000	0.000	0.339	my5740_rel_lto.cy10a_bee
4.742	38.688	55.233	1.309	0.028	0.000	0.000	0.000	0.000	0.000	0.052	my8033_rel_lto.cy10a_bee
Insert response time histogram
256us	1ms	4ms	16ms	64ms	256ms	1s	4s	16s	gt	max	tag
0.000	0.000	0.000	0.042	69.375	30.583	0.000	0.000	0.000	0.000	0.150	my5651_rel.cy10a_bee
0.000	0.000	0.000	1.833	90.444	7.708	0.014	0.000	0.000	0.000	0.345	my5740_rel_lto.cy10a_bee
0.000	0.000	0.000	35.097	62.333	2.569	0.000	0.000	0.000	0.000	0.125	my8033_rel_lto.cy10a_bee
Delete response time histogram
256us	1ms	4ms	16ms	64ms	256ms	1s	4s	16s	gt	max	tag
0.000	0.000	13.653	67.542	18.806	0.000	0.000	0.000	0.000	0.000	0.052	my5651_rel.cy10a_bee
0.000	0.000	55.681	44.139	0.167	0.000	0.014	0.000	0.000	0.000	0.320	my5740_rel_lto.cy10a_bee
0.000	0.000	46.250	52.597	1.153	0.000	0.000	0.000	0.000	0.000	0.046	my8033_rel_lto.cy10a_bee
q500.1
- q500.1: range queries with 500 insert/s per client
- Legend for results is here.
- Each entry lists the percentage of responses that fit in that bucket (slower than max time for previous bucket, faster than min time for next bucket).
Query response time histogram
256us	1ms	4ms	16ms	64ms	256ms	1s	4s	16s	gt	max	tag
32.229	15.256	51.783	0.728	0.005	0.000	0.000	0.000	0.000	0.000	0.044	my5651_rel.cy10a_bee
13.448	32.971	52.766	0.811	0.004	0.000	0.000	0.000	0.000	0.000	0.043	my5740_rel_lto.cy10a_bee
5.066	39.664	54.421	0.841	0.009	0.000	0.000	0.000	0.000	0.000	0.053	my8033_rel_lto.cy10a_bee
Insert response time histogram
256us	1ms	4ms	16ms	64ms	256ms	1s	4s	16s	gt	max	tag
0.000	0.000	0.000	14.222	83.883	1.894	0.000	0.000	0.000	0.000	0.125	my5651_rel.cy10a_bee
0.000	0.000	0.000	78.458	21.450	0.092	0.000	0.000	0.000	0.000	0.092	my5740_rel_lto.cy10a_bee
0.000	0.000	0.000	67.533	32.392	0.075	0.000	0.000	0.000	0.000	0.097	my8033_rel_lto.cy10a_bee
Delete response time histogram
256us	1ms	4ms	16ms	64ms	256ms	1s	4s	16s	gt	max	tag
0.000	0.000	14.561	80.550	4.881	0.008	0.000	0.000	0.000	0.000	0.086	my5651_rel.cy10a_bee
0.000	0.000	94.283	5.708	0.008	0.000	0.000	0.000	0.000	0.000	0.056	my5740_rel_lto.cy10a_bee
0.000	0.000	92.878	6.967	0.156	0.000	0.000	0.000	0.000	0.000	0.036	my8033_rel_lto.cy10a_bee
q1000.1
- q1000.1: range queries with 1000 insert/s per client
- Legend for results is here.
- Each entry lists the percentage of responses that fit in that bucket (slower than max time for previous bucket, faster than min time for next bucket).
Query response time histogram
256us	1ms	4ms	16ms	64ms	256ms	1s	4s	16s	gt	max	tag
23.990	18.368	55.675	1.956	0.011	0.000	0.000	0.000	0.000	0.000	0.051	my5651_rel.cy10a_bee
12.627	30.859	54.970	1.535	0.009	0.000	0.000	0.000	0.000	0.000	0.049	my5740_rel_lto.cy10a_bee
4.876	36.867	56.696	1.541	0.019	0.000	0.000	0.000	0.000	0.000	0.057	my8033_rel_lto.cy10a_bee
Insert response time histogram
256us	1ms	4ms	16ms	64ms	256ms	1s	4s	16s	gt	max	tag
0.000	0.000	0.000	49.422	48.818	1.760	0.000	0.000	0.000	0.000	0.120	my5651_rel.cy10a_bee
0.000	0.000	0.000	68.386	31.526	0.088	0.000	0.000	0.000	0.000	0.096	my5740_rel_lto.cy10a_bee
0.000	0.000	0.000	90.944	8.558	0.497	0.000	0.000	0.000	0.000	0.113	my8033_rel_lto.cy10a_bee
Delete response time histogram
256us	1ms	4ms	16ms	64ms	256ms	1s	4s	16s	gt	max	tag
0.000	0.000	12.354	85.789	1.857	0.000	0.000	0.000	0.000	0.000	0.063	my5651_rel.cy10a_bee
0.000	0.000	96.321	3.667	0.010	0.003	0.000	0.000	0.000	0.000	0.092	my5740_rel_lto.cy10a_bee
0.000	0.000	83.290	16.385	0.325	0.000	0.000	0.000	0.000	0.000	0.056	my8033_rel_lto.cy10a_bee