Introduction
This is a report for the insert benchmark with 20M docs and 1 client(s). It is generated by scripts (bash, awk, sed) and Tufte might not be impressed. An overview of the insert benchmark is here and a short update is here. Below, by DBMS, I mean DBMS+version.config. An example is my8020.c10b40 where my means MySQL, 8020 is version 8.0.20 and c10b40 is the name for the configuration file.
The test server has 8 AMD cores, 16G RAM and an NVMe SSD. It is described here as the Beelink. The benchmark was run with 1 client and there were 1 or 3 connections per client (1 for queries or inserts without rate limits, 1+1 for rate limited inserts+deletes). There is 1 table. It loads 20M rows without secondary indexes, creates secondary indexes, then inserts 50M rows with a delete per insert to avoid growing the table. It then does 3 read+write tests for 3600s each that do queries as fast as possible with 100, 500 and then 1000 inserts/second/client concurrent with the queries and 1000 deletes/second to avoid growing the table. The database is (or should be) cached by InnoDB.
The tested DBMS are:
- my5740_rel_lto.cy10a_bee - InnoDB and MySQL 5.7.40, rel_lto build, cy10a_bee config, compiled with CMAKE_BUILD_TYPE=Release, base config
- my5740_rel_lto.cy10a1_bee - InnoDB and MySQL 5.7.40, rel_lto build, cy10a1_bee config, compiled with CMAKE_BUILD_TYPE=Release, adds innodb_use_native_aio=off
- my5740_rel_lto.cy10a2_bee - InnoDB and MySQL 5.7.40, rel_lto build, cy10a2_bee config, compiled with CMAKE_BUILD_TYPE=Release, adds innodb_io_capacity=20k, innodb_io_capacity_max=40k
- my5740_rel_lto.cy10a3_bee - InnoDB and MySQL 5.7.40, rel_lto build, cy10a3_bee config, compiled with CMAKE_BUILD_TYPE=Release, adds innodb_io_capacity=20k, innodb_io_capacity_max=40k, innodb_flush_sync=OFF
- my5740_rel_lto.cy10a4_bee - InnoDB and MySQL 5.7.40, rel_lto build, cy10a4_bee config, compiled with CMAKE_BUILD_TYPE=Release, adds innodb_flush_method=fsync
Contents
- Summary
- l.i0: load without secondary indexes
- l.x: create secondary indexes
- l.i1: continue load after secondary indexes created
- q100.1: range queries with 100 insert/s per client
- q500.1: range queries with 500 insert/s per client
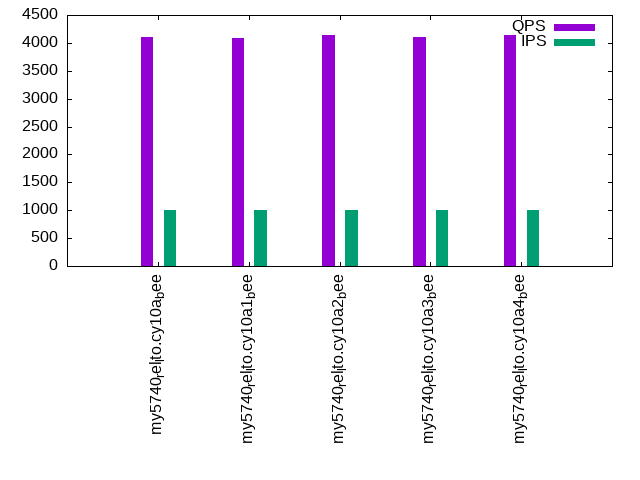
- q1000.1: range queries with 1000 insert/s per client
Summary
The numbers are inserts/s for l.i0 and l.i1, indexed docs (or rows) /s for l.x and queries/s for q100, q500, q1000. The values are the average rate over the entire test for inserts (IPS) and queries (QPS). The range of values for IPS and QPS is split into 3 parts: bottom 25%, middle 50%, top 25%. Values in the bottom 25% have a red background, values in the top 25% have a green background and values in the middle have no color. A gray background is used for values that can be ignored because the DBMS did not sustain the target insert rate. Red backgrounds are not used when the minimum value is within 80% of the max value.
| dbms | l.i0 | l.x | l.i1 | q100.1 | q500.1 | q1000.1 |
|---|---|---|---|---|---|---|
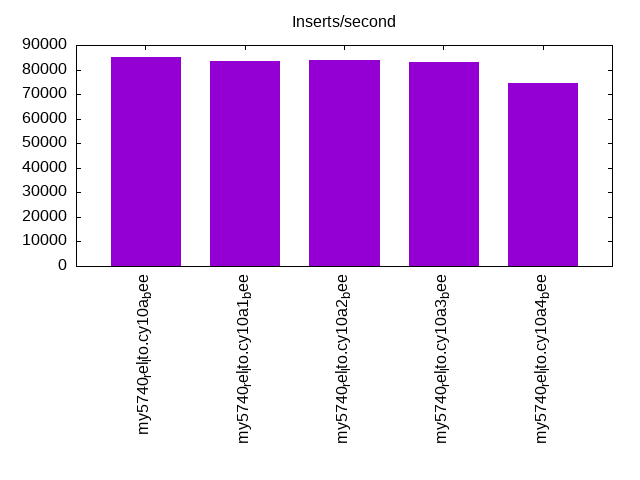
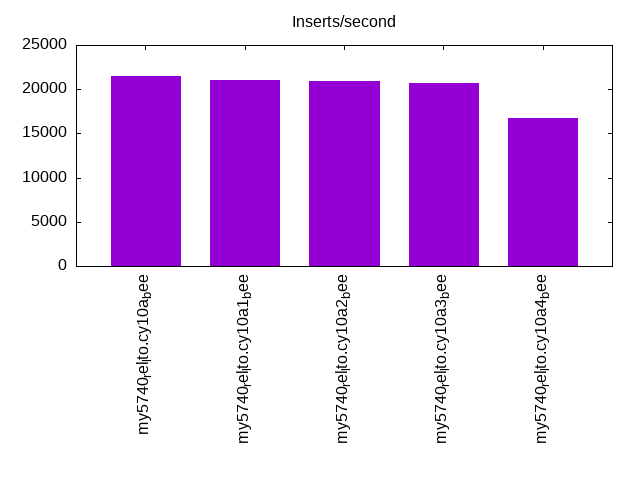
| my5740_rel_lto.cy10a_bee | 85106 | 151128 | 21515 | 4093 | 4045 | 4108 |
| my5740_rel_lto.cy10a1_bee | 83333 | 150000 | 21035 | 4080 | 4099 | 4090 |
| my5740_rel_lto.cy10a2_bee | 84034 | 150000 | 20929 | 4106 | 4093 | 4143 |
| my5740_rel_lto.cy10a3_bee | 82988 | 150000 | 20730 | 4124 | 4127 | 4112 |
| my5740_rel_lto.cy10a4_bee | 74349 | 131372 | 16762 | 4119 | 4094 | 4134 |
This table has relative throughput, throughput for the DBMS relative to the DBMS in the first line, using the absolute throughput from the previous table. Values less than 0.95 have a yellow background. Values greater than 1.05 have a blue background.
| dbms | l.i0 | l.x | l.i1 | q100.1 | q500.1 | q1000.1 |
|---|---|---|---|---|---|---|
| my5740_rel_lto.cy10a_bee | 1.00 | 1.00 | 1.00 | 1.00 | 1.00 | 1.00 |
| my5740_rel_lto.cy10a1_bee | 0.98 | 0.99 | 0.98 | 1.00 | 1.01 | 1.00 |
| my5740_rel_lto.cy10a2_bee | 0.99 | 0.99 | 0.97 | 1.00 | 1.01 | 1.01 |
| my5740_rel_lto.cy10a3_bee | 0.98 | 0.99 | 0.96 | 1.01 | 1.02 | 1.00 |
| my5740_rel_lto.cy10a4_bee | 0.87 | 0.87 | 0.78 | 1.01 | 1.01 | 1.01 |
This lists the average rate of inserts/s for the tests that do inserts concurrent with queries. For such tests the query rate is listed in the table above. The read+write tests are setup so that the insert rate should match the target rate every second. Cells that are not at least 95% of the target have a red background to indicate a failure to satisfy the target.
| dbms | q100.1 | q500.1 | q1000.1 |
|---|---|---|---|
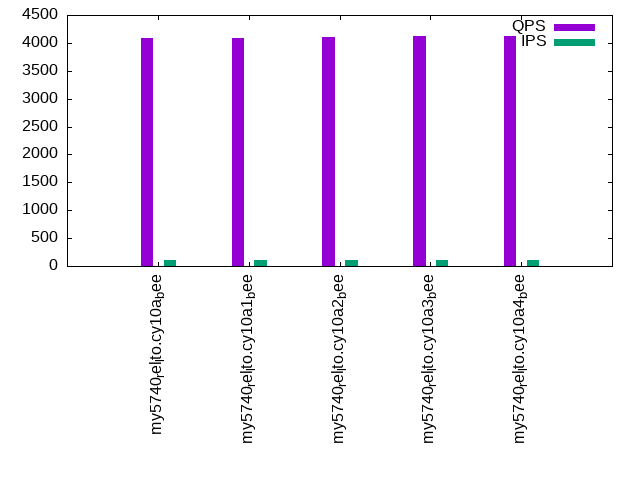
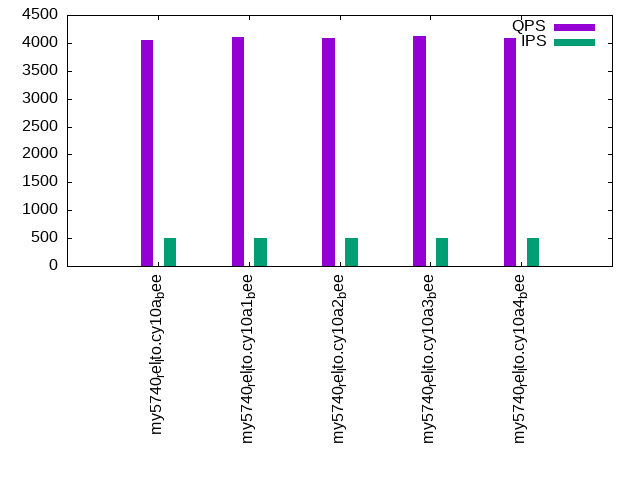
| my5740_rel_lto.cy10a_bee | 100 | 499 | 998 |
| my5740_rel_lto.cy10a1_bee | 100 | 499 | 996 |
| my5740_rel_lto.cy10a2_bee | 100 | 499 | 998 |
| my5740_rel_lto.cy10a3_bee | 100 | 499 | 998 |
| my5740_rel_lto.cy10a4_bee | 100 | 499 | 998 |
| target | 100 | 500 | 1000 |
l.i0
l.i0: load without secondary indexes. Graphs for performance per 1-second interval are here.
Average throughput:
Insert response time histogram: each cell has the percentage of responses that take <= the time in the header and max is the max response time in seconds. For the max column values in the top 25% of the range have a red background and in the bottom 25% of the range have a green background. The red background is not used when the min value is within 80% of the max value.
| dbms | 256us | 1ms | 4ms | 16ms | 64ms | 256ms | 1s | 4s | 16s | gt | max |
|---|---|---|---|---|---|---|---|---|---|---|---|
| my5740_rel_lto.cy10a_bee | 5.303 | 94.348 | 0.204 | 0.143 | 0.003 | 0.103 | |||||
| my5740_rel_lto.cy10a1_bee | 5.276 | 94.370 | 0.204 | 0.146 | 0.003 | 0.125 | |||||
| my5740_rel_lto.cy10a2_bee | 5.614 | 94.035 | 0.197 | 0.150 | 0.003 | 0.121 | |||||
| my5740_rel_lto.cy10a3_bee | 2.752 | 96.894 | 0.198 | 0.154 | 0.002 | 0.119 | |||||
| my5740_rel_lto.cy10a4_bee | 3.719 | 94.547 | 1.550 | 0.180 | 0.003 | 0.109 |
Performance metrics for the DBMS listed above. Some are normalized by throughput, others are not. Legend for results is here.
ips	qps	rps	rmbps	wps	wmbps	rpq	rkbpq	wpi	wkbpi	csps	cpups	cspq	cpupq	dbgb1	dbgb2	rss	maxop	p50	p99	tag
85106	0	0	0.0	134.2	21.6	0.000	0.000	0.002	0.259	8389	20.9	0.099	20	1.3	41.8	2.3	0.103	85636	48747	20m.my5740_rel_lto.cy10a_bee
83333	0	0	0.0	131.0	21.2	0.000	0.000	0.002	0.261	8188	20.8	0.098	20	1.3	41.8	2.3	0.125	84407	41155	20m.my5740_rel_lto.cy10a1_bee
84034	0	0	0.0	132.3	21.3	0.000	0.000	0.002	0.259	8248	20.9	0.098	20	1.3	41.8	2.3	0.121	84444	58353	20m.my5740_rel_lto.cy10a2_bee
82988	0	0	0.0	130.6	21.1	0.000	0.000	0.002	0.260	8199	20.5	0.099	20	1.3	41.8	2.3	0.119	83809	65857	20m.my5740_rel_lto.cy10a3_bee
74349	0	0	0.0	96.0	18.8	0.000	0.000	0.001	0.259	7511	19.5	0.101	21	1.3	41.8	2.3	0.109	73613	60042	20m.my5740_rel_lto.cy10a4_bee
l.x
l.x: create secondary indexes.
Average throughput:

Performance metrics for the DBMS listed above. Some are normalized by throughput, others are not. Legend for results is here.
ips	qps	rps	rmbps	wps	wmbps	rpq	rkbpq	wpi	wkbpi	csps	cpups	cspq	cpupq	dbgb1	dbgb2	rss	maxop	p50	p99	tag
151128	0	0	0.0	1576.3	134.7	0.000	0.000	0.010	0.912	9030	12.4	0.060	7	3.0	43.5	3.7	0.021	NA	NA	20m.my5740_rel_lto.cy10a_bee
150000	0	0	0.0	1562.9	133.9	0.000	0.000	0.010	0.914	15236	13.0	0.102	7	3.0	43.5	3.7	0.023	NA	NA	20m.my5740_rel_lto.cy10a1_bee
150000	0	0	0.0	1586.7	135.1	0.000	0.000	0.011	0.922	9136	12.5	0.061	7	3.0	43.5	3.7	0.023	NA	NA	20m.my5740_rel_lto.cy10a2_bee
150000	0	0	0.0	1562.3	133.8	0.000	0.000	0.010	0.914	8806	12.4	0.059	7	3.0	43.5	3.7	0.022	NA	NA	20m.my5740_rel_lto.cy10a3_bee
131372	0	0	0.0	330.5	121.3	0.000	0.000	0.003	0.945	5219	11.2	0.040	7	3.0	43.5	3.7	0.023	NA	NA	20m.my5740_rel_lto.cy10a4_bee
l.i1
l.i1: continue load after secondary indexes created. Graphs for performance per 1-second interval are here.
Average throughput:
Insert response time histogram: each cell has the percentage of responses that take <= the time in the header and max is the max response time in seconds. For the max column values in the top 25% of the range have a red background and in the bottom 25% of the range have a green background. The red background is not used when the min value is within 80% of the max value.
| dbms | 256us | 1ms | 4ms | 16ms | 64ms | 256ms | 1s | 4s | 16s | gt | max |
|---|---|---|---|---|---|---|---|---|---|---|---|
| my5740_rel_lto.cy10a_bee | 97.850 | 2.084 | 0.062 | 0.003 | 0.091 | ||||||
| my5740_rel_lto.cy10a1_bee | 97.765 | 2.148 | 0.083 | 0.004 | 0.094 | ||||||
| my5740_rel_lto.cy10a2_bee | 97.521 | 2.396 | 0.079 | 0.003 | 0.103 | ||||||
| my5740_rel_lto.cy10a3_bee | 97.536 | 2.382 | 0.079 | 0.003 | 0.101 | ||||||
| my5740_rel_lto.cy10a4_bee | 93.801 | 4.824 | 1.365 | 0.009 | 0.140 |
Delete response time histogram: each cell has the percentage of responses that take <= the time in the header and max is the max response time in seconds. For the max column values in the top 25% of the range have a red background and in the bottom 25% of the range have a green background. The red background is not used when the min value is within 80% of the max value.
| dbms | 256us | 1ms | 4ms | 16ms | 64ms | 256ms | 1s | 4s | 16s | gt | max |
|---|---|---|---|---|---|---|---|---|---|---|---|
| my5740_rel_lto.cy10a_bee | 98.475 | 1.509 | 0.012 | 0.003 | 0.091 | ||||||
| my5740_rel_lto.cy10a1_bee | 98.442 | 1.534 | 0.021 | 0.004 | 0.093 | ||||||
| my5740_rel_lto.cy10a2_bee | 98.210 | 1.769 | 0.018 | 0.003 | 0.103 | ||||||
| my5740_rel_lto.cy10a3_bee | 98.233 | 1.743 | 0.021 | 0.003 | 0.102 | ||||||
| my5740_rel_lto.cy10a4_bee | 98.149 | 1.640 | 0.208 | 0.003 | 0.089 |
Performance metrics for the DBMS listed above. Some are normalized by throughput, others are not. Legend for results is here.
ips	qps	rps	rmbps	wps	wmbps	rpq	rkbpq	wpi	wkbpi	csps	cpups	cspq	cpupq	dbgb1	dbgb2	rss	maxop	p50	p99	tag
21515	0	0	0.0	1102.1	58.2	0.000	0.000	0.051	2.772	12216	37.8	0.568	141	4.4	45.0	5.5	0.091	22026	6143	20m.my5740_rel_lto.cy10a_bee
21035	0	0	0.0	1071.5	55.1	0.000	0.000	0.051	2.680	11484	37.7	0.546	143	4.5	45.0	5.6	0.094	21475	5247	20m.my5740_rel_lto.cy10a1_bee
20929	0	0	0.0	1294.4	63.8	0.000	0.000	0.062	3.124	12536	37.3	0.599	143	4.4	44.9	5.5	0.103	21569	5793	20m.my5740_rel_lto.cy10a2_bee
20730	0	0	0.0	1276.8	63.0	0.000	0.000	0.062	3.113	12373	37.3	0.597	144	4.4	44.9	5.5	0.101	21277	5796	20m.my5740_rel_lto.cy10a3_bee
16762	0	0	0.0	861.5	47.8	0.000	0.000	0.051	2.922	9038	31.1	0.539	148	4.4	45.0	5.5	0.140	17181	3146	20m.my5740_rel_lto.cy10a4_bee
q100.1
q100.1: range queries with 100 insert/s per client. Graphs for performance per 1-second interval are here.
Average throughput:
Query response time histogram: each cell has the percentage of responses that take <= the time in the header and max is the max response time in seconds. For max values in the top 25% of the range have a red background and in the bottom 25% of the range have a green background. The red background is not used when the min value is within 80% of the max value.
| dbms | 256us | 1ms | 4ms | 16ms | 64ms | 256ms | 1s | 4s | 16s | gt | max |
|---|---|---|---|---|---|---|---|---|---|---|---|
| my5740_rel_lto.cy10a_bee | 70.073 | 29.927 | nonzero | nonzero | 0.005 | ||||||
| my5740_rel_lto.cy10a1_bee | 69.530 | 30.470 | nonzero | nonzero | 0.005 | ||||||
| my5740_rel_lto.cy10a2_bee | 70.608 | 29.392 | nonzero | nonzero | 0.004 | ||||||
| my5740_rel_lto.cy10a3_bee | 70.473 | 29.527 | nonzero | nonzero | 0.005 | ||||||
| my5740_rel_lto.cy10a4_bee | 71.209 | 28.791 | nonzero | nonzero | 0.005 |
Insert response time histogram: each cell has the percentage of responses that take <= the time in the header and max is the max response time in seconds. For max values in the top 25% of the range have a red background and in the bottom 25% of the range have a green background. The red background is not used when the min value is within 80% of the max value.
| dbms | 256us | 1ms | 4ms | 16ms | 64ms | 256ms | 1s | 4s | 16s | gt | max |
|---|---|---|---|---|---|---|---|---|---|---|---|
| my5740_rel_lto.cy10a_bee | 99.625 | 0.375 | 0.012 | ||||||||
| my5740_rel_lto.cy10a1_bee | 99.361 | 0.625 | 0.014 | 0.016 | |||||||
| my5740_rel_lto.cy10a2_bee | 99.319 | 0.681 | 0.015 | ||||||||
| my5740_rel_lto.cy10a3_bee | 99.292 | 0.708 | 0.015 | ||||||||
| my5740_rel_lto.cy10a4_bee | 99.361 | 0.639 | 0.014 |
Delete response time histogram: each cell has the percentage of responses that take <= the time in the header and max is the max response time in seconds. For max values in the top 25% of the range have a red background and in the bottom 25% of the range have a green background. The red background is not used when the min value is within 80% of the max value.
| dbms | 256us | 1ms | 4ms | 16ms | 64ms | 256ms | 1s | 4s | 16s | gt | max |
|---|---|---|---|---|---|---|---|---|---|---|---|
| my5740_rel_lto.cy10a_bee | 99.639 | 0.361 | 0.013 | ||||||||
| my5740_rel_lto.cy10a1_bee | 99.444 | 0.542 | 0.014 | 0.016 | |||||||
| my5740_rel_lto.cy10a2_bee | 99.444 | 0.556 | 0.014 | ||||||||
| my5740_rel_lto.cy10a3_bee | 99.361 | 0.639 | 0.014 | ||||||||
| my5740_rel_lto.cy10a4_bee | 99.514 | 0.486 | 0.014 |
Performance metrics for the DBMS listed above. Some are normalized by throughput, others are not. Legend for results is here.
ips	qps	rps	rmbps	wps	wmbps	rpq	rkbpq	wpi	wkbpi	csps	cpups	cspq	cpupq	dbgb1	dbgb2	rss	maxop	p50	p99	tag
100	4093	0	0.0	19.8	0.6	0.000	0.000	0.199	6.362	15903	12.5	3.886	244	4.4	45.0	5.5	0.005	4046	3836	20m.my5740_rel_lto.cy10a_bee
100	4080	0	0.0	20.1	0.6	0.000	0.000	0.202	6.448	15820	12.6	3.878	247	4.5	45.0	5.6	0.005	4043	3836	20m.my5740_rel_lto.cy10a1_bee
100	4106	0	0.0	17.5	0.6	0.000	0.000	0.175	5.671	15950	12.5	3.884	244	4.4	44.9	5.5	0.004	4062	3868	20m.my5740_rel_lto.cy10a2_bee
100	4124	0	0.0	12.5	0.4	0.000	0.000	0.125	4.066	15990	12.5	3.877	242	4.4	44.9	5.5	0.005	4076	3869	20m.my5740_rel_lto.cy10a3_bee
100	4119	0	0.0	16.2	0.5	0.000	0.000	0.163	4.954	16066	12.7	3.901	247	4.4	45.0	5.5	0.005	4075	3868	20m.my5740_rel_lto.cy10a4_bee
q500.1
q500.1: range queries with 500 insert/s per client. Graphs for performance per 1-second interval are here.
Average throughput:
Query response time histogram: each cell has the percentage of responses that take <= the time in the header and max is the max response time in seconds. For max values in the top 25% of the range have a red background and in the bottom 25% of the range have a green background. The red background is not used when the min value is within 80% of the max value.
| dbms | 256us | 1ms | 4ms | 16ms | 64ms | 256ms | 1s | 4s | 16s | gt | max |
|---|---|---|---|---|---|---|---|---|---|---|---|
| my5740_rel_lto.cy10a_bee | 69.074 | 30.926 | nonzero | nonzero | 0.005 | ||||||
| my5740_rel_lto.cy10a1_bee | 69.993 | 30.007 | nonzero | 0.003 | |||||||
| my5740_rel_lto.cy10a2_bee | 69.201 | 30.799 | nonzero | nonzero | 0.004 | ||||||
| my5740_rel_lto.cy10a3_bee | 70.921 | 29.079 | nonzero | nonzero | 0.005 | ||||||
| my5740_rel_lto.cy10a4_bee | 70.604 | 29.394 | 0.001 | 0.001 | 0.014 |
Insert response time histogram: each cell has the percentage of responses that take <= the time in the header and max is the max response time in seconds. For max values in the top 25% of the range have a red background and in the bottom 25% of the range have a green background. The red background is not used when the min value is within 80% of the max value.
| dbms | 256us | 1ms | 4ms | 16ms | 64ms | 256ms | 1s | 4s | 16s | gt | max |
|---|---|---|---|---|---|---|---|---|---|---|---|
| my5740_rel_lto.cy10a_bee | 99.589 | 0.408 | 0.003 | 0.057 | |||||||
| my5740_rel_lto.cy10a1_bee | 99.469 | 0.528 | 0.003 | 0.066 | |||||||
| my5740_rel_lto.cy10a2_bee | 99.464 | 0.531 | 0.003 | 0.003 | 0.066 | ||||||
| my5740_rel_lto.cy10a3_bee | 99.547 | 0.447 | 0.006 | 0.060 | |||||||
| my5740_rel_lto.cy10a4_bee | 97.703 | 2.217 | 0.081 | 0.063 |
Delete response time histogram: each cell has the percentage of responses that take <= the time in the header and max is the max response time in seconds. For max values in the top 25% of the range have a red background and in the bottom 25% of the range have a green background. The red background is not used when the min value is within 80% of the max value.
| dbms | 256us | 1ms | 4ms | 16ms | 64ms | 256ms | 1s | 4s | 16s | gt | max |
|---|---|---|---|---|---|---|---|---|---|---|---|
| my5740_rel_lto.cy10a_bee | 99.717 | 0.281 | 0.003 | 0.054 | |||||||
| my5740_rel_lto.cy10a1_bee | 99.650 | 0.347 | 0.003 | 0.016 | |||||||
| my5740_rel_lto.cy10a2_bee | 99.639 | 0.358 | 0.003 | 0.020 | |||||||
| my5740_rel_lto.cy10a3_bee | 99.667 | 0.331 | 0.003 | 0.060 | |||||||
| my5740_rel_lto.cy10a4_bee | 99.389 | 0.597 | 0.014 | 0.063 |
Performance metrics for the DBMS listed above. Some are normalized by throughput, others are not. Legend for results is here.
ips	qps	rps	rmbps	wps	wmbps	rpq	rkbpq	wpi	wkbpi	csps	cpups	cspq	cpupq	dbgb1	dbgb2	rss	maxop	p50	p99	tag
499	4045	0	0.0	22.2	1.1	0.000	0.000	0.044	2.216	15818	13.6	3.910	269	4.4	45.0	5.5	0.005	4011	3820	20m.my5740_rel_lto.cy10a_bee
499	4099	0	0.0	22.9	1.1	0.000	0.000	0.046	2.242	16011	13.5	3.906	263	4.5	45.0	5.6	0.003	4059	3852	20m.my5740_rel_lto.cy10a1_bee
499	4093	0	0.0	20.5	1.0	0.000	0.000	0.041	2.049	16025	13.4	3.915	262	4.4	44.9	5.5	0.004	4045	3868	20m.my5740_rel_lto.cy10a2_bee
499	4127	0	0.0	26.3	1.1	0.000	0.000	0.053	2.343	16153	13.6	3.914	264	4.4	44.9	5.5	0.005	4088	3883	20m.my5740_rel_lto.cy10a3_bee
499	4094	0	0.0	27.7	1.1	0.000	0.000	0.056	2.314	16041	13.7	3.918	268	4.4	45.0	5.5	0.014	4045	3852	20m.my5740_rel_lto.cy10a4_bee
q1000.1
q1000.1: range queries with 1000 insert/s per client. Graphs for performance per 1-second interval are here.
Average throughput:
Query response time histogram: each cell has the percentage of responses that take <= the time in the header and max is the max response time in seconds. For max values in the top 25% of the range have a red background and in the bottom 25% of the range have a green background. The red background is not used when the min value is within 80% of the max value.
| dbms | 256us | 1ms | 4ms | 16ms | 64ms | 256ms | 1s | 4s | 16s | gt | max |
|---|---|---|---|---|---|---|---|---|---|---|---|
| my5740_rel_lto.cy10a_bee | 70.407 | 29.592 | 0.001 | nonzero | 0.004 | ||||||
| my5740_rel_lto.cy10a1_bee | 69.638 | 30.361 | 0.001 | nonzero | 0.005 | ||||||
| my5740_rel_lto.cy10a2_bee | 71.423 | 28.576 | 0.001 | nonzero | 0.005 | ||||||
| my5740_rel_lto.cy10a3_bee | 70.629 | 29.370 | 0.001 | 0.003 | |||||||
| my5740_rel_lto.cy10a4_bee | 71.647 | 28.348 | 0.002 | 0.002 | nonzero | 0.040 |
Insert response time histogram: each cell has the percentage of responses that take <= the time in the header and max is the max response time in seconds. For max values in the top 25% of the range have a red background and in the bottom 25% of the range have a green background. The red background is not used when the min value is within 80% of the max value.
| dbms | 256us | 1ms | 4ms | 16ms | 64ms | 256ms | 1s | 4s | 16s | gt | max |
|---|---|---|---|---|---|---|---|---|---|---|---|
| my5740_rel_lto.cy10a_bee | 99.599 | 0.399 | 0.003 | 0.049 | |||||||
| my5740_rel_lto.cy10a1_bee | 99.510 | 0.482 | 0.007 | 0.001 | 0.066 | ||||||
| my5740_rel_lto.cy10a2_bee | 99.553 | 0.444 | 0.001 | 0.001 | 0.068 | ||||||
| my5740_rel_lto.cy10a3_bee | 99.558 | 0.433 | 0.007 | 0.001 | 0.065 | ||||||
| my5740_rel_lto.cy10a4_bee | 96.206 | 3.662 | 0.129 | 0.003 | 0.090 |
Delete response time histogram: each cell has the percentage of responses that take <= the time in the header and max is the max response time in seconds. For max values in the top 25% of the range have a red background and in the bottom 25% of the range have a green background. The red background is not used when the min value is within 80% of the max value.
| dbms | 256us | 1ms | 4ms | 16ms | 64ms | 256ms | 1s | 4s | 16s | gt | max |
|---|---|---|---|---|---|---|---|---|---|---|---|
| my5740_rel_lto.cy10a_bee | 99.717 | 0.281 | 0.003 | 0.048 | |||||||
| my5740_rel_lto.cy10a1_bee | 99.679 | 0.317 | 0.001 | 0.003 | 0.066 | ||||||
| my5740_rel_lto.cy10a2_bee | 99.683 | 0.315 | 0.001 | 0.065 | |||||||
| my5740_rel_lto.cy10a3_bee | 99.682 | 0.314 | 0.004 | 0.063 | |||||||
| my5740_rel_lto.cy10a4_bee | 99.103 | 0.867 | 0.029 | 0.001 | 0.064 |
Performance metrics for the DBMS listed above. Some are normalized by throughput, others are not. Legend for results is here.
ips	qps	rps	rmbps	wps	wmbps	rpq	rkbpq	wpi	wkbpi	csps	cpups	cspq	cpupq	dbgb1	dbgb2	rss	maxop	p50	p99	tag
998	4108	0	0.0	59.7	2.6	0.000	0.000	0.060	2.619	16366	14.5	3.984	282	4.4	45.0	5.5	0.004	4060	3851	20m.my5740_rel_lto.cy10a_bee
996	4090	0	0.0	59.8	2.5	0.000	0.000	0.060	2.615	16286	14.7	3.982	288	4.5	45.0	5.6	0.005	4043	3836	20m.my5740_rel_lto.cy10a1_bee
998	4143	0	0.0	58.6	2.5	0.000	0.000	0.059	2.612	16494	14.6	3.981	282	4.4	44.9	5.5	0.005	4091	3868	20m.my5740_rel_lto.cy10a2_bee
998	4112	0	0.0	59.9	2.6	0.000	0.000	0.060	2.624	16380	14.6	3.984	284	4.4	44.9	5.5	0.003	4063	3852	20m.my5740_rel_lto.cy10a3_bee
998	4134	0	0.0	71.9	2.6	0.000	0.000	0.072	2.617	16564	14.8	4.007	286	4.4	45.0	5.5	0.040	4090	3868	20m.my5740_rel_lto.cy10a4_bee
l.i0
l.i0: load without secondary indexes
Performance metrics for all DBMS, not just the ones listed above. Some are normalized by throughput, others are not. Legend for results is here.
ips	qps	rps	rmbps	wps	wmbps	rpq	rkbpq	wpi	wkbpi	csps	cpups	cspq	cpupq	dbgb1	dbgb2	rss	maxop	p50	p99	tag
85106	0	0	0.0	134.2	21.6	0.000	0.000	0.002	0.259	8389	20.9	0.099	20	1.3	41.8	2.3	0.103	85636	48747	20m.my5740_rel_lto.cy10a_bee
83333	0	0	0.0	131.0	21.2	0.000	0.000	0.002	0.261	8188	20.8	0.098	20	1.3	41.8	2.3	0.125	84407	41155	20m.my5740_rel_lto.cy10a1_bee
84034	0	0	0.0	132.3	21.3	0.000	0.000	0.002	0.259	8248	20.9	0.098	20	1.3	41.8	2.3	0.121	84444	58353	20m.my5740_rel_lto.cy10a2_bee
82988	0	0	0.0	130.6	21.1	0.000	0.000	0.002	0.260	8199	20.5	0.099	20	1.3	41.8	2.3	0.119	83809	65857	20m.my5740_rel_lto.cy10a3_bee
74349	0	0	0.0	96.0	18.8	0.000	0.000	0.001	0.259	7511	19.5	0.101	21	1.3	41.8	2.3	0.109	73613	60042	20m.my5740_rel_lto.cy10a4_bee
l.x
l.x: create secondary indexes
Performance metrics for all DBMS, not just the ones listed above. Some are normalized by throughput, others are not. Legend for results is here.
ips	qps	rps	rmbps	wps	wmbps	rpq	rkbpq	wpi	wkbpi	csps	cpups	cspq	cpupq	dbgb1	dbgb2	rss	maxop	p50	p99	tag
151128	0	0	0.0	1576.3	134.7	0.000	0.000	0.010	0.912	9030	12.4	0.060	7	3.0	43.5	3.7	0.021	NA	NA	20m.my5740_rel_lto.cy10a_bee
150000	0	0	0.0	1562.9	133.9	0.000	0.000	0.010	0.914	15236	13.0	0.102	7	3.0	43.5	3.7	0.023	NA	NA	20m.my5740_rel_lto.cy10a1_bee
150000	0	0	0.0	1586.7	135.1	0.000	0.000	0.011	0.922	9136	12.5	0.061	7	3.0	43.5	3.7	0.023	NA	NA	20m.my5740_rel_lto.cy10a2_bee
150000	0	0	0.0	1562.3	133.8	0.000	0.000	0.010	0.914	8806	12.4	0.059	7	3.0	43.5	3.7	0.022	NA	NA	20m.my5740_rel_lto.cy10a3_bee
131372	0	0	0.0	330.5	121.3	0.000	0.000	0.003	0.945	5219	11.2	0.040	7	3.0	43.5	3.7	0.023	NA	NA	20m.my5740_rel_lto.cy10a4_bee
l.i1
l.i1: continue load after secondary indexes created
Performance metrics for all DBMS, not just the ones listed above. Some are normalized by throughput, others are not. Legend for results is here.
ips	qps	rps	rmbps	wps	wmbps	rpq	rkbpq	wpi	wkbpi	csps	cpups	cspq	cpupq	dbgb1	dbgb2	rss	maxop	p50	p99	tag
21515	0	0	0.0	1102.1	58.2	0.000	0.000	0.051	2.772	12216	37.8	0.568	141	4.4	45.0	5.5	0.091	22026	6143	20m.my5740_rel_lto.cy10a_bee
21035	0	0	0.0	1071.5	55.1	0.000	0.000	0.051	2.680	11484	37.7	0.546	143	4.5	45.0	5.6	0.094	21475	5247	20m.my5740_rel_lto.cy10a1_bee
20929	0	0	0.0	1294.4	63.8	0.000	0.000	0.062	3.124	12536	37.3	0.599	143	4.4	44.9	5.5	0.103	21569	5793	20m.my5740_rel_lto.cy10a2_bee
20730	0	0	0.0	1276.8	63.0	0.000	0.000	0.062	3.113	12373	37.3	0.597	144	4.4	44.9	5.5	0.101	21277	5796	20m.my5740_rel_lto.cy10a3_bee
16762	0	0	0.0	861.5	47.8	0.000	0.000	0.051	2.922	9038	31.1	0.539	148	4.4	45.0	5.5	0.140	17181	3146	20m.my5740_rel_lto.cy10a4_bee
q100.1
q100.1: range queries with 100 insert/s per client
Performance metrics for all DBMS, not just the ones listed above. Some are normalized by throughput, others are not. Legend for results is here.
ips	qps	rps	rmbps	wps	wmbps	rpq	rkbpq	wpi	wkbpi	csps	cpups	cspq	cpupq	dbgb1	dbgb2	rss	maxop	p50	p99	tag
100	4093	0	0.0	19.8	0.6	0.000	0.000	0.199	6.362	15903	12.5	3.886	244	4.4	45.0	5.5	0.005	4046	3836	20m.my5740_rel_lto.cy10a_bee
100	4080	0	0.0	20.1	0.6	0.000	0.000	0.202	6.448	15820	12.6	3.878	247	4.5	45.0	5.6	0.005	4043	3836	20m.my5740_rel_lto.cy10a1_bee
100	4106	0	0.0	17.5	0.6	0.000	0.000	0.175	5.671	15950	12.5	3.884	244	4.4	44.9	5.5	0.004	4062	3868	20m.my5740_rel_lto.cy10a2_bee
100	4124	0	0.0	12.5	0.4	0.000	0.000	0.125	4.066	15990	12.5	3.877	242	4.4	44.9	5.5	0.005	4076	3869	20m.my5740_rel_lto.cy10a3_bee
100	4119	0	0.0	16.2	0.5	0.000	0.000	0.163	4.954	16066	12.7	3.901	247	4.4	45.0	5.5	0.005	4075	3868	20m.my5740_rel_lto.cy10a4_bee
q500.1
q500.1: range queries with 500 insert/s per client
Performance metrics for all DBMS, not just the ones listed above. Some are normalized by throughput, others are not. Legend for results is here.
ips	qps	rps	rmbps	wps	wmbps	rpq	rkbpq	wpi	wkbpi	csps	cpups	cspq	cpupq	dbgb1	dbgb2	rss	maxop	p50	p99	tag
499	4045	0	0.0	22.2	1.1	0.000	0.000	0.044	2.216	15818	13.6	3.910	269	4.4	45.0	5.5	0.005	4011	3820	20m.my5740_rel_lto.cy10a_bee
499	4099	0	0.0	22.9	1.1	0.000	0.000	0.046	2.242	16011	13.5	3.906	263	4.5	45.0	5.6	0.003	4059	3852	20m.my5740_rel_lto.cy10a1_bee
499	4093	0	0.0	20.5	1.0	0.000	0.000	0.041	2.049	16025	13.4	3.915	262	4.4	44.9	5.5	0.004	4045	3868	20m.my5740_rel_lto.cy10a2_bee
499	4127	0	0.0	26.3	1.1	0.000	0.000	0.053	2.343	16153	13.6	3.914	264	4.4	44.9	5.5	0.005	4088	3883	20m.my5740_rel_lto.cy10a3_bee
499	4094	0	0.0	27.7	1.1	0.000	0.000	0.056	2.314	16041	13.7	3.918	268	4.4	45.0	5.5	0.014	4045	3852	20m.my5740_rel_lto.cy10a4_bee
q1000.1
q1000.1: range queries with 1000 insert/s per client
Performance metrics for all DBMS, not just the ones listed above. Some are normalized by throughput, others are not. Legend for results is here.
ips	qps	rps	rmbps	wps	wmbps	rpq	rkbpq	wpi	wkbpi	csps	cpups	cspq	cpupq	dbgb1	dbgb2	rss	maxop	p50	p99	tag
998	4108	0	0.0	59.7	2.6	0.000	0.000	0.060	2.619	16366	14.5	3.984	282	4.4	45.0	5.5	0.004	4060	3851	20m.my5740_rel_lto.cy10a_bee
996	4090	0	0.0	59.8	2.5	0.000	0.000	0.060	2.615	16286	14.7	3.982	288	4.5	45.0	5.6	0.005	4043	3836	20m.my5740_rel_lto.cy10a1_bee
998	4143	0	0.0	58.6	2.5	0.000	0.000	0.059	2.612	16494	14.6	3.981	282	4.4	44.9	5.5	0.005	4091	3868	20m.my5740_rel_lto.cy10a2_bee
998	4112	0	0.0	59.9	2.6	0.000	0.000	0.060	2.624	16380	14.6	3.984	284	4.4	44.9	5.5	0.003	4063	3852	20m.my5740_rel_lto.cy10a3_bee
998	4134	0	0.0	71.9	2.6	0.000	0.000	0.072	2.617	16564	14.8	4.007	286	4.4	45.0	5.5	0.040	4090	3868	20m.my5740_rel_lto.cy10a4_bee
l.i0
- l.i0: load without secondary indexes
- Legend for results is here.
- Each entry lists the percentage of responses that fit in that bucket (slower than max time for previous bucket, faster than min time for next bucket).
Insert response time histogram
256us	1ms	4ms	16ms	64ms	256ms	1s	4s	16s	gt	max	tag
0.000	5.303	94.348	0.204	0.143	0.003	0.000	0.000	0.000	0.000	0.103	my5740_rel_lto.cy10a_bee
0.000	5.276	94.370	0.204	0.146	0.003	0.000	0.000	0.000	0.000	0.125	my5740_rel_lto.cy10a1_bee
0.000	5.614	94.035	0.197	0.150	0.003	0.000	0.000	0.000	0.000	0.121	my5740_rel_lto.cy10a2_bee
0.000	2.752	96.894	0.198	0.154	0.002	0.000	0.000	0.000	0.000	0.119	my5740_rel_lto.cy10a3_bee
0.000	3.719	94.547	1.550	0.180	0.003	0.000	0.000	0.000	0.000	0.109	my5740_rel_lto.cy10a4_bee
l.x
- l.x: create secondary indexes
- Legend for results is here.
- Each entry lists the percentage of responses that fit in that bucket (slower than max time for previous bucket, faster than min time for next bucket).
TODO - determine whether there is data for create index response time
l.i1
- l.i1: continue load after secondary indexes created
- Legend for results is here.
- Each entry lists the percentage of responses that fit in that bucket (slower than max time for previous bucket, faster than min time for next bucket).
Insert response time histogram
256us	1ms	4ms	16ms	64ms	256ms	1s	4s	16s	gt	max	tag
0.000	0.000	97.850	2.084	0.062	0.003	0.000	0.000	0.000	0.000	0.091	my5740_rel_lto.cy10a_bee
0.000	0.000	97.765	2.148	0.083	0.004	0.000	0.000	0.000	0.000	0.094	my5740_rel_lto.cy10a1_bee
0.000	0.000	97.521	2.396	0.079	0.003	0.000	0.000	0.000	0.000	0.103	my5740_rel_lto.cy10a2_bee
0.000	0.000	97.536	2.382	0.079	0.003	0.000	0.000	0.000	0.000	0.101	my5740_rel_lto.cy10a3_bee
0.000	0.000	93.801	4.824	1.365	0.009	0.000	0.000	0.000	0.000	0.140	my5740_rel_lto.cy10a4_bee
Delete response time histogram
256us	1ms	4ms	16ms	64ms	256ms	1s	4s	16s	gt	max	tag
0.000	0.000	98.475	1.509	0.012	0.003	0.000	0.000	0.000	0.000	0.091	my5740_rel_lto.cy10a_bee
0.000	0.000	98.442	1.534	0.021	0.004	0.000	0.000	0.000	0.000	0.093	my5740_rel_lto.cy10a1_bee
0.000	0.000	98.210	1.769	0.018	0.003	0.000	0.000	0.000	0.000	0.103	my5740_rel_lto.cy10a2_bee
0.000	0.000	98.233	1.743	0.021	0.003	0.000	0.000	0.000	0.000	0.102	my5740_rel_lto.cy10a3_bee
0.000	0.000	98.149	1.640	0.208	0.003	0.000	0.000	0.000	0.000	0.089	my5740_rel_lto.cy10a4_bee
q100.1
- q100.1: range queries with 100 insert/s per client
- Legend for results is here.
- Each entry lists the percentage of responses that fit in that bucket (slower than max time for previous bucket, faster than min time for next bucket).
Query response time histogram
256us	1ms	4ms	16ms	64ms	256ms	1s	4s	16s	gt	max	tag
70.073	29.927	nonzero	nonzero	0.000	0.000	0.000	0.000	0.000	0.000	0.005	my5740_rel_lto.cy10a_bee
69.530	30.470	nonzero	nonzero	0.000	0.000	0.000	0.000	0.000	0.000	0.005	my5740_rel_lto.cy10a1_bee
70.608	29.392	nonzero	nonzero	0.000	0.000	0.000	0.000	0.000	0.000	0.004	my5740_rel_lto.cy10a2_bee
70.473	29.527	nonzero	nonzero	0.000	0.000	0.000	0.000	0.000	0.000	0.005	my5740_rel_lto.cy10a3_bee
71.209	28.791	nonzero	nonzero	0.000	0.000	0.000	0.000	0.000	0.000	0.005	my5740_rel_lto.cy10a4_bee
Insert response time histogram
256us	1ms	4ms	16ms	64ms	256ms	1s	4s	16s	gt	max	tag
0.000	0.000	99.625	0.375	0.000	0.000	0.000	0.000	0.000	0.000	0.012	my5740_rel_lto.cy10a_bee
0.000	0.000	99.361	0.625	0.014	0.000	0.000	0.000	0.000	0.000	0.016	my5740_rel_lto.cy10a1_bee
0.000	0.000	99.319	0.681	0.000	0.000	0.000	0.000	0.000	0.000	0.015	my5740_rel_lto.cy10a2_bee
0.000	0.000	99.292	0.708	0.000	0.000	0.000	0.000	0.000	0.000	0.015	my5740_rel_lto.cy10a3_bee
0.000	0.000	99.361	0.639	0.000	0.000	0.000	0.000	0.000	0.000	0.014	my5740_rel_lto.cy10a4_bee
Delete response time histogram
256us	1ms	4ms	16ms	64ms	256ms	1s	4s	16s	gt	max	tag
0.000	0.000	99.639	0.361	0.000	0.000	0.000	0.000	0.000	0.000	0.013	my5740_rel_lto.cy10a_bee
0.000	0.000	99.444	0.542	0.014	0.000	0.000	0.000	0.000	0.000	0.016	my5740_rel_lto.cy10a1_bee
0.000	0.000	99.444	0.556	0.000	0.000	0.000	0.000	0.000	0.000	0.014	my5740_rel_lto.cy10a2_bee
0.000	0.000	99.361	0.639	0.000	0.000	0.000	0.000	0.000	0.000	0.014	my5740_rel_lto.cy10a3_bee
0.000	0.000	99.514	0.486	0.000	0.000	0.000	0.000	0.000	0.000	0.014	my5740_rel_lto.cy10a4_bee
q500.1
- q500.1: range queries with 500 insert/s per client
- Legend for results is here.
- Each entry lists the percentage of responses that fit in that bucket (slower than max time for previous bucket, faster than min time for next bucket).
Query response time histogram
256us	1ms	4ms	16ms	64ms	256ms	1s	4s	16s	gt	max	tag
69.074	30.926	nonzero	nonzero	0.000	0.000	0.000	0.000	0.000	0.000	0.005	my5740_rel_lto.cy10a_bee
69.993	30.007	nonzero	0.000	0.000	0.000	0.000	0.000	0.000	0.000	0.003	my5740_rel_lto.cy10a1_bee
69.201	30.799	nonzero	nonzero	0.000	0.000	0.000	0.000	0.000	0.000	0.004	my5740_rel_lto.cy10a2_bee
70.921	29.079	nonzero	nonzero	0.000	0.000	0.000	0.000	0.000	0.000	0.005	my5740_rel_lto.cy10a3_bee
70.604	29.394	0.001	0.001	0.000	0.000	0.000	0.000	0.000	0.000	0.014	my5740_rel_lto.cy10a4_bee
Insert response time histogram
256us	1ms	4ms	16ms	64ms	256ms	1s	4s	16s	gt	max	tag
0.000	0.000	99.589	0.408	0.003	0.000	0.000	0.000	0.000	0.000	0.057	my5740_rel_lto.cy10a_bee
0.000	0.000	99.469	0.528	0.000	0.003	0.000	0.000	0.000	0.000	0.066	my5740_rel_lto.cy10a1_bee
0.000	0.000	99.464	0.531	0.003	0.003	0.000	0.000	0.000	0.000	0.066	my5740_rel_lto.cy10a2_bee
0.000	0.000	99.547	0.447	0.006	0.000	0.000	0.000	0.000	0.000	0.060	my5740_rel_lto.cy10a3_bee
0.000	0.000	97.703	2.217	0.081	0.000	0.000	0.000	0.000	0.000	0.063	my5740_rel_lto.cy10a4_bee
Delete response time histogram
256us	1ms	4ms	16ms	64ms	256ms	1s	4s	16s	gt	max	tag
0.000	0.000	99.717	0.281	0.003	0.000	0.000	0.000	0.000	0.000	0.054	my5740_rel_lto.cy10a_bee
0.000	0.000	99.650	0.347	0.003	0.000	0.000	0.000	0.000	0.000	0.016	my5740_rel_lto.cy10a1_bee
0.000	0.000	99.639	0.358	0.003	0.000	0.000	0.000	0.000	0.000	0.020	my5740_rel_lto.cy10a2_bee
0.000	0.000	99.667	0.331	0.003	0.000	0.000	0.000	0.000	0.000	0.060	my5740_rel_lto.cy10a3_bee
0.000	0.000	99.389	0.597	0.014	0.000	0.000	0.000	0.000	0.000	0.063	my5740_rel_lto.cy10a4_bee
q1000.1
- q1000.1: range queries with 1000 insert/s per client
- Legend for results is here.
- Each entry lists the percentage of responses that fit in that bucket (slower than max time for previous bucket, faster than min time for next bucket).
Query response time histogram
256us	1ms	4ms	16ms	64ms	256ms	1s	4s	16s	gt	max	tag
70.407	29.592	0.001	nonzero	0.000	0.000	0.000	0.000	0.000	0.000	0.004	my5740_rel_lto.cy10a_bee
69.638	30.361	0.001	nonzero	0.000	0.000	0.000	0.000	0.000	0.000	0.005	my5740_rel_lto.cy10a1_bee
71.423	28.576	0.001	nonzero	0.000	0.000	0.000	0.000	0.000	0.000	0.005	my5740_rel_lto.cy10a2_bee
70.629	29.370	0.001	0.000	0.000	0.000	0.000	0.000	0.000	0.000	0.003	my5740_rel_lto.cy10a3_bee
71.647	28.348	0.002	0.002	nonzero	0.000	0.000	0.000	0.000	0.000	0.040	my5740_rel_lto.cy10a4_bee
Insert response time histogram
256us	1ms	4ms	16ms	64ms	256ms	1s	4s	16s	gt	max	tag
0.000	0.000	99.599	0.399	0.003	0.000	0.000	0.000	0.000	0.000	0.049	my5740_rel_lto.cy10a_bee
0.000	0.000	99.510	0.482	0.007	0.001	0.000	0.000	0.000	0.000	0.066	my5740_rel_lto.cy10a1_bee
0.000	0.000	99.553	0.444	0.001	0.001	0.000	0.000	0.000	0.000	0.068	my5740_rel_lto.cy10a2_bee
0.000	0.000	99.558	0.433	0.007	0.001	0.000	0.000	0.000	0.000	0.065	my5740_rel_lto.cy10a3_bee
0.000	0.000	96.206	3.662	0.129	0.003	0.000	0.000	0.000	0.000	0.090	my5740_rel_lto.cy10a4_bee
Delete response time histogram
256us	1ms	4ms	16ms	64ms	256ms	1s	4s	16s	gt	max	tag
0.000	0.000	99.717	0.281	0.003	0.000	0.000	0.000	0.000	0.000	0.048	my5740_rel_lto.cy10a_bee
0.000	0.000	99.679	0.317	0.001	0.003	0.000	0.000	0.000	0.000	0.066	my5740_rel_lto.cy10a1_bee
0.000	0.000	99.683	0.315	0.000	0.001	0.000	0.000	0.000	0.000	0.065	my5740_rel_lto.cy10a2_bee
0.000	0.000	99.682	0.314	0.004	0.000	0.000	0.000	0.000	0.000	0.063	my5740_rel_lto.cy10a3_bee
0.000	0.000	99.103	0.867	0.029	0.001	0.000	0.000	0.000	0.000	0.064	my5740_rel_lto.cy10a4_bee