Introduction
This is a report for the insert benchmark with 20M docs and 1 client(s). It is generated by scripts (bash, awk, sed) and Tufte might not be impressed. An overview of the insert benchmark is here and a short update is here. Below, by DBMS, I mean DBMS+version.config. An example is my8020.c10b40 where my means MySQL, 8020 is version 8.0.20 and c10b40 is the name for the configuration file.
The test server has 8 AMD cores, 16G RAM and an NVMe SSD. It is described here as the Beelink. The benchmark was run with 1 client and there were 1 or 3 connections per client (1 for queries or inserts without rate limits, 1+1 for rate limited inserts+deletes). There is 1 table. It loads 20M rows without secondary indexes, creates secondary indexes, then inserts 50M rows with a delete per insert to avoid growing the table. It then does 3 read+write tests for 3600s each that do queries as fast as possible with 100, 500 and then 1000 inserts/second/client concurrent with the queries and 1000 deletes/second to avoid growing the table. The database is cached by the OS but not by InnoDB.
The tested DBMS are:
- my5740_rel_lto.cy10a_1g_bee - InnoDB and MySQL 5.7.40, rel_lto build, cy10a_1g_bee config, compiled with CMAKE_BUILD_TYPE=Release, base config
- my5740_rel_lto.cy10a1_1g_bee - InnoDB and MySQL 5.7.40, rel_lto build, cy10a1_1g_bee config, compiled with CMAKE_BUILD_TYPE=Release, adds innodb_use_native_aio=off
- my5740_rel_lto.cy10a2_1g_bee - InnoDB and MySQL 5.7.40, rel_lto build, cy10a2_1g_bee config, compiled with CMAKE_BUILD_TYPE=Release, adds innodb_io_capacity=20k, innodb_io_capacity_max=40k
- my5740_rel_lto.cy10a3_1g_bee - InnoDB and MySQL 5.7.40, rel_lto build, cy10a3_1g_bee config, compiled with CMAKE_BUILD_TYPE=Release, adds innodb_io_capacity=20k, innodb_io_capacity_max=40k, innodb_flush_sync=OFF
Contents
- Summary
- l.i0: load without secondary indexes
- l.x: create secondary indexes
- l.i1: continue load after secondary indexes created
- q100.1: range queries with 100 insert/s per client
- q500.1: range queries with 500 insert/s per client
- q1000.1: range queries with 1000 insert/s per client
Summary
The numbers are inserts/s for l.i0 and l.i1, indexed docs (or rows) /s for l.x and queries/s for q100, q500, q1000. The values are the average rate over the entire test for inserts (IPS) and queries (QPS). The range of values for IPS and QPS is split into 3 parts: bottom 25%, middle 50%, top 25%. Values in the bottom 25% have a red background, values in the top 25% have a green background and values in the middle have no color. A gray background is used for values that can be ignored because the DBMS did not sustain the target insert rate. Red backgrounds are not used when the minimum value is within 80% of the max value.
| dbms | l.i0 | l.x | l.i1 | q100.1 | q500.1 | q1000.1 |
|---|---|---|---|---|---|---|
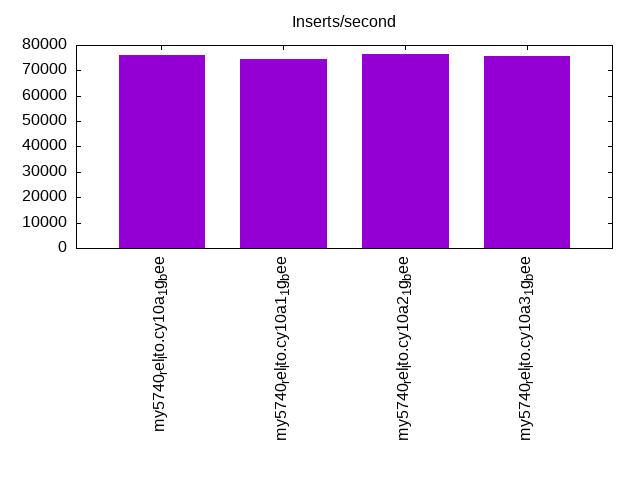
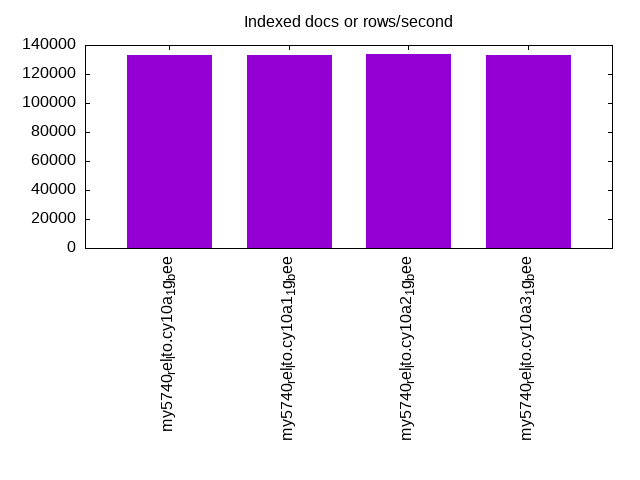
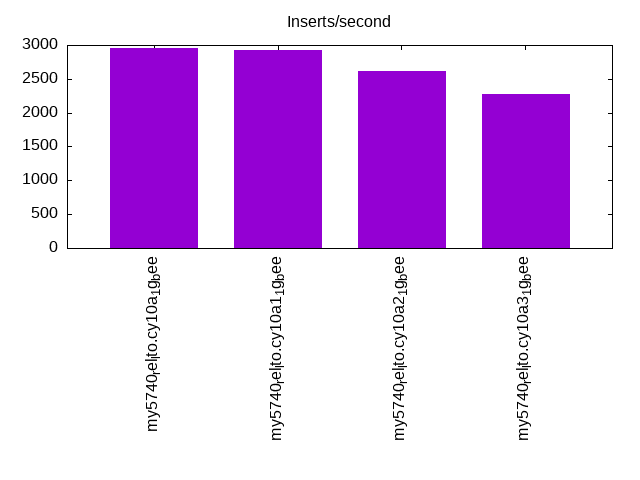
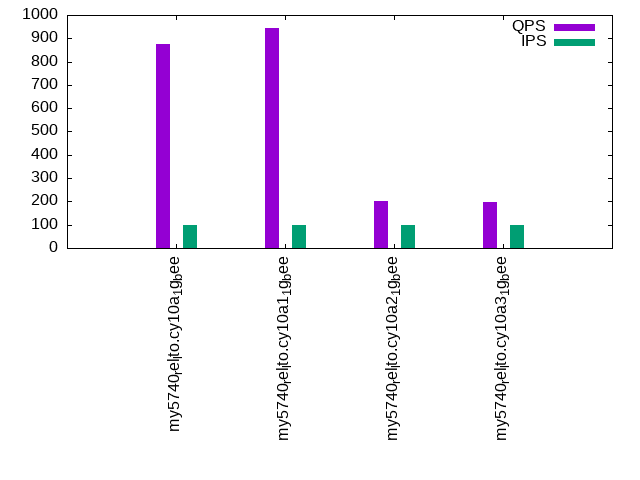
| my5740_rel_lto.cy10a_1g_bee | 76046 | 133112 | 2954 | 877 | 2066 | 1550 |
| my5740_rel_lto.cy10a1_1g_bee | 74349 | 133112 | 2932 | 944 | 2053 | 1507 |
| my5740_rel_lto.cy10a2_1g_bee | 76336 | 134000 | 2609 | 203 | 126 | 111 |
| my5740_rel_lto.cy10a3_1g_bee | 75472 | 133112 | 2274 | 198 | 129 | 112 |
This table has relative throughput, throughput for the DBMS relative to the DBMS in the first line, using the absolute throughput from the previous table. Values less than 0.95 have a yellow background. Values greater than 1.05 have a blue background.
| dbms | l.i0 | l.x | l.i1 | q100.1 | q500.1 | q1000.1 |
|---|---|---|---|---|---|---|
| my5740_rel_lto.cy10a_1g_bee | 1.00 | 1.00 | 1.00 | 1.00 | 1.00 | 1.00 |
| my5740_rel_lto.cy10a1_1g_bee | 0.98 | 1.00 | 0.99 | 1.08 | 0.99 | 0.97 |
| my5740_rel_lto.cy10a2_1g_bee | 1.00 | 1.01 | 0.88 | 0.23 | 0.06 | 0.07 |
| my5740_rel_lto.cy10a3_1g_bee | 0.99 | 1.00 | 0.77 | 0.23 | 0.06 | 0.07 |
This lists the average rate of inserts/s for the tests that do inserts concurrent with queries. For such tests the query rate is listed in the table above. The read+write tests are setup so that the insert rate should match the target rate every second. Cells that are not at least 95% of the target have a red background to indicate a failure to satisfy the target.
| dbms | q100.1 | q500.1 | q1000.1 |
|---|---|---|---|
| my5740_rel_lto.cy10a_1g_bee | 99 | 499 | 999 |
| my5740_rel_lto.cy10a1_1g_bee | 99 | 499 | 998 |
| my5740_rel_lto.cy10a2_1g_bee | 98 | 465 | 856 |
| my5740_rel_lto.cy10a3_1g_bee | 98 | 474 | 871 |
| target | 100 | 500 | 1000 |
l.i0
l.i0: load without secondary indexes. Graphs for performance per 1-second interval are here.
Average throughput:
Insert response time histogram: each cell has the percentage of responses that take <= the time in the header and max is the max response time in seconds. For the max column values in the top 25% of the range have a red background and in the bottom 25% of the range have a green background. The red background is not used when the min value is within 80% of the max value.
| dbms | 256us | 1ms | 4ms | 16ms | 64ms | 256ms | 1s | 4s | 16s | gt | max |
|---|---|---|---|---|---|---|---|---|---|---|---|
| my5740_rel_lto.cy10a_1g_bee | 3.331 | 94.900 | 1.619 | 0.148 | 0.001 | 0.081 | |||||
| my5740_rel_lto.cy10a1_1g_bee | 3.260 | 94.976 | 1.602 | 0.160 | 0.003 | 0.081 | |||||
| my5740_rel_lto.cy10a2_1g_bee | 3.162 | 95.081 | 1.603 | 0.153 | 0.001 | 0.077 | |||||
| my5740_rel_lto.cy10a3_1g_bee | 3.735 | 94.468 | 1.638 | 0.157 | 0.003 | 0.078 |
Performance metrics for the DBMS listed above. Some are normalized by throughput, others are not. Legend for results is here.
ips	qps	rps	rmbps	wps	wmbps	rpq	rkbpq	wpi	wkbpi	csps	cpups	cspq	cpupq	dbgb1	dbgb2	rss	maxop	p50	p99	tag
76046	0	0	0.0	104.9	21.5	0.000	0.000	0.001	0.290	7801	20.1	0.103	21	1.3	41.8	1.1	0.081	75912	58023	20m.my5740_rel_lto.cy10a_1g_bee
74349	0	0	0.0	102.3	21.2	0.000	0.000	0.001	0.292	7536	20.0	0.101	22	1.3	41.8	1.1	0.081	74948	44849	20m.my5740_rel_lto.cy10a1_1g_bee
76336	0	0	0.0	104.7	21.6	0.000	0.000	0.001	0.290	7817	20.1	0.102	21	1.3	41.8	1.1	0.077	76608	49446	20m.my5740_rel_lto.cy10a2_1g_bee
75472	0	0	0.0	105.2	21.5	0.000	0.000	0.001	0.291	7789	19.8	0.103	21	1.3	41.8	1.1	0.078	75924	47066	20m.my5740_rel_lto.cy10a3_1g_bee
l.x
l.x: create secondary indexes.
Average throughput:
Performance metrics for the DBMS listed above. Some are normalized by throughput, others are not. Legend for results is here.
ips	qps	rps	rmbps	wps	wmbps	rpq	rkbpq	wpi	wkbpi	csps	cpups	cspq	cpupq	dbgb1	dbgb2	rss	maxop	p50	p99	tag
133112	0	0	0.0	331.1	118.6	0.000	0.000	0.002	0.913	5512	11.4	0.041	7	3.0	43.5	1.3	0.013	NA	NA	20m.my5740_rel_lto.cy10a_1g_bee
133112	0	0	0.0	325.2	118.3	0.000	0.000	0.002	0.910	8410	11.8	0.063	7	3.0	43.5	1.3	0.019	NA	NA	20m.my5740_rel_lto.cy10a1_1g_bee
134000	0	0	0.0	317.5	119.7	0.000	0.000	0.002	0.914	5486	11.6	0.041	7	3.0	43.5	1.3	0.015	NA	NA	20m.my5740_rel_lto.cy10a2_1g_bee
133112	0	0	0.0	318.9	118.6	0.000	0.000	0.002	0.912	5504	11.3	0.041	7	3.0	43.5	1.3	0.018	NA	NA	20m.my5740_rel_lto.cy10a3_1g_bee
l.i1
l.i1: continue load after secondary indexes created. Graphs for performance per 1-second interval are here.
Average throughput:
Insert response time histogram: each cell has the percentage of responses that take <= the time in the header and max is the max response time in seconds. For the max column values in the top 25% of the range have a red background and in the bottom 25% of the range have a green background. The red background is not used when the min value is within 80% of the max value.
| dbms | 256us | 1ms | 4ms | 16ms | 64ms | 256ms | 1s | 4s | 16s | gt | max |
|---|---|---|---|---|---|---|---|---|---|---|---|
| my5740_rel_lto.cy10a_1g_bee | 5.871 | 62.870 | 28.940 | 2.100 | 0.217 | 0.002 | 1.382 | ||||
| my5740_rel_lto.cy10a1_1g_bee | 6.005 | 61.380 | 30.118 | 2.312 | 0.186 | 0.986 | |||||
| my5740_rel_lto.cy10a2_1g_bee | 3.975 | 61.759 | 30.301 | 3.696 | 0.264 | 0.006 | 1.466 | ||||
| my5740_rel_lto.cy10a3_1g_bee | 2.551 | 58.014 | 33.485 | 5.617 | 0.320 | 0.014 | 1.352 |
Delete response time histogram: each cell has the percentage of responses that take <= the time in the header and max is the max response time in seconds. For the max column values in the top 25% of the range have a red background and in the bottom 25% of the range have a green background. The red background is not used when the min value is within 80% of the max value.
| dbms | 256us | 1ms | 4ms | 16ms | 64ms | 256ms | 1s | 4s | 16s | gt | max |
|---|---|---|---|---|---|---|---|---|---|---|---|
| my5740_rel_lto.cy10a_1g_bee | 11.511 | 62.262 | 25.017 | 1.209 | 0.001 | 0.310 | |||||
| my5740_rel_lto.cy10a1_1g_bee | 11.562 | 60.928 | 25.988 | 1.520 | 0.002 | 0.711 | |||||
| my5740_rel_lto.cy10a2_1g_bee | 9.613 | 60.969 | 26.771 | 2.623 | 0.023 | 0.001 | 1.025 | ||||
| my5740_rel_lto.cy10a3_1g_bee | 9.231 | 56.494 | 29.910 | 4.325 | 0.037 | 0.003 | 1.392 |
Performance metrics for the DBMS listed above. Some are normalized by throughput, others are not. Legend for results is here.
ips	qps	rps	rmbps	wps	wmbps	rpq	rkbpq	wpi	wkbpi	csps	cpups	cspq	cpupq	dbgb1	dbgb2	rss	maxop	p50	p99	tag
2954	0	3	0.2	4669.8	149.3	0.001	0.058	1.581	51.760	13149	18.8	4.451	509	4.7	45.4	1.3	1.382	2997	300	20m.my5740_rel_lto.cy10a_1g_bee
2932	0	3	0.2	4530.4	145.4	0.001	0.057	1.545	50.767	12837	19.2	4.377	524	4.7	45.4	1.3	0.986	2946	300	20m.my5740_rel_lto.cy10a1_1g_bee
2609	0	3	0.1	4265.2	136.1	0.001	0.057	1.635	53.432	12062	16.4	4.623	503	4.7	45.4	1.3	1.466	2747	100	20m.my5740_rel_lto.cy10a2_1g_bee
2274	0	2	0.1	3697.4	117.6	0.001	0.057	1.626	52.974	10580	14.2	4.652	500	4.8	45.4	1.3	1.352	2348	100	20m.my5740_rel_lto.cy10a3_1g_bee
q100.1
q100.1: range queries with 100 insert/s per client. Graphs for performance per 1-second interval are here.
Average throughput:
Query response time histogram: each cell has the percentage of responses that take <= the time in the header and max is the max response time in seconds. For max values in the top 25% of the range have a red background and in the bottom 25% of the range have a green background. The red background is not used when the min value is within 80% of the max value.
| dbms | 256us | 1ms | 4ms | 16ms | 64ms | 256ms | 1s | 4s | 16s | gt | max |
|---|---|---|---|---|---|---|---|---|---|---|---|
| my5740_rel_lto.cy10a_1g_bee | 21.504 | 75.497 | 0.151 | 1.572 | 0.968 | 0.306 | 0.003 | 0.388 | |||
| my5740_rel_lto.cy10a1_1g_bee | 21.558 | 75.174 | 0.558 | 1.628 | 0.814 | 0.265 | 0.003 | 0.463 | |||
| my5740_rel_lto.cy10a2_1g_bee | 5.950 | 84.056 | 0.280 | 3.387 | 4.321 | 1.935 | 0.071 | nonzero | 1.273 | ||
| my5740_rel_lto.cy10a3_1g_bee | 5.414 | 84.375 | 0.312 | 3.429 | 4.402 | 1.991 | 0.075 | 0.849 |
Insert response time histogram: each cell has the percentage of responses that take <= the time in the header and max is the max response time in seconds. For max values in the top 25% of the range have a red background and in the bottom 25% of the range have a green background. The red background is not used when the min value is within 80% of the max value.
| dbms | 256us | 1ms | 4ms | 16ms | 64ms | 256ms | 1s | 4s | 16s | gt | max |
|---|---|---|---|---|---|---|---|---|---|---|---|
| my5740_rel_lto.cy10a_1g_bee | 13.958 | 31.417 | 19.903 | 24.931 | 9.694 | 0.097 | 1.316 | ||||
| my5740_rel_lto.cy10a1_1g_bee | 12.056 | 37.361 | 20.264 | 22.972 | 7.278 | 0.069 | 1.430 | ||||
| my5740_rel_lto.cy10a2_1g_bee | 18.153 | 16.236 | 26.389 | 31.167 | 7.931 | 0.125 | 1.412 | ||||
| my5740_rel_lto.cy10a3_1g_bee | 20.069 | 16.236 | 26.611 | 30.931 | 6.125 | 0.028 | 1.216 |
Delete response time histogram: each cell has the percentage of responses that take <= the time in the header and max is the max response time in seconds. For max values in the top 25% of the range have a red background and in the bottom 25% of the range have a green background. The red background is not used when the min value is within 80% of the max value.
| dbms | 256us | 1ms | 4ms | 16ms | 64ms | 256ms | 1s | 4s | 16s | gt | max |
|---|---|---|---|---|---|---|---|---|---|---|---|
| my5740_rel_lto.cy10a_1g_bee | 43.958 | 20.347 | 25.903 | 9.694 | 0.097 | 0.550 | |||||
| my5740_rel_lto.cy10a1_1g_bee | 42.333 | 23.833 | 24.556 | 9.167 | 0.111 | 0.389 | |||||
| my5740_rel_lto.cy10a2_1g_bee | 38.625 | 20.736 | 28.181 | 12.153 | 0.306 | 0.479 | |||||
| my5740_rel_lto.cy10a3_1g_bee | 38.417 | 20.000 | 27.944 | 13.167 | 0.472 | 0.488 |
Performance metrics for the DBMS listed above. Some are normalized by throughput, others are not. Legend for results is here.
ips	qps	rps	rmbps	wps	wmbps	rpq	rkbpq	wpi	wkbpi	csps	cpups	cspq	cpupq	dbgb1	dbgb2	rss	maxop	p50	p99	tag
99	877	1	0.0	2885.8	82.3	0.001	0.022	29.150	850.843	11871	8.5	13.538	775	4.7	45.4	1.3	0.388	367	32	20m.my5740_rel_lto.cy10a_1g_bee
99	944	1	0.0	2989.9	85.8	0.001	0.018	30.171	886.827	11995	9.5	12.701	805	4.7	45.4	1.3	0.463	400	32	20m.my5740_rel_lto.cy10a1_1g_bee
98	203	1	0.0	2541.6	71.9	0.005	0.099	25.856	748.931	8381	5.3	41.349	2092	4.7	45.4	1.3	1.273	224	16	20m.my5740_rel_lto.cy10a2_1g_bee
98	198	0	0.0	2522.3	71.3	0.002	0.054	25.633	741.936	8258	5.2	41.727	2102	4.8	45.4	1.3	0.849	224	16	20m.my5740_rel_lto.cy10a3_1g_bee
q500.1
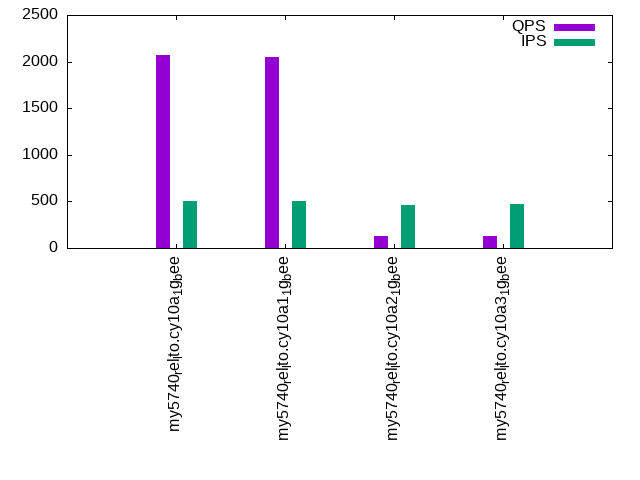
q500.1: range queries with 500 insert/s per client. Graphs for performance per 1-second interval are here.
Average throughput:
Query response time histogram: each cell has the percentage of responses that take <= the time in the header and max is the max response time in seconds. For max values in the top 25% of the range have a red background and in the bottom 25% of the range have a green background. The red background is not used when the min value is within 80% of the max value.
| dbms | 256us | 1ms | 4ms | 16ms | 64ms | 256ms | 1s | 4s | 16s | gt | max |
|---|---|---|---|---|---|---|---|---|---|---|---|
| my5740_rel_lto.cy10a_1g_bee | 22.930 | 75.466 | 0.051 | 1.479 | 0.068 | 0.007 | 0.200 | ||||
| my5740_rel_lto.cy10a1_1g_bee | 22.898 | 75.368 | 0.182 | 1.479 | 0.066 | 0.008 | nonzero | 0.273 | |||
| my5740_rel_lto.cy10a2_1g_bee | 2.522 | 82.841 | 1.353 | 4.322 | 5.185 | 3.552 | 0.225 | 0.804 | |||
| my5740_rel_lto.cy10a3_1g_bee | 2.548 | 82.995 | 1.299 | 4.289 | 5.196 | 3.460 | 0.212 | 0.997 |
Insert response time histogram: each cell has the percentage of responses that take <= the time in the header and max is the max response time in seconds. For max values in the top 25% of the range have a red background and in the bottom 25% of the range have a green background. The red background is not used when the min value is within 80% of the max value.
| dbms | 256us | 1ms | 4ms | 16ms | 64ms | 256ms | 1s | 4s | 16s | gt | max |
|---|---|---|---|---|---|---|---|---|---|---|---|
| my5740_rel_lto.cy10a_1g_bee | 47.978 | 46.603 | 4.514 | 0.889 | 0.017 | 0.336 | |||||
| my5740_rel_lto.cy10a1_1g_bee | 45.039 | 50.200 | 3.911 | 0.839 | 0.011 | 0.292 | |||||
| my5740_rel_lto.cy10a2_1g_bee | 16.939 | 24.000 | 23.711 | 28.108 | 7.233 | 0.008 | 1.148 | ||||
| my5740_rel_lto.cy10a3_1g_bee | 19.214 | 21.644 | 24.439 | 28.425 | 6.269 | 0.008 | 1.222 |
Delete response time histogram: each cell has the percentage of responses that take <= the time in the header and max is the max response time in seconds. For max values in the top 25% of the range have a red background and in the bottom 25% of the range have a green background. The red background is not used when the min value is within 80% of the max value.
| dbms | 256us | 1ms | 4ms | 16ms | 64ms | 256ms | 1s | 4s | 16s | gt | max |
|---|---|---|---|---|---|---|---|---|---|---|---|
| my5740_rel_lto.cy10a_1g_bee | 80.275 | 16.475 | 3.153 | 0.097 | 0.115 | ||||||
| my5740_rel_lto.cy10a1_1g_bee | 83.553 | 13.300 | 3.044 | 0.103 | 0.138 | ||||||
| my5740_rel_lto.cy10a2_1g_bee | 41.428 | 11.831 | 25.778 | 19.717 | 1.247 | 0.702 | |||||
| my5740_rel_lto.cy10a3_1g_bee | 41.247 | 11.794 | 25.633 | 20.103 | 1.222 | 0.868 |
Performance metrics for the DBMS listed above. Some are normalized by throughput, others are not. Legend for results is here.
ips	qps	rps	rmbps	wps	wmbps	rpq	rkbpq	wpi	wkbpi	csps	cpups	cspq	cpupq	dbgb1	dbgb2	rss	maxop	p50	p99	tag
499	2066	5	0.1	2896.2	86.7	0.003	0.043	5.803	177.975	15494	13.5	7.499	523	4.7	45.4	1.3	0.200	2157	863	20m.my5740_rel_lto.cy10a_1g_bee
499	2053	5	0.1	2886.9	86.6	0.003	0.044	5.785	177.618	15584	14.1	7.590	549	4.7	45.4	1.3	0.273	2126	847	20m.my5740_rel_lto.cy10a1_1g_bee
465	126	8	0.1	2130.2	61.4	0.062	1.014	4.579	135.164	7381	5.5	58.533	3489	4.7	45.4	1.3	0.804	96	0	20m.my5740_rel_lto.cy10a2_1g_bee
474	129	8	0.1	2157.0	62.3	0.060	0.984	4.548	134.609	7425	5.6	57.651	3478	4.8	45.4	1.3	0.997	112	0	20m.my5740_rel_lto.cy10a3_1g_bee
q1000.1
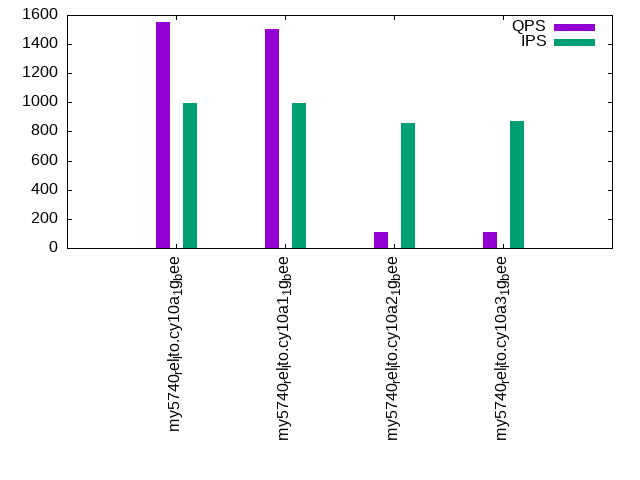
q1000.1: range queries with 1000 insert/s per client. Graphs for performance per 1-second interval are here.
Average throughput:
Query response time histogram: each cell has the percentage of responses that take <= the time in the header and max is the max response time in seconds. For max values in the top 25% of the range have a red background and in the bottom 25% of the range have a green background. The red background is not used when the min value is within 80% of the max value.
| dbms | 256us | 1ms | 4ms | 16ms | 64ms | 256ms | 1s | 4s | 16s | gt | max |
|---|---|---|---|---|---|---|---|---|---|---|---|
| my5740_rel_lto.cy10a_1g_bee | 15.736 | 81.280 | 0.207 | 2.620 | 0.138 | 0.019 | 0.226 | ||||
| my5740_rel_lto.cy10a1_1g_bee | 14.944 | 81.521 | 0.599 | 2.790 | 0.127 | 0.018 | 0.207 | ||||
| my5740_rel_lto.cy10a2_1g_bee | 1.455 | 79.320 | 4.760 | 5.004 | 4.978 | 4.224 | 0.259 | 0.823 | |||
| my5740_rel_lto.cy10a3_1g_bee | 1.532 | 79.355 | 4.785 | 4.931 | 4.973 | 4.168 | 0.257 | 0.958 |
Insert response time histogram: each cell has the percentage of responses that take <= the time in the header and max is the max response time in seconds. For max values in the top 25% of the range have a red background and in the bottom 25% of the range have a green background. The red background is not used when the min value is within 80% of the max value.
| dbms | 256us | 1ms | 4ms | 16ms | 64ms | 256ms | 1s | 4s | 16s | gt | max |
|---|---|---|---|---|---|---|---|---|---|---|---|
| my5740_rel_lto.cy10a_1g_bee | 36.514 | 55.122 | 7.300 | 1.038 | 0.026 | 0.496 | |||||
| my5740_rel_lto.cy10a1_1g_bee | 31.265 | 60.872 | 6.978 | 0.853 | 0.032 | 0.478 | |||||
| my5740_rel_lto.cy10a2_1g_bee | 23.178 | 27.239 | 24.363 | 23.328 | 1.893 | 0.893 | |||||
| my5740_rel_lto.cy10a3_1g_bee | 24.819 | 26.312 | 24.478 | 22.761 | 1.629 | 0.840 |
Delete response time histogram: each cell has the percentage of responses that take <= the time in the header and max is the max response time in seconds. For max values in the top 25% of the range have a red background and in the bottom 25% of the range have a green background. The red background is not used when the min value is within 80% of the max value.
| dbms | 256us | 1ms | 4ms | 16ms | 64ms | 256ms | 1s | 4s | 16s | gt | max |
|---|---|---|---|---|---|---|---|---|---|---|---|
| my5740_rel_lto.cy10a_1g_bee | 70.511 | 23.989 | 5.385 | 0.115 | 0.172 | ||||||
| my5740_rel_lto.cy10a1_1g_bee | 70.178 | 24.778 | 4.940 | 0.104 | 0.143 | ||||||
| my5740_rel_lto.cy10a2_1g_bee | 40.615 | 14.275 | 24.190 | 20.104 | 0.814 | 0.001 | 1.235 | ||||
| my5740_rel_lto.cy10a3_1g_bee | 40.242 | 14.507 | 24.449 | 20.028 | 0.775 | 0.894 |
Performance metrics for the DBMS listed above. Some are normalized by throughput, others are not. Legend for results is here.
ips	qps	rps	rmbps	wps	wmbps	rpq	rkbpq	wpi	wkbpi	csps	cpups	cspq	cpupq	dbgb1	dbgb2	rss	maxop	p50	p99	tag
999	1550	9	0.1	4503.3	135.8	0.006	0.089	4.510	139.250	17476	15.4	11.276	795	4.7	45.4	1.3	0.226	1598	352	20m.my5740_rel_lto.cy10a_1g_bee
998	1507	10	0.1	4485.1	135.2	0.006	0.094	4.495	138.758	17183	16.0	11.403	849	4.7	45.4	1.3	0.207	1550	511	20m.my5740_rel_lto.cy10a1_1g_bee
856	111	4	0.1	2019.1	58.5	0.040	0.638	2.360	70.009	6901	6.5	61.948	4668	4.7	45.4	1.3	0.823	48	0	20m.my5740_rel_lto.cy10a2_1g_bee
871	112	5	0.1	2021.9	58.6	0.041	0.651	2.320	68.874	6908	6.5	61.842	4655	4.8	45.4	1.3	0.958	48	0	20m.my5740_rel_lto.cy10a3_1g_bee
l.i0
l.i0: load without secondary indexes
Performance metrics for all DBMS, not just the ones listed above. Some are normalized by throughput, others are not. Legend for results is here.
ips	qps	rps	rmbps	wps	wmbps	rpq	rkbpq	wpi	wkbpi	csps	cpups	cspq	cpupq	dbgb1	dbgb2	rss	maxop	p50	p99	tag
76046	0	0	0.0	104.9	21.5	0.000	0.000	0.001	0.290	7801	20.1	0.103	21	1.3	41.8	1.1	0.081	75912	58023	20m.my5740_rel_lto.cy10a_1g_bee
74349	0	0	0.0	102.3	21.2	0.000	0.000	0.001	0.292	7536	20.0	0.101	22	1.3	41.8	1.1	0.081	74948	44849	20m.my5740_rel_lto.cy10a1_1g_bee
76336	0	0	0.0	104.7	21.6	0.000	0.000	0.001	0.290	7817	20.1	0.102	21	1.3	41.8	1.1	0.077	76608	49446	20m.my5740_rel_lto.cy10a2_1g_bee
75472	0	0	0.0	105.2	21.5	0.000	0.000	0.001	0.291	7789	19.8	0.103	21	1.3	41.8	1.1	0.078	75924	47066	20m.my5740_rel_lto.cy10a3_1g_bee
l.x
l.x: create secondary indexes
Performance metrics for all DBMS, not just the ones listed above. Some are normalized by throughput, others are not. Legend for results is here.
ips	qps	rps	rmbps	wps	wmbps	rpq	rkbpq	wpi	wkbpi	csps	cpups	cspq	cpupq	dbgb1	dbgb2	rss	maxop	p50	p99	tag
133112	0	0	0.0	331.1	118.6	0.000	0.000	0.002	0.913	5512	11.4	0.041	7	3.0	43.5	1.3	0.013	NA	NA	20m.my5740_rel_lto.cy10a_1g_bee
133112	0	0	0.0	325.2	118.3	0.000	0.000	0.002	0.910	8410	11.8	0.063	7	3.0	43.5	1.3	0.019	NA	NA	20m.my5740_rel_lto.cy10a1_1g_bee
134000	0	0	0.0	317.5	119.7	0.000	0.000	0.002	0.914	5486	11.6	0.041	7	3.0	43.5	1.3	0.015	NA	NA	20m.my5740_rel_lto.cy10a2_1g_bee
133112	0	0	0.0	318.9	118.6	0.000	0.000	0.002	0.912	5504	11.3	0.041	7	3.0	43.5	1.3	0.018	NA	NA	20m.my5740_rel_lto.cy10a3_1g_bee
l.i1
l.i1: continue load after secondary indexes created
Performance metrics for all DBMS, not just the ones listed above. Some are normalized by throughput, others are not. Legend for results is here.
ips	qps	rps	rmbps	wps	wmbps	rpq	rkbpq	wpi	wkbpi	csps	cpups	cspq	cpupq	dbgb1	dbgb2	rss	maxop	p50	p99	tag
2954	0	3	0.2	4669.8	149.3	0.001	0.058	1.581	51.760	13149	18.8	4.451	509	4.7	45.4	1.3	1.382	2997	300	20m.my5740_rel_lto.cy10a_1g_bee
2932	0	3	0.2	4530.4	145.4	0.001	0.057	1.545	50.767	12837	19.2	4.377	524	4.7	45.4	1.3	0.986	2946	300	20m.my5740_rel_lto.cy10a1_1g_bee
2609	0	3	0.1	4265.2	136.1	0.001	0.057	1.635	53.432	12062	16.4	4.623	503	4.7	45.4	1.3	1.466	2747	100	20m.my5740_rel_lto.cy10a2_1g_bee
2274	0	2	0.1	3697.4	117.6	0.001	0.057	1.626	52.974	10580	14.2	4.652	500	4.8	45.4	1.3	1.352	2348	100	20m.my5740_rel_lto.cy10a3_1g_bee
q100.1
q100.1: range queries with 100 insert/s per client
Performance metrics for all DBMS, not just the ones listed above. Some are normalized by throughput, others are not. Legend for results is here.
ips	qps	rps	rmbps	wps	wmbps	rpq	rkbpq	wpi	wkbpi	csps	cpups	cspq	cpupq	dbgb1	dbgb2	rss	maxop	p50	p99	tag
99	877	1	0.0	2885.8	82.3	0.001	0.022	29.150	850.843	11871	8.5	13.538	775	4.7	45.4	1.3	0.388	367	32	20m.my5740_rel_lto.cy10a_1g_bee
99	944	1	0.0	2989.9	85.8	0.001	0.018	30.171	886.827	11995	9.5	12.701	805	4.7	45.4	1.3	0.463	400	32	20m.my5740_rel_lto.cy10a1_1g_bee
98	203	1	0.0	2541.6	71.9	0.005	0.099	25.856	748.931	8381	5.3	41.349	2092	4.7	45.4	1.3	1.273	224	16	20m.my5740_rel_lto.cy10a2_1g_bee
98	198	0	0.0	2522.3	71.3	0.002	0.054	25.633	741.936	8258	5.2	41.727	2102	4.8	45.4	1.3	0.849	224	16	20m.my5740_rel_lto.cy10a3_1g_bee
q500.1
q500.1: range queries with 500 insert/s per client
Performance metrics for all DBMS, not just the ones listed above. Some are normalized by throughput, others are not. Legend for results is here.
ips	qps	rps	rmbps	wps	wmbps	rpq	rkbpq	wpi	wkbpi	csps	cpups	cspq	cpupq	dbgb1	dbgb2	rss	maxop	p50	p99	tag
499	2066	5	0.1	2896.2	86.7	0.003	0.043	5.803	177.975	15494	13.5	7.499	523	4.7	45.4	1.3	0.200	2157	863	20m.my5740_rel_lto.cy10a_1g_bee
499	2053	5	0.1	2886.9	86.6	0.003	0.044	5.785	177.618	15584	14.1	7.590	549	4.7	45.4	1.3	0.273	2126	847	20m.my5740_rel_lto.cy10a1_1g_bee
465	126	8	0.1	2130.2	61.4	0.062	1.014	4.579	135.164	7381	5.5	58.533	3489	4.7	45.4	1.3	0.804	96	0	20m.my5740_rel_lto.cy10a2_1g_bee
474	129	8	0.1	2157.0	62.3	0.060	0.984	4.548	134.609	7425	5.6	57.651	3478	4.8	45.4	1.3	0.997	112	0	20m.my5740_rel_lto.cy10a3_1g_bee
q1000.1
q1000.1: range queries with 1000 insert/s per client
Performance metrics for all DBMS, not just the ones listed above. Some are normalized by throughput, others are not. Legend for results is here.
ips	qps	rps	rmbps	wps	wmbps	rpq	rkbpq	wpi	wkbpi	csps	cpups	cspq	cpupq	dbgb1	dbgb2	rss	maxop	p50	p99	tag
999	1550	9	0.1	4503.3	135.8	0.006	0.089	4.510	139.250	17476	15.4	11.276	795	4.7	45.4	1.3	0.226	1598	352	20m.my5740_rel_lto.cy10a_1g_bee
998	1507	10	0.1	4485.1	135.2	0.006	0.094	4.495	138.758	17183	16.0	11.403	849	4.7	45.4	1.3	0.207	1550	511	20m.my5740_rel_lto.cy10a1_1g_bee
856	111	4	0.1	2019.1	58.5	0.040	0.638	2.360	70.009	6901	6.5	61.948	4668	4.7	45.4	1.3	0.823	48	0	20m.my5740_rel_lto.cy10a2_1g_bee
871	112	5	0.1	2021.9	58.6	0.041	0.651	2.320	68.874	6908	6.5	61.842	4655	4.8	45.4	1.3	0.958	48	0	20m.my5740_rel_lto.cy10a3_1g_bee
l.i0
- l.i0: load without secondary indexes
- Legend for results is here.
- Each entry lists the percentage of responses that fit in that bucket (slower than max time for previous bucket, faster than min time for next bucket).
Insert response time histogram
256us	1ms	4ms	16ms	64ms	256ms	1s	4s	16s	gt	max	tag
0.000	3.331	94.900	1.619	0.148	0.001	0.000	0.000	0.000	0.000	0.081	my5740_rel_lto.cy10a_1g_bee
0.000	3.260	94.976	1.602	0.160	0.003	0.000	0.000	0.000	0.000	0.081	my5740_rel_lto.cy10a1_1g_bee
0.000	3.162	95.081	1.603	0.153	0.001	0.000	0.000	0.000	0.000	0.077	my5740_rel_lto.cy10a2_1g_bee
0.000	3.735	94.468	1.638	0.157	0.003	0.000	0.000	0.000	0.000	0.078	my5740_rel_lto.cy10a3_1g_bee
l.x
- l.x: create secondary indexes
- Legend for results is here.
- Each entry lists the percentage of responses that fit in that bucket (slower than max time for previous bucket, faster than min time for next bucket).
TODO - determine whether there is data for create index response time
l.i1
- l.i1: continue load after secondary indexes created
- Legend for results is here.
- Each entry lists the percentage of responses that fit in that bucket (slower than max time for previous bucket, faster than min time for next bucket).
Insert response time histogram
256us	1ms	4ms	16ms	64ms	256ms	1s	4s	16s	gt	max	tag
0.000	0.000	5.871	62.870	28.940	2.100	0.217	0.002	0.000	0.000	1.382	my5740_rel_lto.cy10a_1g_bee
0.000	0.000	6.005	61.380	30.118	2.312	0.186	0.000	0.000	0.000	0.986	my5740_rel_lto.cy10a1_1g_bee
0.000	0.000	3.975	61.759	30.301	3.696	0.264	0.006	0.000	0.000	1.466	my5740_rel_lto.cy10a2_1g_bee
0.000	0.000	2.551	58.014	33.485	5.617	0.320	0.014	0.000	0.000	1.352	my5740_rel_lto.cy10a3_1g_bee
Delete response time histogram
256us	1ms	4ms	16ms	64ms	256ms	1s	4s	16s	gt	max	tag
0.000	0.000	11.511	62.262	25.017	1.209	0.001	0.000	0.000	0.000	0.310	my5740_rel_lto.cy10a_1g_bee
0.000	0.000	11.562	60.928	25.988	1.520	0.002	0.000	0.000	0.000	0.711	my5740_rel_lto.cy10a1_1g_bee
0.000	0.000	9.613	60.969	26.771	2.623	0.023	0.001	0.000	0.000	1.025	my5740_rel_lto.cy10a2_1g_bee
0.000	0.000	9.231	56.494	29.910	4.325	0.037	0.003	0.000	0.000	1.392	my5740_rel_lto.cy10a3_1g_bee
q100.1
- q100.1: range queries with 100 insert/s per client
- Legend for results is here.
- Each entry lists the percentage of responses that fit in that bucket (slower than max time for previous bucket, faster than min time for next bucket).
Query response time histogram
256us	1ms	4ms	16ms	64ms	256ms	1s	4s	16s	gt	max	tag
21.504	75.497	0.151	1.572	0.968	0.306	0.003	0.000	0.000	0.000	0.388	my5740_rel_lto.cy10a_1g_bee
21.558	75.174	0.558	1.628	0.814	0.265	0.003	0.000	0.000	0.000	0.463	my5740_rel_lto.cy10a1_1g_bee
5.950	84.056	0.280	3.387	4.321	1.935	0.071	nonzero	0.000	0.000	1.273	my5740_rel_lto.cy10a2_1g_bee
5.414	84.375	0.312	3.429	4.402	1.991	0.075	0.000	0.000	0.000	0.849	my5740_rel_lto.cy10a3_1g_bee
Insert response time histogram
256us	1ms	4ms	16ms	64ms	256ms	1s	4s	16s	gt	max	tag
0.000	0.000	13.958	31.417	19.903	24.931	9.694	0.097	0.000	0.000	1.316	my5740_rel_lto.cy10a_1g_bee
0.000	0.000	12.056	37.361	20.264	22.972	7.278	0.069	0.000	0.000	1.430	my5740_rel_lto.cy10a1_1g_bee
0.000	0.000	18.153	16.236	26.389	31.167	7.931	0.125	0.000	0.000	1.412	my5740_rel_lto.cy10a2_1g_bee
0.000	0.000	20.069	16.236	26.611	30.931	6.125	0.028	0.000	0.000	1.216	my5740_rel_lto.cy10a3_1g_bee
Delete response time histogram
256us	1ms	4ms	16ms	64ms	256ms	1s	4s	16s	gt	max	tag
0.000	0.000	43.958	20.347	25.903	9.694	0.097	0.000	0.000	0.000	0.550	my5740_rel_lto.cy10a_1g_bee
0.000	0.000	42.333	23.833	24.556	9.167	0.111	0.000	0.000	0.000	0.389	my5740_rel_lto.cy10a1_1g_bee
0.000	0.000	38.625	20.736	28.181	12.153	0.306	0.000	0.000	0.000	0.479	my5740_rel_lto.cy10a2_1g_bee
0.000	0.000	38.417	20.000	27.944	13.167	0.472	0.000	0.000	0.000	0.488	my5740_rel_lto.cy10a3_1g_bee
q500.1
- q500.1: range queries with 500 insert/s per client
- Legend for results is here.
- Each entry lists the percentage of responses that fit in that bucket (slower than max time for previous bucket, faster than min time for next bucket).
Query response time histogram
256us	1ms	4ms	16ms	64ms	256ms	1s	4s	16s	gt	max	tag
22.930	75.466	0.051	1.479	0.068	0.007	0.000	0.000	0.000	0.000	0.200	my5740_rel_lto.cy10a_1g_bee
22.898	75.368	0.182	1.479	0.066	0.008	nonzero	0.000	0.000	0.000	0.273	my5740_rel_lto.cy10a1_1g_bee
2.522	82.841	1.353	4.322	5.185	3.552	0.225	0.000	0.000	0.000	0.804	my5740_rel_lto.cy10a2_1g_bee
2.548	82.995	1.299	4.289	5.196	3.460	0.212	0.000	0.000	0.000	0.997	my5740_rel_lto.cy10a3_1g_bee
Insert response time histogram
256us	1ms	4ms	16ms	64ms	256ms	1s	4s	16s	gt	max	tag
0.000	0.000	47.978	46.603	4.514	0.889	0.017	0.000	0.000	0.000	0.336	my5740_rel_lto.cy10a_1g_bee
0.000	0.000	45.039	50.200	3.911	0.839	0.011	0.000	0.000	0.000	0.292	my5740_rel_lto.cy10a1_1g_bee
0.000	0.000	16.939	24.000	23.711	28.108	7.233	0.008	0.000	0.000	1.148	my5740_rel_lto.cy10a2_1g_bee
0.000	0.000	19.214	21.644	24.439	28.425	6.269	0.008	0.000	0.000	1.222	my5740_rel_lto.cy10a3_1g_bee
Delete response time histogram
256us	1ms	4ms	16ms	64ms	256ms	1s	4s	16s	gt	max	tag
0.000	0.000	80.275	16.475	3.153	0.097	0.000	0.000	0.000	0.000	0.115	my5740_rel_lto.cy10a_1g_bee
0.000	0.000	83.553	13.300	3.044	0.103	0.000	0.000	0.000	0.000	0.138	my5740_rel_lto.cy10a1_1g_bee
0.000	0.000	41.428	11.831	25.778	19.717	1.247	0.000	0.000	0.000	0.702	my5740_rel_lto.cy10a2_1g_bee
0.000	0.000	41.247	11.794	25.633	20.103	1.222	0.000	0.000	0.000	0.868	my5740_rel_lto.cy10a3_1g_bee
q1000.1
- q1000.1: range queries with 1000 insert/s per client
- Legend for results is here.
- Each entry lists the percentage of responses that fit in that bucket (slower than max time for previous bucket, faster than min time for next bucket).
Query response time histogram
256us	1ms	4ms	16ms	64ms	256ms	1s	4s	16s	gt	max	tag
15.736	81.280	0.207	2.620	0.138	0.019	0.000	0.000	0.000	0.000	0.226	my5740_rel_lto.cy10a_1g_bee
14.944	81.521	0.599	2.790	0.127	0.018	0.000	0.000	0.000	0.000	0.207	my5740_rel_lto.cy10a1_1g_bee
1.455	79.320	4.760	5.004	4.978	4.224	0.259	0.000	0.000	0.000	0.823	my5740_rel_lto.cy10a2_1g_bee
1.532	79.355	4.785	4.931	4.973	4.168	0.257	0.000	0.000	0.000	0.958	my5740_rel_lto.cy10a3_1g_bee
Insert response time histogram
256us	1ms	4ms	16ms	64ms	256ms	1s	4s	16s	gt	max	tag
0.000	0.000	36.514	55.122	7.300	1.038	0.026	0.000	0.000	0.000	0.496	my5740_rel_lto.cy10a_1g_bee
0.000	0.000	31.265	60.872	6.978	0.853	0.032	0.000	0.000	0.000	0.478	my5740_rel_lto.cy10a1_1g_bee
0.000	0.000	23.178	27.239	24.363	23.328	1.893	0.000	0.000	0.000	0.893	my5740_rel_lto.cy10a2_1g_bee
0.000	0.000	24.819	26.312	24.478	22.761	1.629	0.000	0.000	0.000	0.840	my5740_rel_lto.cy10a3_1g_bee
Delete response time histogram
256us	1ms	4ms	16ms	64ms	256ms	1s	4s	16s	gt	max	tag
0.000	0.000	70.511	23.989	5.385	0.115	0.000	0.000	0.000	0.000	0.172	my5740_rel_lto.cy10a_1g_bee
0.000	0.000	70.178	24.778	4.940	0.104	0.000	0.000	0.000	0.000	0.143	my5740_rel_lto.cy10a1_1g_bee
0.000	0.000	40.615	14.275	24.190	20.104	0.814	0.001	0.000	0.000	1.235	my5740_rel_lto.cy10a2_1g_bee
0.000	0.000	40.242	14.507	24.449	20.028	0.775	0.000	0.000	0.000	0.894	my5740_rel_lto.cy10a3_1g_bee