Introduction
This is a report for the insert benchmark with 20M docs and 1 client(s). It is generated by scripts (bash, awk, sed) and Tufte might not be impressed. An overview of the insert benchmark is here and a short update is here. Below, by DBMS, I mean DBMS+version.config. An example is my8020.c10b40 where my means MySQL, 8020 is version 8.0.20 and c10b40 is the name for the configuration file.
The test server has 8 AMD cores, 16G RAM and an NVMe SSD. It is described here as the Beelink. The benchmark was run with 1 client and there were 1 or 3 connections per client (1 for queries or inserts without rate limits, 1+1 for rate limited inserts+deletes). There is 1 table. It loads 20M rows without secondary indexes, creates secondary indexes, then inserts 50M rows with a delete per insert to avoid growing the table. It then does 3 read+write tests for 3600s each that do queries as fast as possible with 100, 500 and then 1000 inserts/second/client concurrent with the queries and 1000 deletes/second to avoid growing the table. The database is cached by the OS but not by InnoDB.
The tested DBMS are:
- my5651_rel.cy10a_1g_bee - InnoDB and MySQL 5.6.51, rel build, cy10a_1g_bee config, compiled with CMAKE_BUILD_TYPE=Release, base config
my5651_rel.cy10a2_1g_bee - InnoDB and MySQL 5.6.51, rel build, cy10a2_1g_bee config, compiled with CMAKE_BUILD_TYPE=Release, adds innodb_io_capacity=20k, innodb_io_capacity_max=40k
Contents
- Summary
- l.i0: load without secondary indexes
- l.x: create secondary indexes
- l.i1: continue load after secondary indexes created
- q100.1: range queries with 100 insert/s per client
- q500.1: range queries with 500 insert/s per client
- q1000.1: range queries with 1000 insert/s per client
Summary
The numbers are inserts/s for l.i0 and l.i1, indexed docs (or rows) /s for l.x and queries/s for q100, q500, q1000. The values are the average rate over the entire test for inserts (IPS) and queries (QPS). The range of values for IPS and QPS is split into 3 parts: bottom 25%, middle 50%, top 25%. Values in the bottom 25% have a red background, values in the top 25% have a green background and values in the middle have no color. A gray background is used for values that can be ignored because the DBMS did not sustain the target insert rate. Red backgrounds are not used when the minimum value is within 80% of the max value.
| dbms | l.i0 | l.x | l.i1 | q100.1 | q500.1 | q1000.1 |
|---|---|---|---|---|---|---|
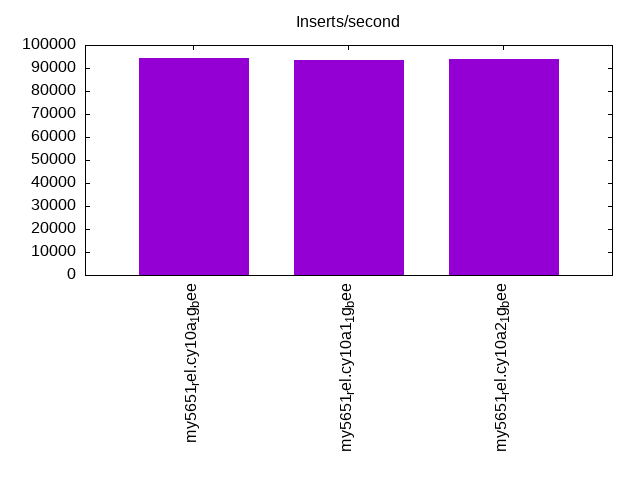
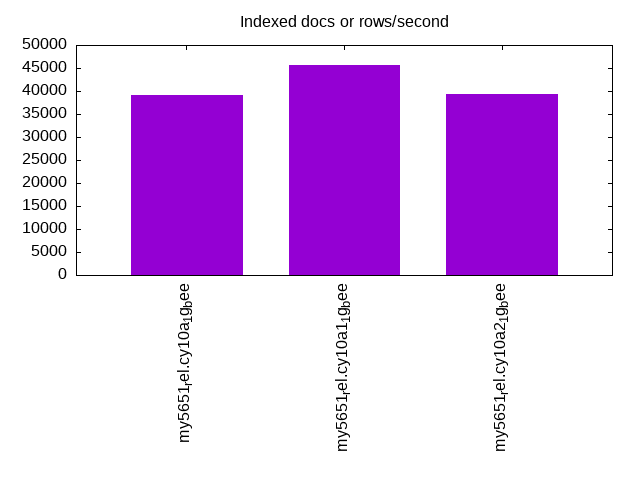
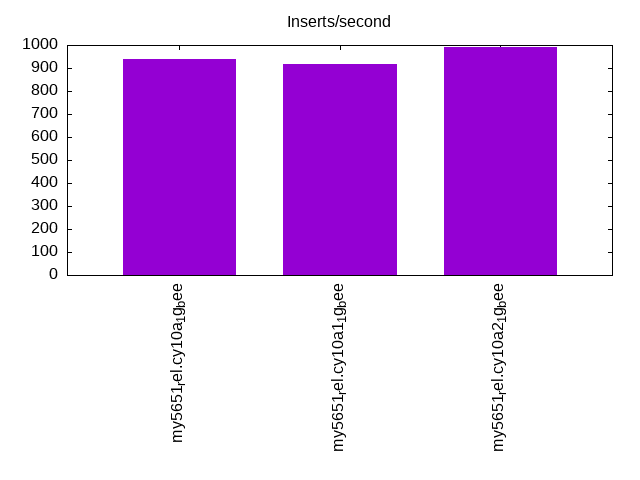
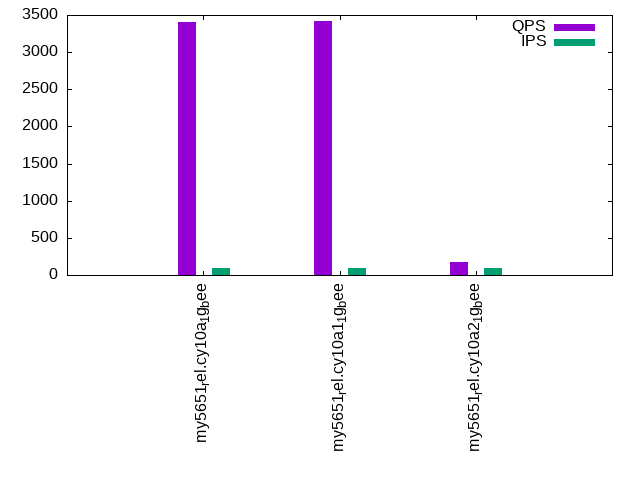
| my5651_rel.cy10a_1g_bee | 94340 | 39105 | 940 | 3400 | 2596 | 1778 |
| my5651_rel.cy10a1_1g_bee | 93458 | 45578 | 919 | 3416 | 2558 | 1705 |
| my5651_rel.cy10a2_1g_bee | 93897 | 39335 | 990 | 180 | 125 | 113 |
This table has relative throughput, throughput for the DBMS relative to the DBMS in the first line, using the absolute throughput from the previous table. Values less than 0.95 have a yellow background. Values greater than 1.05 have a blue background.
| dbms | l.i0 | l.x | l.i1 | q100.1 | q500.1 | q1000.1 |
|---|---|---|---|---|---|---|
| my5651_rel.cy10a_1g_bee | 1.00 | 1.00 | 1.00 | 1.00 | 1.00 | 1.00 |
| my5651_rel.cy10a1_1g_bee | 0.99 | 1.17 | 0.98 | 1.00 | 0.99 | 0.96 |
| my5651_rel.cy10a2_1g_bee | 1.00 | 1.01 | 1.05 | 0.05 | 0.05 | 0.06 |
This lists the average rate of inserts/s for the tests that do inserts concurrent with queries. For such tests the query rate is listed in the table above. The read+write tests are setup so that the insert rate should match the target rate every second. Cells that are not at least 95% of the target have a red background to indicate a failure to satisfy the target.
| dbms | q100.1 | q500.1 | q1000.1 |
|---|---|---|---|
| my5651_rel.cy10a_1g_bee | 100 | 499 | 998 |
| my5651_rel.cy10a1_1g_bee | 100 | 499 | 999 |
| my5651_rel.cy10a2_1g_bee | 98 | 421 | 642 |
| target | 100 | 500 | 1000 |
l.i0
l.i0: load without secondary indexes. Graphs for performance per 1-second interval are here.
Average throughput:
Insert response time histogram: each cell has the percentage of responses that take <= the time in the header and max is the max response time in seconds. For the max column values in the top 25% of the range have a red background and in the bottom 25% of the range have a green background. The red background is not used when the min value is within 80% of the max value.
| dbms | 256us | 1ms | 4ms | 16ms | 64ms | 256ms | 1s | 4s | 16s | gt | max |
|---|---|---|---|---|---|---|---|---|---|---|---|
| my5651_rel.cy10a_1g_bee | 86.671 | 12.687 | 0.615 | 0.024 | 0.003 | 0.099 | |||||
| my5651_rel.cy10a1_1g_bee | 87.955 | 11.393 | 0.630 | 0.018 | 0.004 | 0.110 | |||||
| my5651_rel.cy10a2_1g_bee | 85.492 | 13.839 | 0.654 | 0.012 | 0.003 | 0.108 |
Performance metrics for the DBMS listed above. Some are normalized by throughput, others are not. Legend for results is here.
ips	qps	rps	rmbps	wps	wmbps	rpq	rkbpq	wpi	wkbpi	csps	cpups	cspq	cpupq	dbgb1	dbgb2	rss	maxop	p50	p99	tag
94340	0	826	3.2	72.5	26.3	0.009	0.035	0.001	0.286	10798	20.8	0.114	18	1.3	41.8	1.0	0.099	97886	58534	20m.my5651_rel.cy10a_1g_bee
93458	0	826	3.2	73.5	26.8	0.009	0.035	0.001	0.294	10605	20.9	0.113	18	1.3	41.8	1.0	0.110	97815	48346	20m.my5651_rel.cy10a1_1g_bee
93897	0	823	3.2	75.7	27.0	0.009	0.035	0.001	0.295	10814	20.7	0.115	18	1.3	41.8	1.0	0.108	96993	42053	20m.my5651_rel.cy10a2_1g_bee
l.x
l.x: create secondary indexes.
Average throughput:
Performance metrics for the DBMS listed above. Some are normalized by throughput, others are not. Legend for results is here.
ips	qps	rps	rmbps	wps	wmbps	rpq	rkbpq	wpi	wkbpi	csps	cpups	cspq	cpupq	dbgb1	dbgb2	rss	maxop	p50	p99	tag
39105	0	26	0.1	347.2	40.3	0.001	0.003	0.009	1.055	2135	5.2	0.055	11	2.7	43.2	1.1	0.022	NA	NA	20m.my5651_rel.cy10a_1g_bee
45578	0	23	0.1	319.1	45.9	0.000	0.002	0.007	1.030	1701	5.8	0.037	10	2.7	43.2	1.1	0.015	NA	NA	20m.my5651_rel.cy10a1_1g_bee
39335	0	26	0.1	344.1	39.6	0.001	0.003	0.009	1.031	2116	5.3	0.054	11	2.7	43.2	1.1	0.024	NA	NA	20m.my5651_rel.cy10a2_1g_bee
l.i1
l.i1: continue load after secondary indexes created. Graphs for performance per 1-second interval are here.
Average throughput:
Insert response time histogram: each cell has the percentage of responses that take <= the time in the header and max is the max response time in seconds. For the max column values in the top 25% of the range have a red background and in the bottom 25% of the range have a green background. The red background is not used when the min value is within 80% of the max value.
| dbms | 256us | 1ms | 4ms | 16ms | 64ms | 256ms | 1s | 4s | 16s | gt | max |
|---|---|---|---|---|---|---|---|---|---|---|---|
| my5651_rel.cy10a_1g_bee | 2.024 | 43.311 | 37.486 | 11.652 | 5.507 | 0.021 | 1.779 | ||||
| my5651_rel.cy10a1_1g_bee | 1.477 | 41.181 | 39.977 | 11.824 | 5.502 | 0.039 | 1.714 | ||||
| my5651_rel.cy10a2_1g_bee | 6.562 | 36.159 | 39.717 | 13.104 | 4.417 | 0.040 | 1.894 |
Delete response time histogram: each cell has the percentage of responses that take <= the time in the header and max is the max response time in seconds. For the max column values in the top 25% of the range have a red background and in the bottom 25% of the range have a green background. The red background is not used when the min value is within 80% of the max value.
| dbms | 256us | 1ms | 4ms | 16ms | 64ms | 256ms | 1s | 4s | 16s | gt | max |
|---|---|---|---|---|---|---|---|---|---|---|---|
| my5651_rel.cy10a_1g_bee | 26.877 | 36.300 | 28.474 | 7.909 | 0.438 | 0.003 | 1.781 | ||||
| my5651_rel.cy10a1_1g_bee | 27.574 | 35.019 | 29.094 | 7.855 | 0.458 | 0.001 | 1.146 | ||||
| my5651_rel.cy10a2_1g_bee | 21.509 | 37.220 | 30.620 | 10.133 | 0.509 | 0.008 | 1.897 |
Performance metrics for the DBMS listed above. Some are normalized by throughput, others are not. Legend for results is here.
ips	qps	rps	rmbps	wps	wmbps	rpq	rkbpq	wpi	wkbpi	csps	cpups	cspq	cpupq	dbgb1	dbgb2	rss	maxop	p50	p99	tag
940	0	34	0.2	3094.8	93.4	0.036	0.207	3.292	101.751	8165	7.1	8.684	604	3.8	44.3	1.1	1.779	450	50	20m.my5651_rel.cy10a_1g_bee
919	0	33	0.2	3064.3	92.6	0.036	0.209	3.335	103.239	3618	7.1	3.938	618	3.8	44.3	1.1	1.714	549	50	20m.my5651_rel.cy10a1_1g_bee
990	0	36	0.2	3028.9	92.1	0.037	0.210	3.061	95.296	8118	7.5	8.204	606	4.6	45.2	1.1	1.894	749	50	20m.my5651_rel.cy10a2_1g_bee
q100.1
q100.1: range queries with 100 insert/s per client. Graphs for performance per 1-second interval are here.
Average throughput:
Query response time histogram: each cell has the percentage of responses that take <= the time in the header and max is the max response time in seconds. For max values in the top 25% of the range have a red background and in the bottom 25% of the range have a green background. The red background is not used when the min value is within 80% of the max value.
| dbms | 256us | 1ms | 4ms | 16ms | 64ms | 256ms | 1s | 4s | 16s | gt | max |
|---|---|---|---|---|---|---|---|---|---|---|---|
| my5651_rel.cy10a_1g_bee | 58.201 | 41.238 | 0.200 | 0.352 | 0.007 | nonzero | 0.234 | ||||
| my5651_rel.cy10a1_1g_bee | 59.696 | 39.754 | 0.183 | 0.356 | 0.011 | nonzero | 0.215 | ||||
| my5651_rel.cy10a2_1g_bee | 7.816 | 77.452 | 4.599 | 3.983 | 3.509 | 2.545 | 0.096 | 0.752 |
Insert response time histogram: each cell has the percentage of responses that take <= the time in the header and max is the max response time in seconds. For max values in the top 25% of the range have a red background and in the bottom 25% of the range have a green background. The red background is not used when the min value is within 80% of the max value.
| dbms | 256us | 1ms | 4ms | 16ms | 64ms | 256ms | 1s | 4s | 16s | gt | max |
|---|---|---|---|---|---|---|---|---|---|---|---|
| my5651_rel.cy10a_1g_bee | 15.792 | 69.569 | 14.458 | 0.097 | 0.083 | 0.792 | |||||
| my5651_rel.cy10a1_1g_bee | 13.389 | 72.111 | 14.319 | 0.181 | 0.134 | ||||||
| my5651_rel.cy10a2_1g_bee | 5.125 | 14.958 | 23.569 | 43.250 | 13.014 | 0.083 | 1.639 |
Delete response time histogram: each cell has the percentage of responses that take <= the time in the header and max is the max response time in seconds. For max values in the top 25% of the range have a red background and in the bottom 25% of the range have a green background. The red background is not used when the min value is within 80% of the max value.
| dbms | 256us | 1ms | 4ms | 16ms | 64ms | 256ms | 1s | 4s | 16s | gt | max |
|---|---|---|---|---|---|---|---|---|---|---|---|
| my5651_rel.cy10a_1g_bee | 47.431 | 42.694 | 9.722 | 0.111 | 0.042 | 0.497 | |||||
| my5651_rel.cy10a1_1g_bee | 51.819 | 40.431 | 7.681 | 0.069 | 0.067 | ||||||
| my5651_rel.cy10a2_1g_bee | 18.083 | 17.694 | 30.861 | 31.875 | 1.486 | 0.551 |
Performance metrics for the DBMS listed above. Some are normalized by throughput, others are not. Legend for results is here.
ips	qps	rps	rmbps	wps	wmbps	rpq	rkbpq	wpi	wkbpi	csps	cpups	cspq	cpupq	dbgb1	dbgb2	rss	maxop	p50	p99	tag
100	3400	5	0.0	772.1	22.8	0.002	0.010	7.736	233.746	14912	12.4	4.385	292	3.8	44.3	1.1	0.234	3421	2703	20m.my5651_rel.cy10a_1g_bee
100	3416	5	0.0	776.0	22.9	0.001	0.009	7.776	234.680	13995	12.4	4.097	290	3.8	44.3	1.1	0.215	3438	2332	20m.my5651_rel.cy10a1_1g_bee
98	180	5	0.0	2471.0	69.0	0.027	0.167	25.163	719.533	7146	4.9	39.702	2178	4.6	45.2	1.1	0.752	96	0	20m.my5651_rel.cy10a2_1g_bee
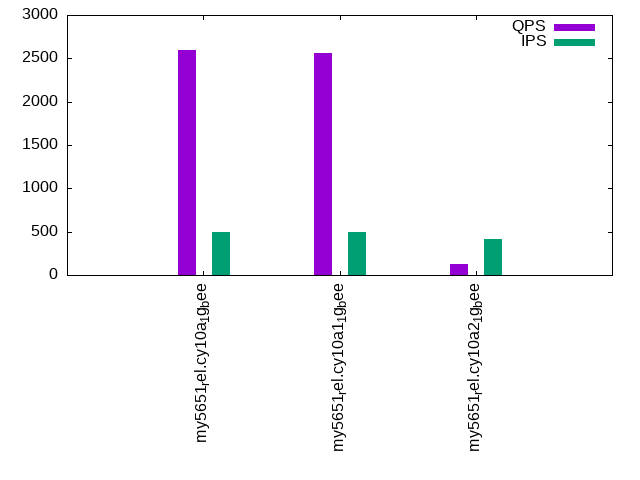
q500.1
q500.1: range queries with 500 insert/s per client. Graphs for performance per 1-second interval are here.
Average throughput:
Query response time histogram: each cell has the percentage of responses that take <= the time in the header and max is the max response time in seconds. For max values in the top 25% of the range have a red background and in the bottom 25% of the range have a green background. The red background is not used when the min value is within 80% of the max value.
| dbms | 256us | 1ms | 4ms | 16ms | 64ms | 256ms | 1s | 4s | 16s | gt | max |
|---|---|---|---|---|---|---|---|---|---|---|---|
| my5651_rel.cy10a_1g_bee | 48.694 | 49.925 | 0.097 | 1.266 | 0.018 | 0.045 | |||||
| my5651_rel.cy10a1_1g_bee | 48.941 | 49.660 | 0.097 | 1.279 | 0.024 | 0.042 | |||||
| my5651_rel.cy10a2_1g_bee | 4.267 | 76.029 | 5.676 | 4.964 | 4.975 | 3.931 | 0.157 | 0.858 |
Insert response time histogram: each cell has the percentage of responses that take <= the time in the header and max is the max response time in seconds. For max values in the top 25% of the range have a red background and in the bottom 25% of the range have a green background. The red background is not used when the min value is within 80% of the max value.
| dbms | 256us | 1ms | 4ms | 16ms | 64ms | 256ms | 1s | 4s | 16s | gt | max |
|---|---|---|---|---|---|---|---|---|---|---|---|
| my5651_rel.cy10a_1g_bee | 12.756 | 73.131 | 14.111 | 0.003 | 0.065 | ||||||
| my5651_rel.cy10a1_1g_bee | 10.758 | 73.542 | 15.669 | 0.031 | 0.106 | ||||||
| my5651_rel.cy10a2_1g_bee | 5.953 | 28.308 | 21.958 | 31.992 | 11.781 | 0.008 | 1.131 |
Delete response time histogram: each cell has the percentage of responses that take <= the time in the header and max is the max response time in seconds. For max values in the top 25% of the range have a red background and in the bottom 25% of the range have a green background. The red background is not used when the min value is within 80% of the max value.
| dbms | 256us | 1ms | 4ms | 16ms | 64ms | 256ms | 1s | 4s | 16s | gt | max |
|---|---|---|---|---|---|---|---|---|---|---|---|
| my5651_rel.cy10a_1g_bee | 54.956 | 36.006 | 9.039 | 0.053 | |||||||
| my5651_rel.cy10a1_1g_bee | 55.472 | 34.650 | 9.867 | 0.011 | 0.074 | ||||||
| my5651_rel.cy10a2_1g_bee | 35.689 | 17.003 | 25.108 | 21.453 | 0.747 | 0.607 |
Performance metrics for the DBMS listed above. Some are normalized by throughput, others are not. Legend for results is here.
ips	qps	rps	rmbps	wps	wmbps	rpq	rkbpq	wpi	wkbpi	csps	cpups	cspq	cpupq	dbgb1	dbgb2	rss	maxop	p50	p99	tag
499	2596	22	0.1	3018.6	91.0	0.008	0.055	6.052	186.891	16590	13.5	6.392	416	3.8	44.3	1.1	0.045	2605	1822	20m.my5651_rel.cy10a_1g_bee
499	2558	22	0.1	3033.3	91.4	0.009	0.057	6.082	187.752	12500	13.6	4.887	425	3.8	44.3	1.1	0.042	2573	1727	20m.my5651_rel.cy10a1_1g_bee
421	125	23	0.2	2239.1	63.3	0.188	1.529	5.315	153.777	6754	5.2	54.206	3339	4.6	45.2	1.1	0.858	48	0	20m.my5651_rel.cy10a2_1g_bee
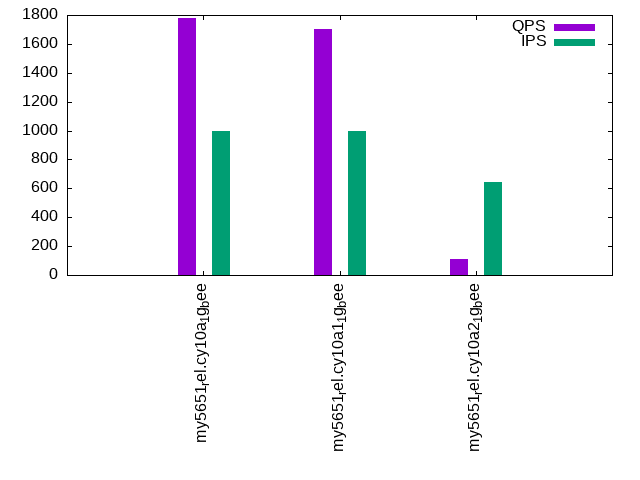
q1000.1
q1000.1: range queries with 1000 insert/s per client. Graphs for performance per 1-second interval are here.
Average throughput:
Query response time histogram: each cell has the percentage of responses that take <= the time in the header and max is the max response time in seconds. For max values in the top 25% of the range have a red background and in the bottom 25% of the range have a green background. The red background is not used when the min value is within 80% of the max value.
| dbms | 256us | 1ms | 4ms | 16ms | 64ms | 256ms | 1s | 4s | 16s | gt | max |
|---|---|---|---|---|---|---|---|---|---|---|---|
| my5651_rel.cy10a_1g_bee | 31.162 | 65.610 | 0.404 | 2.761 | 0.058 | 0.005 | 0.249 | ||||
| my5651_rel.cy10a1_1g_bee | 29.652 | 67.066 | 0.403 | 2.811 | 0.065 | 0.003 | nonzero | 0.260 | |||
| my5651_rel.cy10a2_1g_bee | 2.575 | 71.694 | 10.555 | 5.552 | 5.103 | 4.319 | 0.202 | 0.713 |
Insert response time histogram: each cell has the percentage of responses that take <= the time in the header and max is the max response time in seconds. For max values in the top 25% of the range have a red background and in the bottom 25% of the range have a green background. The red background is not used when the min value is within 80% of the max value.
| dbms | 256us | 1ms | 4ms | 16ms | 64ms | 256ms | 1s | 4s | 16s | gt | max |
|---|---|---|---|---|---|---|---|---|---|---|---|
| my5651_rel.cy10a_1g_bee | 19.529 | 66.161 | 13.858 | 0.425 | 0.026 | 0.403 | |||||
| my5651_rel.cy10a1_1g_bee | 16.742 | 67.789 | 15.114 | 0.343 | 0.013 | 0.408 | |||||
| my5651_rel.cy10a2_1g_bee | 9.946 | 30.135 | 24.386 | 30.153 | 5.381 | 0.927 |
Delete response time histogram: each cell has the percentage of responses that take <= the time in the header and max is the max response time in seconds. For max values in the top 25% of the range have a red background and in the bottom 25% of the range have a green background. The red background is not used when the min value is within 80% of the max value.
| dbms | 256us | 1ms | 4ms | 16ms | 64ms | 256ms | 1s | 4s | 16s | gt | max |
|---|---|---|---|---|---|---|---|---|---|---|---|
| my5651_rel.cy10a_1g_bee | 59.237 | 31.407 | 9.238 | 0.118 | 0.186 | ||||||
| my5651_rel.cy10a1_1g_bee | 60.882 | 29.356 | 9.667 | 0.096 | 0.148 | ||||||
| my5651_rel.cy10a2_1g_bee | 34.281 | 19.787 | 25.251 | 20.001 | 0.679 | 0.510 |
Performance metrics for the DBMS listed above. Some are normalized by throughput, others are not. Legend for results is here.
ips	qps	rps	rmbps	wps	wmbps	rpq	rkbpq	wpi	wkbpi	csps	cpups	cspq	cpupq	dbgb1	dbgb2	rss	maxop	p50	p99	tag
998	1778	45	0.3	4781.7	145.1	0.025	0.179	4.791	148.913	17033	14.4	9.579	648	3.8	44.3	1.1	0.249	1822	304	20m.my5651_rel.cy10a_1g_bee
999	1705	44	0.3	4701.3	142.9	0.026	0.186	4.708	146.485	10316	14.4	6.051	676	3.8	44.3	1.1	0.260	1742	368	20m.my5651_rel.cy10a1_1g_bee
642	113	27	0.2	2206.9	63.2	0.242	1.392	3.436	100.786	6709	5.9	59.480	4184	4.6	45.2	1.1	0.713	32	0	20m.my5651_rel.cy10a2_1g_bee
l.i0
l.i0: load without secondary indexes
Performance metrics for all DBMS, not just the ones listed above. Some are normalized by throughput, others are not. Legend for results is here.
ips	qps	rps	rmbps	wps	wmbps	rpq	rkbpq	wpi	wkbpi	csps	cpups	cspq	cpupq	dbgb1	dbgb2	rss	maxop	p50	p99	tag
94340	0	826	3.2	72.5	26.3	0.009	0.035	0.001	0.286	10798	20.8	0.114	18	1.3	41.8	1.0	0.099	97886	58534	20m.my5651_rel.cy10a_1g_bee
93458	0	826	3.2	73.5	26.8	0.009	0.035	0.001	0.294	10605	20.9	0.113	18	1.3	41.8	1.0	0.110	97815	48346	20m.my5651_rel.cy10a1_1g_bee
93897	0	823	3.2	75.7	27.0	0.009	0.035	0.001	0.295	10814	20.7	0.115	18	1.3	41.8	1.0	0.108	96993	42053	20m.my5651_rel.cy10a2_1g_bee
l.x
l.x: create secondary indexes
Performance metrics for all DBMS, not just the ones listed above. Some are normalized by throughput, others are not. Legend for results is here.
ips	qps	rps	rmbps	wps	wmbps	rpq	rkbpq	wpi	wkbpi	csps	cpups	cspq	cpupq	dbgb1	dbgb2	rss	maxop	p50	p99	tag
39105	0	26	0.1	347.2	40.3	0.001	0.003	0.009	1.055	2135	5.2	0.055	11	2.7	43.2	1.1	0.022	NA	NA	20m.my5651_rel.cy10a_1g_bee
45578	0	23	0.1	319.1	45.9	0.000	0.002	0.007	1.030	1701	5.8	0.037	10	2.7	43.2	1.1	0.015	NA	NA	20m.my5651_rel.cy10a1_1g_bee
39335	0	26	0.1	344.1	39.6	0.001	0.003	0.009	1.031	2116	5.3	0.054	11	2.7	43.2	1.1	0.024	NA	NA	20m.my5651_rel.cy10a2_1g_bee
l.i1
l.i1: continue load after secondary indexes created
Performance metrics for all DBMS, not just the ones listed above. Some are normalized by throughput, others are not. Legend for results is here.
ips	qps	rps	rmbps	wps	wmbps	rpq	rkbpq	wpi	wkbpi	csps	cpups	cspq	cpupq	dbgb1	dbgb2	rss	maxop	p50	p99	tag
940	0	34	0.2	3094.8	93.4	0.036	0.207	3.292	101.751	8165	7.1	8.684	604	3.8	44.3	1.1	1.779	450	50	20m.my5651_rel.cy10a_1g_bee
919	0	33	0.2	3064.3	92.6	0.036	0.209	3.335	103.239	3618	7.1	3.938	618	3.8	44.3	1.1	1.714	549	50	20m.my5651_rel.cy10a1_1g_bee
990	0	36	0.2	3028.9	92.1	0.037	0.210	3.061	95.296	8118	7.5	8.204	606	4.6	45.2	1.1	1.894	749	50	20m.my5651_rel.cy10a2_1g_bee
q100.1
q100.1: range queries with 100 insert/s per client
Performance metrics for all DBMS, not just the ones listed above. Some are normalized by throughput, others are not. Legend for results is here.
ips	qps	rps	rmbps	wps	wmbps	rpq	rkbpq	wpi	wkbpi	csps	cpups	cspq	cpupq	dbgb1	dbgb2	rss	maxop	p50	p99	tag
100	3400	5	0.0	772.1	22.8	0.002	0.010	7.736	233.746	14912	12.4	4.385	292	3.8	44.3	1.1	0.234	3421	2703	20m.my5651_rel.cy10a_1g_bee
100	3416	5	0.0	776.0	22.9	0.001	0.009	7.776	234.680	13995	12.4	4.097	290	3.8	44.3	1.1	0.215	3438	2332	20m.my5651_rel.cy10a1_1g_bee
98	180	5	0.0	2471.0	69.0	0.027	0.167	25.163	719.533	7146	4.9	39.702	2178	4.6	45.2	1.1	0.752	96	0	20m.my5651_rel.cy10a2_1g_bee
q500.1
q500.1: range queries with 500 insert/s per client
Performance metrics for all DBMS, not just the ones listed above. Some are normalized by throughput, others are not. Legend for results is here.
ips	qps	rps	rmbps	wps	wmbps	rpq	rkbpq	wpi	wkbpi	csps	cpups	cspq	cpupq	dbgb1	dbgb2	rss	maxop	p50	p99	tag
499	2596	22	0.1	3018.6	91.0	0.008	0.055	6.052	186.891	16590	13.5	6.392	416	3.8	44.3	1.1	0.045	2605	1822	20m.my5651_rel.cy10a_1g_bee
499	2558	22	0.1	3033.3	91.4	0.009	0.057	6.082	187.752	12500	13.6	4.887	425	3.8	44.3	1.1	0.042	2573	1727	20m.my5651_rel.cy10a1_1g_bee
421	125	23	0.2	2239.1	63.3	0.188	1.529	5.315	153.777	6754	5.2	54.206	3339	4.6	45.2	1.1	0.858	48	0	20m.my5651_rel.cy10a2_1g_bee
q1000.1
q1000.1: range queries with 1000 insert/s per client
Performance metrics for all DBMS, not just the ones listed above. Some are normalized by throughput, others are not. Legend for results is here.
ips	qps	rps	rmbps	wps	wmbps	rpq	rkbpq	wpi	wkbpi	csps	cpups	cspq	cpupq	dbgb1	dbgb2	rss	maxop	p50	p99	tag
998	1778	45	0.3	4781.7	145.1	0.025	0.179	4.791	148.913	17033	14.4	9.579	648	3.8	44.3	1.1	0.249	1822	304	20m.my5651_rel.cy10a_1g_bee
999	1705	44	0.3	4701.3	142.9	0.026	0.186	4.708	146.485	10316	14.4	6.051	676	3.8	44.3	1.1	0.260	1742	368	20m.my5651_rel.cy10a1_1g_bee
642	113	27	0.2	2206.9	63.2	0.242	1.392	3.436	100.786	6709	5.9	59.480	4184	4.6	45.2	1.1	0.713	32	0	20m.my5651_rel.cy10a2_1g_bee
l.i0
- l.i0: load without secondary indexes
- Legend for results is here.
- Each entry lists the percentage of responses that fit in that bucket (slower than max time for previous bucket, faster than min time for next bucket).
Insert response time histogram
256us	1ms	4ms	16ms	64ms	256ms	1s	4s	16s	gt	max	tag
0.000	86.671	12.687	0.615	0.024	0.003	0.000	0.000	0.000	0.000	0.099	my5651_rel.cy10a_1g_bee
0.000	87.955	11.393	0.630	0.018	0.004	0.000	0.000	0.000	0.000	0.110	my5651_rel.cy10a1_1g_bee
0.000	85.492	13.839	0.654	0.012	0.003	0.000	0.000	0.000	0.000	0.108	my5651_rel.cy10a2_1g_bee
l.x
- l.x: create secondary indexes
- Legend for results is here.
- Each entry lists the percentage of responses that fit in that bucket (slower than max time for previous bucket, faster than min time for next bucket).
TODO - determine whether there is data for create index response time
l.i1
- l.i1: continue load after secondary indexes created
- Legend for results is here.
- Each entry lists the percentage of responses that fit in that bucket (slower than max time for previous bucket, faster than min time for next bucket).
Insert response time histogram
256us	1ms	4ms	16ms	64ms	256ms	1s	4s	16s	gt	max	tag
0.000	0.000	2.024	43.311	37.486	11.652	5.507	0.021	0.000	0.000	1.779	my5651_rel.cy10a_1g_bee
0.000	0.000	1.477	41.181	39.977	11.824	5.502	0.039	0.000	0.000	1.714	my5651_rel.cy10a1_1g_bee
0.000	0.000	6.562	36.159	39.717	13.104	4.417	0.040	0.000	0.000	1.894	my5651_rel.cy10a2_1g_bee
Delete response time histogram
256us	1ms	4ms	16ms	64ms	256ms	1s	4s	16s	gt	max	tag
0.000	0.000	26.877	36.300	28.474	7.909	0.438	0.003	0.000	0.000	1.781	my5651_rel.cy10a_1g_bee
0.000	0.000	27.574	35.019	29.094	7.855	0.458	0.001	0.000	0.000	1.146	my5651_rel.cy10a1_1g_bee
0.000	0.000	21.509	37.220	30.620	10.133	0.509	0.008	0.000	0.000	1.897	my5651_rel.cy10a2_1g_bee
q100.1
- q100.1: range queries with 100 insert/s per client
- Legend for results is here.
- Each entry lists the percentage of responses that fit in that bucket (slower than max time for previous bucket, faster than min time for next bucket).
Query response time histogram
256us	1ms	4ms	16ms	64ms	256ms	1s	4s	16s	gt	max	tag
58.201	41.238	0.200	0.352	0.007	nonzero	0.000	0.000	0.000	0.000	0.234	my5651_rel.cy10a_1g_bee
59.696	39.754	0.183	0.356	0.011	nonzero	0.000	0.000	0.000	0.000	0.215	my5651_rel.cy10a1_1g_bee
7.816	77.452	4.599	3.983	3.509	2.545	0.096	0.000	0.000	0.000	0.752	my5651_rel.cy10a2_1g_bee
Insert response time histogram
256us	1ms	4ms	16ms	64ms	256ms	1s	4s	16s	gt	max	tag
0.000	0.000	15.792	69.569	14.458	0.097	0.083	0.000	0.000	0.000	0.792	my5651_rel.cy10a_1g_bee
0.000	0.000	13.389	72.111	14.319	0.181	0.000	0.000	0.000	0.000	0.134	my5651_rel.cy10a1_1g_bee
0.000	0.000	5.125	14.958	23.569	43.250	13.014	0.083	0.000	0.000	1.639	my5651_rel.cy10a2_1g_bee
Delete response time histogram
256us	1ms	4ms	16ms	64ms	256ms	1s	4s	16s	gt	max	tag
0.000	0.000	47.431	42.694	9.722	0.111	0.042	0.000	0.000	0.000	0.497	my5651_rel.cy10a_1g_bee
0.000	0.000	51.819	40.431	7.681	0.069	0.000	0.000	0.000	0.000	0.067	my5651_rel.cy10a1_1g_bee
0.000	0.000	18.083	17.694	30.861	31.875	1.486	0.000	0.000	0.000	0.551	my5651_rel.cy10a2_1g_bee
q500.1
- q500.1: range queries with 500 insert/s per client
- Legend for results is here.
- Each entry lists the percentage of responses that fit in that bucket (slower than max time for previous bucket, faster than min time for next bucket).
Query response time histogram
256us	1ms	4ms	16ms	64ms	256ms	1s	4s	16s	gt	max	tag
48.694	49.925	0.097	1.266	0.018	0.000	0.000	0.000	0.000	0.000	0.045	my5651_rel.cy10a_1g_bee
48.941	49.660	0.097	1.279	0.024	0.000	0.000	0.000	0.000	0.000	0.042	my5651_rel.cy10a1_1g_bee
4.267	76.029	5.676	4.964	4.975	3.931	0.157	0.000	0.000	0.000	0.858	my5651_rel.cy10a2_1g_bee
Insert response time histogram
256us	1ms	4ms	16ms	64ms	256ms	1s	4s	16s	gt	max	tag
0.000	0.000	12.756	73.131	14.111	0.003	0.000	0.000	0.000	0.000	0.065	my5651_rel.cy10a_1g_bee
0.000	0.000	10.758	73.542	15.669	0.031	0.000	0.000	0.000	0.000	0.106	my5651_rel.cy10a1_1g_bee
0.000	0.000	5.953	28.308	21.958	31.992	11.781	0.008	0.000	0.000	1.131	my5651_rel.cy10a2_1g_bee
Delete response time histogram
256us	1ms	4ms	16ms	64ms	256ms	1s	4s	16s	gt	max	tag
0.000	0.000	54.956	36.006	9.039	0.000	0.000	0.000	0.000	0.000	0.053	my5651_rel.cy10a_1g_bee
0.000	0.000	55.472	34.650	9.867	0.011	0.000	0.000	0.000	0.000	0.074	my5651_rel.cy10a1_1g_bee
0.000	0.000	35.689	17.003	25.108	21.453	0.747	0.000	0.000	0.000	0.607	my5651_rel.cy10a2_1g_bee
q1000.1
- q1000.1: range queries with 1000 insert/s per client
- Legend for results is here.
- Each entry lists the percentage of responses that fit in that bucket (slower than max time for previous bucket, faster than min time for next bucket).
Query response time histogram
256us	1ms	4ms	16ms	64ms	256ms	1s	4s	16s	gt	max	tag
31.162	65.610	0.404	2.761	0.058	0.005	0.000	0.000	0.000	0.000	0.249	my5651_rel.cy10a_1g_bee
29.652	67.066	0.403	2.811	0.065	0.003	nonzero	0.000	0.000	0.000	0.260	my5651_rel.cy10a1_1g_bee
2.575	71.694	10.555	5.552	5.103	4.319	0.202	0.000	0.000	0.000	0.713	my5651_rel.cy10a2_1g_bee
Insert response time histogram
256us	1ms	4ms	16ms	64ms	256ms	1s	4s	16s	gt	max	tag
0.000	0.000	19.529	66.161	13.858	0.425	0.026	0.000	0.000	0.000	0.403	my5651_rel.cy10a_1g_bee
0.000	0.000	16.742	67.789	15.114	0.343	0.013	0.000	0.000	0.000	0.408	my5651_rel.cy10a1_1g_bee
0.000	0.000	9.946	30.135	24.386	30.153	5.381	0.000	0.000	0.000	0.927	my5651_rel.cy10a2_1g_bee
Delete response time histogram
256us	1ms	4ms	16ms	64ms	256ms	1s	4s	16s	gt	max	tag
0.000	0.000	59.237	31.407	9.238	0.118	0.000	0.000	0.000	0.000	0.186	my5651_rel.cy10a_1g_bee
0.000	0.000	60.882	29.356	9.667	0.096	0.000	0.000	0.000	0.000	0.148	my5651_rel.cy10a1_1g_bee
0.000	0.000	34.281	19.787	25.251	20.001	0.679	0.000	0.000	0.000	0.510	my5651_rel.cy10a2_1g_bee