Introduction
This is a report for the insert benchmark with 20M docs and 1 client(s). It is generated by scripts (bash, awk, sed) and Tufte might not be impressed. An overview of the insert benchmark is here and a short update is here. Below, by DBMS, I mean DBMS+version.config. An example is my8020.c10b40 where my means MySQL, 8020 is version 8.0.20 and c10b40 is the name for the configuration file.
The test server has 8 AMD cores, 16G RAM and an NVMe SSD. It is described here as the Beelink. The benchmark was run with 1 client and there were 1 or 3 connections per client (1 for queries or inserts without rate limits, 1+1 for rate limited inserts+deletes). There is 1 table. It loads 20M rows without secondary indexes, creates secondary indexes, then inserts 50M rows with a delete per insert to avoid growing the table. It then does 3 read+write tests for 3600s each that do queries as fast as possible with 100, 500 and then 1000 inserts/second/client concurrent with the queries and 1000 deletes/second to avoid growing the table. The database is cached by the OS but not by InnoDB.
The tested DBMS are:
- my5651_rel.cy10a_1g_bee - InnoDB and MySQL 5.6.51, rel build, cy10a_1g_bee config, compiled with CMAKE_BUILD_TYPE=Release, base config
- my5740_rel_lto.cy10a_1g_bee - InnoDB and MySQL 5.7.40, rel_lto build, cy10a_1g_bee config, compiled with CMAKE_BUILD_TYPE=Release, base config
- my8033_rel_lto.cy10a_1g_bee - InnoDB and MySQL 8.0.33, rel_lto build, cy10a_1g_bee config, compiled with CMAKE_BUILD_TYPE=Release, base config
Contents
- Summary
- l.i0: load without secondary indexes
- l.x: create secondary indexes
- l.i1: continue load after secondary indexes created
- q100.1: range queries with 100 insert/s per client
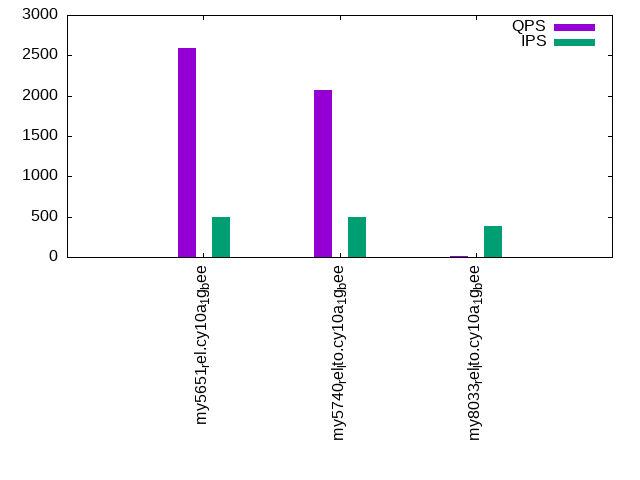
- q500.1: range queries with 500 insert/s per client
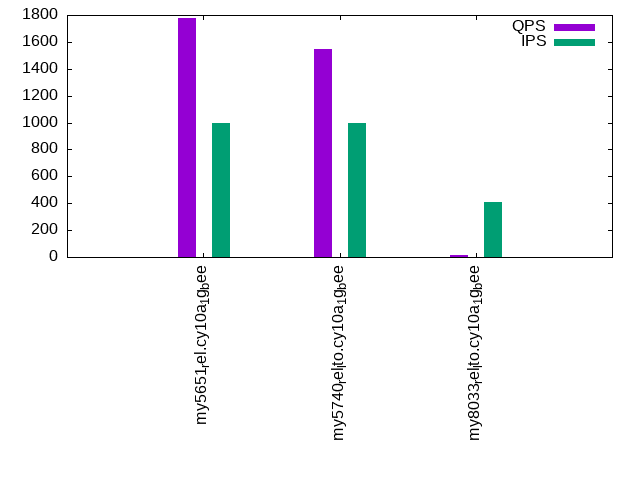
- q1000.1: range queries with 1000 insert/s per client
Summary
The numbers are inserts/s for l.i0 and l.i1, indexed docs (or rows) /s for l.x and queries/s for q100, q500, q1000. The values are the average rate over the entire test for inserts (IPS) and queries (QPS). The range of values for IPS and QPS is split into 3 parts: bottom 25%, middle 50%, top 25%. Values in the bottom 25% have a red background, values in the top 25% have a green background and values in the middle have no color. A gray background is used for values that can be ignored because the DBMS did not sustain the target insert rate. Red backgrounds are not used when the minimum value is within 80% of the max value.
| dbms | l.i0 | l.x | l.i1 | q100.1 | q500.1 | q1000.1 |
|---|---|---|---|---|---|---|
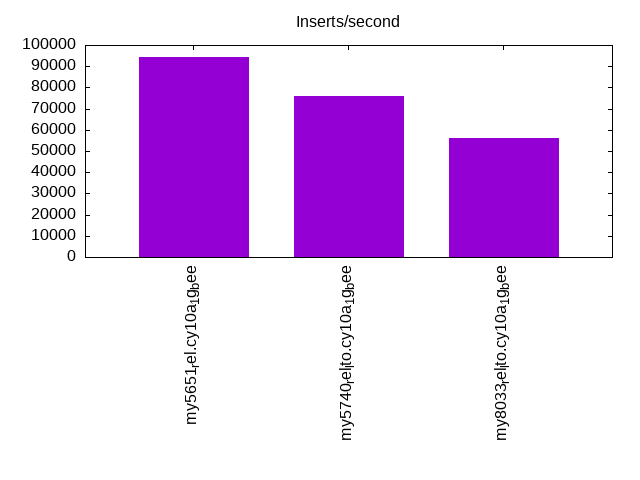
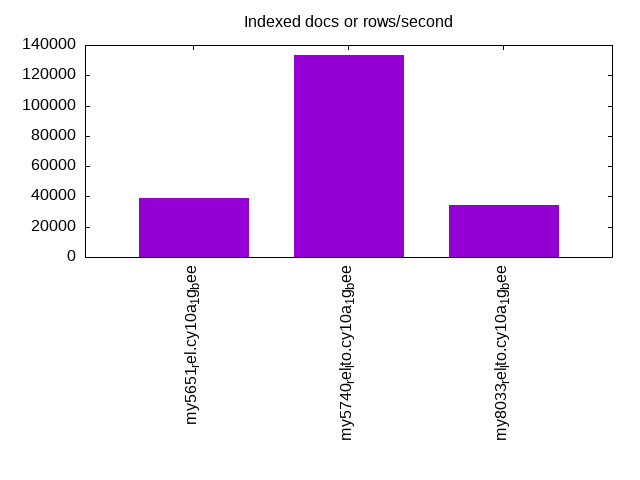
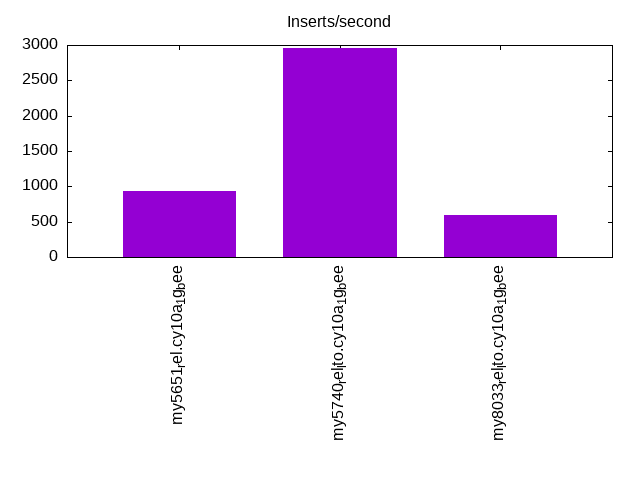
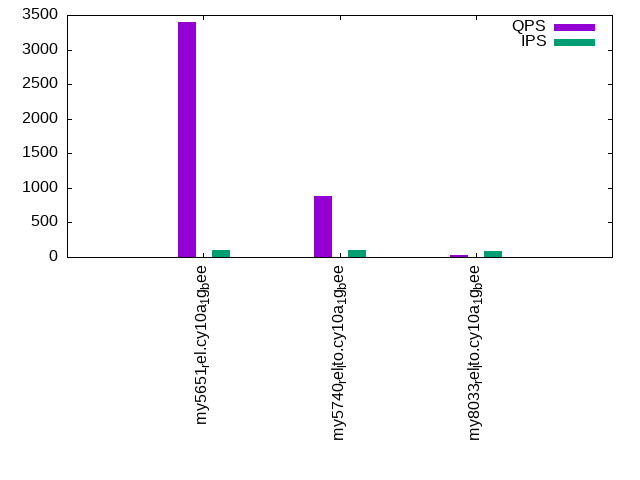
| my5651_rel.cy10a_1g_bee | 94340 | 39105 | 940 | 3400 | 2596 | 1778 |
| my5740_rel_lto.cy10a_1g_bee | 76046 | 133112 | 2954 | 877 | 2066 | 1550 |
| my8033_rel_lto.cy10a_1g_bee | 56338 | 34477 | 590 | 25 | 16 | 15 |
This table has relative throughput, throughput for the DBMS relative to the DBMS in the first line, using the absolute throughput from the previous table. Values less than 0.95 have a yellow background. Values greater than 1.05 have a blue background.
| dbms | l.i0 | l.x | l.i1 | q100.1 | q500.1 | q1000.1 |
|---|---|---|---|---|---|---|
| my5651_rel.cy10a_1g_bee | 1.00 | 1.00 | 1.00 | 1.00 | 1.00 | 1.00 |
| my5740_rel_lto.cy10a_1g_bee | 0.81 | 3.40 | 3.14 | 0.26 | 0.80 | 0.87 |
| my8033_rel_lto.cy10a_1g_bee | 0.60 | 0.88 | 0.63 | 0.01 | 0.01 | 0.01 |
This lists the average rate of inserts/s for the tests that do inserts concurrent with queries. For such tests the query rate is listed in the table above. The read+write tests are setup so that the insert rate should match the target rate every second. Cells that are not at least 95% of the target have a red background to indicate a failure to satisfy the target.
| dbms | q100.1 | q500.1 | q1000.1 |
|---|---|---|---|
| my5651_rel.cy10a_1g_bee | 100 | 499 | 998 |
| my5740_rel_lto.cy10a_1g_bee | 99 | 499 | 999 |
| my8033_rel_lto.cy10a_1g_bee | 88 | 388 | 410 |
| target | 100 | 500 | 1000 |
l.i0
l.i0: load without secondary indexes. Graphs for performance per 1-second interval are here.
Average throughput:
Insert response time histogram: each cell has the percentage of responses that take <= the time in the header and max is the max response time in seconds. For the max column values in the top 25% of the range have a red background and in the bottom 25% of the range have a green background. The red background is not used when the min value is within 80% of the max value.
| dbms | 256us | 1ms | 4ms | 16ms | 64ms | 256ms | 1s | 4s | 16s | gt | max |
|---|---|---|---|---|---|---|---|---|---|---|---|
| my5651_rel.cy10a_1g_bee | 86.671 | 12.687 | 0.615 | 0.024 | 0.003 | 0.099 | |||||
| my5740_rel_lto.cy10a_1g_bee | 3.331 | 94.900 | 1.619 | 0.148 | 0.001 | 0.081 | |||||
| my8033_rel_lto.cy10a_1g_bee | 99.365 | 0.464 | 0.161 | 0.010 | 0.111 |
Performance metrics for the DBMS listed above. Some are normalized by throughput, others are not. Legend for results is here.
ips	qps	rps	rmbps	wps	wmbps	rpq	rkbpq	wpi	wkbpi	csps	cpups	cspq	cpupq	dbgb1	dbgb2	rss	maxop	p50	p99	tag
94340	0	826	3.2	72.5	26.3	0.009	0.035	0.001	0.286	10798	20.8	0.114	18	1.3	41.8	1.0	0.099	97886	58534	20m.my5651_rel.cy10a_1g_bee
76046	0	0	0.0	104.9	21.5	0.000	0.000	0.001	0.290	7801	20.1	0.103	21	1.3	41.8	1.1	0.081	75912	58023	20m.my5740_rel_lto.cy10a_1g_bee
56338	0	0	0.0	255.2	19.7	0.000	0.000	0.005	0.358	7418	20.5	0.132	29	1.3	9.9	1.4	0.111	57090	42151	20m.my8033_rel_lto.cy10a_1g_bee
l.x
l.x: create secondary indexes.
Average throughput:
Performance metrics for the DBMS listed above. Some are normalized by throughput, others are not. Legend for results is here.
ips	qps	rps	rmbps	wps	wmbps	rpq	rkbpq	wpi	wkbpi	csps	cpups	cspq	cpupq	dbgb1	dbgb2	rss	maxop	p50	p99	tag
39105	0	26	0.1	347.2	40.3	0.001	0.003	0.009	1.055	2135	5.2	0.055	11	2.7	43.2	1.1	0.022	NA	NA	20m.my5651_rel.cy10a_1g_bee
133112	0	0	0.0	331.1	118.6	0.000	0.000	0.002	0.913	5512	11.4	0.041	7	3.0	43.5	1.3	0.013	NA	NA	20m.my5740_rel_lto.cy10a_1g_bee
34477	0	170	11.1	733.5	36.9	0.005	0.329	0.021	1.096	5166	11.2	0.150	26	3.0	11.5	1.5	0.014	NA	NA	20m.my8033_rel_lto.cy10a_1g_bee
l.i1
l.i1: continue load after secondary indexes created. Graphs for performance per 1-second interval are here.
Average throughput:
Insert response time histogram: each cell has the percentage of responses that take <= the time in the header and max is the max response time in seconds. For the max column values in the top 25% of the range have a red background and in the bottom 25% of the range have a green background. The red background is not used when the min value is within 80% of the max value.
| dbms | 256us | 1ms | 4ms | 16ms | 64ms | 256ms | 1s | 4s | 16s | gt | max |
|---|---|---|---|---|---|---|---|---|---|---|---|
| my5651_rel.cy10a_1g_bee | 2.024 | 43.311 | 37.486 | 11.652 | 5.507 | 0.021 | 1.779 | ||||
| my5740_rel_lto.cy10a_1g_bee | 5.871 | 62.870 | 28.940 | 2.100 | 0.217 | 0.002 | 1.382 | ||||
| my8033_rel_lto.cy10a_1g_bee | 0.074 | 29.645 | 28.159 | 37.724 | 3.804 | 0.593 | 0.003 | 4.803 |
Delete response time histogram: each cell has the percentage of responses that take <= the time in the header and max is the max response time in seconds. For the max column values in the top 25% of the range have a red background and in the bottom 25% of the range have a green background. The red background is not used when the min value is within 80% of the max value.
| dbms | 256us | 1ms | 4ms | 16ms | 64ms | 256ms | 1s | 4s | 16s | gt | max |
|---|---|---|---|---|---|---|---|---|---|---|---|
| my5651_rel.cy10a_1g_bee | 26.877 | 36.300 | 28.474 | 7.909 | 0.438 | 0.003 | 1.781 | ||||
| my5740_rel_lto.cy10a_1g_bee | 11.511 | 62.262 | 25.017 | 1.209 | 0.001 | 0.310 | |||||
| my8033_rel_lto.cy10a_1g_bee | 1.065 | 31.434 | 29.359 | 35.991 | 2.089 | 0.061 | 0.001 | 4.058 |
Performance metrics for the DBMS listed above. Some are normalized by throughput, others are not. Legend for results is here.
ips	qps	rps	rmbps	wps	wmbps	rpq	rkbpq	wpi	wkbpi	csps	cpups	cspq	cpupq	dbgb1	dbgb2	rss	maxop	p50	p99	tag
940	0	34	0.2	3094.8	93.4	0.036	0.207	3.292	101.751	8165	7.1	8.684	604	3.8	44.3	1.1	1.779	450	50	20m.my5651_rel.cy10a_1g_bee
2954	0	3	0.2	4669.8	149.3	0.001	0.058	1.581	51.760	13149	18.8	4.451	509	4.7	45.4	1.3	1.382	2997	300	20m.my5740_rel_lto.cy10a_1g_bee
590	0	0	0.0	918.7	16.9	0.001	0.066	1.556	29.263	5704	5.4	9.663	732	5.1	14.3	1.5	4.803	450	0	20m.my8033_rel_lto.cy10a_1g_bee
q100.1
q100.1: range queries with 100 insert/s per client. Graphs for performance per 1-second interval are here.
Average throughput:
Query response time histogram: each cell has the percentage of responses that take <= the time in the header and max is the max response time in seconds. For max values in the top 25% of the range have a red background and in the bottom 25% of the range have a green background. The red background is not used when the min value is within 80% of the max value.
| dbms | 256us | 1ms | 4ms | 16ms | 64ms | 256ms | 1s | 4s | 16s | gt | max |
|---|---|---|---|---|---|---|---|---|---|---|---|
| my5651_rel.cy10a_1g_bee | 58.201 | 41.238 | 0.200 | 0.352 | 0.007 | nonzero | 0.234 | ||||
| my5740_rel_lto.cy10a_1g_bee | 21.504 | 75.497 | 0.151 | 1.572 | 0.968 | 0.306 | 0.003 | 0.388 | |||
| my8033_rel_lto.cy10a_1g_bee | 0.006 | 34.616 | 3.227 | 18.861 | 28.651 | 12.659 | 1.937 | 0.042 | 2.518 |
Insert response time histogram: each cell has the percentage of responses that take <= the time in the header and max is the max response time in seconds. For max values in the top 25% of the range have a red background and in the bottom 25% of the range have a green background. The red background is not used when the min value is within 80% of the max value.
| dbms | 256us | 1ms | 4ms | 16ms | 64ms | 256ms | 1s | 4s | 16s | gt | max |
|---|---|---|---|---|---|---|---|---|---|---|---|
| my5651_rel.cy10a_1g_bee | 15.792 | 69.569 | 14.458 | 0.097 | 0.083 | 0.792 | |||||
| my5740_rel_lto.cy10a_1g_bee | 13.958 | 31.417 | 19.903 | 24.931 | 9.694 | 0.097 | 1.316 | ||||
| my8033_rel_lto.cy10a_1g_bee | 2.222 | 4.375 | 10.000 | 64.403 | 18.972 | 0.028 | 2.551 |
Delete response time histogram: each cell has the percentage of responses that take <= the time in the header and max is the max response time in seconds. For max values in the top 25% of the range have a red background and in the bottom 25% of the range have a green background. The red background is not used when the min value is within 80% of the max value.
| dbms | 256us | 1ms | 4ms | 16ms | 64ms | 256ms | 1s | 4s | 16s | gt | max |
|---|---|---|---|---|---|---|---|---|---|---|---|
| my5651_rel.cy10a_1g_bee | 47.431 | 42.694 | 9.722 | 0.111 | 0.042 | 0.497 | |||||
| my5740_rel_lto.cy10a_1g_bee | 43.958 | 20.347 | 25.903 | 9.694 | 0.097 | 0.550 | |||||
| my8033_rel_lto.cy10a_1g_bee | 5.556 | 2.306 | 10.986 | 64.042 | 17.028 | 0.083 | 2.619 |
Performance metrics for the DBMS listed above. Some are normalized by throughput, others are not. Legend for results is here.
ips	qps	rps	rmbps	wps	wmbps	rpq	rkbpq	wpi	wkbpi	csps	cpups	cspq	cpupq	dbgb1	dbgb2	rss	maxop	p50	p99	tag
100	3400	5	0.0	772.1	22.8	0.002	0.010	7.736	233.746	14912	12.4	4.385	292	3.8	44.3	1.1	0.234	3421	2703	20m.my5651_rel.cy10a_1g_bee
99	877	1	0.0	2885.8	82.3	0.001	0.022	29.150	850.843	11871	8.5	13.538	775	4.7	45.4	1.3	0.388	367	32	20m.my5740_rel_lto.cy10a_1g_bee
88	25	1	0.0	660.8	11.1	0.054	1.005	7.475	128.018	4299	2.7	170.592	8572	5.1	14.3	1.5	2.518	16	0	20m.my8033_rel_lto.cy10a_1g_bee
q500.1
q500.1: range queries with 500 insert/s per client. Graphs for performance per 1-second interval are here.
Average throughput:
Query response time histogram: each cell has the percentage of responses that take <= the time in the header and max is the max response time in seconds. For max values in the top 25% of the range have a red background and in the bottom 25% of the range have a green background. The red background is not used when the min value is within 80% of the max value.
| dbms | 256us | 1ms | 4ms | 16ms | 64ms | 256ms | 1s | 4s | 16s | gt | max |
|---|---|---|---|---|---|---|---|---|---|---|---|
| my5651_rel.cy10a_1g_bee | 48.694 | 49.925 | 0.097 | 1.266 | 0.018 | 0.045 | |||||
| my5740_rel_lto.cy10a_1g_bee | 22.930 | 75.466 | 0.051 | 1.479 | 0.068 | 0.007 | 0.200 | ||||
| my8033_rel_lto.cy10a_1g_bee | 0.001 | 22.632 | 7.258 | 13.805 | 29.035 | 22.631 | 4.598 | 0.040 | 2.395 |
Insert response time histogram: each cell has the percentage of responses that take <= the time in the header and max is the max response time in seconds. For max values in the top 25% of the range have a red background and in the bottom 25% of the range have a green background. The red background is not used when the min value is within 80% of the max value.
| dbms | 256us | 1ms | 4ms | 16ms | 64ms | 256ms | 1s | 4s | 16s | gt | max |
|---|---|---|---|---|---|---|---|---|---|---|---|
| my5651_rel.cy10a_1g_bee | 12.756 | 73.131 | 14.111 | 0.003 | 0.065 | ||||||
| my5740_rel_lto.cy10a_1g_bee | 47.978 | 46.603 | 4.514 | 0.889 | 0.017 | 0.336 | |||||
| my8033_rel_lto.cy10a_1g_bee | 0.392 | 21.858 | 16.689 | 53.014 | 7.950 | 0.097 | 2.856 |
Delete response time histogram: each cell has the percentage of responses that take <= the time in the header and max is the max response time in seconds. For max values in the top 25% of the range have a red background and in the bottom 25% of the range have a green background. The red background is not used when the min value is within 80% of the max value.
| dbms | 256us | 1ms | 4ms | 16ms | 64ms | 256ms | 1s | 4s | 16s | gt | max |
|---|---|---|---|---|---|---|---|---|---|---|---|
| my5651_rel.cy10a_1g_bee | 54.956 | 36.006 | 9.039 | 0.053 | |||||||
| my5740_rel_lto.cy10a_1g_bee | 80.275 | 16.475 | 3.153 | 0.097 | 0.115 | ||||||
| my8033_rel_lto.cy10a_1g_bee | 5.442 | 18.081 | 17.069 | 52.228 | 7.072 | 0.108 | 3.072 |
Performance metrics for the DBMS listed above. Some are normalized by throughput, others are not. Legend for results is here.
ips	qps	rps	rmbps	wps	wmbps	rpq	rkbpq	wpi	wkbpi	csps	cpups	cspq	cpupq	dbgb1	dbgb2	rss	maxop	p50	p99	tag
499	2596	22	0.1	3018.6	91.0	0.008	0.055	6.052	186.891	16590	13.5	6.392	416	3.8	44.3	1.1	0.045	2605	1822	20m.my5651_rel.cy10a_1g_bee
499	2066	5	0.1	2896.2	86.7	0.003	0.043	5.803	177.975	15494	13.5	7.499	523	4.7	45.4	1.3	0.200	2157	863	20m.my5740_rel_lto.cy10a_1g_bee
388	16	2	0.0	672.0	11.4	0.111	2.177	1.734	30.202	4424	3.8	283.615	19487	5.2	14.5	1.5	2.395	16	0	20m.my8033_rel_lto.cy10a_1g_bee
q1000.1
q1000.1: range queries with 1000 insert/s per client. Graphs for performance per 1-second interval are here.
Average throughput:
Query response time histogram: each cell has the percentage of responses that take <= the time in the header and max is the max response time in seconds. For max values in the top 25% of the range have a red background and in the bottom 25% of the range have a green background. The red background is not used when the min value is within 80% of the max value.
| dbms | 256us | 1ms | 4ms | 16ms | 64ms | 256ms | 1s | 4s | 16s | gt | max |
|---|---|---|---|---|---|---|---|---|---|---|---|
| my5651_rel.cy10a_1g_bee | 31.162 | 65.610 | 0.404 | 2.761 | 0.058 | 0.005 | 0.249 | ||||
| my5740_rel_lto.cy10a_1g_bee | 15.736 | 81.280 | 0.207 | 2.620 | 0.138 | 0.019 | 0.226 | ||||
| my8033_rel_lto.cy10a_1g_bee | 0.003 | 20.046 | 7.788 | 13.028 | 29.171 | 24.712 | 5.181 | 0.071 | 3.719 |
Insert response time histogram: each cell has the percentage of responses that take <= the time in the header and max is the max response time in seconds. For max values in the top 25% of the range have a red background and in the bottom 25% of the range have a green background. The red background is not used when the min value is within 80% of the max value.
| dbms | 256us | 1ms | 4ms | 16ms | 64ms | 256ms | 1s | 4s | 16s | gt | max |
|---|---|---|---|---|---|---|---|---|---|---|---|
| my5651_rel.cy10a_1g_bee | 19.529 | 66.161 | 13.858 | 0.425 | 0.026 | 0.403 | |||||
| my5740_rel_lto.cy10a_1g_bee | 36.514 | 55.122 | 7.300 | 1.038 | 0.026 | 0.496 | |||||
| my8033_rel_lto.cy10a_1g_bee | 0.031 | 21.950 | 15.515 | 53.490 | 8.922 | 0.092 | 3.483 |
Delete response time histogram: each cell has the percentage of responses that take <= the time in the header and max is the max response time in seconds. For max values in the top 25% of the range have a red background and in the bottom 25% of the range have a green background. The red background is not used when the min value is within 80% of the max value.
| dbms | 256us | 1ms | 4ms | 16ms | 64ms | 256ms | 1s | 4s | 16s | gt | max |
|---|---|---|---|---|---|---|---|---|---|---|---|
| my5651_rel.cy10a_1g_bee | 59.237 | 31.407 | 9.238 | 0.118 | 0.186 | ||||||
| my5740_rel_lto.cy10a_1g_bee | 70.511 | 23.989 | 5.385 | 0.115 | 0.172 | ||||||
| my8033_rel_lto.cy10a_1g_bee | 2.165 | 22.851 | 16.139 | 51.244 | 7.494 | 0.106 | 3.452 |
Performance metrics for the DBMS listed above. Some are normalized by throughput, others are not. Legend for results is here.
ips	qps	rps	rmbps	wps	wmbps	rpq	rkbpq	wpi	wkbpi	csps	cpups	cspq	cpupq	dbgb1	dbgb2	rss	maxop	p50	p99	tag
998	1778	45	0.3	4781.7	145.1	0.025	0.179	4.791	148.913	17033	14.4	9.579	648	3.8	44.3	1.1	0.249	1822	304	20m.my5651_rel.cy10a_1g_bee
999	1550	9	0.1	4503.3	135.8	0.006	0.089	4.510	139.250	17476	15.4	11.276	795	4.7	45.4	1.3	0.226	1598	352	20m.my5740_rel_lto.cy10a_1g_bee
410	15	2	0.0	671.1	11.5	0.127	2.566	1.636	28.770	4451	4.0	302.760	21769	5.4	15.0	1.5	3.719	16	0	20m.my8033_rel_lto.cy10a_1g_bee
l.i0
l.i0: load without secondary indexes
Performance metrics for all DBMS, not just the ones listed above. Some are normalized by throughput, others are not. Legend for results is here.
ips	qps	rps	rmbps	wps	wmbps	rpq	rkbpq	wpi	wkbpi	csps	cpups	cspq	cpupq	dbgb1	dbgb2	rss	maxop	p50	p99	tag
94340	0	826	3.2	72.5	26.3	0.009	0.035	0.001	0.286	10798	20.8	0.114	18	1.3	41.8	1.0	0.099	97886	58534	20m.my5651_rel.cy10a_1g_bee
76046	0	0	0.0	104.9	21.5	0.000	0.000	0.001	0.290	7801	20.1	0.103	21	1.3	41.8	1.1	0.081	75912	58023	20m.my5740_rel_lto.cy10a_1g_bee
56338	0	0	0.0	255.2	19.7	0.000	0.000	0.005	0.358	7418	20.5	0.132	29	1.3	9.9	1.4	0.111	57090	42151	20m.my8033_rel_lto.cy10a_1g_bee
l.x
l.x: create secondary indexes
Performance metrics for all DBMS, not just the ones listed above. Some are normalized by throughput, others are not. Legend for results is here.
ips	qps	rps	rmbps	wps	wmbps	rpq	rkbpq	wpi	wkbpi	csps	cpups	cspq	cpupq	dbgb1	dbgb2	rss	maxop	p50	p99	tag
39105	0	26	0.1	347.2	40.3	0.001	0.003	0.009	1.055	2135	5.2	0.055	11	2.7	43.2	1.1	0.022	NA	NA	20m.my5651_rel.cy10a_1g_bee
133112	0	0	0.0	331.1	118.6	0.000	0.000	0.002	0.913	5512	11.4	0.041	7	3.0	43.5	1.3	0.013	NA	NA	20m.my5740_rel_lto.cy10a_1g_bee
34477	0	170	11.1	733.5	36.9	0.005	0.329	0.021	1.096	5166	11.2	0.150	26	3.0	11.5	1.5	0.014	NA	NA	20m.my8033_rel_lto.cy10a_1g_bee
l.i1
l.i1: continue load after secondary indexes created
Performance metrics for all DBMS, not just the ones listed above. Some are normalized by throughput, others are not. Legend for results is here.
ips	qps	rps	rmbps	wps	wmbps	rpq	rkbpq	wpi	wkbpi	csps	cpups	cspq	cpupq	dbgb1	dbgb2	rss	maxop	p50	p99	tag
940	0	34	0.2	3094.8	93.4	0.036	0.207	3.292	101.751	8165	7.1	8.684	604	3.8	44.3	1.1	1.779	450	50	20m.my5651_rel.cy10a_1g_bee
2954	0	3	0.2	4669.8	149.3	0.001	0.058	1.581	51.760	13149	18.8	4.451	509	4.7	45.4	1.3	1.382	2997	300	20m.my5740_rel_lto.cy10a_1g_bee
590	0	0	0.0	918.7	16.9	0.001	0.066	1.556	29.263	5704	5.4	9.663	732	5.1	14.3	1.5	4.803	450	0	20m.my8033_rel_lto.cy10a_1g_bee
q100.1
q100.1: range queries with 100 insert/s per client
Performance metrics for all DBMS, not just the ones listed above. Some are normalized by throughput, others are not. Legend for results is here.
ips	qps	rps	rmbps	wps	wmbps	rpq	rkbpq	wpi	wkbpi	csps	cpups	cspq	cpupq	dbgb1	dbgb2	rss	maxop	p50	p99	tag
100	3400	5	0.0	772.1	22.8	0.002	0.010	7.736	233.746	14912	12.4	4.385	292	3.8	44.3	1.1	0.234	3421	2703	20m.my5651_rel.cy10a_1g_bee
99	877	1	0.0	2885.8	82.3	0.001	0.022	29.150	850.843	11871	8.5	13.538	775	4.7	45.4	1.3	0.388	367	32	20m.my5740_rel_lto.cy10a_1g_bee
88	25	1	0.0	660.8	11.1	0.054	1.005	7.475	128.018	4299	2.7	170.592	8572	5.1	14.3	1.5	2.518	16	0	20m.my8033_rel_lto.cy10a_1g_bee
q500.1
q500.1: range queries with 500 insert/s per client
Performance metrics for all DBMS, not just the ones listed above. Some are normalized by throughput, others are not. Legend for results is here.
ips	qps	rps	rmbps	wps	wmbps	rpq	rkbpq	wpi	wkbpi	csps	cpups	cspq	cpupq	dbgb1	dbgb2	rss	maxop	p50	p99	tag
499	2596	22	0.1	3018.6	91.0	0.008	0.055	6.052	186.891	16590	13.5	6.392	416	3.8	44.3	1.1	0.045	2605	1822	20m.my5651_rel.cy10a_1g_bee
499	2066	5	0.1	2896.2	86.7	0.003	0.043	5.803	177.975	15494	13.5	7.499	523	4.7	45.4	1.3	0.200	2157	863	20m.my5740_rel_lto.cy10a_1g_bee
388	16	2	0.0	672.0	11.4	0.111	2.177	1.734	30.202	4424	3.8	283.615	19487	5.2	14.5	1.5	2.395	16	0	20m.my8033_rel_lto.cy10a_1g_bee
q1000.1
q1000.1: range queries with 1000 insert/s per client
Performance metrics for all DBMS, not just the ones listed above. Some are normalized by throughput, others are not. Legend for results is here.
ips	qps	rps	rmbps	wps	wmbps	rpq	rkbpq	wpi	wkbpi	csps	cpups	cspq	cpupq	dbgb1	dbgb2	rss	maxop	p50	p99	tag
998	1778	45	0.3	4781.7	145.1	0.025	0.179	4.791	148.913	17033	14.4	9.579	648	3.8	44.3	1.1	0.249	1822	304	20m.my5651_rel.cy10a_1g_bee
999	1550	9	0.1	4503.3	135.8	0.006	0.089	4.510	139.250	17476	15.4	11.276	795	4.7	45.4	1.3	0.226	1598	352	20m.my5740_rel_lto.cy10a_1g_bee
410	15	2	0.0	671.1	11.5	0.127	2.566	1.636	28.770	4451	4.0	302.760	21769	5.4	15.0	1.5	3.719	16	0	20m.my8033_rel_lto.cy10a_1g_bee
l.i0
- l.i0: load without secondary indexes
- Legend for results is here.
- Each entry lists the percentage of responses that fit in that bucket (slower than max time for previous bucket, faster than min time for next bucket).
Insert response time histogram
256us	1ms	4ms	16ms	64ms	256ms	1s	4s	16s	gt	max	tag
0.000	86.671	12.687	0.615	0.024	0.003	0.000	0.000	0.000	0.000	0.099	my5651_rel.cy10a_1g_bee
0.000	3.331	94.900	1.619	0.148	0.001	0.000	0.000	0.000	0.000	0.081	my5740_rel_lto.cy10a_1g_bee
0.000	0.000	99.365	0.464	0.161	0.010	0.000	0.000	0.000	0.000	0.111	my8033_rel_lto.cy10a_1g_bee
l.x
- l.x: create secondary indexes
- Legend for results is here.
- Each entry lists the percentage of responses that fit in that bucket (slower than max time for previous bucket, faster than min time for next bucket).
TODO - determine whether there is data for create index response time
l.i1
- l.i1: continue load after secondary indexes created
- Legend for results is here.
- Each entry lists the percentage of responses that fit in that bucket (slower than max time for previous bucket, faster than min time for next bucket).
Insert response time histogram
256us	1ms	4ms	16ms	64ms	256ms	1s	4s	16s	gt	max	tag
0.000	0.000	2.024	43.311	37.486	11.652	5.507	0.021	0.000	0.000	1.779	my5651_rel.cy10a_1g_bee
0.000	0.000	5.871	62.870	28.940	2.100	0.217	0.002	0.000	0.000	1.382	my5740_rel_lto.cy10a_1g_bee
0.000	0.000	0.074	29.645	28.159	37.724	3.804	0.593	0.003	0.000	4.803	my8033_rel_lto.cy10a_1g_bee
Delete response time histogram
256us	1ms	4ms	16ms	64ms	256ms	1s	4s	16s	gt	max	tag
0.000	0.000	26.877	36.300	28.474	7.909	0.438	0.003	0.000	0.000	1.781	my5651_rel.cy10a_1g_bee
0.000	0.000	11.511	62.262	25.017	1.209	0.001	0.000	0.000	0.000	0.310	my5740_rel_lto.cy10a_1g_bee
0.000	0.000	1.065	31.434	29.359	35.991	2.089	0.061	0.001	0.000	4.058	my8033_rel_lto.cy10a_1g_bee
q100.1
- q100.1: range queries with 100 insert/s per client
- Legend for results is here.
- Each entry lists the percentage of responses that fit in that bucket (slower than max time for previous bucket, faster than min time for next bucket).
Query response time histogram
256us	1ms	4ms	16ms	64ms	256ms	1s	4s	16s	gt	max	tag
58.201	41.238	0.200	0.352	0.007	nonzero	0.000	0.000	0.000	0.000	0.234	my5651_rel.cy10a_1g_bee
21.504	75.497	0.151	1.572	0.968	0.306	0.003	0.000	0.000	0.000	0.388	my5740_rel_lto.cy10a_1g_bee
0.006	34.616	3.227	18.861	28.651	12.659	1.937	0.042	0.000	0.000	2.518	my8033_rel_lto.cy10a_1g_bee
Insert response time histogram
256us	1ms	4ms	16ms	64ms	256ms	1s	4s	16s	gt	max	tag
0.000	0.000	15.792	69.569	14.458	0.097	0.083	0.000	0.000	0.000	0.792	my5651_rel.cy10a_1g_bee
0.000	0.000	13.958	31.417	19.903	24.931	9.694	0.097	0.000	0.000	1.316	my5740_rel_lto.cy10a_1g_bee
0.000	0.000	2.222	4.375	10.000	64.403	18.972	0.028	0.000	0.000	2.551	my8033_rel_lto.cy10a_1g_bee
Delete response time histogram
256us	1ms	4ms	16ms	64ms	256ms	1s	4s	16s	gt	max	tag
0.000	0.000	47.431	42.694	9.722	0.111	0.042	0.000	0.000	0.000	0.497	my5651_rel.cy10a_1g_bee
0.000	0.000	43.958	20.347	25.903	9.694	0.097	0.000	0.000	0.000	0.550	my5740_rel_lto.cy10a_1g_bee
0.000	0.000	5.556	2.306	10.986	64.042	17.028	0.083	0.000	0.000	2.619	my8033_rel_lto.cy10a_1g_bee
q500.1
- q500.1: range queries with 500 insert/s per client
- Legend for results is here.
- Each entry lists the percentage of responses that fit in that bucket (slower than max time for previous bucket, faster than min time for next bucket).
Query response time histogram
256us	1ms	4ms	16ms	64ms	256ms	1s	4s	16s	gt	max	tag
48.694	49.925	0.097	1.266	0.018	0.000	0.000	0.000	0.000	0.000	0.045	my5651_rel.cy10a_1g_bee
22.930	75.466	0.051	1.479	0.068	0.007	0.000	0.000	0.000	0.000	0.200	my5740_rel_lto.cy10a_1g_bee
0.001	22.632	7.258	13.805	29.035	22.631	4.598	0.040	0.000	0.000	2.395	my8033_rel_lto.cy10a_1g_bee
Insert response time histogram
256us	1ms	4ms	16ms	64ms	256ms	1s	4s	16s	gt	max	tag
0.000	0.000	12.756	73.131	14.111	0.003	0.000	0.000	0.000	0.000	0.065	my5651_rel.cy10a_1g_bee
0.000	0.000	47.978	46.603	4.514	0.889	0.017	0.000	0.000	0.000	0.336	my5740_rel_lto.cy10a_1g_bee
0.000	0.000	0.392	21.858	16.689	53.014	7.950	0.097	0.000	0.000	2.856	my8033_rel_lto.cy10a_1g_bee
Delete response time histogram
256us	1ms	4ms	16ms	64ms	256ms	1s	4s	16s	gt	max	tag
0.000	0.000	54.956	36.006	9.039	0.000	0.000	0.000	0.000	0.000	0.053	my5651_rel.cy10a_1g_bee
0.000	0.000	80.275	16.475	3.153	0.097	0.000	0.000	0.000	0.000	0.115	my5740_rel_lto.cy10a_1g_bee
0.000	0.000	5.442	18.081	17.069	52.228	7.072	0.108	0.000	0.000	3.072	my8033_rel_lto.cy10a_1g_bee
q1000.1
- q1000.1: range queries with 1000 insert/s per client
- Legend for results is here.
- Each entry lists the percentage of responses that fit in that bucket (slower than max time for previous bucket, faster than min time for next bucket).
Query response time histogram
256us	1ms	4ms	16ms	64ms	256ms	1s	4s	16s	gt	max	tag
31.162	65.610	0.404	2.761	0.058	0.005	0.000	0.000	0.000	0.000	0.249	my5651_rel.cy10a_1g_bee
15.736	81.280	0.207	2.620	0.138	0.019	0.000	0.000	0.000	0.000	0.226	my5740_rel_lto.cy10a_1g_bee
0.003	20.046	7.788	13.028	29.171	24.712	5.181	0.071	0.000	0.000	3.719	my8033_rel_lto.cy10a_1g_bee
Insert response time histogram
256us	1ms	4ms	16ms	64ms	256ms	1s	4s	16s	gt	max	tag
0.000	0.000	19.529	66.161	13.858	0.425	0.026	0.000	0.000	0.000	0.403	my5651_rel.cy10a_1g_bee
0.000	0.000	36.514	55.122	7.300	1.038	0.026	0.000	0.000	0.000	0.496	my5740_rel_lto.cy10a_1g_bee
0.000	0.000	0.031	21.950	15.515	53.490	8.922	0.092	0.000	0.000	3.483	my8033_rel_lto.cy10a_1g_bee
Delete response time histogram
256us	1ms	4ms	16ms	64ms	256ms	1s	4s	16s	gt	max	tag
0.000	0.000	59.237	31.407	9.238	0.118	0.000	0.000	0.000	0.000	0.186	my5651_rel.cy10a_1g_bee
0.000	0.000	70.511	23.989	5.385	0.115	0.000	0.000	0.000	0.000	0.172	my5740_rel_lto.cy10a_1g_bee
0.000	0.000	2.165	22.851	16.139	51.244	7.494	0.106	0.000	0.000	3.452	my8033_rel_lto.cy10a_1g_bee